




Abstract
Introduction:
The rise of digital health applications utilizing continuous glucose monitoring (CGM) allows for novel assessments of glucose management and weight changes in people without diabetes. The Signos System incorporates a digital health app paired with a CGM to provide information and prompts aimed to help people without diabetes to manage weight.
Objectives:
The primary objective of this study was to determine whether the average timing of the latest chronological glucose excursion (“spike”) was correlated with amount of weight loss.
Methods:
This was a retrospective analysis of prospectively obtained glucose and weight data from people without diabetes who enrolled in the Signos System from November 2021 to August 2023. Participants were provided CGMs as well as encouraged to use the Signos app with personalized advice and logging capabilities for weight, food, physical activity, heart rate, sleep, and activities. “Latest spike time” (LST) was retrospectively derived from CGM data and compared with weight changes at 6 months.
Results:
Nine hundred and twenty-six subjects met the inclusion criteria including sufficient days wearing a CGM and a weight log within 15 days of 6 months from their first weight log. There was a strong correlation between an earlier spike time and increased weight loss. The top quintile of subjects, with an average LST before 5:41 PM, lost over three times as much weight as the bottom quintile of users, with LST after 8:40 PM; this separation was predictable within 1 month of data.
Conclusion:
In a large population of obese people without diabetes, continuous glucose data, specifically a novel metric “LST,” was highly correlated with percentage of total body weight loss at 6 months. This research suggests that for people attempting weight loss, review and alteration of behaviors relating to later glucose excursions may be of specific benefit.
Background
Signos is a comprehensive metabolic health platform that includes a digital health app combined with a Dexcom continuous glucose monitor to provide real-time data and recommendations for healthy weight management. Obesity is increasingly recognized as a unique disease process that is correlated with multiple downstream negative health outcomes including increased all-cause mortality, type 2 diabetes mellitus (T2D), cardiovascular disease, stroke, and cancer. 1 The obesity epidemic is rapidly growing in the United States, with over 70% of adults with a body mass index (BMI) in the overweight range greater than 25 kg/m2. 2 Prior studies have indicated that weight loss of 5%–10% can delay or prevent onset of T2D. 3 Despite the well-acknowledged benefits of clinically relevant weight loss, the probability that an individual is treated for obesity or loses clinically significant weight in a given year is low, and thus new interventions for weight management are urgently needed. 4
The increasing use of continuous glucose monitors (CGMs) in lieu of fingerstick monitoring allows for increased visibility, and thus intervention, into glucose trends and personal responses to food consumption, physical activity, and other factors that contribute to improved health in people with diabetes. 5 Further, the utility of CGMs, especially when paired with a digital app containing coaching and education, may not be limited to individuals who have been diagnosed with diabetes. 6 A pilot study using CGMs paired with low-carbohydrate diet coaching in a population of people with prediabetes helped participants lose a statistically significant amount of weight over a short period of time, with improved glucose metrics. 7 Fluctuations of glucose throughout the day are normal to a certain degree, but glucose spikes and dips influence eating behavior, satiety, and energy consumption. 8 In a nondiabetic population, high glucose elevations and lower subsequent glucose drops following breakfast were predictive of eating earlier in the day and eating more calories at that subsequent meal. 9 Increased attention to metabolic health and individual circadian rhythm has led to recognition that meal timing plays a crucial role in human physiology, with implications for hormonal regulation of cortisol, ghrelin, leptin, and melatonin, among others. 10 Circadian misalignment and wrong-time eating, in combination with insufficient sleep, generally leads to poor metabolic function across a variety of human and animal studies, often exacerbated by poor meal composition. 11 One strategy to combat circadian misalignment, known as time-restricted eating (TRE), recommends food consumption earlier in the day and leads to overall decreased glucose levels, potentially because eating before sleep may be associated with foods higher in carbohydrate or sugar content. 12 What is less understood is how CGM data can be used to predict and subsequently intervene on behaviors that may be placing people with obesity with or without prediabetes at higher risk for the development of diabetes, and how real-time glucose data can be used at scale to provide actionable insights for self-management of burgeoning metabolic disease individually and at scale.
Methods and Study Design
Signos enrolled subjects without diabetes in an open-label, single cohort prospective study to evaluate a mobile technology-based behavioral intervention for weight management. Signos utilizes a mobile health app in conjunction with a prescription CGM (Dexcom; San Diego, CA) to encourage healthy behaviors. Signos provides personalized recommendations based on CGM and other data for precision dietary adjustments and efficient increases in physical activity. These recommendations include alterations in meal composition, timing, hydration, and timely physical activity recommendations based on glucose trends (https://support.signos.com/hc/en-us/articles/14987731183892-How-Does-Signos-Work). The study was approved by WCG IRB (protocol no. 20212524). Prospective subjects voluntarily signed up for the Signos app and, after further medical screening, were prescribed a CGM. Inclusion criteria included age greater than 18, ability to speak and read English, and prior ownership of a smartphone. Exclusion criteria included a diagnosis of type 1 diabetes mellitus or T2D, diagnosis of an eating disorder, medical conditions requiring a specific diet (such as phenylketonuria), and vulnerable populations such as minors, prisoners, or pregnant women. Subjects were enrolled for a minimum of 1 month but were not required to participate for a certain length of time and were able to leave the study at any time. If a participant was found to have consistently elevated levels consistent with possible diagnosis of T2D, they were notified and excluded from further participation and analysis. Data collection was managed virtually, utilizing CGM data and logging within the app including metrics such as heart rate (available if participant wore a smartwatch), user-input food logs and tags, and weight, exercise, sleep, and hydration via user-input or automatically logged from connected device (such as a smart scale).
For this study, we have retrospectively analyzed a specific sample of our population, comparing a novel CGM metric “latest spike time” (LST) with weight change over 6 months. Inclusion for this study required subjects to have obesity with BMI ≥ 30 kg/m2 on enrollment, at least 30 days of sensor readings over a 6-month period, and a weight log on day 0 as well as within 15 days ± of 6 months from the date of their first weight log. The period from November 2021 to August 2023 was included.
Although weight logs are self-reported by the participants, we implement an automatic data validation process to exclude weight log anomalies such as manual entry errors (e.g., adding/omitting an extra digit), multiple people using the same smart scale (resulting in incoherent “seesaw” patterns), as well as disqualifying clearly anomalous weight streams, for example, a certain health app generating the same constant weight value every day for months.
CGM spike identification algorithm
To determine when the latest CGM-derived glucose excursion started during the day, we developed a novel aggregate CGM metric called LST. LST relies on the CGM Spike Identification Algorithm (SIA), which was developed by Signos. SIA was developed to closely reflect the users’ perception of what constitutes a meaningful spike. The average subject in this cohort had 2.41 qualifying spikes per 24 h while wearing a CGM. SIA implements the below steps.
From the subject’s CGM sensor data, we derived the subject’s CGM noise (measured in mg/dL), which reflects the level of CGM variability. CGM noise is calculated as the standard deviation of the CGM signal (standard 5-minute intervals) after second order differencing. Second-order differencing (de-trending) was found empirically to be the optimal order to maximize the stationarity of the signal. CGM noise is typically within 2.8–4.8 mg/dL, depending on the subject.
We identified CGM spikes such that both left and right bases of the CGM excursion are local minima of the CGM signal. We selected only those excursions whose heights (i.e., the maximum level between the bases) are at least eight times the CGM noise, where the spike's height is the peak BG level minus the BG level at the start of the spike. A multiple of eight ensures that false positives are excluded, so that simple natural variability in interstitial glucose does not produce a recorded spike.
From all spikes identified at the previous step, we removed all spikes that peak below the level of one-day moving average plus one-day standard deviation. This ensures that CGM shapes such as rebounds from low levels (e.g., <70 mg/dL returning to 110 mg/dL) are not included as a positive excursion above the baseline of the day. Figure 1 illustrates the spikes identified by the SIA within the 24 h of CGM data by one of the participants.
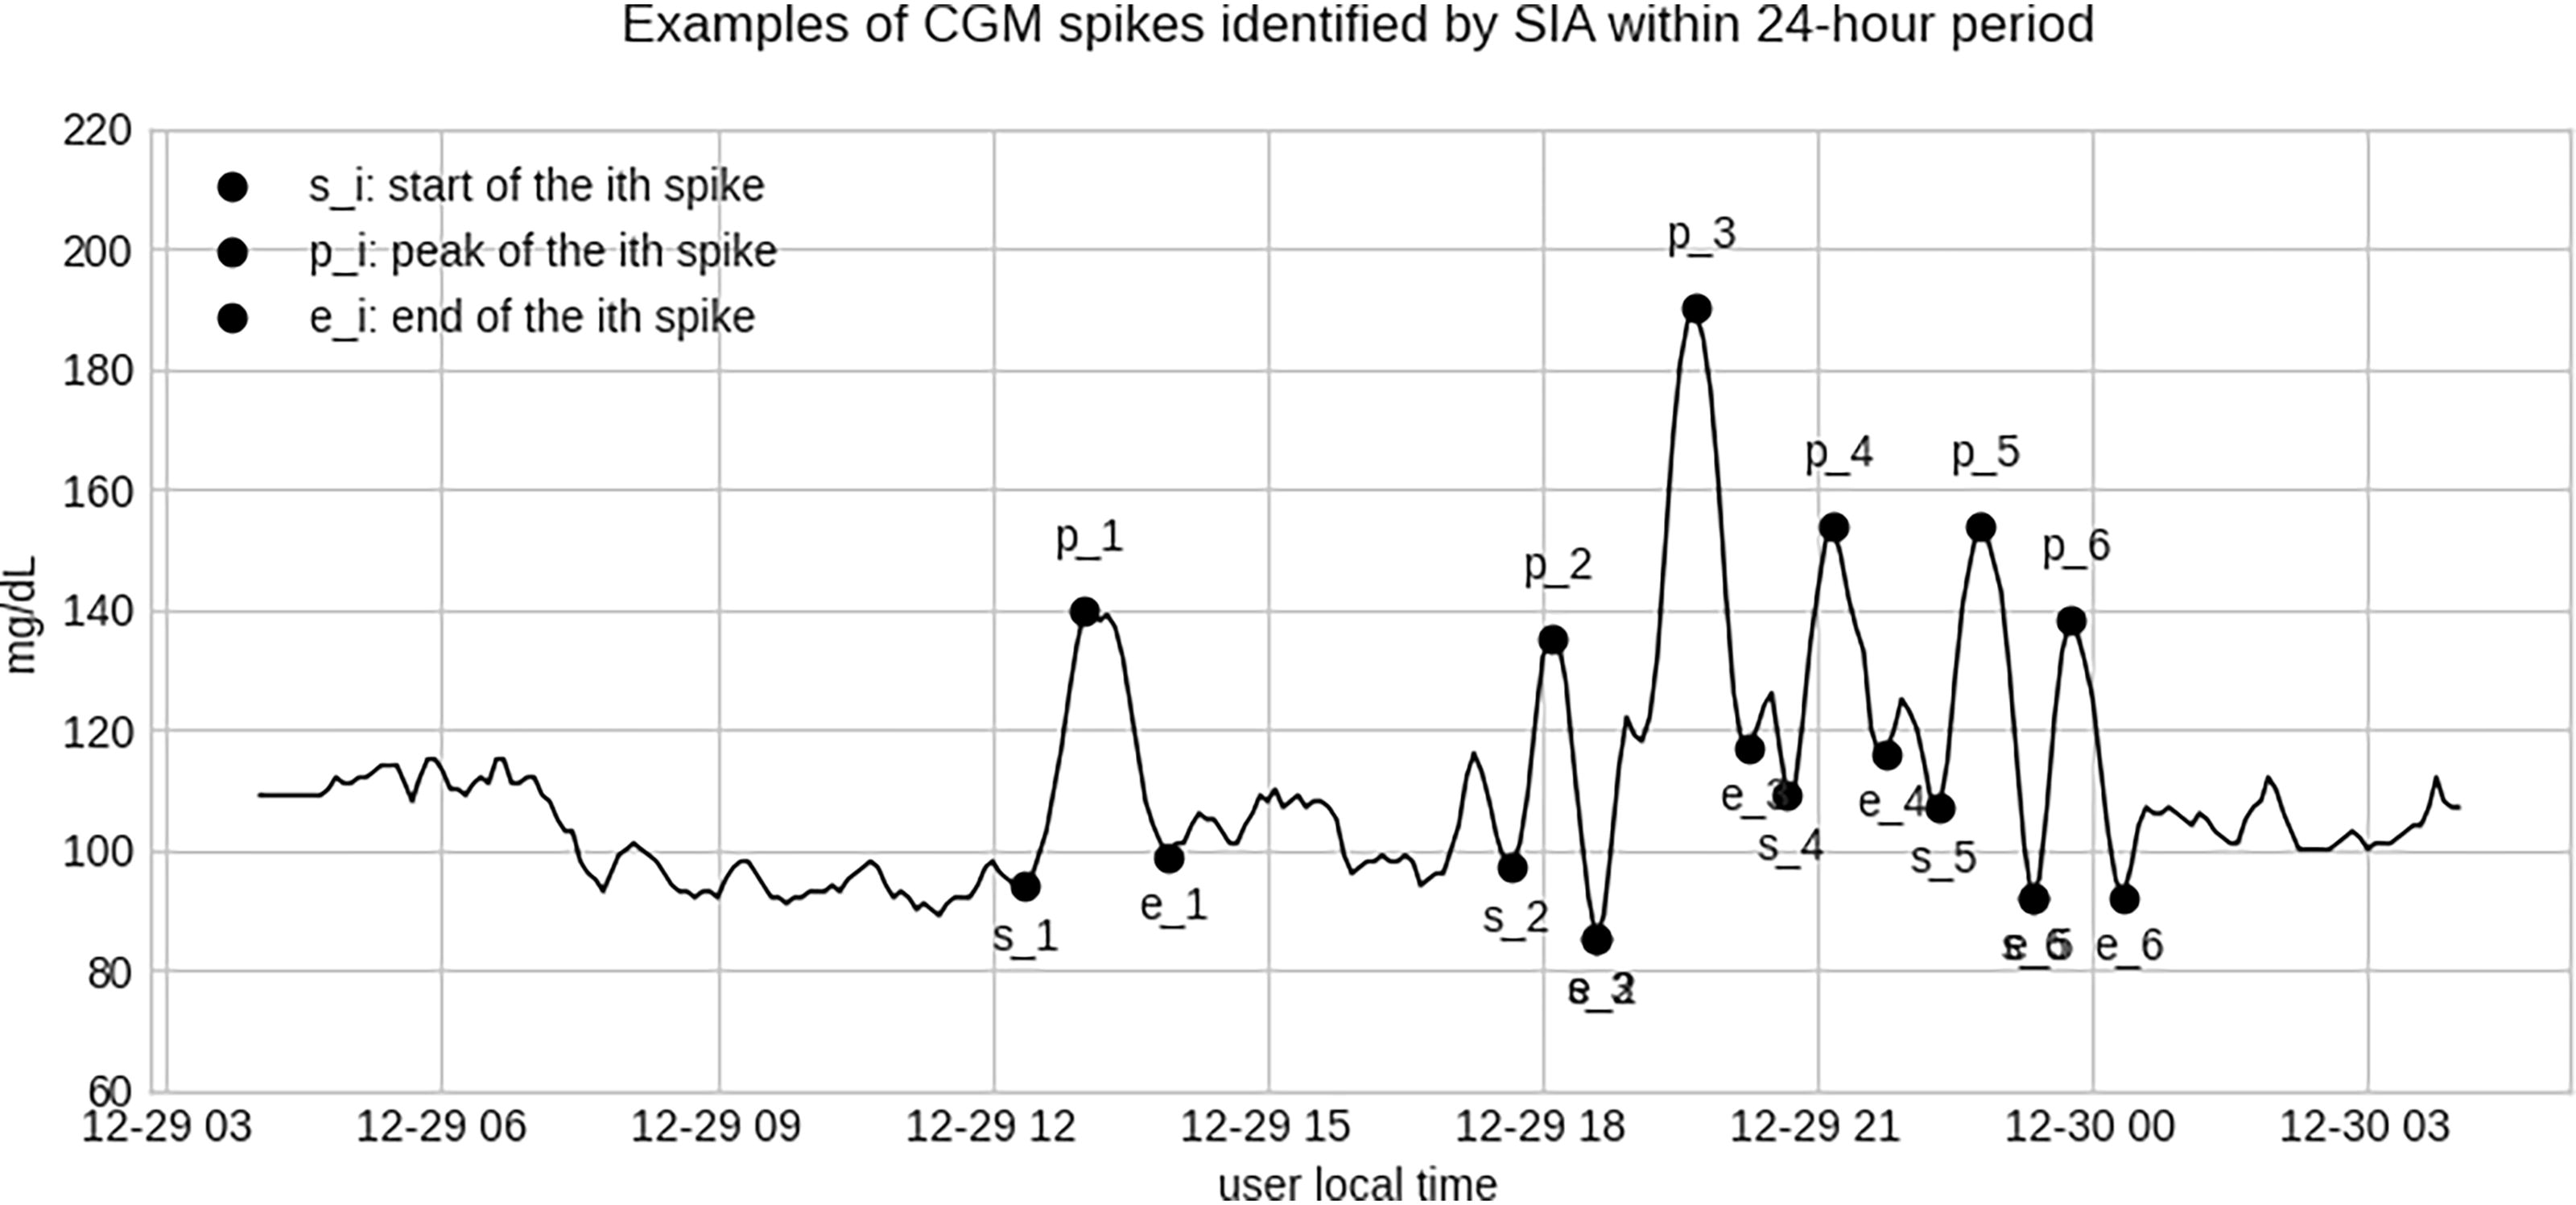
Example of CGM spikes identified by SIA within 24-h CGM data by one of the participants. CGM, continuous glucose monitoring. SIA, Spike Identification Algorithm.
SIA has been developed on a clean, maintained corpus of millions of days of CGM data generated by tens of thousands of Signos users. SIA is implemented in the Signos app and has been refined by the user feedback. We compared SIA to other methods of identifying and measuring glycemic excursions that have been applied in previous research, to the extent direct comparisons are possible. In 1970, a seminal paper by Service et al. proposed a new metric for diabetic instability based on the mean amplitude of glycemic excursions (MAGE). 13 As reported by Fernandes et al. (2022), the authors manually assigned the ground truth MAGE labels to a collection of 45 days of CGM data obtained from 16 subjects. 14 MAGE identifies simple swings, including standalone peak-to-nadir downswings, and serves as a proxy of glycemic variability. In contrast, SIA identifies interpretable CGM spikes that typically have both an upswing and a downswing, which in turn allows building metrics such as LST, spike frequency per day, or average area under the curve, among others. In addition to SIA-enabled CGM metrics, Signos also calculates and displays a number of more simple aggregate metrics such as the coefficient of variation, time in range, or average glucose.
We also compared the spikes identified by SIA to meal logs supplied by the participants. Although SIA does not directly rely on meal logs because they are optional and often incomplete, the existing meal logs made by the participants are generally in agreement with SIA-identified spike starts. For the meals logged within 90 min before the SIA spike starts, the average distance between the meal log and the spike start was 24 min, and the median distance was 15 min.
Latest spike time
Having identified the excursions with SIA, LST can be calculated for the whole or part of the subject’s CGM data. First, the entire CGM data stream generated by the user was divided into daily 24 h-long consecutive periods from 4 AM to 4 AM local time. The local time of 4 AM was selected as the start of the day, as the global minimum of spike start times in participants’ local time (Fig. 2). Within each 24-h period, we identified the CGM spike that is the latest during that day. We then extracted the latest spike start’s local hour value (for example, at t = 19 if the user’s latest spike started at 7:00 PM of that day). LST is calculated as the simple mean of all available daily LST local hours for the user during the 180-day period. To accommodate days when SIA has not identified any spikes, we subtracted from LST a value equal to 7 × share of zero-spike days out of total days with CGM. As an example of a calculation, if an individual had a preliminary LST of 19.5 (7:30 PM), and 2 of their 28 days were zero-spike days, their LST became 19.5 − (7 × [2/28]) = 19.0 (7:00 PM). This adjustment is made to factor in zero-spike days by reducing the LST relative to the number of zero-spike days. The overall mean LST for all participants was 7:10 PM, and the overall median was 7:20 PM (Fig. 3).
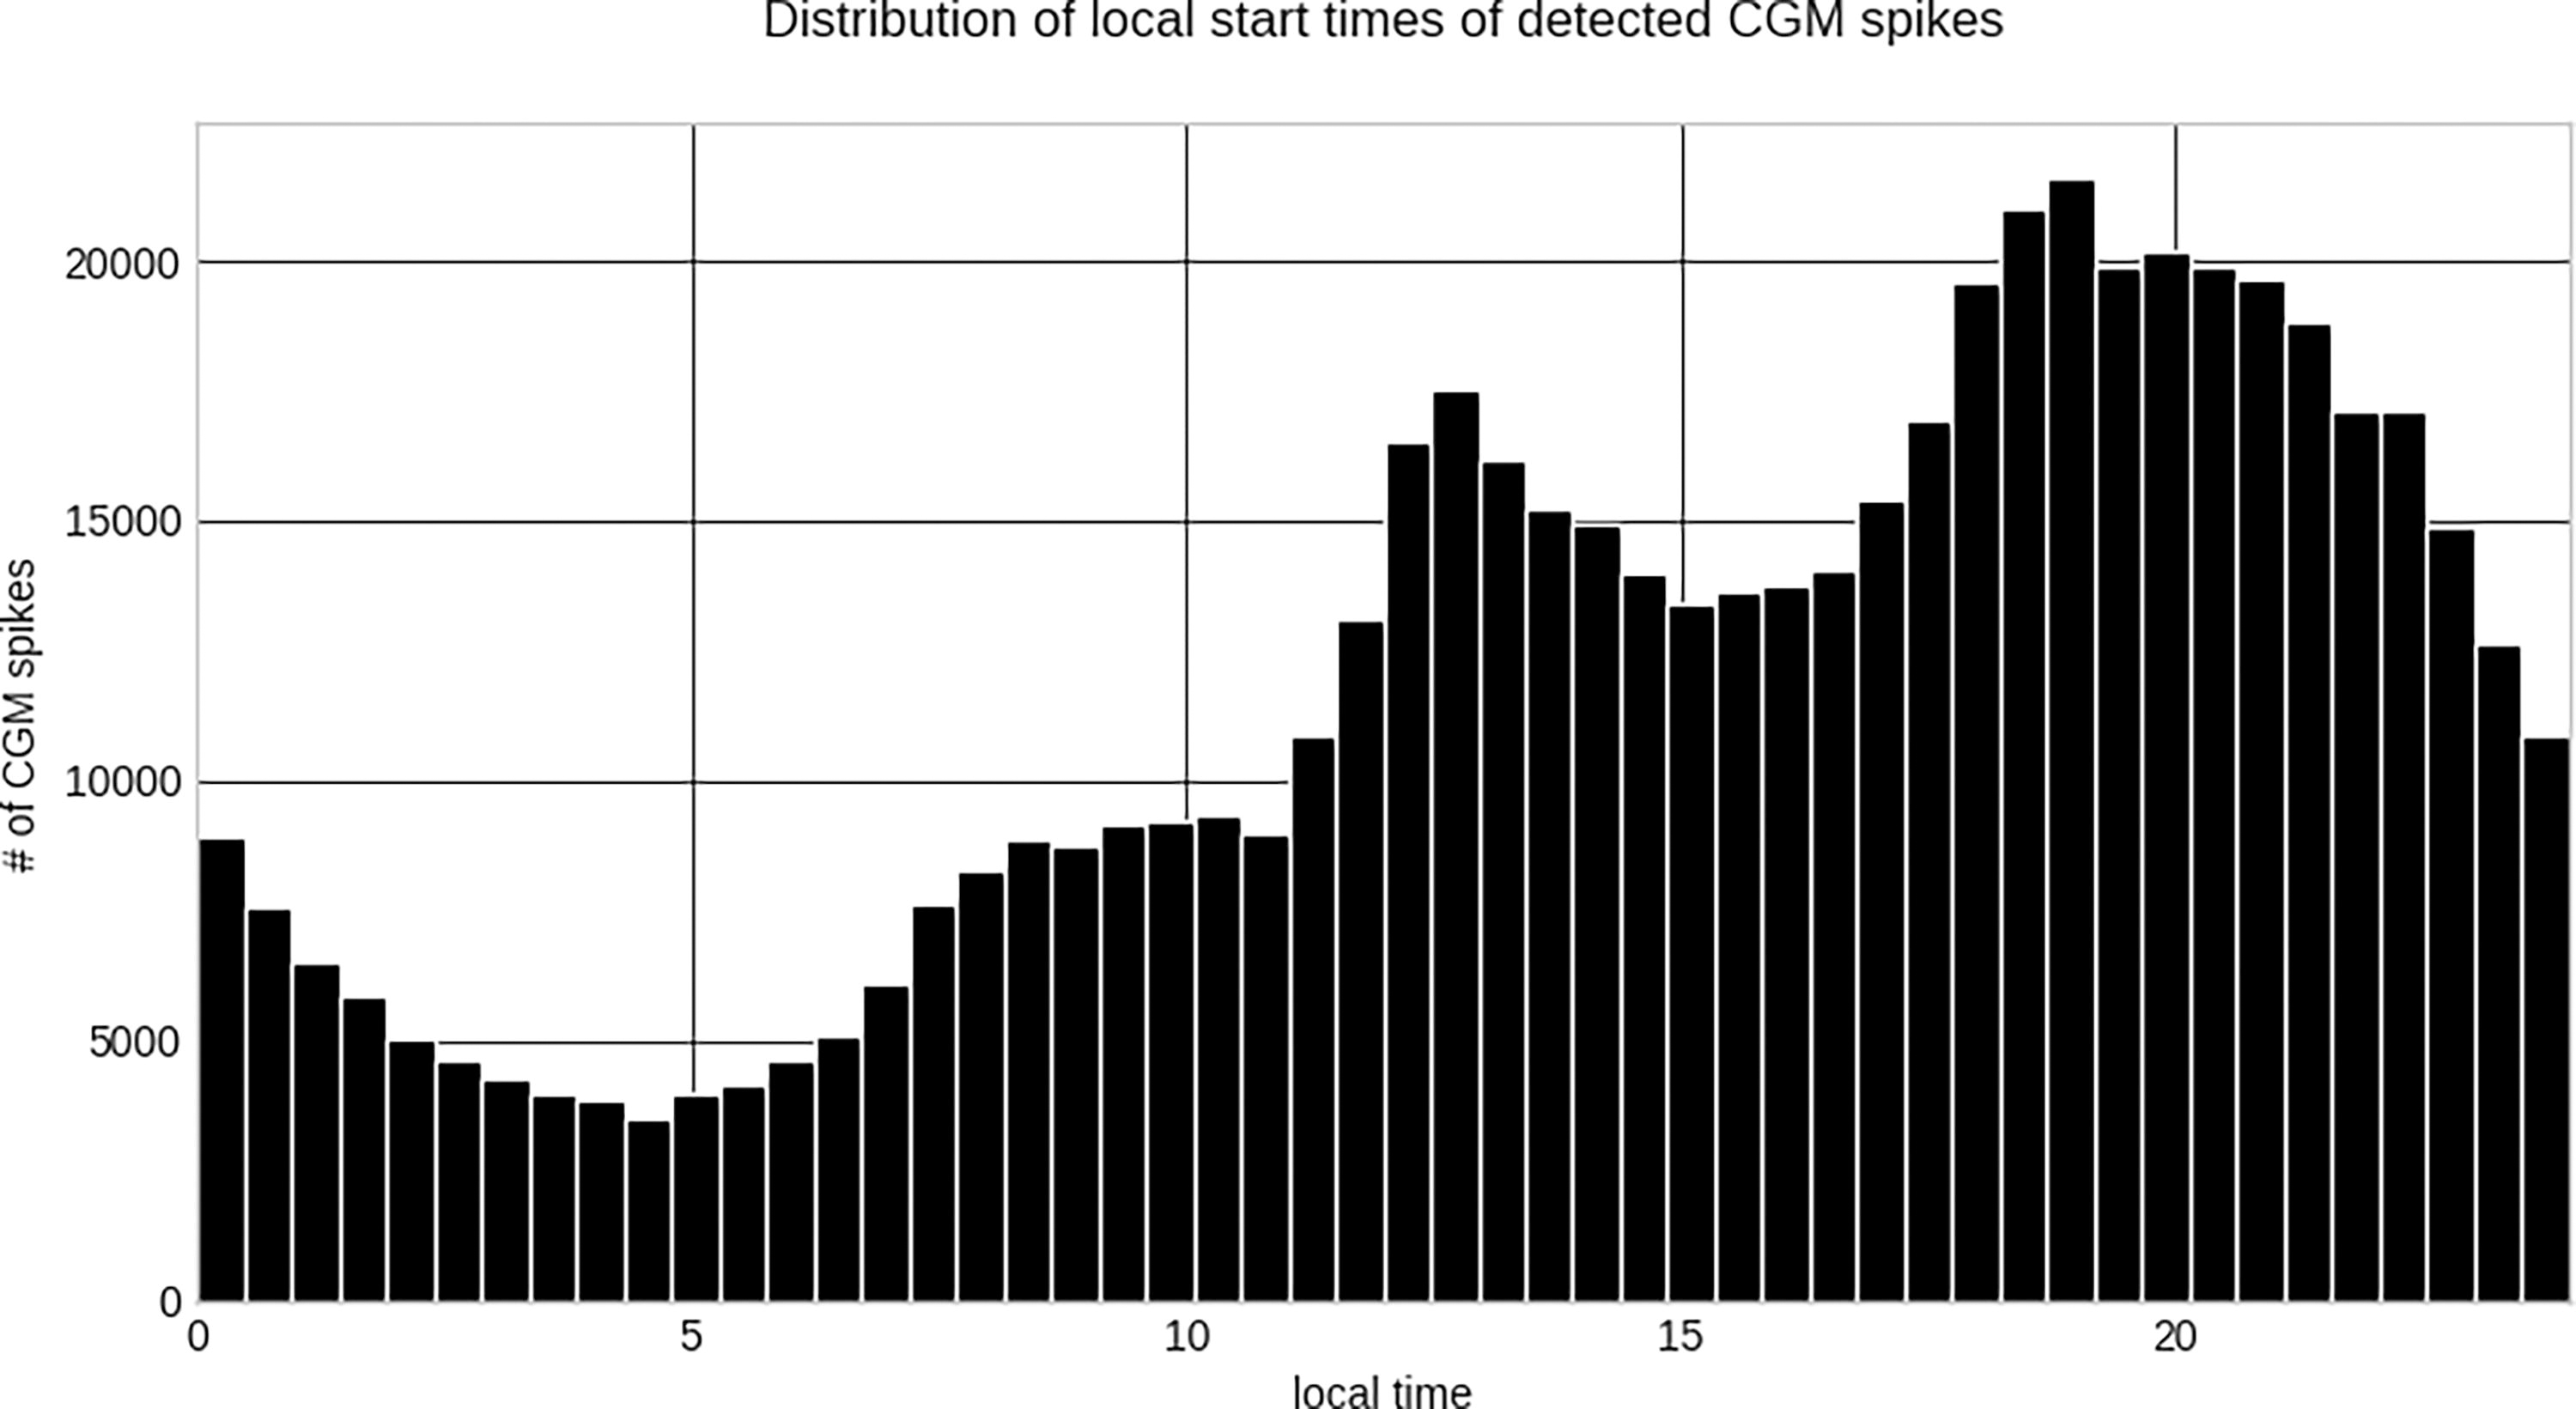
Distribution of local start times of detected CGM spikes. CGM, continuous glucose monitoring.
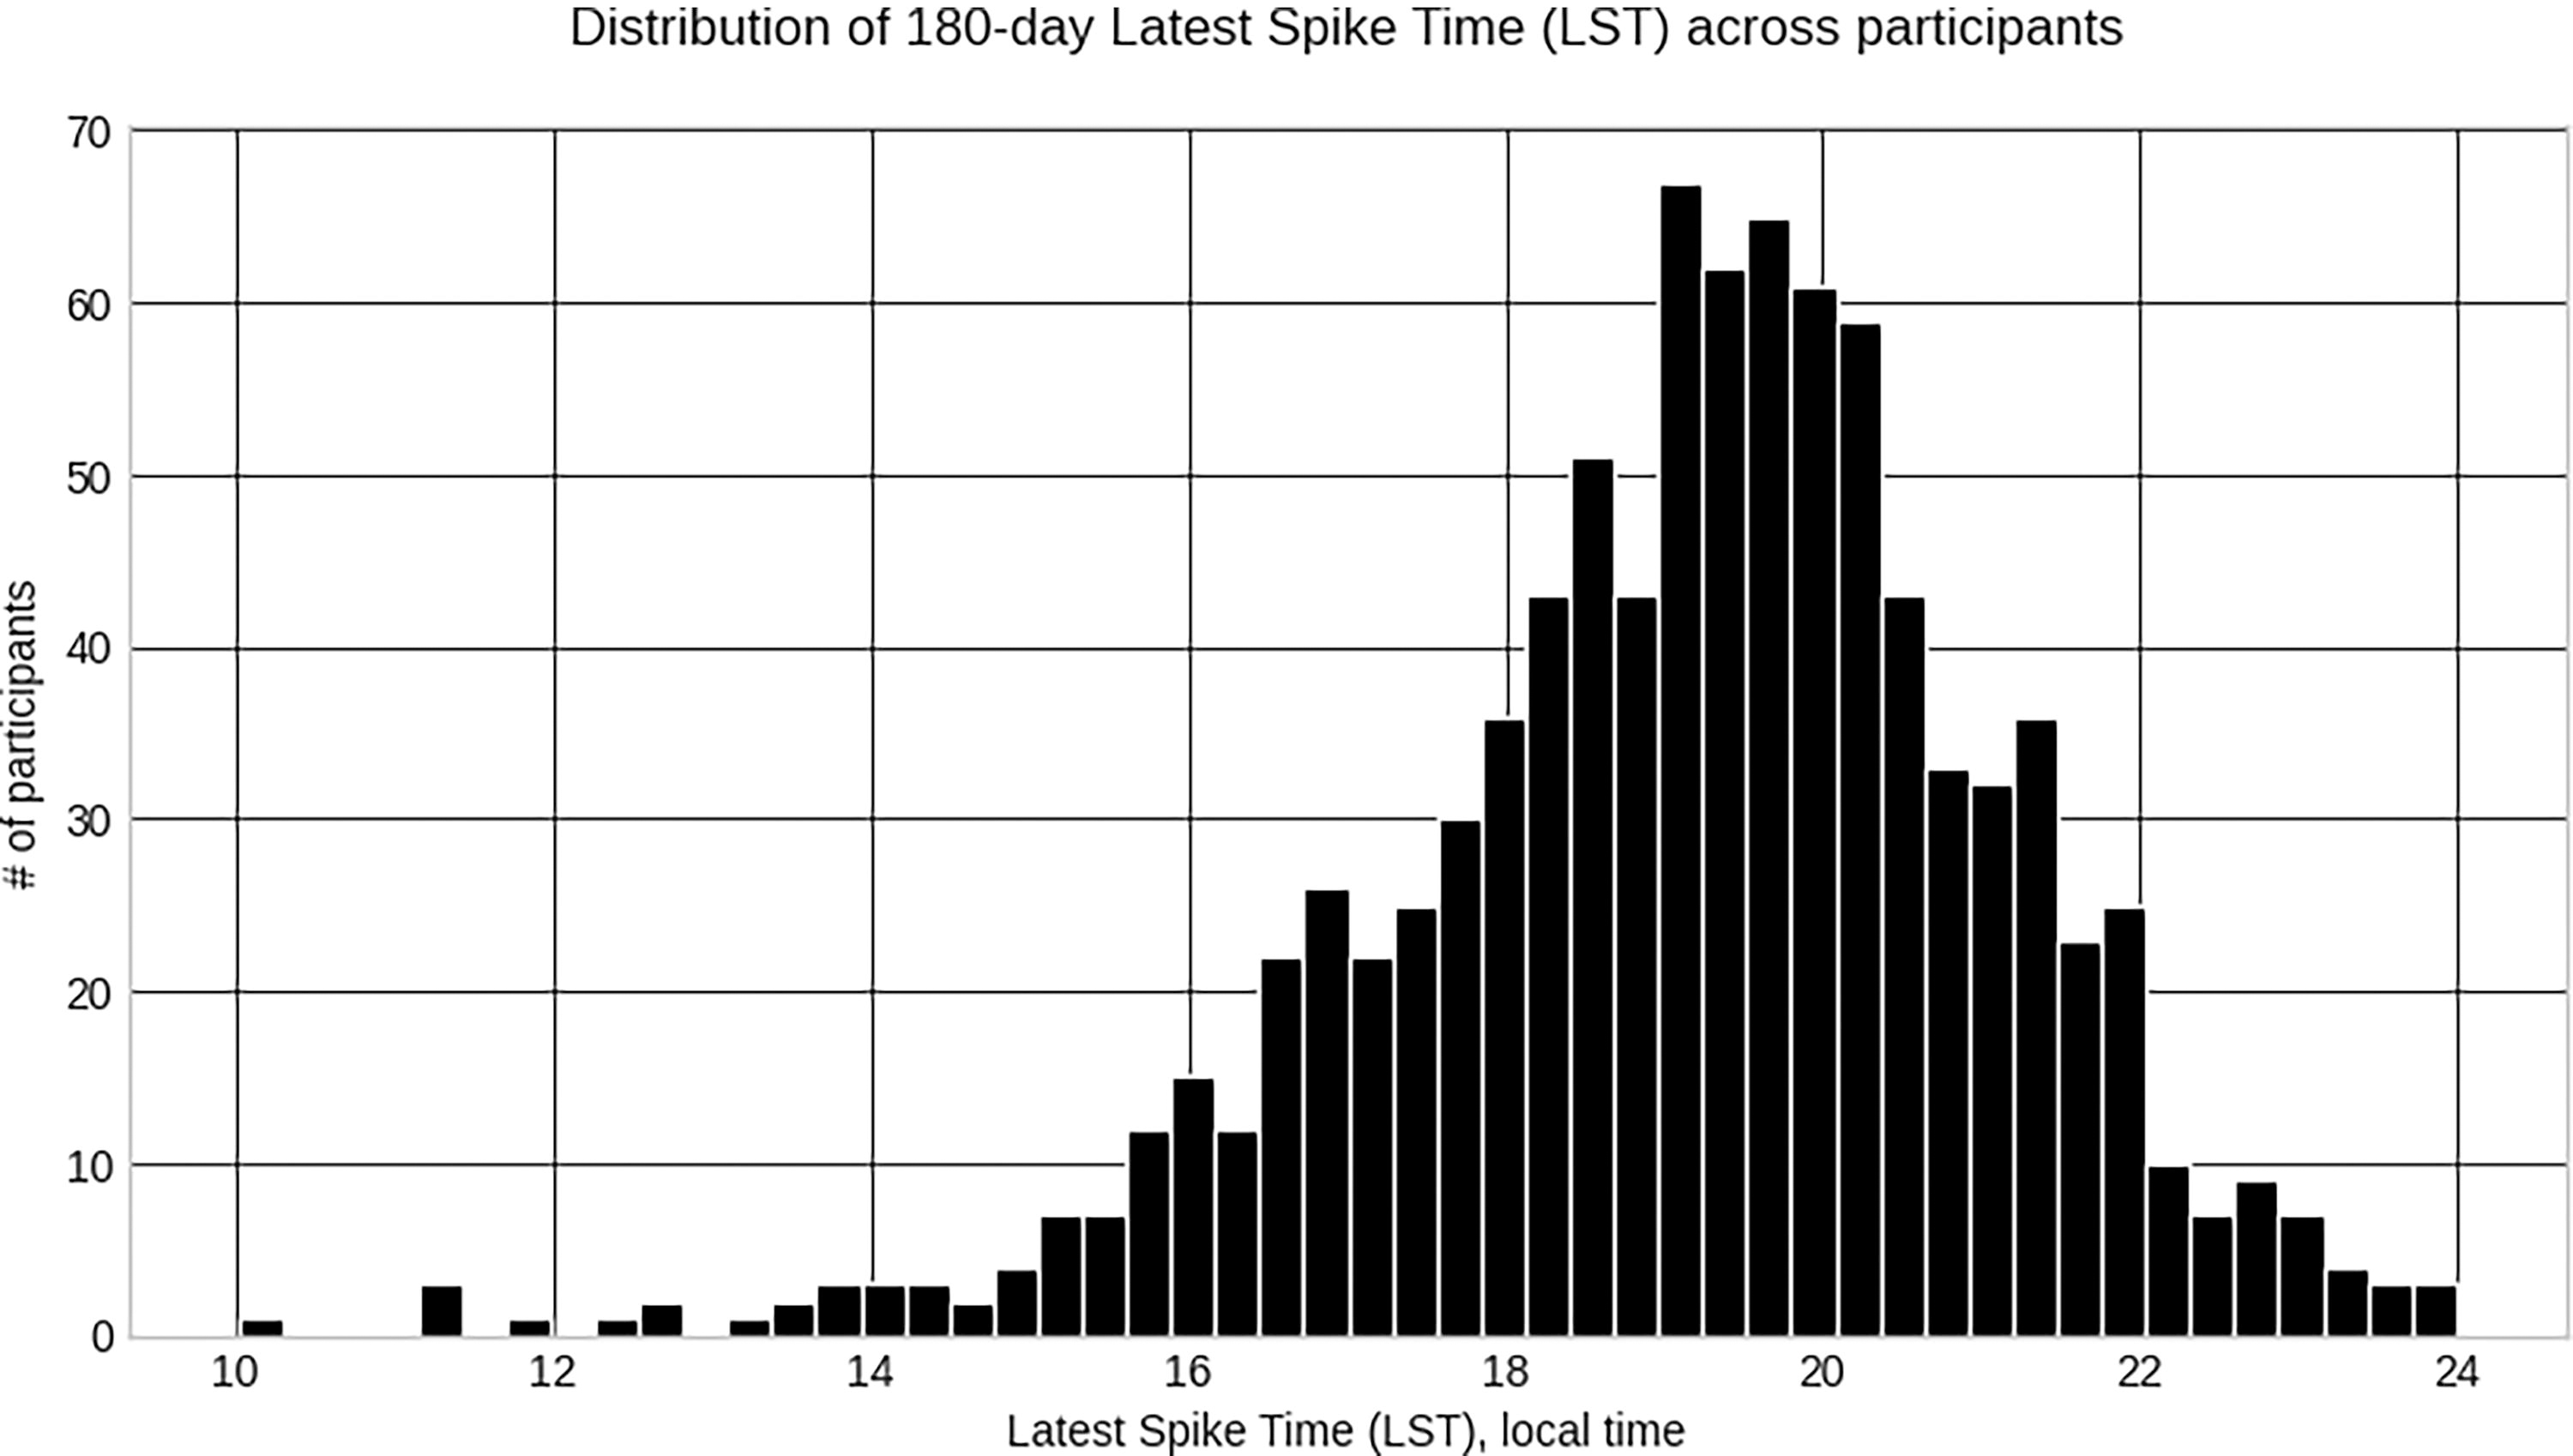
Distribution of 180-day LST across participants. LST, latest spike time.
Findings
Participant characteristics
To evaluate whether the timing of the last glucose excursion of the day was correlated to change in weight, cohort data were retrospectively analyzed. Qualifying data were selected based on subject characteristics of a baseline BMI greater or equal to 30 kg/m2, total days wearing a CGM during their first 180 days on the platform greater or equal to 30 days, and a weight log present on enrollment as well as at 180 days ±15 days period to derive 180-day total body weight loss percentage (TBWL%). We analyzed a total n of 926 subjects; 613 were female and 313 were male. In total, 500 had a BMI of 30–34.9, 243 had a BMI of 35–39.9, and 183 had a BMI > 40 kg/m2 (Table 1).
Participant Breakdown
BMI, body mass index; LST, latest spike time; TBWL, total body weight loss.
The TBWL% was then compared across quintiles, anchoring on the lowest TBWL% quintile, to calculate a Relative-TBWL% (RTBWL%) to understand the difference in weight loss across the groups. The relationship between LST and RTBWL% was analyzed using an ordinary least squares regression followed by subgroup analysis based on BMI, gender, age, and type of smartphone.
LST and weight loss
For each qualifying participant, we analyzed two measures during participants’ first 180 days on the Signos platform: 180-day TBWL% (self-reported user data) and LST calculated as described. Weight loss was significantly correlated with LST. The earlier the LST, the larger the 180-day TBWL%. The relationship between LST and TBWL% is strong and can be modeled by a simple ordinary least squares (OSL) regression, resulting in regression coefficient of −1.14 with P < 0.001 (Fig. 4). The 95% confidence interval for the regression coefficient is [−1.32, −0.96]. The observed regression coefficient indicates that on average, a 1-h decrease in LST (average LST over 180 days is one hour earlier) is equivalent to extra 180-day TBWL% of 1.14%. For the mean LST of 7:10 PM, the predicted 180-day TBWL is 5.1% with the 95% prediction interval of [−5.7%, 15.8%]. An individual’s weight change over 6 months is influenced by multiple factors (glucose-related factors being only one contributor), and it does not come as a surprise that LST alone is not sufficient to accurately predict an individual’s 180-day TBWL%.
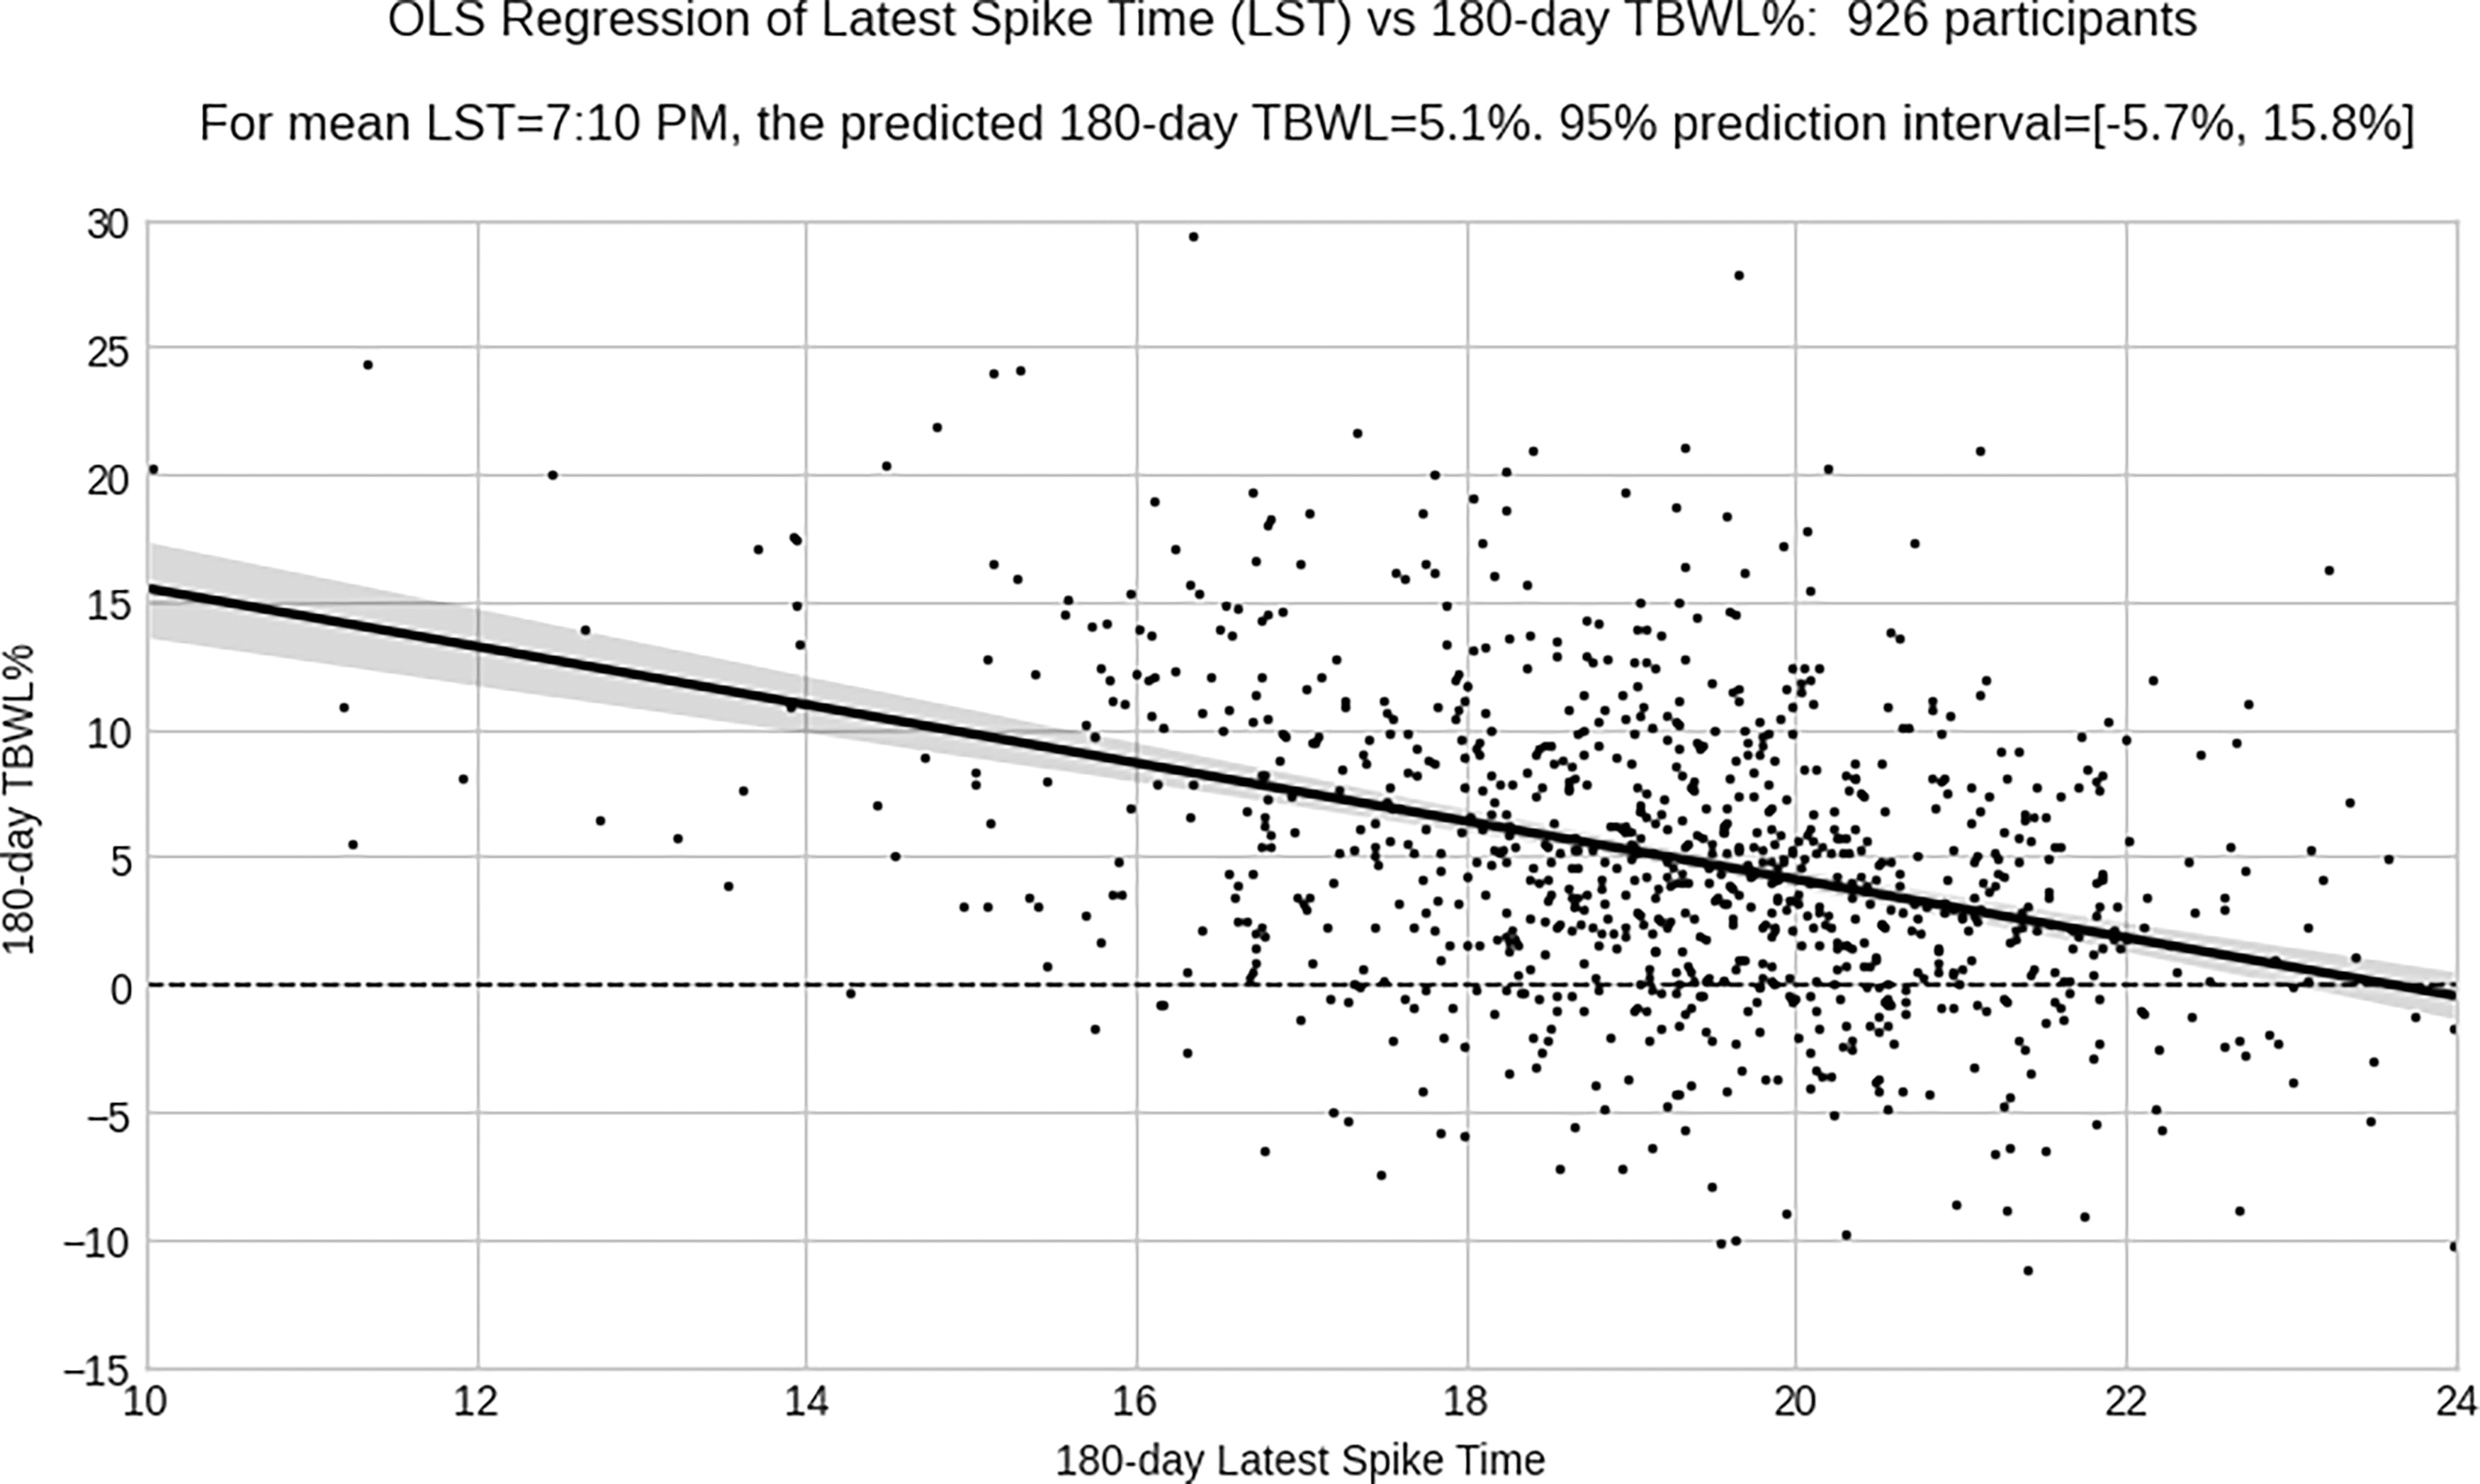
Ordinary least squares regression of LST versus 180-day TBWL%. LST, latest spike time; TBWL%, total body weight loss percent.
LST quintile analysis
Latest Spike Time Quintiles
LST, latest spike time; TBWL, total body weight loss; RTBWL, relative total body weight loss.
Interestingly, the separation in weight loss performance between earlier and later-spiking quintile starts almost immediately after onboarding and progresses throughout the 6-month period (Fig. 5). This indicates that, in this population, the LST may not be simply a metric of improved glucose control via fat loss but also be a predictor of subsequent weight loss based on the behaviors driving LST. Quintile E had TBWL% of only 2.57%, with the LST window of 8:42 PM or later.

Relative TBWL% progress for LST quintile cohorts, relative to cohort E. LST, latest spike time; TBWL, total body weight loss.
We performed a subgroup analysis to explore potential confounding factors. The statistical relationship between LST-TBWL% exists in all major subgroups (Table 3). Interestingly, the correlation between LST and TBWL is stronger for the high BMI groups. The 60 and older group has a relatively earlier mean LST, which may reflect earlier bedtime in this at-risk group.
The Statistical Relationship between LST and TBWL% in Major Sub-Groups
LST, latest spike time; OLS, orinary least squares; TBWL, total body weight loss.
Discussion
Finding strategies for effective, healthy weight management is crucial to combat the growing obesity epidemic. Free-living studies are important as they provide insight into how people can be approached for effective behavioral modification. However, there are limitations associated with free-living, cohort studies. To exclude subjects who did not meaningfully participate in the Signos System or have enough CGM data for analysis, we focused our data collection on subjects who generated at least 30 days of CGM data over 6 months, which is still a relatively low number of days, but essentially excludes people who enrolled in Signos but used it for less than 1 month of days during the trial period studied. As this was a virtual trial, nonCGM data, including weight, were self-reported or collected via connected devices, which may lead to inaccuracies, although the study eliminated clearly spurious data. Nevertheless, virtual trials are increasingly used to gather large amounts of data. In addition, meal composition and total daily calorie intake were not available with consistency at scale over the 6-month period for this group; however, no specific diet or calorie limitation was prescribed or suggested to subjects; thus, the main intervention was use of the Signos System. CGMs used in our study are applied at home and do not require calibration, though minor inaccuracies in glucose data are possible. New medications were not recorded over the course of the 6 months, but in a population without diabetes, glucose-lowering medication use is expected to be low. Of the patient population, 3.1% of the population voluntarily indicated at least once that they were on a GLP-1 medication at the beginning or during their time in the study. This patient population was statistically similar to the rest of the patient population with respect to weight loss and LST. Further research is warranted to investigate the impact of medications such as GLP-1 agonists on LST.
An analysis of a novel glucose metric, the LST, in a cohort of subjects without diabetes, compared with total body weight loss, was performed to understand how timing of glucose excursions may affect weight change. Results showed that glucose data regarding average timing of the LST is highly correlated to total body weight lost during a 6-month period, with a later LST correlated to less weight lost. These results suggest that adapting dietary behavior such that one avoids chronologically late glucose excursions results in increased weight loss over a 6-month period in a free-living group who enrolled in the Signos System. The association between specific eating habits, continuous glucose profiles, and weight loss in a population without diagnosed diabetes is still being elucidated. 15 These results suggest that awareness of continuous glucose data such that late glucose excursions are avoided significantly aid weight loss. Behaviors that have been shown to impact glucose excursions (in the absence of prescription medication) include meal timing, meal composition, sleep, post prandial physical activity, resistance training, and adequate hydration throughout the day, among others. Poor sleep and late eating are also associated with increased stress, a combination that may decrease efficacy of weight loss efforts, with cortisol and other hormone dysregulation as a modifying factor. 16 Late eating and decreased sleep are often correlated to increased carbohydrate and high glycemic load food consumption; as described, mismatched eating and circadian behaviors may be particularly damaging to a healthy metabolism. 17 One obvious possibility for decreased weight loss and a later LST is the consumption of high-calorie snack foods during evening sedentary periods. Novel to this study is the use of CGM technology at scale and of a sufficient duration to record and quantify effects of these behaviors on glucose data to predict changes in body weight, in a population without diabetes. Interestingly, the effect was still present in the group aged over 60 despite an overall earlier mean LST; research is ongoing to determine relative contributors to effectiveness of digital health apps in this important at-risk age group. 18
Precision nutritional assessment and intervention may be supplemented by an app-based program such as Signos in conjunction with a CGM, to identify potential barriers to fat loss and poor metabolic health and provide actionable behavioral change mechanisms. Digital health apps that require food logging may fail to provide data that can be used by a health provider, as they are highly dependent on user engagement. Prior studies on digital health applications and weight generally show that increases in engagement are correlated with weight loss; however, these apps generally require self-reported data and lack passive data collection, which can lead to reductions in self-monitoring. 19 The addition of a CGM to a digital health app provides a baseline of usable data for both immediate intervention (for example, postprandial exercise to decrease glucose excursions, or cessation of late night eating) as well as holistic retrospective dietary evaluation. While other digital health applications have used CGM to augment personalized recommendations, the quantity of CGM days varies; with the Signos System, a CGM is recommended to be worn throughout participation. 20 The Signos LST represents a singular glucose metric, developed in a population without diabetes, that predicts weight loss and can be tracked easily and thus practically intervened upon in a person wearing a CGM and using an app such as Signos. Future directions include analysis of other glucose metrics and weight loss, analysis of food logs and glucose metrics, specific contribution of different types of engagement in the app (food logs, physical activity, educational activities), sleep, sustainability of weight loss after 6 months, and analysis of this correlation in new populations such as subjects with T2D.
Conclusions
A novel glucose metric derived from a population without diabetes using a commercially available digital health app and CGM, the “LST,” was correlated with weight loss at 6 months. Incorporating review of LST in an evaluation of an individual’s diet may be considered. Future directions include a prospective evaluation of the impact of purposefully modifying LST as well as examination of LST in other populations, including those with diabetes.
Footnotes
Authors’ Contributions
W.D., D.L., D.G., S.F.-M., and J.S.S. are shareholders of Signos. Signos is not affiliated with other institutions that the authors may be associated with themselves. J.S.S. also is a shareholder of Dexcom, and previously a Board member of Dexcom.
Funding Information
Signos was the sponsor and funded this research effort.