




Abstract
Objective:
This study aims to investigate the continuum of glucose control from normoglycemia to dysglycemia (HbA1c ≥ 5.7%/39 mmol/mol) using metrics derived from continuous glucose monitoring (CGM). In addition, we aim to develop a machine learning-based classification model to classify dysglycemia based on observed patterns.
Methods:
Data from five distinct studies, each featuring at least two days of CGM, were pooled. Participants included individuals classified as healthy, with prediabetes, or with type 2 diabetes mellitus (T2DM). Various CGM indices were extracted and compared across groups. The data set was split 70/30 for training and testing two classification models (XGBoost/Logistic Regression) to differentiate between prediabetes or dysglycemia and the healthy group.
Results:
The analysis included 836 participants (healthy: n = 282; prediabetes: n = 133; T2DM: n = 432). Across all CGM indices, a progressive shift was observed from the healthy group to those with diabetes (P < 0.001). Statistically significant differences (P < 0.01) were noted in mean glucose, time below range, time above 140 mg/dl, mobility, multiscale complexity index, and glycemic risk index when transitioning from health to prediabetes. The XGBoost models achieved the highest receiver operating characteristic area under the curve values on the test data set ranging from 0.91 [confidence interval (CI): 0.87–0.95] (prediabetes identification) to 0.97 [CI: 0.95–0.98] (dysglycemia identification).
Conclusion:
Our findings demonstrate a gradual deterioration of glucose homeostasis and increased glycemic variability across the spectrum from normo- to dysglycemia, as evidenced by CGM metrics. The performance of CGM-based indices in classifying healthy individuals and those with prediabetes and diabetes is promising.
Introduction
The intricate interplay between glucose dynamics and metabolic health serves as a foundation in understanding the pathophysiology of prediabetes and type 2 diabetes mellitus (T2DM). 1,2 Glucose homeostasis, traditionally characterized by stability in blood glucose levels within a narrow range, undergoes a gradual transformation as individuals progress along the continuum from normoglycemia to dysglycemia. 3 This transition encompasses a spectrum of alterations in glycemic control, ranging from subtle fluctuations to pronounced variability, ultimately culminating in overt diabetes. 4 –6
Glycemic variability, defined as the oscillations in blood glucose levels over time, emerges as a pivotal determinant in the progression of metabolic dysfunction. 7 In healthy individuals, the dynamic equilibrium between glucose production and utilization maintains glucose concentrations within physiological bounds, ensuring metabolic homeostasis. 7 However, in prediabetes and T2DM, this delicate balance becomes disturbed, leading to aberrant glycemic patterns characterized by erratic fluctuations and prolonged hyperglycemic excursions. 7 –10
Biomarkers such as fasting glucose and glycated hemoglobin (HbA1c) exhibit limited prognostic utility in predicting the progression from prediabetes to diabetes, 11 particularly among elderly individuals. 12 HbA1c, commonly regarded as an indicator of average glucose levels over preceding months, is subject to influence by various intraindividual factors. 13 Studies have demonstrated significant disparities between mean glucose levels and HbA1c measurements. 14
Recent advancements in continuous glucose monitoring (CGM) technology have revolutionized our ability to capture the intricacies of glycemic control and variability in real time or for retrospective analysis. 15,16 By providing a comprehensive profile of glucose dynamics, CGM enables the precise characterization of glycemic patterns across various physiological states. 17 Moreover, the integration of glucose sensors into consumer products such as the Veri CGM or smartwatches heralds a new era in personalized health monitoring, offering unprecedented insights into metabolic health and early detection of disease. 18
Despite the interest in glycemic variability and its implications for metabolic health, the transition in glucose variability from healthy individuals to people with T2DM is still not consolidated. 19 Furthermore, the utilization of these changes in use for prediction and early identification of individuals with abnormal patterns has only been investigated in small scale. 5
Therefore, the aim of this study is to explore the gradual shift in glucose control along the continuum from healthy to disease, as measured by CGM-derived metrics. By delineating the trajectory of glycemic control and variability across different stages of metabolic dysfunction, we seek to unravel early patterns of dysglycemia beyond the prognostic ability of known biomarkers such as HbA1c. In addition, we aim to develop a classification model leveraging machine learning algorithms to classify dysglycemia based on the observed patterns of glucose homeostasis and glycemic variability.
Methods
Data material
To analyze the progressive changes in glucose control and variability, we sourced data from five distinct studies featuring CGM. These studies are outlined as follows: The Adherence through Cloud-based Personalized Treatment for Type 2 Diabetes (ADAPT-T2D), Diabetes teleMonitoring of patients in insulin Therapy (DiaMonT), comprising 331 insulin-treated people with T2DM.
20
Laugesen et al.’s study included 100 newly diagnosed people with T2DM, defined as individuals with diabetes known for less than five years.
21
–23
Colas et al.’s study, which focused on 208 individuals with and without prediabetes, excluding those with prior diagnoses of diabetes mellitus or current antidiabetic drug treatments.
24
Shah et al.’s inclusion of 202 healthy, nondiabetic children and adults.
25
Hall et al.’s inclusion of 57 participants without a previous diabetes diagnosis, monitoring their blood glucose levels via CGM in their habitual environments.
6
An overview of the analytic approach is illustrated in Figure 1. All data from the CGM sensors had a sampling frequency of 5 min.
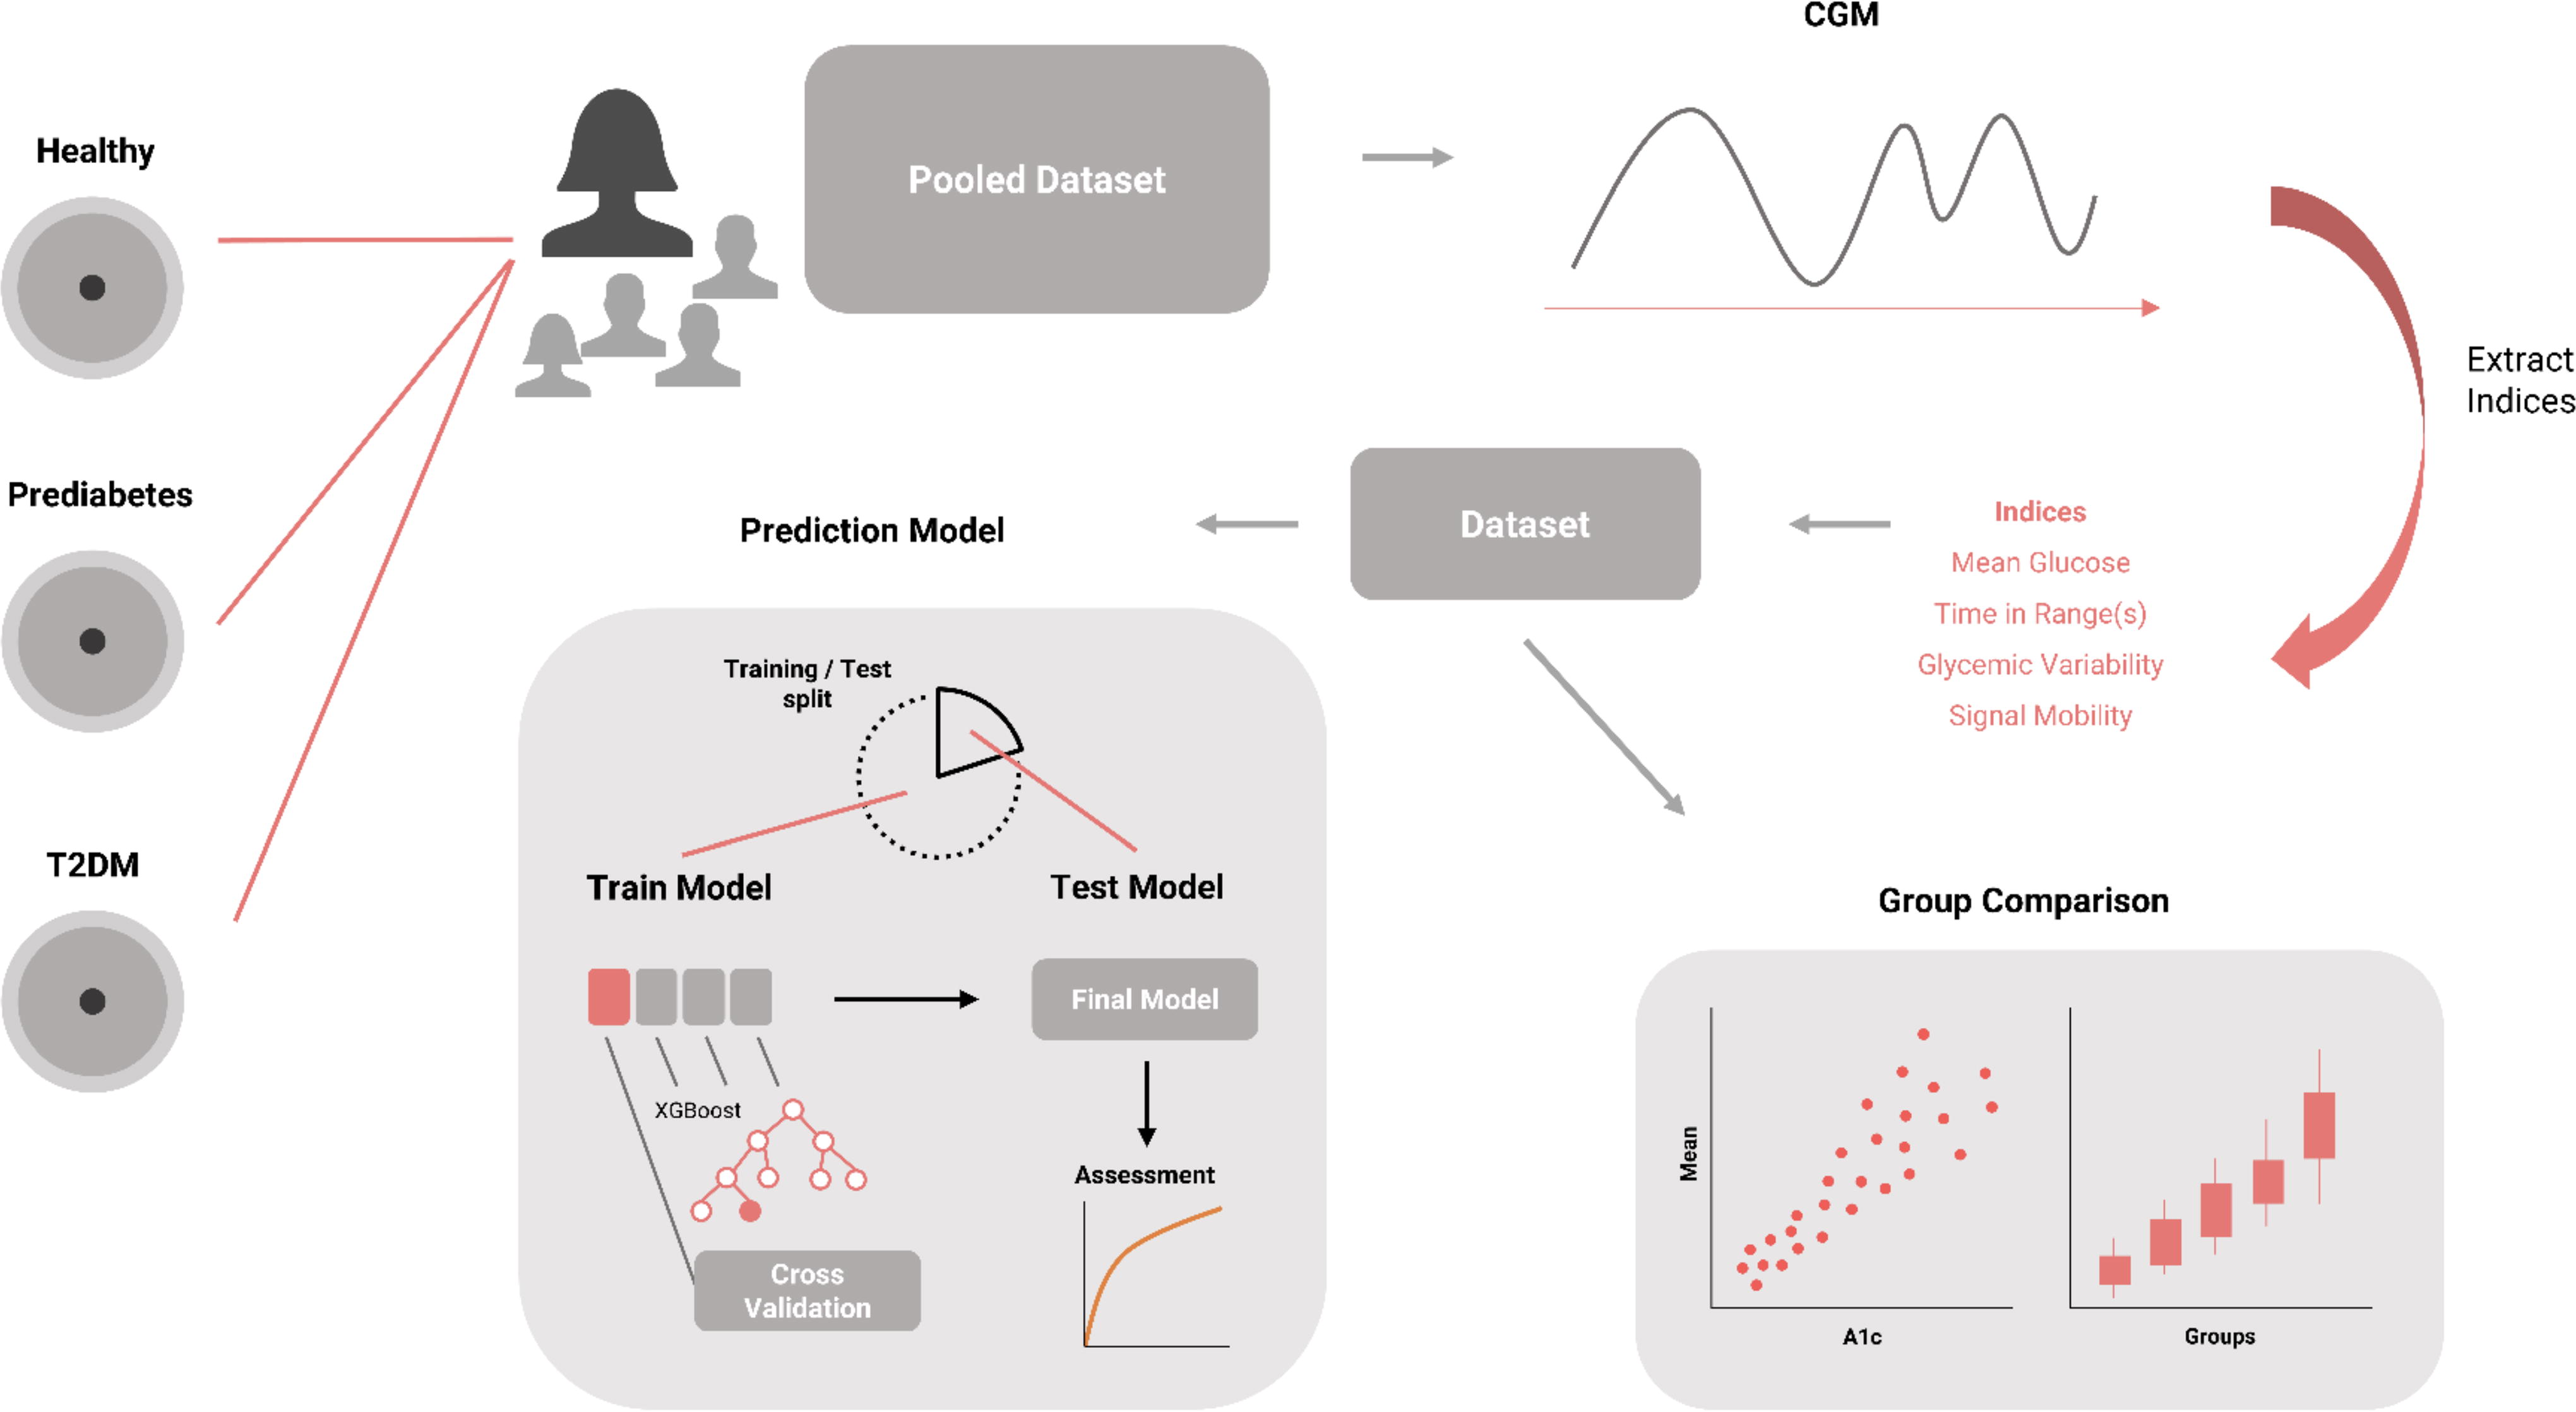
Overview of the analytical methodology used in this study. Data aggregation was performed from five distinct studies encompassing cohorts of healthy individuals, those with prediabetes, and individuals diagnosed with type 2 diabetes mellitus (T2DM), all of whom had undergone continuous glucose monitoring (CGM) for a minimum of two days. Key indices derived from CGM recordings were extracted and subjected to comparative analysis across respective participant groups. Furthermore, the data set underwent partitioning into training and testing subsets to facilitate the development and validation of a classification model aimed at discerning individuals with either prediabetes or dysglycemia, predicated upon the CGM-derived indices.
Participant selection criteria
We included participants from these five studies who had CGM measurements spanning at least two consecutive days, up to a maximum of seven consecutive days, with a CGM wear time exceeding 70% during the monitoring period. 26 Specifically, for the DiaMonT study, we encompassed participants from both the intervention and control arms. To mitigate the impact of intervention, we limited inclusion to the initial seven days of CGM monitoring for both arms.
Participant grouping
Participants were categorized based on their glycemic control as determined by HbA1c levels and clinical diagnosis. For studies involving individuals without diabetes, classifications included healthy (HbA1c < 5.7%/39 mmol/mol) or prediabetes (HbA1c ≥ 5.7%/39 mmol/mol). 27
In studies involving diagnosed diabetes participants, classifications were as follows: Individuals diagnosed with T2DM < 6.5% (HbA1c < 5.7%/48 mmol/mol), T2DM < 7% (HbA1c < 7%/53 mmol/mol), or T2DM ≥ 7% (HbA1c ≥ 7%/53 mmol/mol). The clinical diagnosis for T2DM was obtained from the original studies.
This grouping was utilized to investigate the changes between the groups.
CGM indices
We conducted an analysis of various statistical metrics pertaining to glycemic control and variability across healthy individuals to those with prediabetes and T2DM. Among the metrics assessed were the time spent within specific glycemic ranges, including time in range (TIR) 26,28 between 70–180 mg/dL, time below range (TBR1) 26,28 between 54–69 mg/dL, time below range (TBR2) 26,28 below 54 mg/dL, time above range (TAR1) 26,28 between 181–250 mg/dL, and time above range (TAR2) 26,28 exceeding 250 mg/dL, as well as time in tight range (TITR) 29 between 70–140 mg/dL and time above 140 mg/dL (TA140). 24 In addition, we calculated the coefficient of variation (CV), 30 mean, standard deviation (Std), and interquartile range (IQR). We computed more specific metrics such as mobility, mean amplitude of glycemic excursions (MAGE), Multiscale Complexity Index (MCI), and Glycemic Risk Index (GRI) to characterize different forms of glucose variability. We also estimated fasting plasma glucose (FPG_estimate) from the two last hours of each night. Since we did not have data on sleep time we estimated the nights to end 6AM.
A novel metric was calculated for assessing mobility of the signals. Mobility gives an indication of how much the CGM signal is changing relative to its overall variability, Formula 1.
The
A higher mobility value suggests that the signal changes more rapidly relative to its overall variability, indicating less smoothness and more short-term fluctuations. A lower mobility value suggests that the signal changes more gradually relative to its overall variability, indicating more smoothness and fewer short-term fluctuations.
The hypothesis is that healthy individuals possess a robust homeostatic ability to correct glucose levels on finer scales. This ability to finely tune glucose levels results in a higher mobility metric, reflecting a more stable glucose profile with fewer and smaller large fluctuations.
Multiscale entropy is a method used to assess the complexity of time series data at multiple temporal scales. In the context of a CGM signal, Multiscale entropy provides insights into the underlying dynamics and variability of glucose levels over different timescales. We adopted the implementation described by Kohnert et al. 31 where MCI is defined as the sum over the range of scales, from 1 to 7, at the window length m = 2, the sensitivity criterion r = 0.15 times the Std.
The MAGE
32
is a metric used to quantify the variability in blood glucose levels over a period of time. It is calculated by determining the arithmetic mean of the differences between consecutive peaks, nadirs or nadirs-peaks (positive or negative excursions
The GRI
33
and GRI hyper/hypo (Glycemic Risk Index for hyperglycemia/hypoglycemia) is a measure used to quantify the risk of high/low blood glucose levels based on CGM data. It combines the percentages of time spent in very high or low and high or low glucose ranges to provide a single index representing the risk of hyperglycemia or hypoglycemia, Formula 3.
Continuous Overall Net Glycemic Action (CONGA)
34
is a metric used in CGM to assess glucose variability over time. It calculates the Std of the differences in glucose values measured at different time points within a specified window. Essentially, CONGA measures how much the glucose levels fluctuate within a given period (i.e., 1, 2 h), providing insights into the stability of blood sugar control, Formula 4. We assessed CONGA for 1 and 2 h, as we were interested in a short time frame of glucose variability.
Model targets
The targets of the classification models were to classify dysglycemia versus healthy (normoglycemia) individuals based on the CGM indices. We included two endpoints for this approach: Endpoint 1: Healthy versus prediabetes (excluding participants with a T2DM diagnosis). Endpoint 2: Healthy versus dysglycemia (including prediabetes and T2DM participants)
Modeling approach
Utilizing binary targets, we trained two classification models using XGBoost (Extreme Gradient Boosting) and Logistic Regression (LR) classification. 35 Noteworthy attributes of XGBoost include its proficiency in capturing nonlinear relationships, addressing missing or imbalanced data, and mitigating overfitting. Evidenced by its widespread adoption, XGBoost has garnered substantial success in crafting clinical classification and prediction models across diverse medical domains. 36 –39
In our investigation, we leveraged grid search for parameter optimization. 40 Given the expansive parameter space, we simplified the grid search process by narrowing down the parameter combinations to more manageable sets with carefully chosen value ranges. To gauge performance accurately and minimize problems with overfitting, we conducted model selection (learning rate, depth, estimators) through K-fold cross-validation (fivefold). 41
The LR model provided a linear comparison to the nonlinear model approach. To minimize overparameterization and overfitting, we conducted forward feature selection through K-fold cross-validation (fivefold).
The data set was partitioned into training and testing sets on participant level in a 70/30 split. Subsequently, the final models underwent testing on the dedicated test data set. Notably, we refrained from recalibrating the model post-training.
Statistical assessment
Due to data distribution, the Kruskal–Wallis test was performed to test for statistical differences in individual CGM indices between groups adjusting for age as a confounding factor. Subsequently, in cases where significant outcomes were observed via the Kruskal–Wallis tests (α = 0.05), pairwise comparisons were conducted utilizing the Dunn’s test, with Bonferroni corrections applied. To streamline the comparison process and mitigate the proliferation of pairwise tests, comparisons were primarily focused on the distinctions between healthy versus prediabetes (HvP) and prediabetes versus diabetes (PvD) groups, deemed as the most pertinent for statistical investigation.
The model’s discriminatory performance was assessed using the Area Under the Receiver Operating Characteristic Curve (ROC-AUC), with confidence intervals (CIs) estimated through bootstrap resampling (n = 1,000). The model’s performance was compared with that of three individual metrics: mean glucose, the 95th percentile, and the estimated FPG.
To enhance model interpretability, SHAP (SHapley Additive exPlanations) 42 values were used for explanatory analysis.
All analyses were performed using MATLAB (R2021b), Python (v3), the Scikit-learn package (v0.23.2) for machine learning utilities, and the XGBoost package (v1.7.5).
Results
The analysis incorporated a total of 836 participants with CGM. Among them, 282 participants exhibited normoglycemia and were deemed healthy, while 133 participants displayed prediabetic conditions, and 421 participants were diagnosed with T2DM. Within the T2DM cohort, 68 participants had an HbA1c level below 6.5%, 83 participants had an HbA1c levels between 6.5 and <7%, and 270 participants had an HbA1c level of 7% or higher. The comprehensive characteristics of each group, including CGM indices and the results of statistical tests, are outlined in Table 1.
CGM Indices for the Groups Presented as Median (IQR, Interquartile Range)
Kruskal–Wallis test with age as a covariate.
Mann–Whitney U test between the groups “Healthy” and “Prediabetes.”
Mann–Whitney U test between the groups “Prediabetes” and “Diabetes.”
Indicates P < 0.05.
P < 0.01.
P < 0.001. NS indicates P > 0.05.
Across all CGM indices, a discernible progression was noted from the healthy group to those diagnosed with diabetes (P < 0.001). Significant statistical differences (P < 0.01) were observed with increases in mean glucose, TBR, TA140, mobility, MCI, and GRI when transitioning from the healthy state to prediabetic state. Minor elevations (P < 0.05) were observed in MAGE, while no significant changes were recorded in Std, CV, or CONGA. Furthermore, upon examining the variance in TBR occurrences between individuals classified as healthy and those with prediabetes, it was found that 7.8% of the healthy cohort experienced TBR rates exceeding 0% per day, while 6.6% of individuals with prediabetes exhibited similar TBR rates during CGM usage (P > 0.5, chi-square test).
Moving from prediabetes to diabetes, significant statistical differences (P < 0.001) were noted across various indices, except for TBR2.
Figure 2 illustrates scatter plots depicting selected CGM indices in relation to HbA1c levels, accompanied by corresponding box plots. These visualizations highlight the gradual alterations in MAGE, TA140, and mobility across the spectrum of glycemic control.

Scatter plot for selected CGM indices in relation to A1c (HbA1c) and the corresponding boxplot grouped by healthy, prediabetes, T2DM < 6.5%, T2DM < 7%, T2DM ≥ 7%.
Predictive model evaluation
Endpoint 1: Distinguishing between healthy and prediabetic states. The XGBoost model achieved a ROC-AUC of 0.91 [95% CI: 0.87–0.95] on the test data set. During the explanatory analysis based on SHAP, mobility, GRI (hypo), and mean glucose emerged as the most influential predictors. The LR model had an ROC-AUC of 0.85 [95% CI: 0.83–0.86] and mobility and median glucose included as predictors. FPG_estimate, mean glucose, and 95th percentile had low ROC-AUC between 0.54 and 0.70.
Endpoint 2: Discriminating between healthy and dysglycemic conditions. The XGBoost model demonstrated a robust ROC-AUC of 0.96 [95% CI: 0.95–0.98] on the test data set. Notably, mean glucose, mobility, and TAR were identified as the primary predictors in the explanatory analysis. The LR model had an ROC-AUC of 0.93 [95% CI: 0.92–0.94] and mean, mobility, TBR2, FPG_estimate, and TAR2 included as predictors. Mean glucose and 95th percentile had an ROC-AUC of 0.90 [95% CI: 0.87–0.92].
Figure 3 depicts the ROC curves for both models, while Supplementary Appendix S1 includes SHAP mean plots illustrating the model explanations.
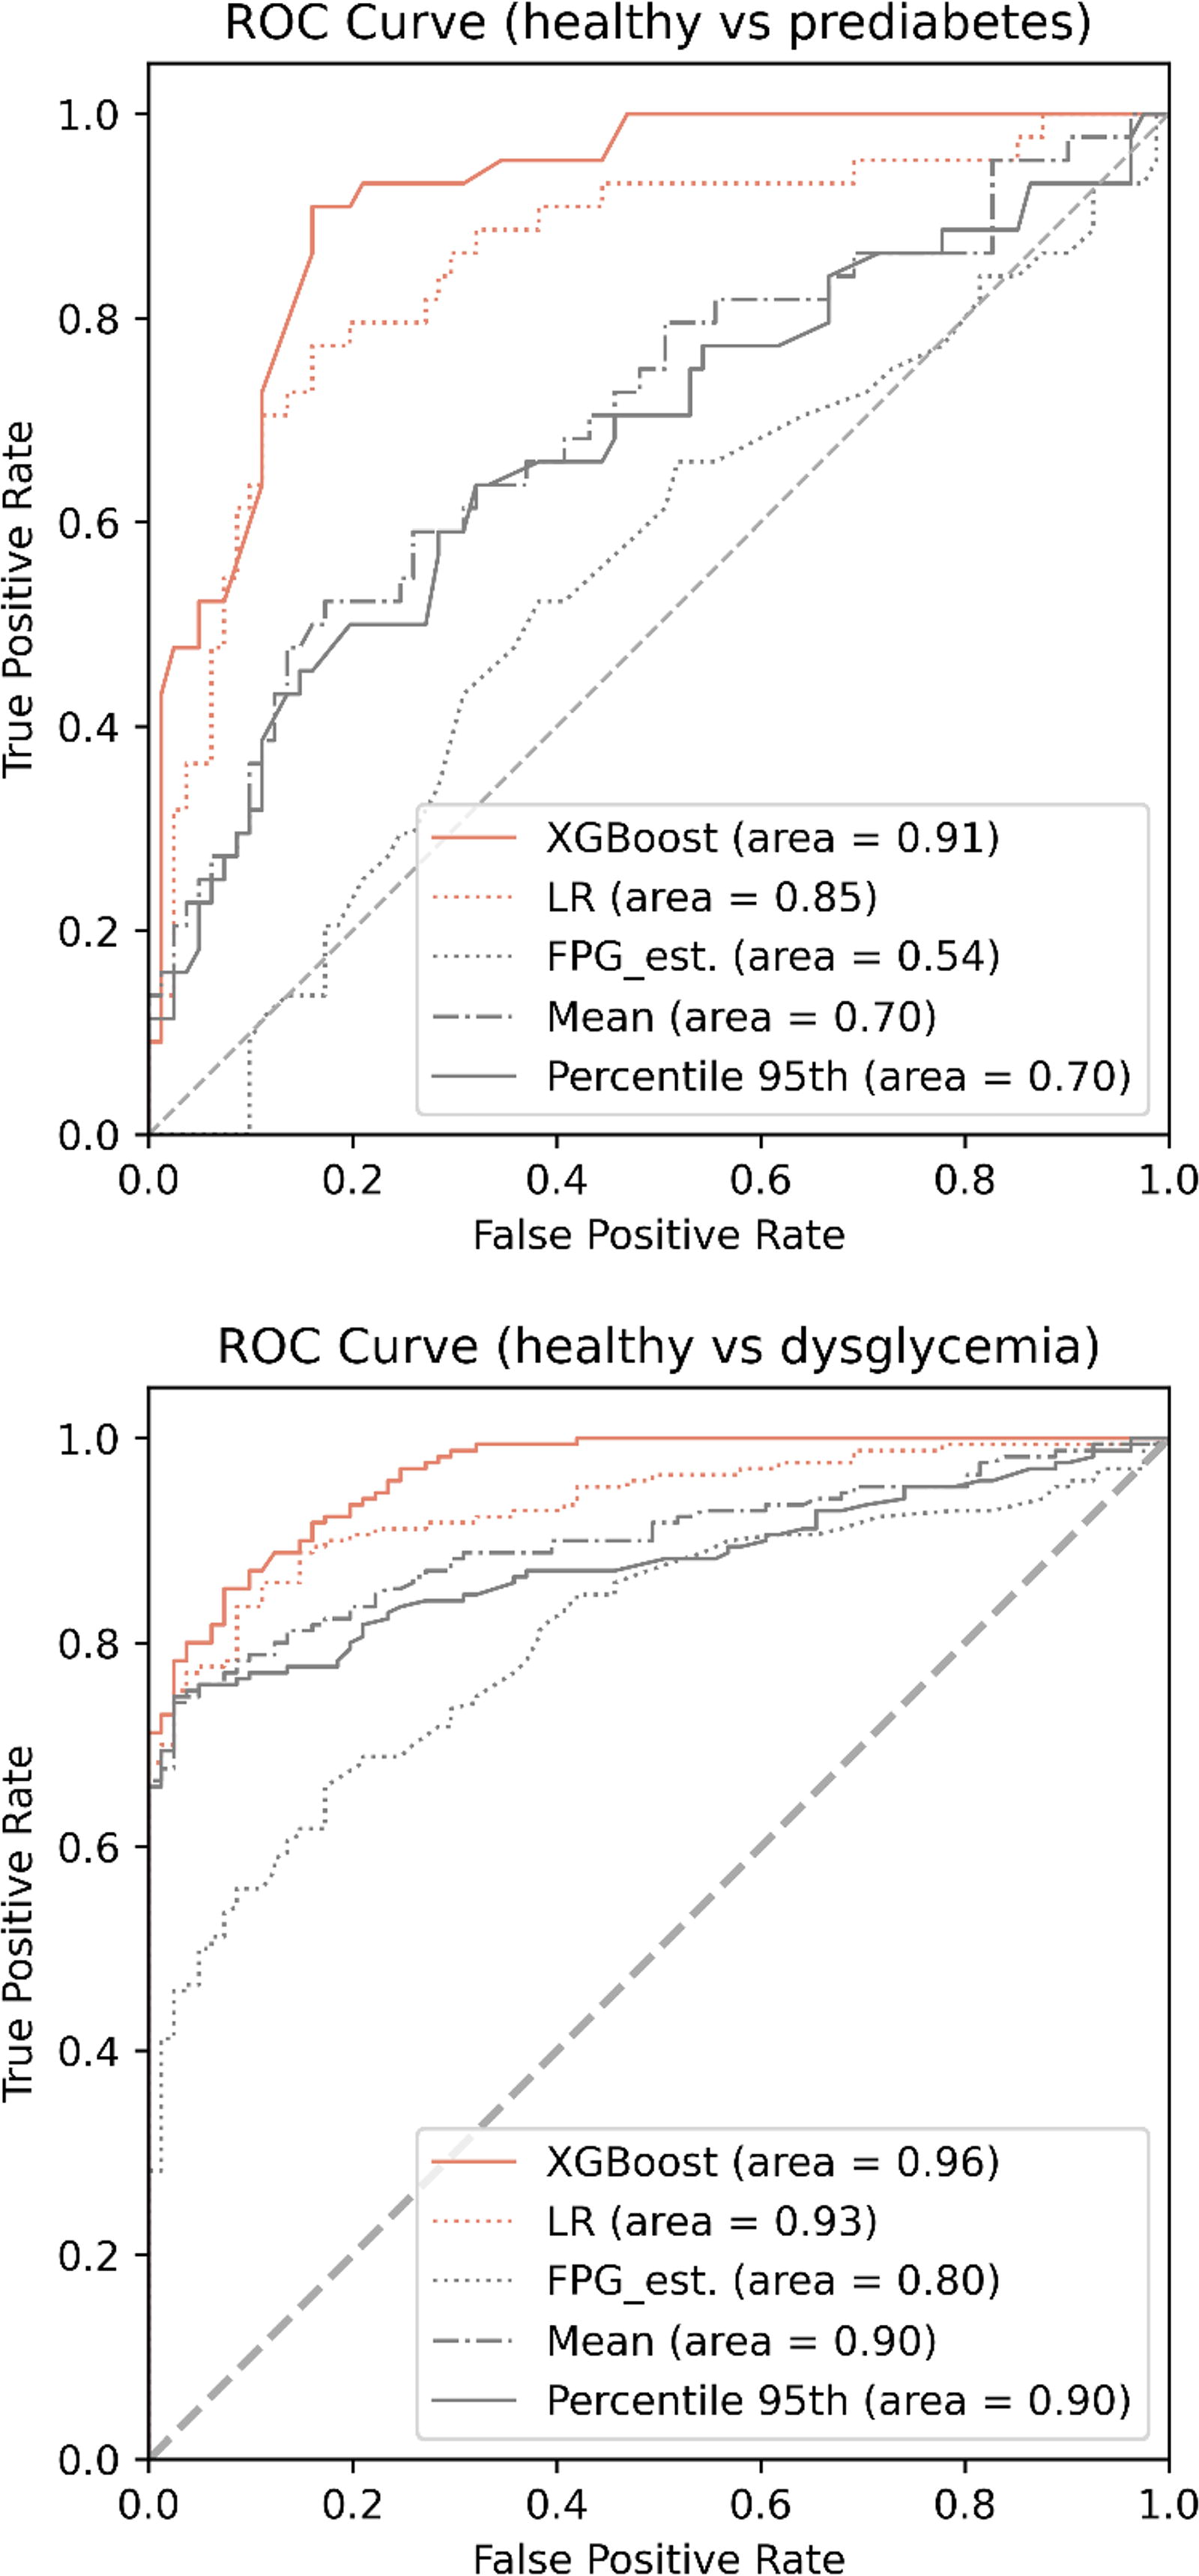
Receiver operating characteristic (ROC) curves for the classification of either prediabetes (top plot) or dysglycemia (bottom plot).
Interindex correlation
Figure 4 presents the correlation among the indices examined in this study. As expected, numerous indices exhibited a strong intercorrelation. Nonetheless, the analysis revealed that the selected indices effectively captured distinct aspects of the CGM signal. Particularly noteworthy is the relatively lower correlation observed between mobility, MCI, and age when compared with other variables.
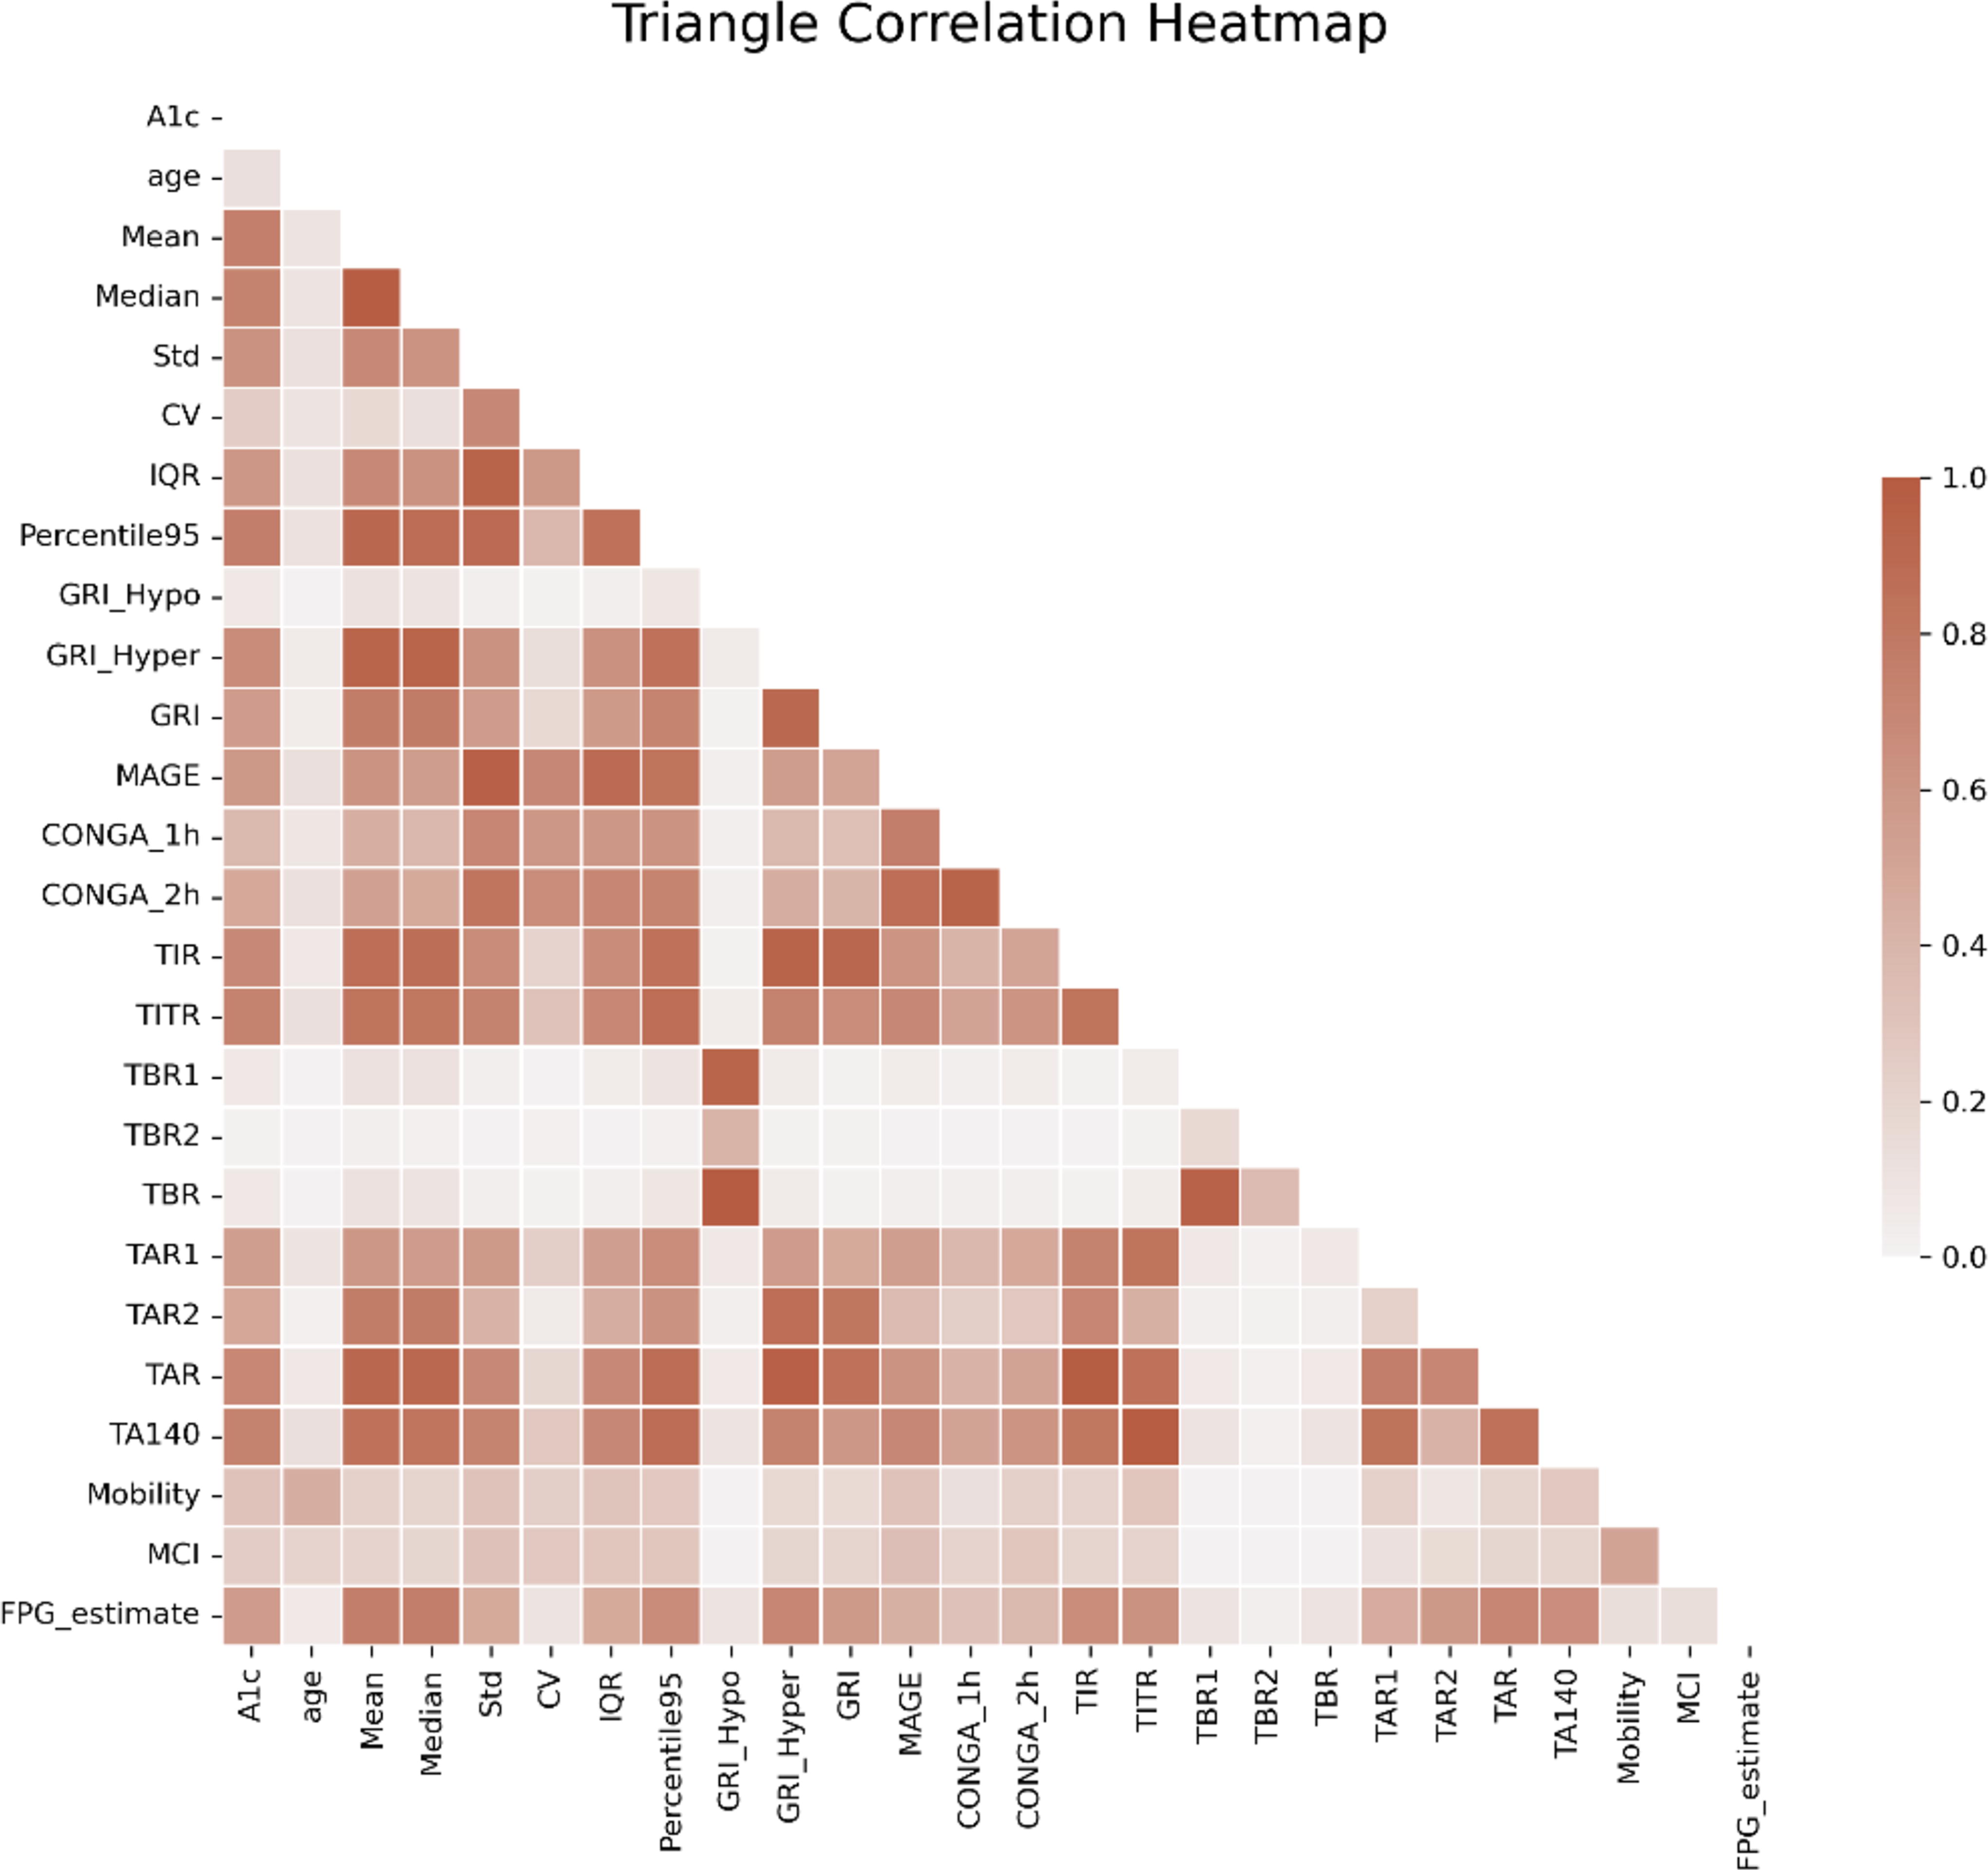
Triangle correlation heatmap of the CGM indices included in the analysis. High saturation indicates a strong correlation between indices.
Discussion
In this study, conducted within a cohort spanning from healthy participants, those with prediabetes, to participants diagnosed with T2DM, we observed a stepwise progressive deterioration of glucose homeostasis and an escalation in glycemic variability. Subsequently, based on these observable patterns in CGM, we trained machine learning models and demonstrated their ability to identify individuals with prediabetes and dysglycemia. Both XGBoost and LR had good discrimination ability.
Significant patterns in CGM indices were observed even with short-term CGM usage lasting only a few days. It is widely recognized that intravariability is prominent when monitoring individuals over brief time spans. 43 Consequently, lengthier monitoring durations may substantially enhance the detectability and characterization of these patterns.
Furthermore, our findings indicate that changes in glucose dynamics are discernible early in the disease progression from healthy individuals to those with prediabetes. While overall variability tends to increase with disease advancement, there is a notable decrease in the mobility of the signal, particularly evident in the transition from healthy to prediabetic states. Mobility, which quantifies the extent of glucose value fluctuations relative to overall variability, suggests that individuals with prediabetes may experience a decline in their ability to promptly correct changes in glucose levels. These findings warrant further investigation. Furthermore, studies could explore the potential prognostic value of these changes in identifying patterns associated with the progression to T2DM, particularly considering the relatively low prognostic value of prediabetes defined by HbA1c or fasting glucose. 12
Comparison with previous findings
Our findings on gradual loss of glucose homeostasis and increased glycemic variability are in line with previous findings. Findings derived from The Maastricht Study involving 851 participants revealed a gradual elevation in average sensor glucose levels, Std, and CV across the spectrum from normoglycemia to prediabetes and T2DM. 44 Furthermore, Chen et al. 45 conducted a comparison of glucose dynamics between individuals with diabetes (n = 17) and controls (n = 13), matched for sex, age, and body mass index. The analysis uncovered that individuals with diabetes exhibited elevated MAGE, increased Std, and lower complexity in the glucose signal. These findings where further validated by Costa et al. in individuals with T2DM and matched controls. 46 Kohnert et al. 47 reported that MCI was significantly higher in healthy subjects compared with both T2DM and T1DM.
Hanefeld et al. 48 compared glucose variability and glucose homeostasis between individuals with normal (n = 28) and abnormal glucose tolerance (AGT) (n = 42). Their analyses showed that AGT was associated with higher mean, peak, Std glucose, and MAGE. Chakarova et al. 8 found similar changes in 32 individuals with prediabetes and 18 individuals with normal glucose tolerance. AGT was associated with higher mean interstitial glucose, TAR, and glycemic variability.
In leveraging these changes for predictive purposes and early detection of individuals with dysglycemia, data analysis from the prospective study, The A Estrada Glycation and Inflammation Study (AEGIS), 49 revealed that TAR held prognostic value for the development of T2DM. In addition, Acciaroli et al. 5 reported results from a smaller study involving 102 subjects across three distinct groups (34 healthy, 39 with impaired glucose tolerance (IGT), and 29 with T2DM). Healthy individuals were accurately distinguished from those with diabetes (IGT and T2DM) with an accuracy of 91.4% using CGM variability indices. These findings also align with our study, suggesting that classification based on CGM data is indeed feasible.
Dimova et al. 50 demonstrated that daily glucose variability (GV) worsens even with mild impairment of glucose tolerance, with the increase in GV being inversely related to insulin secretion. However, individual GV indices were ineffective in classifying prediabetes. The potential of the hypoglycemia component of the GRI as a predictor for prediabetes warrants further investigation. Rodriguez-Segade et al. 51 reported higher nadir values for individuals with prediabetes, although the TBR was not statistically different compared with those with normoglycemia. In addition, Madhu et al. 52 observed higher nadir values and increased GV in individuals with AGT. Multiple studies 25,53,54 investigating normoglycemic individuals have reported that mild hypoglycemia is not uncommon. It is thus possible that mild hypoglycemia is slightly reduced in individuals with prediabetes due to increased GV associated with decreased insulin secretion. 50
Strengths and limitations
This study incorporates a substantial number of participants, ranging from individuals with normoglycemia to those with prediabetes and type 2 diabetes. The inclusion of diverse glycemic statuses enhances the robustness and generalizability of the findings, providing insights into glycemic variability across a spectrum of metabolic health.
The study’s cross-sectional nature limits its ability to establish causal relationships or infer temporal sequences. As a result, conclusions regarding the individual progression from a healthy metabolic state to prediabetes and ultimately to type 2 diabetes need further investigation. Future longitudinal investigations are warranted to elucidate the dynamic nature of glycemic variability and its role in the continuum of metabolic health. Also, future research should explore the impact of sampling time and sensor accuracy on the results. The classification of individuals with prediabetes in this study was based on HbA1c measurements, as this parameter is widely used and consistently reported across the analyzed studies. However, alternative definitions utilizing fasting glucose levels and oral glucose tolerance tests are also prevalent. Currently, HbA1c is commonly used as the diagnostic test for practical reasons, including its convenience and ability to provide a long-term view of glycemic control without requiring fasting. However, there is no absolute consensus that HbA1c should be the definitive diagnostic measure.
Therefore, subsequent investigations should perform sensitivity analyses to assess the robustness of our findings with respect to the various definitions of prediabetes.
Conclusions
Our study reveals a progressive deterioration of glucose homeostasis and an escalation in glycemic variability as observed through CGM, spanning from healthy individuals to those with prediabetes and diabetes. These discernible patterns provide a promising foundation for identifying individuals through a classification framework. Future research endeavors should delve deeper into the clinical implications of integrating this approach for early diagnosis of dysglycemia and its prognostic value.
Footnotes
Authors’ Contributions
S.L.C. had access to all the data analyzed in this study. S.L.C. takes responsibility for the integrity and accuracy of the study data analysis and results (conceptualization, methodology, and writing—original draft). Other authors were involved in data collection and writing—review and editing.
Author Disclosure Statement
S.L.C. received research funding from i-SENS, Inc (Seoul, South Korea), which manufactures some of the product types discussed in this article. However, the study was conducted independently.
Funding Information
No funding was received for this article.
Disclaimer
The source of the data is pooled from several clinical trials, but the analyses, content, and conclusions presented herein are solely the responsibility of the authors.
Supplementary Material
Supplementary Appendix S1
References
Supplementary Material
Please find the following supplemental material available below.
For Open Access articles published under a Creative Commons License, all supplemental material carries the same license as the article it is associated with.
For non-Open Access articles published, all supplemental material carries a non-exclusive license, and permission requests for re-use of supplemental material or any part of supplemental material shall be sent directly to the copyright owner as specified in the copyright notice associated with the article.
