




Abstract
Objective:
The recommended threshold for the time spent on continuous glucose monitoring (CGM) is established at 70%. However, glucose outcomes in children with type 1 diabetes (CwD) using CGM for a different proportion of time within this threshold have not been evaluated yet. The study aims to compare glycemic parameters among CwD who spent 70%–89% and ≥90% on CGM using the population-wide data from the Czech national pediatric diabetes registry ČENDA.
Methods:
CwD aged <19 years who used real-time CGM >70% of the time and did not change the type of therapy throughout the year 2023 were included and divided into two groups based on the time they spent on CGM—70%–89% versus ≥90%. HbA1c, times in standard glycemic ranges, mean glucose, and coefficient of variability (CV) were compared between the groups and by treatment modalities.
Results:
Data from 1977 CwD (1035 males and 942 females) were evaluated. Among them, 404 participants (20.4%) used CGM 70%–89% of the time, and 1573 participants (79.6%) ≥90% of the time. Compared with the 70–89% group, the ≥90% CGM users achieved significantly lower HbA1c levels (51 mmol/mol, 6.8% vs. 58 mmol/mol, 7.4%, P < 0.001), higher time in range (72% vs. 60%, P < 0.001), and lower mean glucose and CV (8.1 mmol/L, 146 mg/dL vs. 9.1 mmol/L, 164 mg/dL and 37% vs. 40%, respectively, both P < 0.001). Analogous results were seen irrespective of the treatment modality. The differences persisted after propensity score adjustment.
Conclusion:
CGM use for ≥90% is associated with tighter glycemic control compared with 70%–89% use. Therefore, it is essential to motivate CwD to use CGM for the longest possible time and search for suitable options to overcome barriers in uninterrupted CGM monitoring.
Introduction
Continuous glucose monitoring (CGM) has become the standard of care for people with type 1 diabetes (PwD). 1 There are several studies confirming the significance of CGM in the improvement of glycemic outcomes in PwD, including a decrease in HbA1c levels and glucose variability, an increase of time in range (TIR), or a reduction of the number of hypoglycemic episodes accompanied by a reduction of time spent in hypoglycemia. 2 –8
There is insufficient evidence on the optimal or minimal time spent on CGM to achieve the full benefits of this technology. A meta-analysis by Szypowska et al. described that reduction of HbA1c level is associated with >60%–70% of CGM utilization. 9 This is also confirmed by a population study that divided children with type 1 diabetes (CwD) into five categories based on the time spent on CGM (no use, ≤19%, 20%–39%, 40%–69%, and ≥70%), showing that longer time on CGM was associated with the steepest decline of HbA1c over 3 years after CGM introduction. 10 In accordance with previous research, the officially recommended threshold for the time spent on CGM was established at 70%. 11 However, no studies evaluated glucose outcomes in PwD using CGM for a different proportion of time over the 70% threshold.
Our study aims to compare glycemic parameters (HbA1c and CGM-derived parameters) between CwD using CGM for 70%–89% of the time and those using CGM ≥90% of the time with the use of population-wide data from a national pediatric diabetes registry ČENDA. The secondary objective is to compare glycemic parameters in these groups divided by the therapeutic modality they used.
Materials and Methods
In this population-wide study, data from the national pediatric diabetes registry ČENDA, described in detail elsewhere, 12 were used. Briefly, ČENDA is a web-based longitudinal registry gathering information about glycemic outcomes and acute and late diabetic complications in children and adolescents younger than 19 years. To date, information about more than 95% of all children with diabetes in Czechia is included in this registry. In 2023, 45 diabetes centers participated in the registry.
Alongside the HbA1c and treatment modality, the ČENDA registry collects categorical data about the proportion of time actively spent on CGM. These data are provided by physicians using electronic CGM records. CwD are divided into six groups in the registry based on CGM use: no use, ≤19%, 20%−39%, 40%−69%, 70%−89%, and (since 2022) ≥90%. The following inclusion criteria were used in this study: real-time CGM (rtCGM) use >70% of the time, no change in therapeutic modality or type of glucose monitoring throughout the year 2023, available information about the time spent on rtCGM in 2023, available at least one measurement of HbA1c, and times in glycemic ranges. Eligible CwD were subsequently divided into two groups based on the proportion of the time spent on the rtCGM—70%–89% and ≥90%.
For each participant, means of HbA1c and CGM-derived parameters were calculated from all available values measured in 2023. The measurements were provided in all personal outpatient visits; for CGM-derived parameters, data from the previous 14 days’ CGM records before each outpatient visit were applied. Standard CGM-derived parameters were used: time in range—TIR (3.9–10.0 mmol/L; 70–180 mg/dL); time in hyperglycemia level 1—TAR1 (10.1–13.9 mmol/L; 181–250 mg/dL); time in hyperglycemia level 2—TAR2 (>13.9 mmol/L; >250 mg/dL); time in hypoglycemia level 1—TBR1 (3.0–3.8 mmol/L; 54–69 mg/dL); time in hypoglycemia level 2—TBR2 (<3.0 mmol/L; <54 mg/dL); mean glycemia; and coefficient of variability (CV). HbA1c and CGM-derived parameters are stated as the median and/or means of ’participants’ mean values throughout the year. A comparison of all the above-mentioned parameters was provided between the 70%–89% and ≥90% groups.
Statistical Analysis
Continuous data were summarized as means with standard deviation or median with range and/or interquartile range where appropriate. Differences between the 70%–89% and ≥90% groups were assessed using a two-sample t test or Wilcoxon rank-sum test. Categorical variables were summarized using absolute and relative frequencies, and differences between groups were tested using the χ 2 test.
For better insight, cumulative distribution functions for HbA1c and TIR were used to examine the relationship between the 70%–89% and ≥90% groups. Some analyses were stratified by therapeutic modality (multiple daily injections, continuous subcutaneous insulin infusion without the hybrid closed-loop functionality, and hybrid closed loop [HCL]).
To reduce the imbalance of some baseline characteristics between the intensity groups, we used the mnps function of the TWANG 13 (The Toolkit for Weighting and Analysis of Nonequivalent Groups) library to estimate propensity score weights based on gender, age, type 1 diabetes (T1D) duration, therapeutic modality, insulin dose, and body mass index. Compared with standard propensity score matching, this type of analysis retains the original sample sizes. Weighted means/medians and 1st and 3rd quartiles were computed to reassess the differences. Comparisons between the 70%–89% and ≥90% groups were subsequently carried out using a weighted two-sample t test and a weighted Wilcoxon rank-sum test.
Results
Characteristics of the study group
The inclusion criteria were fulfilled by 1977 CwD (1035 males and 942 females). Out of 1977 CwD, 404 participants (20.4%) used CGM 70%–89% of the time and 1573 participants (79.6%) ≥90% of the time. The study group characteristics are shown in Supplementary Table S1. CwD using CGM 70%–89% of the time were significantly older (15.1 ± 2.8 vs. 13.8 ± 3.4 years, P < 0.001) and had longer T1D duration (8.3 ± 3.6 vs. 7.1 ± 3.3 years, P < 0.001) in comparison with the ≥90% group. Treatment modalities differed significantly between the groups (Supplementary Table S1). The propensity score weighting statistical method was used to mitigate the bias stemming from these differences. The median of HbA1c and times in glycemic ranges measurements was 3 (2–4) per CwD per year.
HbA1c
The median HbA1c was 52 mmol/mol (6.9%) for the whole study group. A significantly lower HbA1c was observed in the ≥90% group compared with the 70%–89% group (51 vs. 58 mmol/mol, 6.8% vs. 7.4%, P < 0.001). Similar results were also observed after propensity score weighting recalculation (51 vs. 57 mmol/mol, 6.8% vs. 7.3%, P < 0.001; Table 1, Fig. 1).

Significant differences in median HbA1c between the study groups (after propensity score weighting). The whiskers represent interquartile ranges, the dashed lines are target of HbA1c 48 mmol/mol (6.5%) and 53 mmol/mol (7%).
Parameters of Glycemic Outcomes by the Time Spent on CGM
The results are shown as medians (IQR).
CGM, continuous glucose monitoring; CV, coefficient of variability; IQR, interquartile range; TAR, time above range; TBR, time below range; TIR, time in range.
The target of HbA1c <48 mmol/mol (<6.5%) was achieved by 15.8% of participants using the CGM 70%–89% of the time and in 36.7% of ≥90% CGM users (Supplementary Fig. S1A). Of note, significantly lower HbA1c in the ≥90% group compared with the 70–89% CGM users was present irrespective of the treatment modality (Fig. 2).

Lower HbA1c in the ≥90% group regardless the treatment modality. The whiskers represent interquartile ranges, the dashed lines are target of HbA1c 48 mmol/mol (6.5%) and 53 mmol/mol (7%). (***P < 0.001, *P < 0.05). CSII, continuous subcutaneous insulin infusion; HCL, hybrid closed loop; MDI, multiple daily injections; rtCGM, real-time continuous glucose monitoring.
Times in glycemic ranges
The means of TIR were significantly higher in the ≥90% group compared with the 70%–89% group (68.9% vs. 58.1%, P < 0.001). Significant differences were also observed in the times spent in both levels of hyperglycemia (P < 0.001; Fig. 3). Importantly, there were no significant differences observed in times spent in hypoglycemia when using raw data (Table 1).

The means of times in glycemic ranges. The ≥90% group achieved overall better results in all CGM characteristics (see Results and Table 1 for statistical significance). CGM, continuous glucose monitoring.
After propensity score weighting analysis, significant differences remained in the medians of TIR and in times in hyperglycemia between the groups. Moreover, a significant difference appeared in TBR2 (P = 0.009) with lower TBR2 seen in the ≥90% group. The overview of these results is shown in Table 1.
The target of TIR >70% 11 was met by 54.5% of ≥90% CGM users and only 26.2% of 70%–89% CGM users (Supplementary Fig. S1B).
The analysis of times in glycemic ranges among the treatment groups confirmed higher TIR and shorter time in hyperglycemia in the CwD using CGM ≥90% of the time in all treatment groups (Fig. 4).
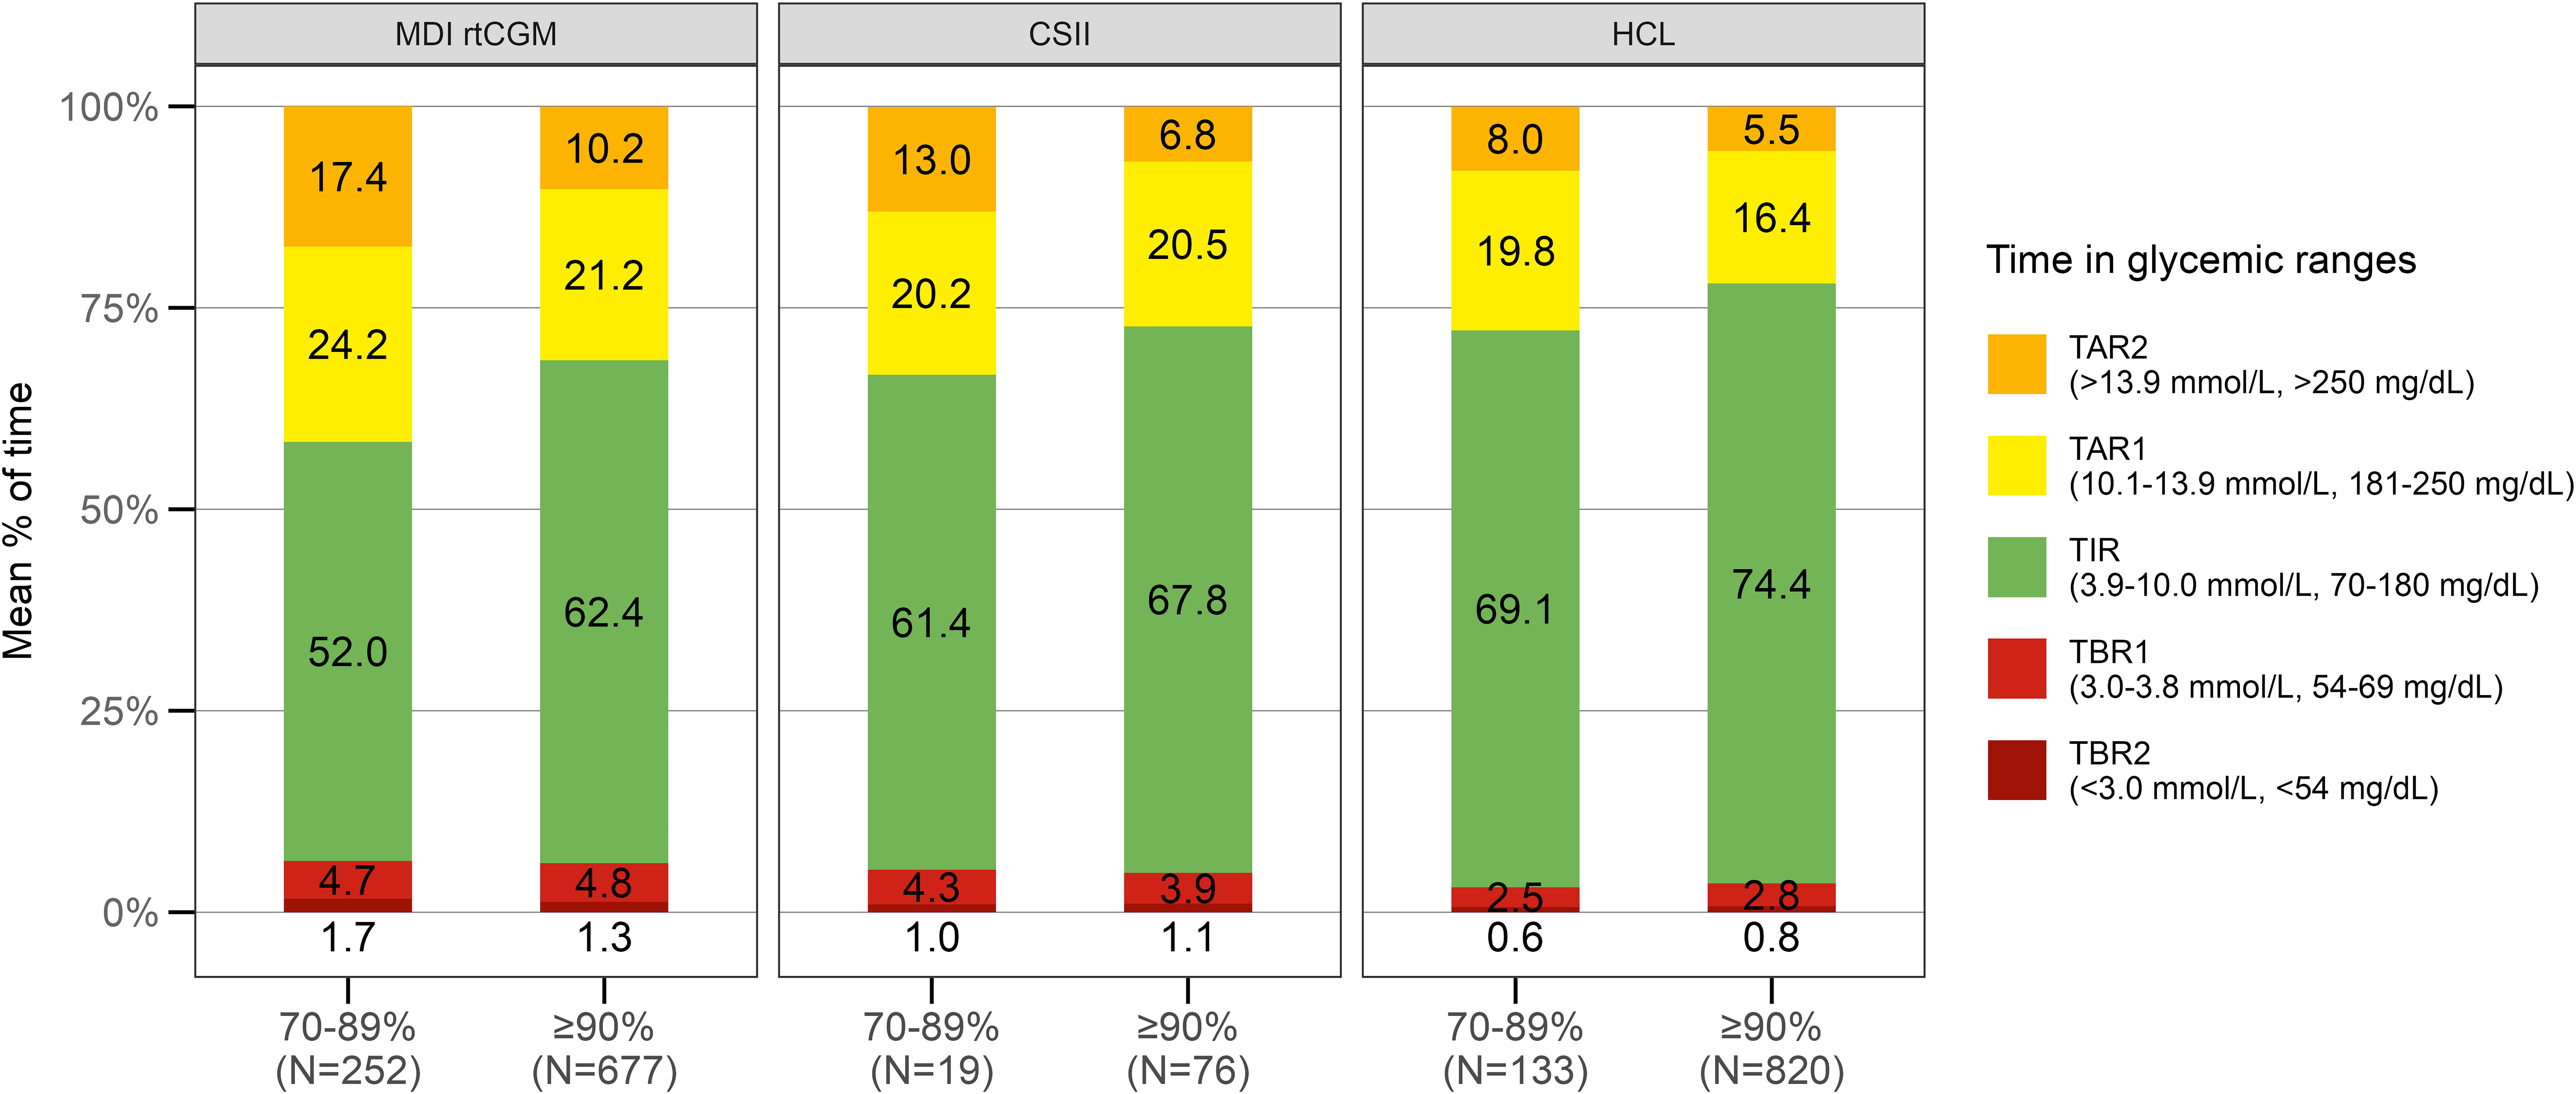
The means of times in glycemic ranges by treatment modalities. Overall, superior results were achieved in the group ≥90% regardless the treatment modality. CSII, continuous subcutaneous insulin infusion; HCL, hybrid closed loop; MDI, multiple daily injections; rtCGM, real-time continuous glucose monitoring.
Mean glycemia and CV
The median of participants’ mean glycemia was 8.3 mmol/l (149 mg/dL) in the whole study cohort, whereas the median CV was 37%. In line with previous results, lower values were seen in the ≥90% group compared with the 70%–89% group (mean glycemia 8.1 mmol/L, 146 mg/dL vs. 9.1 mmol/L, 164 mg/dL, P < 0.001, CV 37% vs. 40%, P < 0.001). Similar results were observed after the correction using the propensity score weighting (Fig. 5).

The significantly lower value of mean glucose
Discussion
This population-wide registry-based study provided a head-to-head comparison between the glycemic outcomes of CwD using CGM for ≥90% and 70%–89% of the time. The study revealed consistent differences in key parameters of glycemic outcomes between the groups. The results are highly indicative of the fact that CGM monitoring for ≥90% is associated with more favorable results, which has important implications for education and clinical recommendations.
CGM became a standard of care for people with T1D, but the evidence on the optimal frequency of CGM use is limited. Indeed, most randomized controlled studies did not include the parameter of CGM usage in the analyses, and a rough categorical assessment (CGM yes/no) does not allow an objective assessment of the time spent on CGM and its relation to glycemic control. Our previous national-level study, based on five categories of the time spent on CGM, confirmed the importance of qualitative assessment of CGM use, showing significant differences in HbA1c in 3 years of follow-up among CwD using CGM for various amounts of time. 10 In our current study, we showed clinically highly significant differences even within the group of above 70% use, suggesting that ≥90% of CGM use is a vital prerequisite for achieving adequate glucose outcomes. There are two aspects underlying and complementing our findings. First, the higher TIR was not associated with higher time in hypoglycemia, confirming the comprehensive improvement in glycemic control in the ≥90% group. Second, these trends were consistent regardless of the treatment modality, further emphasizing the universal validity of these findings. Given the fact that CwD using HCL achieved better results compared with CwD treated by other therapeutic modalities, the combination of HCL with uninterrupted CGM monitoring seems to be a recommended option for PwD nowadays.
The 2019 CGM consensus defined the recommended targets of CGM-derived parameters, including the threshold for optimal CGM monitoring (set at 70%). 11 Taking into account our data, it might be advisable to reconsider these recommendations and adjust the current threshold of optimal time actively spent on CGM to 90%.
Although the effect of CGM on glycemic control has been clearly demonstrated, a significant proportion of CwD do not achieve time spent on CGM above 90%. This is seen regardless of the fact that there has been significant progress in this technology over the past years, including the reduction in the size of most sensors, an increase in user comfort by eliminating the need for their calibration, or an improvement in measurement accuracy and consequently a decrease in the number of false alarms. 14,15 Even in countries with good access to this technology, there is still a significant part of PwD who use CGM infrequently, less than the suggested 70% of the time or not at all. 10,16
Several studies have been provided that aim to define barriers to frequent CGM use. 17,18 It was shown that awareness of blood glucose level could also be associated with negative feelings such as fear of persistent control or constant awareness about the disease, and therefore, part of the PwD find CGM utilization burdensome. 17,19 Given that adolescents and young adults have the lowest CGM uptake rate, it can be assumed that other psychosocial factors such as device visibility related to a fear of the diabetes stigma may hinder more frequent use of this technology. 17,19 Furthermore, skin reactions as a possible side effect of sensor use can also limit their usage and negatively influence the duration of use. 20,21 Unfortunately, these data are not collected by the ČENDA registry, and therefore, we are not able to document whether and to what extent these reasons are relevant for the usage of CGM. Moreover, the accessibility and reimbursement of this technology differ worldwide, and despite improvement in the availability of this technology in various countries, there is still a significant portion of PwD who cannot afford frequent device use. 18,22,23 Overcoming these barriers could lead to better CGM utilization followed by the improvement of glycemic outcomes.
The main strength of our study lies in the number of study subjects and the fact that it covers a real-world country-wide population. Moreover, the study was conducted in Czechia, where all types of rtCGMs are fully covered by public insurance without the need for any out-of-pocket payment. Therefore, our study group is also representative with regard to the socioeconomic status of families. On the contrary, there are multiple limitations as well. First of all, this is a cross-sectional design, and therefore, we (despite the significant differences in all parameters of glycemic control and its consistency) cannot prove causality. Furthermore, due to the shorter time spent on CGM in the 70%–89% group, this group had less CGM data for analysis compared with the ≥90% group, and we are not able to comment on the rest of the time for which we have no information from the sensor. Furthermore, there were significant differences between the groups in basic characteristics, which can make it challenging to correctly interpret our results. However, to mitigate this potential bias, we used propensity score weighting analysis, which improves the validity. 13
Conclusions
This study shows that active use of CGM for more than 90% of the time is consistently associated with better glycemic outcomes compared with 70%–89% of CGM use, regardless of the type of treatment modality. This study demonstrates the need for targeted education and motivation regarding the near-permanent use of CGM by pediatric diabetes teams and stimulates the search for ways to overcome barriers to more widespread CGM use at individual and national levels.
Footnotes
Acknowledgments
The authors thank the remaining members of the ČENDA Study Group (in alphabetic order of cities)—Drs: J. Vyžrálková, M. Pejchlová (Brno), L. Kocinová (Česká Lípa), I. Röchlová (Frýdek-Místek), A. Kudličková (Hodonín), A. Benešová (Chomutov), J. Češek (Chrudim), M. Adam (Jablonec), P. Kracíková (Jičín), P. Vlachý, M. Svojsík (Jihlava), M. Jiřičková (Jilemnice), K. Poločková (Karviná), J. Kytnarová (Prague-VFN), K. Dimová (Kladno), S. Fialová (Kroměříž), M. Vracovská (Klatovy), J. Sivíčková, P. Pelcová (Karlovy Vary), E. Hlaďáková (Kyjov), J. Bartošová (Liberec), M. Kulinová (Mladá Boleslav), N. Filáková (Ostrava — City Hospital), M. Romanová (Prague-FNKV), M. Šnajderová, S. Koloušková (Prague — Motol), A. Mílová (Náchod), E. Farkaš (Nový Jičín), Z. Ježová (Nové Město na Moravě), M. Honková (Opava), B. Červíčková (Pardubice, Trutnov), T. Farová (Písek), K. Fiklík (Plzeň), J. Malý (Sokolov), M. Gregora (Strakonice), J. Malý (Svitavy), J. Chocholová (Tábor), P. Eichl (Teplice), O. Michálková (Třebíč), M. Struminský (Třinec), M. Procházka (Ústí nad Orlicí), H. Vávrová (Vsetín), P. Gogelová (Zlín), and P. Mikyška (Znojmo). Marie Kajprová and Jakub Šumník are gratefully acknowledged for help with data entry.
Authors’ Contributions
A.S., V.N., and L.P.: Conceptualization, investigation, methodology, and writing—original draft. S.A.A.: Investigation, methodology, and writing—original draft. M.P.: Data curation, formal analysis, methodology, visualization, and writing—original draft. M.R., P.K., D.N., K.K., Ji.S., R.P., P.V., Ja.S., and B.O.: Investigation and writing—review and editing. S.P. and O.C.: Investigation, methodology, and writing—original draft. Z.S.: Conceptualization, funding acquisition, investigation, methodology, project administration, supervision, and writing—original draft.
Author Disclosure Statement
No competing financial interests exist.
Funding Information
This study was supported by grants from the Czech Diabetes Society and the Czech Ministry of Health (conceptual support project to research organization 00064203—FN Motol).
Supplementary Material
Supplementary Table S1
Supplementary Figure S1A
Supplementary Figure S1B
References
Supplementary Material
Please find the following supplemental material available below.
For Open Access articles published under a Creative Commons License, all supplemental material carries the same license as the article it is associated with.
For non-Open Access articles published, all supplemental material carries a non-exclusive license, and permission requests for re-use of supplemental material or any part of supplemental material shall be sent directly to the copyright owner as specified in the copyright notice associated with the article.
