
Abstract
Aim:
To use electronic health record (EHR) data to develop a scalable and transferrable model to predict 6-month risk for diabetic ketoacidosis (DKA)-related hospitalization or emergency care in youth with type 1 diabetes (T1D).
Method:
To achieve a sharable predictive model, we engineered features using EHR data mapped to the T1D Exchange Quality Improvement Collaborative’s (T1DX-QI) data schema used by 60+ U.S. diabetes centers and chose a compact set of 15 features (e.g., demographics, factors related to diabetes management, etc.) to yield “explainable AI” predictions for DKA risk on a 6-month horizon. We used an ensemble of gradient-boosted, tree-based models trained on data collected from September 1, 2017 to November 1, 2022 (3097 unique patients; 24,638 clinical encounters) from a tertiary care pediatric diabetes clinic network in the Midwest USA.
Results:
We rank-ordered the top 10, 25, 50, and 100 highest-risk youth in an out-of-sample testing set, which yielded an average precision of 0.96, 0.81, 0.75, and 0.70, respectively. The lift of the model (relative to random selection) for the top 100 individuals is 19. The model identified average time between DKA episodes, time since the last DKA episode, and T1D duration as the top three features for predicting DKA risk.
Conclusions:
Our DKA risk model effectively predicts youths’ relative risk of experiencing hospitalization for DKA and is readily deployable to other diabetes centers that map diabetes data to the T1DX-QI schema. This model may facilitate the development of targeted interventions for youths at the highest risk for DKA. Future work will add novel features such as device data, social determinants of health, and diabetes self-management behaviors.
Introduction
Diabetic ketoacidosis (DKA) is an acute, potentially life-threatening complication of diabetes and a major cause of emergency hospitalization for individuals with type 1 diabetes (T1D). 1,2 In a Scottish cohort with T1D, DKA or diabetic coma caused the greatest proportion of deaths among the youth and adolescents. 3 DKA also poses significant economic consequences at the individual and health system level. 4
Despite substantial advances in diabetes-related pharmacological, technological, and educational tools, preventing DKA remains challenging. 5,6 To provide just in time interventions that might prevent DKA, it is essential to first identify those at the highest risk. DKA risk is associated with multiple nonmodifiable factors (e.g., age, sex, race, ethnicity, etc.) but also with many modifiable factors (e.g., elevated hemoglobin A1c [HbA1c], previous DKA events, etc.). 6 As such, Ehrmann et al. proposed a conceptual model to identify DKA risk with the objective to intervene on high risk individuals by targeting modifiable risk factors and tailoring interventions around nonmodifiable risk factors to account for the person’s age, sex, and social/cultural preferences. However, the relative importance of individual risk factors and how they may vary among different risk groups remains unknown.
Machine learning (ML) and artificial intelligence (AI) offer innovative strategies to predict health outcomes such as DKA. 7,8 However, to date, DKA prediction models using ML have not been implemented in health systems to forecast risk on an active patient population. Therefore, we aimed to develop an ML model to predict a youth’s risk of experiencing DKA within 180 days of a pediatric T1D clinic visit. Our design requirements for developing a clinically deployable and scalable model were that (i) the model must augment existing workflows and clinical decision-making processes, (ii) the model predictions must be “explainable,” and (iii) the model must be readily transferrable to other diabetes centers.
Methods
Developing a DKA risk model for youth with T1D that can be used in the clinic
Adoption of health information technologies in health care, including ML models, remains challenging, despite the promise that these technologies have for focusing limited clinic resources on the patients most in need of intervention. Key adoption challenges include the involvement of stakeholders, clinicians, and end-users in development, fostering model trust, and reducing adoption costs associated with developing electronic heath record (EHR)-based data pipelines. 9,10 Therefore, we adopted a model development approach that incorporated clinician insight and guidance when defining the outcomes, validating the data inputs and model output, and identifying methods for handling missing data.
To facilitate explainable predictions, we used a small, yet important, feature set mapped to established modifiable and nonmodifiable DKA risk factors. We also used model-agnostic Shapley (SHAP) values to analyze feature importance and explain individual predictions.
Data source and feature selection
Our dataset, curated from EHR data collected from a network of pediatric diabetes clinics in the Midwest USA, contained data from 24,638 T1D clinic visits for 3097 individuals aged 0–21 years who received care between September 5, 2017, and November 1, 2022. Clinical data were coded and collected in an institutional review board—approved research data repository (Children’s Mercy Human Research Protections Program IRB #11120355) that met the requirements for a waiver of written informed consent. There was no study protocol or study registration associated with this analysis. There was no patient involvement with study design. This work followed the TRIPOD+AI reporting checklist. 11
We classified people as having T1D by the presence of T1D diagnosis codes, lab results, and a lack of cystic fibrosis diagnosis codes (see Supplementary Appendix S1 [includes Supplementary Table S1] for algorithm specifics). To promote future dissemination to other diabetes centers, we trained our model using 15 features derived from data mapped to the T1D Exchange Quality Improvement Collaborative (T1DX-QI) data specification (Table 1). Research has also identified many of these features as significant DKA risk factors. 6 The only inclusion criteria were a T1D diagnosis and at least one diabetes clinic visit to obtain feature data. No exclusion criteria or look-back period were used.
Features Used in the Diabetic Ketoacidosis Risk Prediction Model
Relevant T1D exchange quality improvement collaborative (T1DX-QI) data specification descriptors and field names are also shown. DKA, diabetic ketoacidosis.
Self-reported race and ethnicity were included as crude approximations for social determinants of health.
Race categories were condensed to Black, Other, Unknown, or White.
NIH: National Institutes of Health.
HL7: Health level 7.
Ethnicity categories were Hispanic/Latino, Not Hispanic/Latino, Unknown.
CGM: continuous glucose monitor.
Each record in the feature set was centered around a diabetes clinic encounter. The T1DX-QI data specification does not explicitly identify encounters as diabetes clinic encounters (versus other types of encounters, e.g., a primary care provider visit). Therefore, encounters were classified as diabetes clinic encounters when any of the following observations/results were present: T1D diagnosis date; frequency of continuous glucose monitor (CGM) sensor changes; mean blood glucose (calculated from blood glucose meter results); documented review of either blood glucose, CGM, or pump device report since the last visit; insulin administration regimen; daily basal insulin dose; or daily bolus insulin dose. Once the diabetes clinic encounters were identified, the T1DX-QI data were transformed to yield a ML-ready feature table, where each row corresponded to an encounter and each column was a feature/outcome (Table 1). See Supplementary Appendix S2 (includes Supplementary Figure S1) for an explanation of the transformation process.
Data cleaning and encoding
Missing data were imputed in different ways, depending on the specific field affected and the length of time that the data were missing. Fields such as birth date and T1D diagnosis date could only take on a single, unique value for each person. Thus, we used mode imputation for those fields. If a person’s record contained multiple, differing values for any of these fields, nonmode values were replaced by the mode.
For all other fields, prior data were forward-filled (by person) when a data element was missing but was documented within 120 days of a prior encounter. All remaining missing data were then imputed using either the population median (for numerical data) or the population mode (for categorical data).
Next, derived variables such as age and T1D duration were computed. If someone has never experienced DKA (or only experienced one DKA for the average time between DKA feature), features derived from DKA event dates, time since the last DKA, and average time between DKA events, were linearly imputed with their T1D duration + 2 years. We selected this imputation strategy so that people who never experienced DKA could still be included in the dataset, as they are likely strongest representations the lowest risk group. These novel features remain correlated with T1D duration, helping us distinguish between individuals with different DKA risk levels. For example, someone recently diagnosed with T1D who never experienced DKA might have a different risk profile than someone with a long history of T1D without experiencing DKA. Two years was chosen based on an operating assumption that a DKA episode occurring 2, 5, or 8 years prior would exhibit similar influences on risk.
All categorical features were encoded as numbers via one-hot encoding, which converts each category into an individual binary feature and enables the model to process categorical data as a numerical input. 12 All numerical data were standardized to center the means around zero and scaled to unit variance to help with model training. Data near T1D diagnosis were not handled any differently from data further from T1D diagnosis.
Classifying DKA events
To identify diabetes clinic encounters that occurred within 180 days of subsequent DKA events (including those at diagnosis), we needed to first identify DKA event dates. Then, we referred to diabetes clinic encounters that had a DKA event occur within 180 days (i.e., subsequent to the visit) as qualifying diabetes clinic encounters (QDCE).
We identified DKA event dates by filtering for encounters that were assigned diagnosis codes associated with DKA (see Supplementary Table S2 for specific diagnosis codes and coding systems used) and that had encounter classifications of “inpatient,” “emergency,” and “daytime.” The “daytime” constraint was used to exclude any follow-up/education encounters associated with DKA codes. Note that if a person receives care at a variety of hospitals, DKA-related admissions might not be captured, depending on the extent that these data are shared between health systems. By comparing against the internal data of DKA events that were objectively confirmed using an alternate method (laboratory testing), we determined that the above strategy correctly identified QDCE with a precision of 0.96 and recall of 0.97. Accurate identification of DKA event dates also allowed for the calculation of the “days since last DKA” and “average time between DKA” features. DKA incidence is defined as the percent of QDCE. Out of 24,638 clinic encounters, 742 encounters (incidence = 2.9%) had ≥1 DKA event within 180 days. Correctly classifying QDCE is a highly imbalanced classification problem and strategies for how we handled imbalance are addressed in the model training and performance assessment section.
Model training and performance assessment
Our DKA risk model uses two methods for decision trees: XGBoost 13 and LightGBM 14 model, which are effective at handling imbalanced classification. The model was further fine-tuned by adjusting various model settings, referred to as hyperparameters. Each model was fine-tuned 150 times to find the best set of hyperparameters, which can substantially improve model performance and help prevent overfitting. 15,16 The specific hyperparameters optimized, optimization methods, and their final values are detailed in Supplementary Table S3. Predictions from the fine-tuned models were combined by taking a weighted average of the DKA risk probabilities from the two models, which increased the average precision of our predictions by approximately 1–2%. 17
The dataset was split into training, validation, and testing sets, with a 60%, 20%, and 20% split, respectively. The various sets were partitioned by person, so that all data for one person belonged in a single set. We chose this approach as it estimates a lower bound of model performance because predictions are made on people whose data were not present in model training. Sets were also balanced to ensure the DKA incidence was the same across each set. Training was done on the training set, hyperparameter tuning was evaluated on the validation set, and the final model performance was assessed on the testing set.
Model performance was assessed and monitored using the average precision (area under precision-recall curve) from precision-recall curves, which is recommended for heavily imbalanced data. 18 Precision-recall curves are useful because they assess the model’s ability to correctly identify positive cases, which are important when positive cases are rare. Although we also computed receiver operating characteristic (ROC) curves, they are not our primary performance metric due to the data imbalance. The area under the ROC curve (AUROC) metric can be misleading because it is more influenced by the correct prediction of common, but unimportant, true negatives than by the correct prediction of rare, but important, true positives. 18
After training, the testing set was risk-stratified by the trained model and performance metrics were computed for the entire testing set and from the top-N highest-risk individuals (n = 10, 25, 50, and 100). Computing performance metrics at these top-N mirrors how the trained model will be used in clinic. All metrics have 95% confidence intervals, reported as metric [lower bound, upper bound], computed using the confidenceinterval package in Python. 19
Lift charts are also computed to assess how effectively the model stratifies DKA risk across various population segments, relative to the DKA incidence. 20 For a given population segment, a lift value of 1 means the model is no better than random selection, whereas a lift value greater than 1 represents the fold-improvement for risk stratification. Lift scores are computed across entire testing sets and are also highlighted for the top 100 highest risk and at the DKA incidence. Finally, feature importance was estimated using SHAP values, which aim to explain predictions by estimating the degree to which a specific value of a feature contributes to the predicted probability of the outcome. 21
The value of our ML model comes from its ability to predict the relative risk of DKA rather than from perfectly predicting the likelihood of experiencing DKA. We arbitrarily selected breakpoints to report model performance for the 10, 25, 50, and 100 highest-risk individuals from the population. Rank ordering the highest risk individuals would theoretically allow a clinic to select the number of at-risk people it might be able to intervene on due to available resources. Stratification of the highest-risk individuals also allows characterization of model performance on more moderate-risk individuals, whose DKA risk may be more difficult to predict. Figure 1 graphically depicts the multistep process with how DKA risk is stratified and how DKA risk segments of the patient population are reported to the clinic.
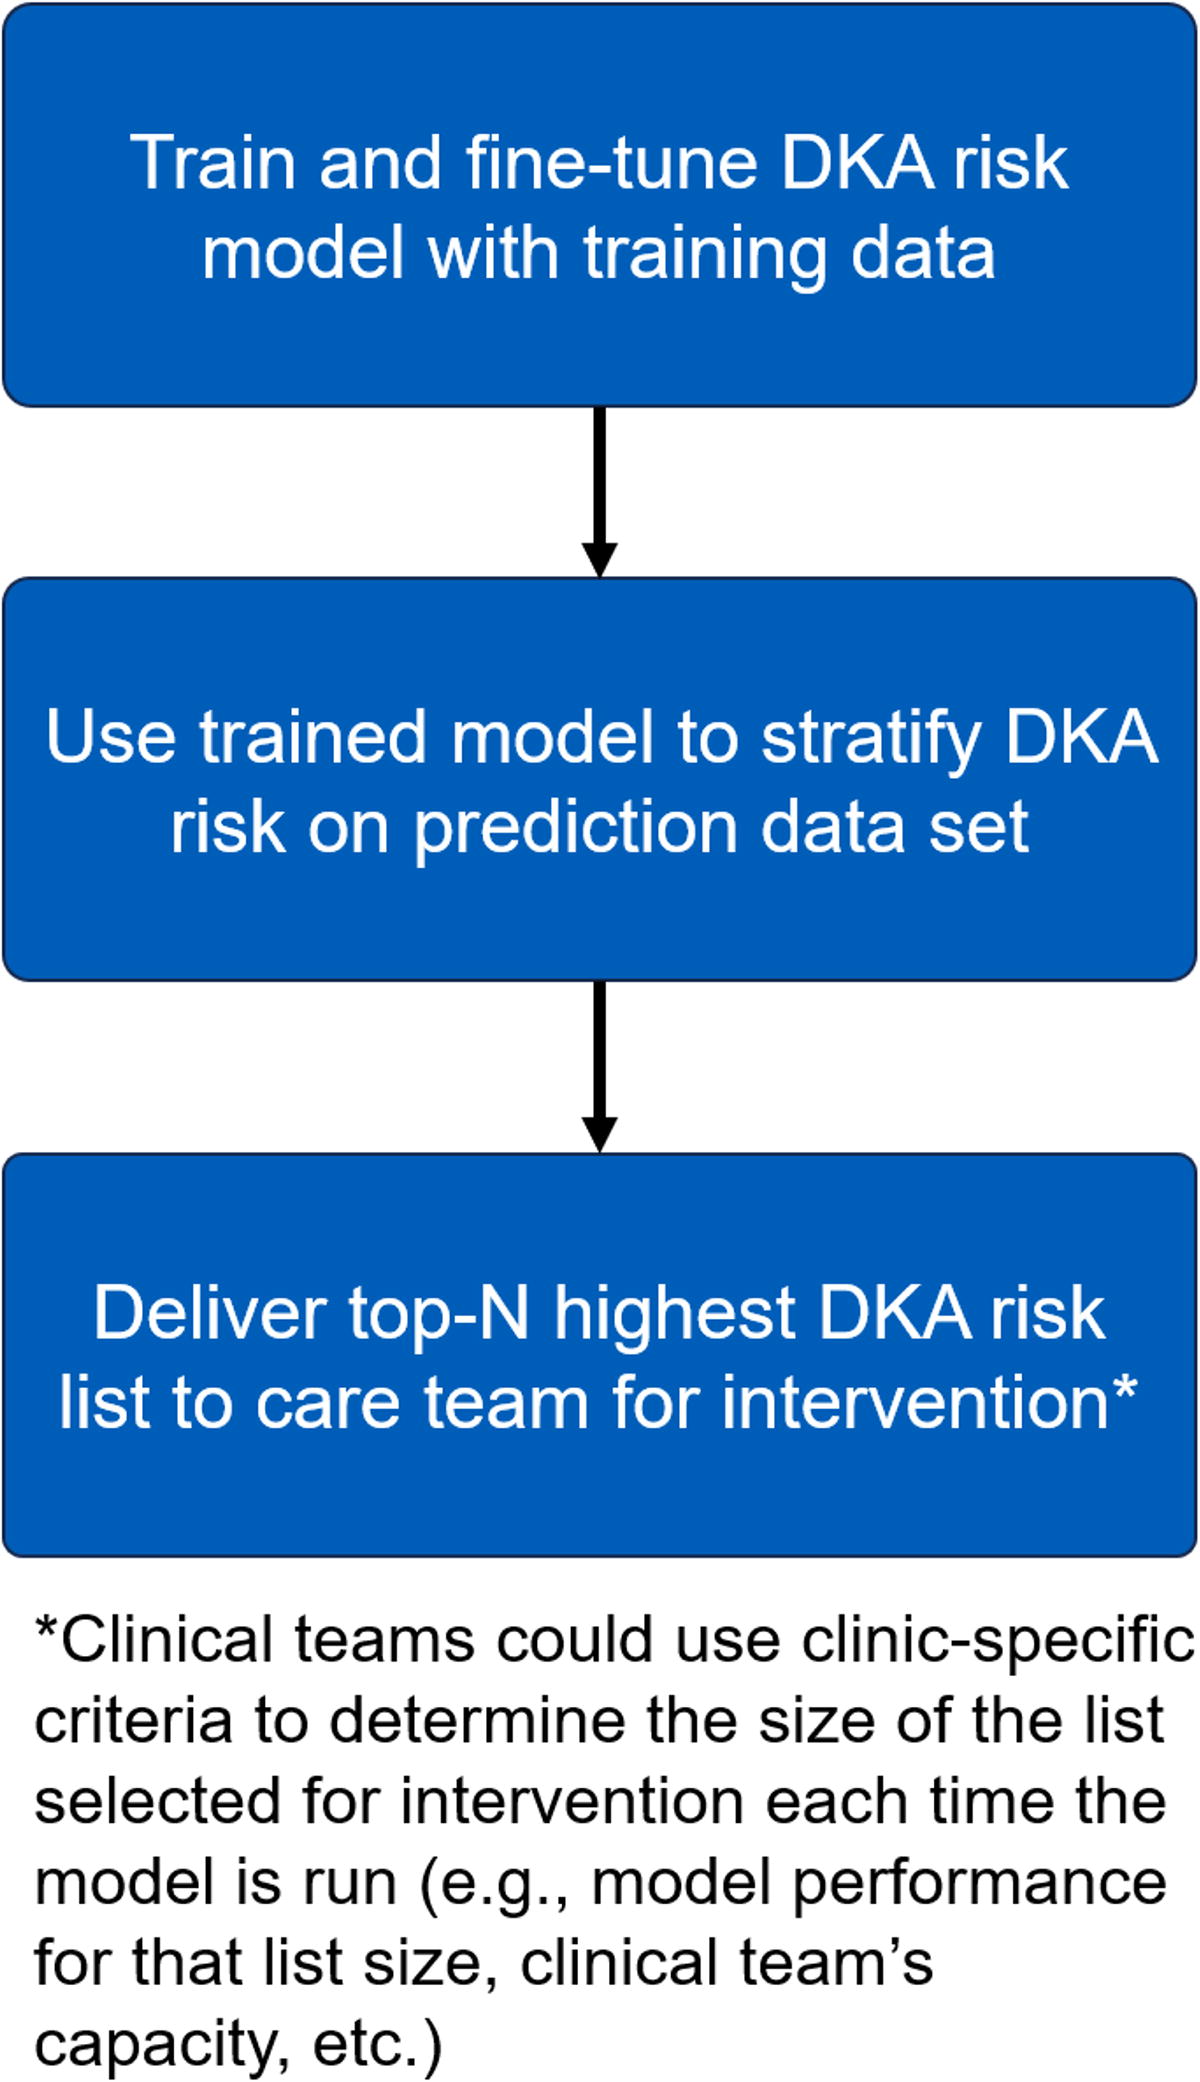
Schematic illustrating the multistep process of training the model, predicting DKA risk, and reporting DKA risk segments to the clinic. In this work, the prediction data set is the validation set. For a model deployed in clinic, the prediction data set might be individuals with a recent diabetes clinic visit, delivered each week. Note that this work only focuses on the first two steps. DKA, diabetic ketoacidosis.
Results
Sample demographics
We analyzed 24,638 clinic visits from 3097 individuals with T1D aged 0–21 years. Approximately 8% of all clinic visits were attended by Black youth, 8% by Hispanic youth, and 36.5% by youth who were on public insurance or were self-pay. Approximately 54% of clinic visits were attended by youth wearing CGM and 61.5% by youth on an insulin pump. Table 2 summarizes the demographic characteristics and diabetes technology usage for all clinic visits used in the training, validation, and test sets (Table 2). Characteristics across the training, validation, and testing sets are also shown in Supplementary Table S4.
Summary Statistics of the Data Used to Create the Train, Test, and Validation Sets for the Diabetic Ketoacidosis Risk Model
Numerical variables are reported as an interquartile range, median [25th percentile, 75th percentile], and categorical variables are reported as count (percent).
Model performance
The average precision of the DKA risk model for the whole population in the out-of-sample testing set was 0.419 [0.351, 0.494], which was significantly higher than the baseline DKA incidence of 2.9% (Supplementary Fig. S2a). The AUROC was 0.910 [0.884, 0.935], indicating the true positive rate increases more rapidly than the false positive rate does when the classifier threshold is varied (Supplementary Fig. S2b). The population confusion matrix (Supplementary Fig. S3) indicated the presence of a large number of predicted true negatives and a small number of false negatives because of class imbalance. Performance metrics across the training, validation, and testing sets are reported in Supplementary Table S5. The average precision value in the validation and testing set is about 27% lower than the average precision from the training set, likely because the validation and test sets only contain people not in the training set (as opposed to overfitting).
We hypothesized that when implementing this model clinically, diabetes care teams would likely rank-order individuals according to DKA risk, with the goal of intervening on the highest number of individuals their capacity would allow. Therefore, we examined model performance among the 100 individuals with the highest predicted risk for DKA. Compared with the model’s predictive performance over the whole population, model performance was significantly higher in individuals with the greatest risk of experiencing DKA within 180 days. We observed higher average precision in population segments more proximal to the top of a patient list rank ordered by DKA risk. The precision-recall curves for the top 10, 25, 50, and 100 highest-risk individuals in the testing set (≈DKA incidence, 2.9%) are shown in Figure 2. Confusion matrices for the top-N risk lists are shown in Supplementary Figure S4.
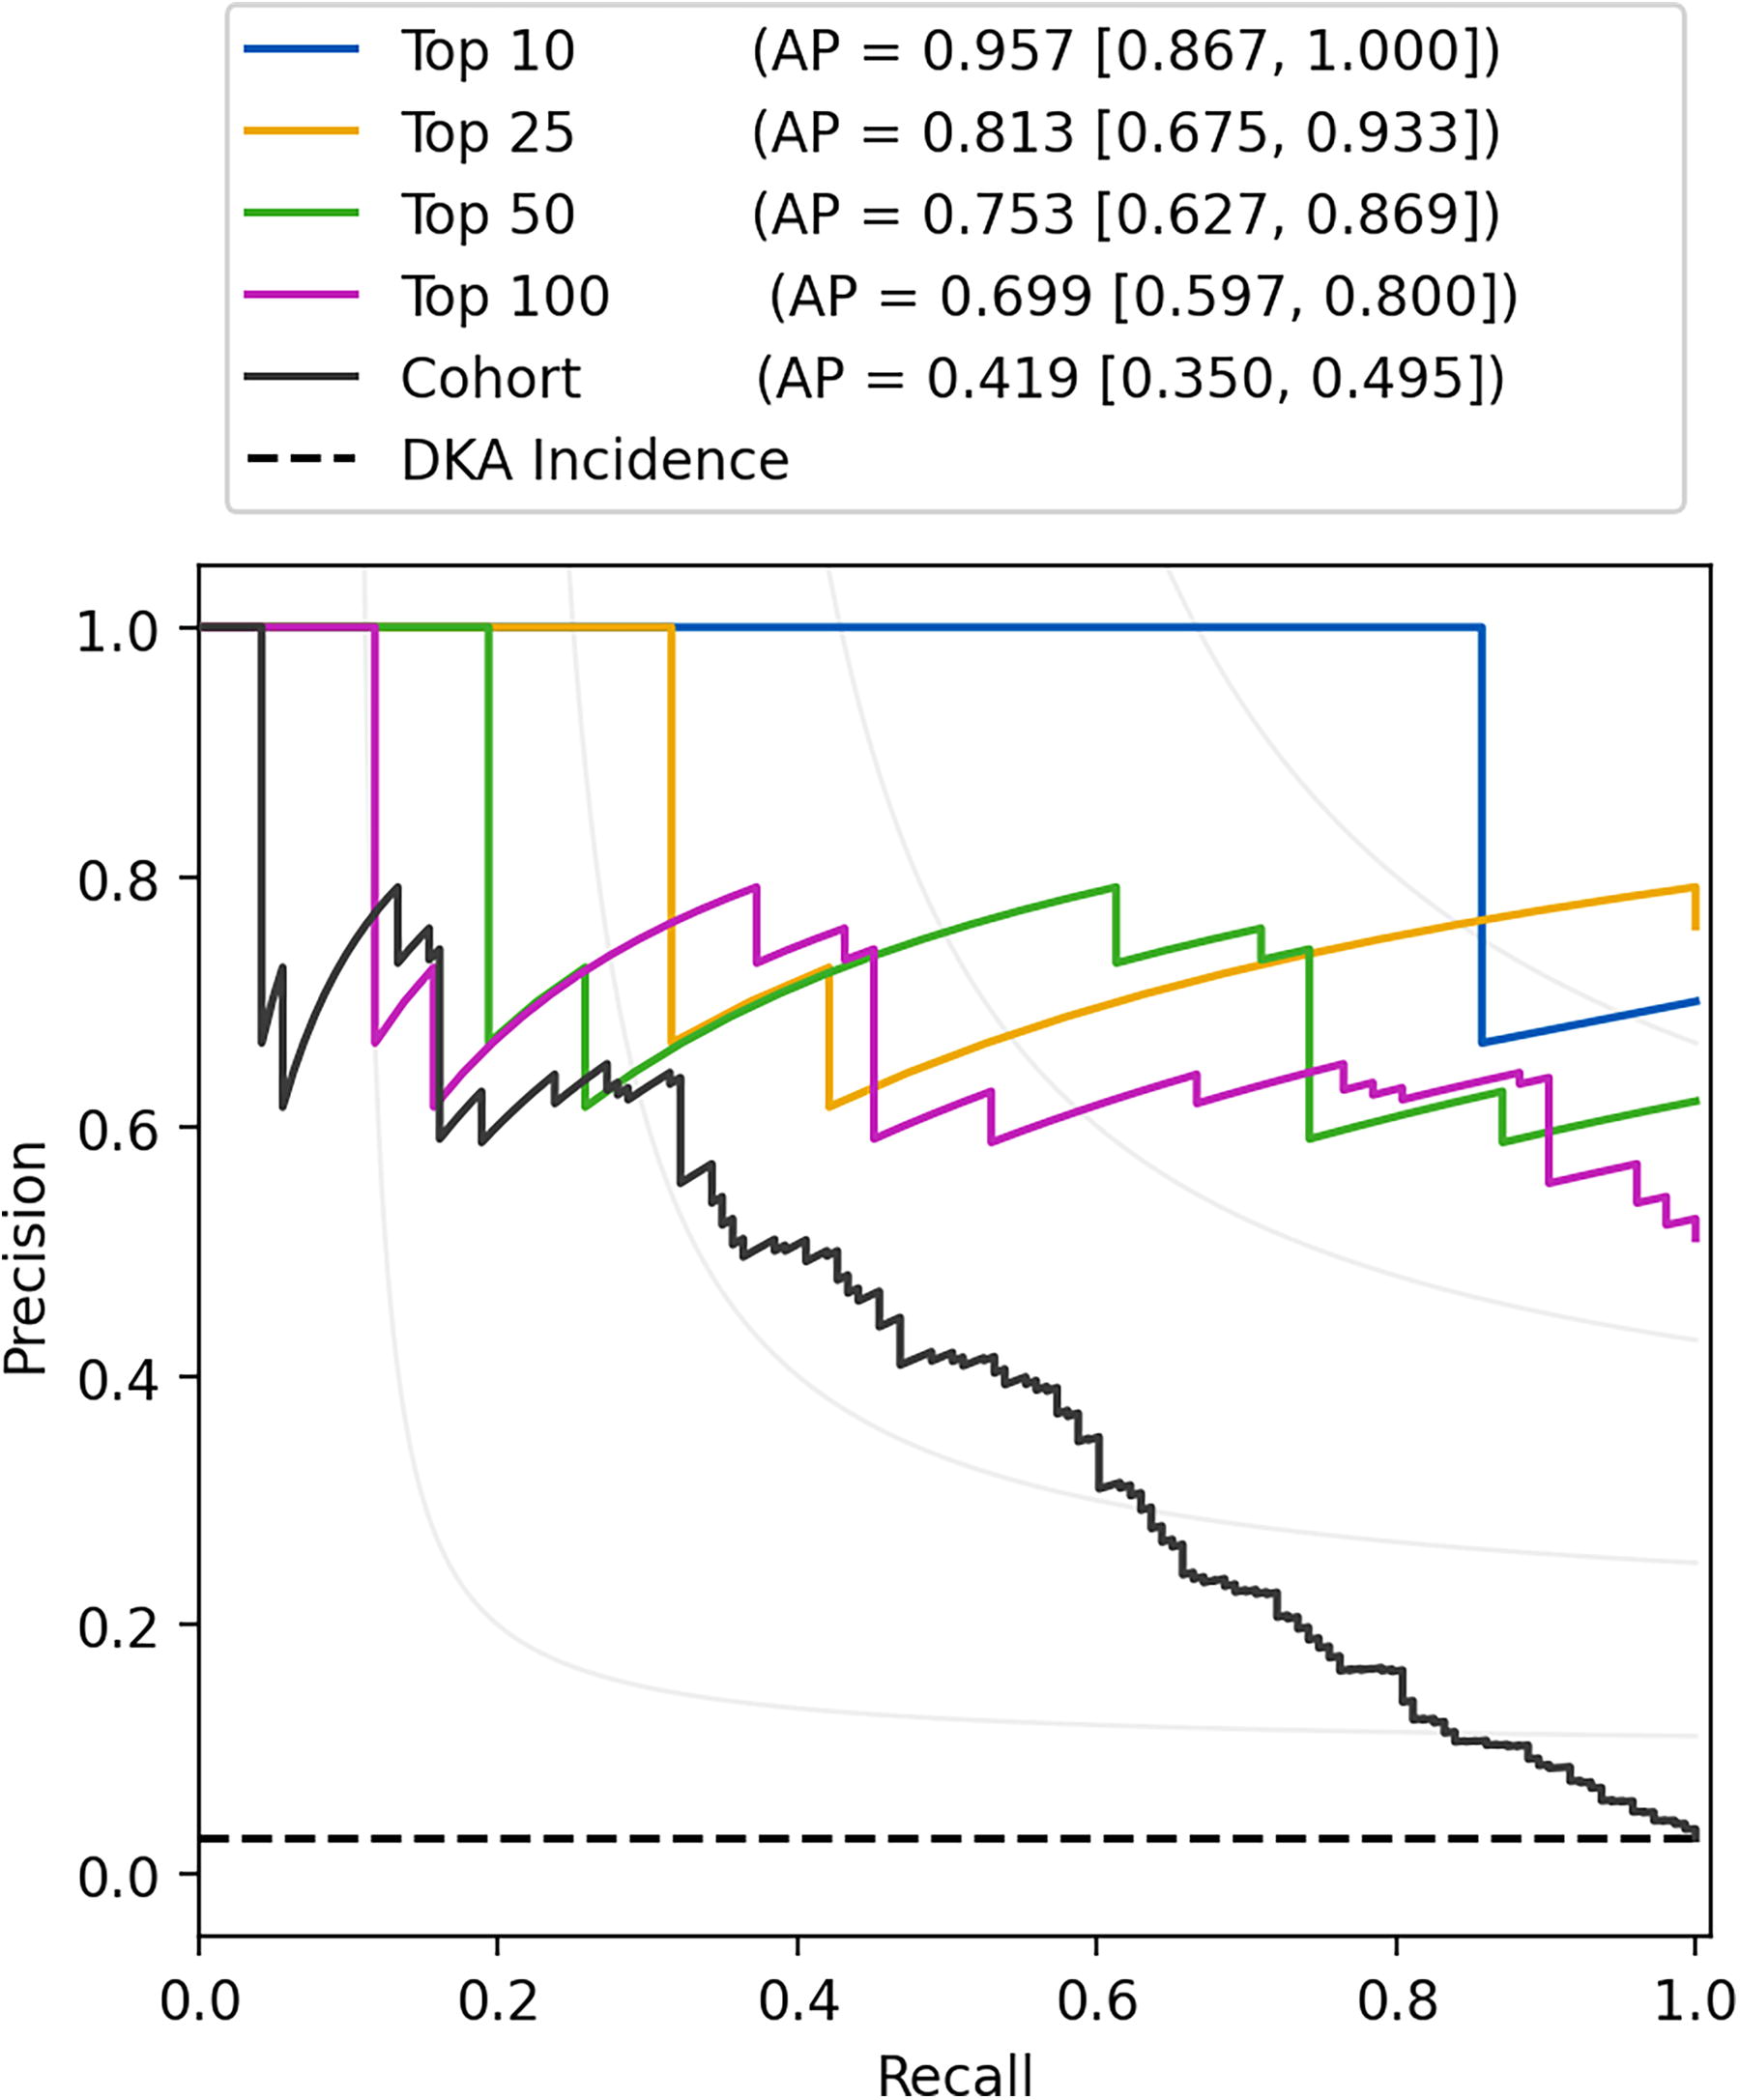
Precision-recall curves for the entire validation set (black) and the top 10 (blue), 25 (gold), 50 (green), and 100 (purple) highest-risk individuals in the validation set, as identified by the model. The dashed black line denotes DKA incidence. Note that for a perfect model, average precision (AP) = 1 for all population segments. Values in brackets represent 95% confidence intervals.
We next examined lift for the model. Point estimates of lift corresponding to the 100 highest-risk individuals and to the DKA incidence within the population (with lift values of 18 and 16, respectively) are shown in Figure 3. For our population, the model provides over an order of magnitude-fold risk enrichment. In contrast, the model offers very little improvement over random guessing for identifying people who will not experience DKA because that rate (∼97%) is already so high.

Lift chart for assessing model performance in the validation set. The bottom x-axis shows the fraction of the population, and the top x-axis reports the number of people. Points corresponding to the DKA incidence (blue circle) and the 100 highest-risk individuals (green triangle) are plotted for reference. The inset is a magnification of the lift chart for the top 10% of individuals in the validation dataset.
Feature importance
We examined SHAP values to characterize feature importance. The mean absolute SHAP values for each data feature for the top 100 highest-risk individuals in the testing set are depicted in Figure 4. For the highest-risk individuals, the average duration between DKA events was the dominant feature in predicting DKA risk. The next three most important features were time since the last DKA event, cumulative number of DKA events, and most recent HbA1c value. We also retrained the ML models using the same sets and training protocol but excluding the “average time between DKA” feature. The precision-recall curve for the whole population, precision-recall curves for the top-N highest-risk individuals, lift curves, and SHAP values are shown in Supplementary Figures S5, S6, S7. Depending on the metric used, we found that the “average time between DKA” feature improved model performance by approximately 2- to 3-fold, Supplementary Figure S6. For comparison purposes to a statistical approach, a logistic regression model was also trained using only the dominant “average time between DKA” feature, on all features, and on all features with varying regularization strengths (as a means to prevent overfitting by reducing the influence of unimportant features), Supplementary Table S6. Our ML model has a significantly higher average precision and AUROC value compared with all the LR models we trained.
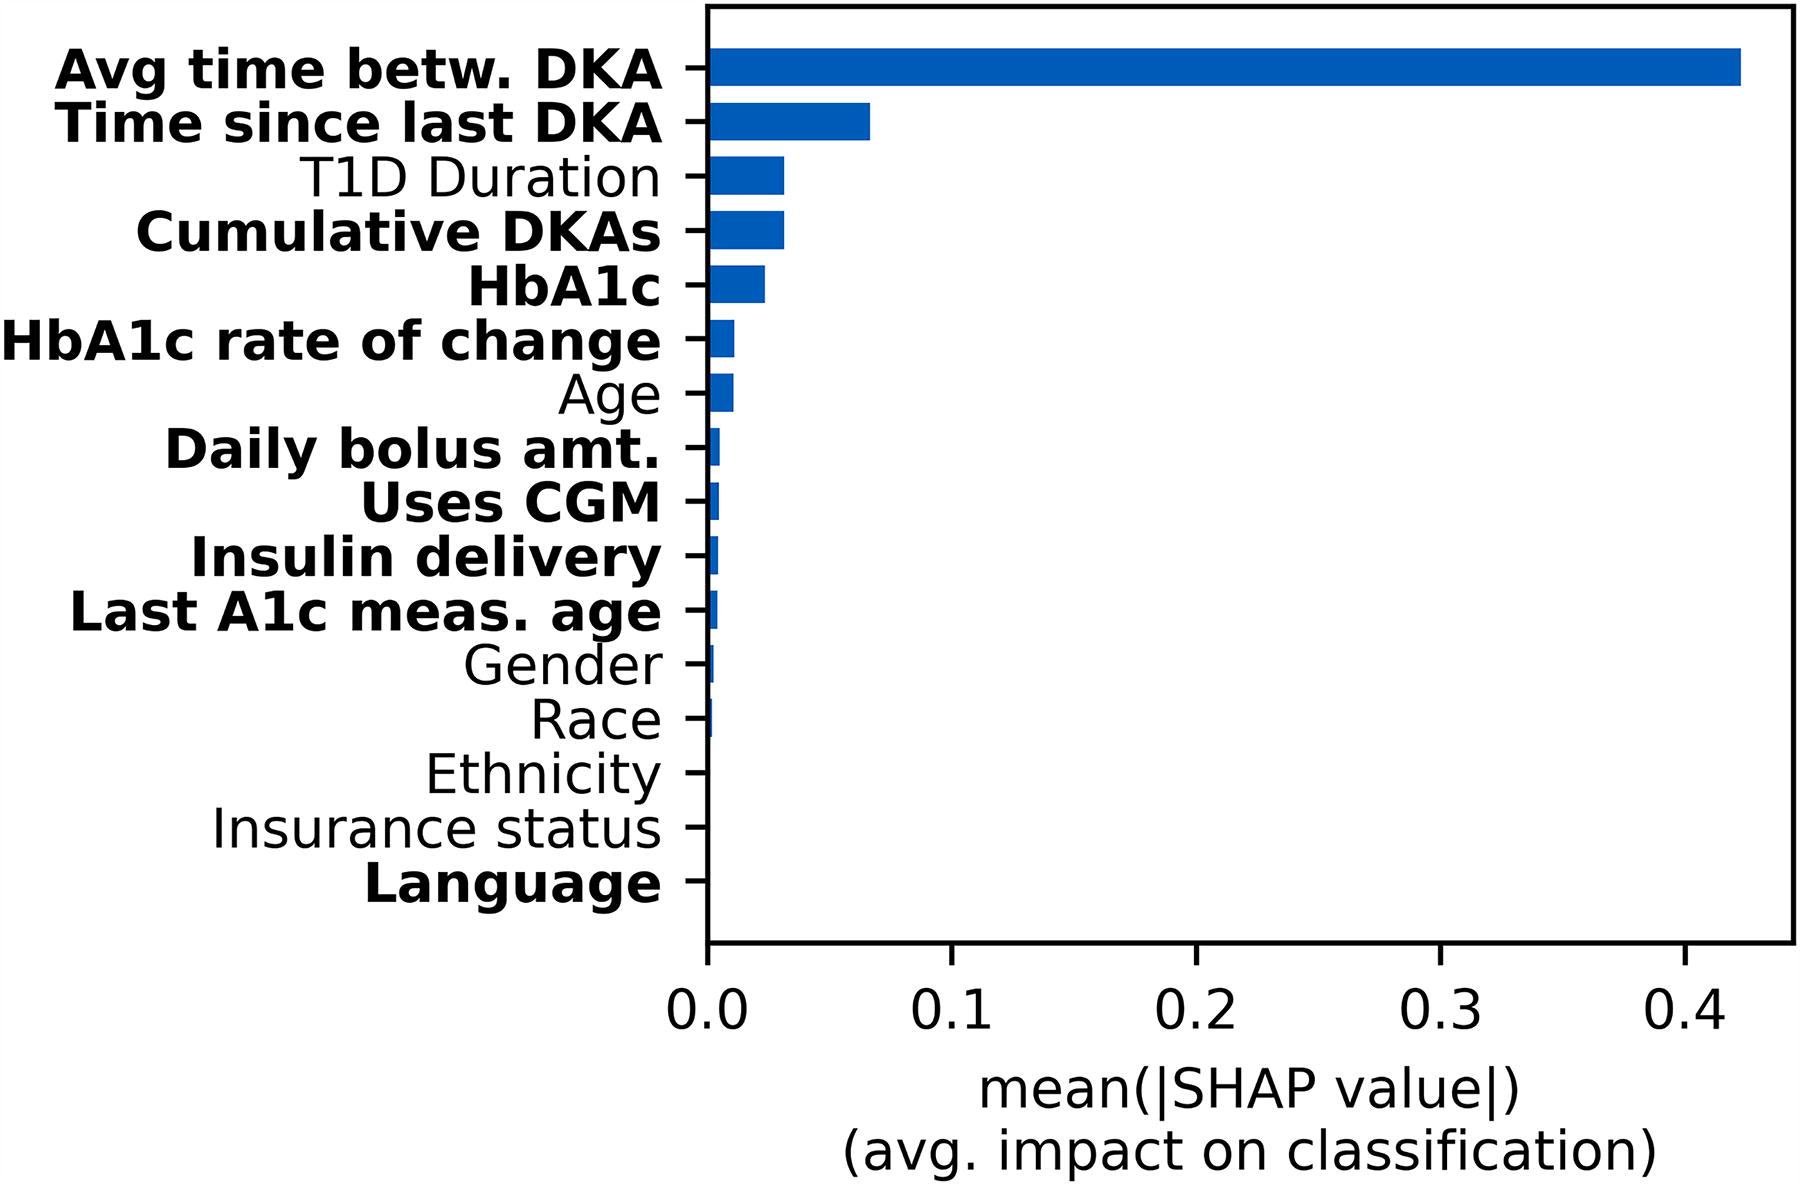
Mean absolute SHAP values for the 100 highest-risk individuals from the validation set. Modifiable features (risk factors) are bolded. Note that because the classification is binary, the feature importance towards predicting each class is symmetric. SHAP, Shapley.
SHAP values for the 100 lowest-risk individuals were also computed for comparison (Supplementary Fig. S8). Although the relative order of each feature was similar, the mean absolute SHAP values were generally smaller in the lower risk cohort. This suggests that SHAP values of each feature are generally closer to zero with lower variability. Indeed, this trend is observed when feature values of the four most important features are plotted against signed SHAP values for individual predictions of the top 100 and bottom 100 risk segments (Fig. 5). At the individual level (represented by the individual dots), a positive SHAP value indicated that the feature was DKA risk-increasing for that individual, whereas a negative SHAP value indicated that the feature was DKA risk-reducing. Larger-magnitude SHAP values have a larger impact on DKA risk than smaller-magnitude SHAP values.

SHAP value dependence for the 4 most important features and their specific values. Results are also split by the 100 highest-risk (red) and 100 lowest-risk (blue) individuals in the validation set. The dashed line is present to emphasize the boundary between risk increasing and risk reducing features. The order of feature importance increases left-to-right and top-to-bottom.
Discussion
We report the development, validation, and testing of the first explainable ML model that forecasts the 180-day risk of hospitalization or emergency care for DKA in youth with T1D. We found that an ensemble approach using XGBoost and LightGBM models in combination with 16 data features commonly available to pediatric and adult diabetes centers performed better than other approaches. We demonstrated model validity by first using model output to develop a list of individuals rank-ordered by risk for DKA within 180 days, then by evaluating the model’s performance across the entire observed population as well as among the 100 individuals with the highest predicted probability of DKA. We found that the model exhibited acceptable levels of precision, recall, and accuracy for the entire test cohort, as well as for varying numbers of individuals from the cohort with the highest predicted probabilities of DKA (i.e., n = 10, 25, 50, 100). We also found that when we focused on the predicted risk for the top 10–100 individuals in the population (top 0.2% to 2.0%), the model achieved significant lift, indicating that the approach succeeded in creating a risk-enriched cohort with 24-to-18-fold higher probability of DKA-related hospitalization within 180 days compared with the general population, respectively.
Prior research detailed several approaches to predict DKA-related hospitalizations in youth and adults with T1D using methods, ranging from simple logistic regression models with three features to deep learning models with hundreds of features. 7,8,22,23 The most similar prior work is from Williams et al., where 180-day DKA risk is predicted on almost the same cohort. The precision and recall of the 100 highest-risk people identified by our model is nearly two-fold higher than their precision and recall of the 80 highest-risk people identified by their model, respectively. In addition, our model is simpler and more explainable as it only contains 16 carefully chosen features compared with the 500+ features present in the model developed by Williams et al. The present model improves upon that prior research by 1) forecasting DKA risk in a shorter, more actionable 6-month (versus 12-month) time frame, and 2) leveraging a two-step approach that delivers clinical teams a simple list of patients for intervention at an interval of their choosing, reducing the burden on clinicians to interpret how to respond to a metric like a risk index or probability. Table 3 summarizes and compares various performance metrics of our model against other DKA models.
Comparisons of Performance Metrics for Similar Models
A value of “-” indicates that the metric was not computed. Values in brackets correspond to 95% confidence intervals.
Schwartz et al. developed a logistic regression model with three features (most recent HbA1c value, type of health insurance, and whether at least one DKA episode occurred for a person in the last 2 fiscal years) to predict DKA-related hospital admission in the subsequent 12 months for youth with T1D. Training and test sets were split by fiscal year, where the test set is 1 fiscal year ahead of the training set. Metrics originate from the test set. 22 T1D, type 1 diabetes.
Mejia-Otero et al. used a logistic regression model containing multiple features (admission for DKA in the prior year, most recent HbA1c value, and insurance status) to predict 12-month DKA risk. Metrics originate from picking a classification threshold that has optimal predictive power. 23
Williams et al. published a deep learning-based method for predicting hospital admissions for DKA in youth that used all possible data available from the EHR. Metrics originate from the top-80 highest risk individuals from the partial out-of-sample validation set. 8
Li et al. tested various ML models in a cohort of adults with T1D to predict DKA. Note that the forecasts were not time-bound in that cohort and the observation windows for each individual were variable. Metrics originate from the XGBoost-based DKA model. 7 ML, machine learning.
The metric(s) used to evaluate a predictive algorithm’s performance should be selected after careful consideration of the model’s application in real-world settings. For our model, predicting the correct risk/classification of experiencing DKA is secondary to correctly predicting a person’s risk relative to everyone else in the prediction population. The rationale for this approach is that when this model is clinically deployed, as long as a person’s risk is sufficiently high, that person will enter the top-N list and be selected by the health care team for more intensive intervention. Using this approach, the size of the rank-ordered list that is reviewed by the health care team on a regular basis can be determined based on the clinic’s capacity to offer an intervention for those high-risk individuals. For the 100 individuals (2.0% of the cohort) in the testing set identified by the proposed ML model, 59 of the 100 highest-risk people identified by the model actually experienced DKA during the next 180 days. DKA events experienced by people placed in the top 100 highest risk segment accounted for 57% of all DKA events experienced in the testing set. This predictive model can thus efficiently identify individuals who might benefit from more intensive management by the health care team.
Feature importance and risk
Many features identified as important by their SHAP values were similar to established risk factors in the literature. To our knowledge, no prior study has quantitatively assessed the importance of average duration between DKA events on risk for future DKA episodes—which was, by far, the most important feature in our model. The importance of this feature may be because it is effectively the historical analog of the future outcome being predicted; it also condenses a person’s prior DKA history into a single data point. Previously, only recency of prior DKA events and total number of DKA events during an observation period have been reported as significant, modifiable risk factors. A prior study found that, relative to adults who had not experienced a DKA event in the past year, those who had at least one DKA event in the last year also had a nearly 9.5-fold higher risk of experiencing another DKA event during the following year. 24 Average time between DKA events is thus a novel and important risk factor.
The next most important risk factors (e.g., T1D duration, cumulative DKA events, and HbA1c), have also been previously identified as strong risk factors for DKA. A previous study found that, in an adult population, DKA incidence followed an inverse U-shaped trend with T1D duration, similar to the trend we observed with DKA risk and T1D duration (Fig. 4). 25 Multiple studies have found that children and adolescents with a history of DKA events after T1D diagnosis are at an increased risk of experiencing a future DKA event. 24,25 DKA risk has also been observed to scale exponentially with HbA1c. 25 One study found that individuals with an HbA1c >9.0% were 8-times more likely to experience DKA than those with an HbA1c <7.5%. 26
The other features we examined-insurance status (a proxy for socioeconomic status), race, and age-are also consistent with previously recognized DKA risk factors. 6 Features such as CGM usage, ethnicity, and language had small mean absolute SHAP values, most likely because they could be correlated with other important features such as HbA1c; and regularization is used during model training (Supplementary Fig. S9). While Li et al. also performed a feature importance analysis for their XGBoost-based model, direct comparison with our findings is precluded by the different analysis techniques used in each study. Surprisingly, the only common feature in the top 10 most important features for both models is HbA1c. However, important features from other models that Li et al. studied (e.g., logistic regression, LASSO, distributed random forest, and feedforward network) did overlap with important features in our model (viz., insurance status, age, race, and T1D duration).
SHAP values for some features (e.g., average time between DKA events and cumulative number of DKA events) clustered in different regions for low-risk and high-risk individuals (Fig. 4). For some features, SHAP values also followed slightly different trends in low-risk individuals. For example, T1D duration values for high-risk individuals grow and peak around 2.5–5 years before decreasing; but the same T1D duration values for low-risk individuals’ level off and do not affect DKA risk. Low-risk individuals are also generally observed to have lower variability in SHAP values (DKA risk), particularly in the time since last DKA and cumulative DKAs features. Even more noteworthy, the results suggest that DKA risk for individuals in different risk groups is affected differently by specific feature values (Fig. 4). The difference is most apparent in the “average time between DKA events” feature at a value around 900 days: such a feature value for a low-risk individual significantly decreases DKA risk, whereas the same value for a high-risk individual significantly increases DKA risk by a similar magnitude. These results suggest that risk is determined by a complex interplay among numerous factors. While such relationships can be readily identified by ML, they may not necessarily be apparent to humans, even those with deep clinical expertise. Understanding the ways in which modifiable risk factors differentially affect individuals in various risk groups may facilitate the development of more tailored and impactful interventions to reduce DKA risk.
Clinical importance
Our model is significant because it will enable diabetes care teams to identify a population of youth with T1D enriched for those who are the most likely to experience DKA within the next 6 months. Our model can be applied to a diabetes center’s T1D population at a regular frequency (e.g., monthly) to identify youth who are candidates for behavioral or care delivery interventions that are designed to prevent hospital admission for DKA. Interventions such as structured diabetes education programs are also associated with a reduced risk of DKA. 24,27,28 Adoption of diabetes devices has also been associated with reduced hospitalization due to DKA. 29,30 However, additional work may be needed to assess their efficacy of reducing DKA episodes, specifically for people who are at high risk of experiencing DKA in the next 6 months. These interventions are standard practices at U.S. tertiary care diabetes centers. However, such interventions are likely insufficient for a subset of youth facing particular obstacles to self-management such as limited financial resources, transportation barriers, housing insecurity, food insecurity, lack of parental supervision, or lack of social support. One intervention that has demonstrated effectiveness for preventing hospitalization among youth with a high frequency of hospital admissions is the Novel Interventions for Children’s Health (NICH) program. The NICH program can improve health through lower HbA1c levels and reduced frequency of hospitalization due to DKA, potentially reducing the annual cost of care by reducing the frequency of costly DKA episodes. 31 –34 A limitation of that intervention today is that it has only been applied to youth with a history of recurrent hospital admissions. Because our model can identify youth at risk for a near-term DKA admission regardless of whether they have been hospitalized recently, our model could enhance the clinical- and cost-effectiveness of interventions such as NICH by directing resources to a larger group that is highly enriched for individuals who will experience a near-term DKA episode. In future work, our model and workflow could also be used to help assess novel interventions. Examples include mobile applications that provide decision support during extreme hyperglycemia or ketosis due to sick days or interventions that promote healthy ketone monitoring habits. 35 –37 However, the efficacy of such interventions requires further study.
Our model is both practical to deploy and actionable. It was developed in close collaboration with clinicians to enhance the likelihood of its clinical utility. We collaborated with our diabetes center’s Quality Improvement (QI) team to learn the current clinical workflow for addressing youth perceived to be at high risk for hospital admission and to determine how a predictive ML model could enhance that workflow. Before beginning model development, we hypothesized that an ML model could increase efficiency and consistency by automatically predicting and ranking DKA risk, thereby allowing the clinical and QI teams to focus their time on offering, delivering, and monitoring the effectiveness of clinical interventions delivered to youth they perceive most vulnerable. We further hypothesized that an explainable ML model could help foster trust among clinicians and would potentially facilitate the development and adoption of tailored interventions that target individually modifiable risk factors. As a next step, we propose that an interactive population health dashboard displaying rank-ordered lists of patients at risk of hospital admission for DKA would be the most effective approach for clinical teams to visualize model output, to understand the drivers of risk, and to manage workflows related to patient interventions designed to reduce the likelihood of hospitalization.
Strengths and Limitations
The major strength of the model is that it eliminates the previously time consuming process of identifying those at the highest risk of experiencing DKA by providing real-time predictions of DKA risk. The model is also trained on data mapped to the T1DX-QI data specification, allowing for it to be transferred or used by other centers who map their data to that specification. Most features required low amounts of imputation. However, one factor likely limiting our model’s performance was the small set of features used to model various risk factors. We opted to construct a simple model using only data that were readily available in the T1DX-QI data specification and that we believed to be the most important for predicting DKA risk to facilitate the development of a transferrable model. Inclusion of data that reflect the presence of other previously identified risk factors for DKA—for example, data from continuous glucose monitors and insulin pumps, deprivation indices from geocoded data (i.e., proxies for socioeconomic factors), 38 –40 data indicating the presence of psychiatric comorbidities, 41 –43 and the level of engagement in diabetes self-management habits 44 —could improve model performance. Other features found important in models developed by Li et al. (e.g., non-DKA hospitalization, acute infection, and additional lab results) could also be valuable additions to our model. Our model was also trained on a population in the Midwest USA. Future work will validate the model on populations containing different demographics using data from the T1DX-QI data registry. Another limitation of our model is we exclusively studied a pediatric population. Given that trends in glycemic levels are known to differ in youths versus adults with T1D, our findings might not generalize to an adult population. However, our model training protocol and analysis could be performed on data from an adult population. While this work is primarily focused on DKA risk stratification and identifying important risk factors, further study is also needed to best tailor interventions based on modifiable risk factors—especially when risk factors related to past DKA episodes are important. In the future, new features could include both general risk-taking behaviors (e.g., alcohol use, tobacco use, and drug abuse) and diabetes-specific risk-taking behaviors (e.g., skipping insulin doses, ignoring diabetes device alarms). 45,46
Conclusions
We developed an explainable ML model to predict the 180-day risk of hospitalization or emergency care due to DKA among youth with T1D. This study highlights the potential for using data that have been mapped to a standard, common data specification to facilitate the cost-effective adoption of a model and associated workflows at other health care centers. In our model, the most important feature for predicting DKA risk was average days between DKA events, which is a novel feature. Whether a feature enhances or mitigates risk for DKA depends on an individual’s latent risk, suggesting that many risk factors for DKA are intricately related with each other. Operationally, our DKA risk model was able to automate the process of identifying individuals at risk of DKA. This explainable model enables our QI team to offer interventions tailored to address individuals’ most risk-increasing, modifiable risk factors for DKA.
Footnotes
Acknowledgments
The authors thank Harpreet Gill for providing cloud computing support. The authors thank Kelsey Panfil, PhD, for stimulating discussions.
Authors’ Contributions
C.V.: Methodology, software, validation, investigation, data curation, formal analysis, writing—original draft, visualization. B.L.: Methodology, writing—review and editing, resources; M.B.: writing—review and editing, data curation. E.M.T.: Writing—review and editing. D.D.W.: Writing—review and editing. A.K.: writing—review and editing. A.C.: Writing—review and editing. S.R.P.: Writing—review and editing. R.Y.S: Writing—review and editing. J.K.: Writing—review and editing. M.A.C.: Writing—review and editing, supervision, conceptualization, funding acquisition.
Data Availability
The data that support the findings of this study are available from the corresponding author, M.A.C., upon reasonable request.
Author Disclosure Statement
M.A.C. receives consulting fees as Chief Medical Officer for Glooko, Inc. and receives research support from Abbott Diabetes Care and Dexcom. Other authors have no conflicts of interest related to this work.
Funding Information
C.V., B.L., M.B., E.M.T., D.D.W., and M.A.C were funded by the Leona M. and Harry B. Helmsley Charitable Trust grant G-2008–04043.
Supplementary Material
Supplementary Figure S1
Supplementary Figure S2
Supplementary Figure S3
Supplementary Figure S4
Supplementary Figure S5
Supplementary Figure S6
Supplementary Figure S7
Supplementary Figure S8
Supplementary Figure S9
Supplementary Table S1
Supplementary Table S2
Supplementary Table S3
Supplementary Table S4
Supplementary Table S5
Supplementary Table S6
References
Supplementary Material
Please find the following supplemental material available below.
For Open Access articles published under a Creative Commons License, all supplemental material carries the same license as the article it is associated with.
For non-Open Access articles published, all supplemental material carries a non-exclusive license, and permission requests for re-use of supplemental material or any part of supplemental material shall be sent directly to the copyright owner as specified in the copyright notice associated with the article.