




Abstract
Background:
Early identification of individuals at high risk for type 1 diabetes (T1D) is essential for timely intervention. Islet autoantibodies (AB) and continuous glucose monitoring (CGM) reveal early signs of glycemic dysregulation, while T1D genetic risk scores (GRS) further improve disease prediction. We use CGM data and T1D GRS to develop an AB classifier (1 AB vs. ≥2 AB) and predict early T1D risk.
Methods:
Thirty-nine AB-positive (18 with 1 and 21 with ≥2 AB) healthy relatives of T1D (mean age 22.1 ± 11.1 years, HbA1c 5.3 ± 0.3%, body mass index 24.1 ± 5.8 kg/m2) were enrolled in a National Institutes of Health’s (NIH) TrialNet ancillary study. Participants wore CGMs for a week and consumed three standardized liquid mixed meals (SLMM). Post-SLMM CGM glycemic features and T1D GRS were used in a linear support vector machine (SVM) model with recursive feature elimination (RFE) for AB classification, evaluated via fivefold cross-validation using the receiver operating characteristic and precision-recall area under the curve (AUC-ROC/PR).
Results:
Significant differences between the AB groups were observed in the post-SLMM percent time of glucose >180 mg/dL and GRS (P = 0.020 and P = 0.001, respectively). An SVM model with two RFE-selected features (T1D GRS and incremental AUC) achieved the best performance, classifying 1 versus ≥2 AB individuals with an AUC-ROC of 0.93 (95% confidence interval [CI]: 0.83–1.00) and AUC-PR of 0.89 (95% CI: 0.71–0.99), compared with AUC-ROC of 0.80 (95% CI: 0.46–1.00) and AUC-PR of 0.82 (95% CI: 0.71–0.93) using all features.
Conclusions:
A machine learning approach combining a 1-week CGM home test and T1D GRS reliably assesses T1D immunological risk, enabling early intervention.
Introduction
Type 1 diabetes (T1D) is an autoimmune disease characterized by the destruction of insulin-producing beta cells in the pancreas, leading to hyperglycemia and the need for lifelong insulin therapy. The development of T1D is often preceded by the presence of islet autoantibodies (ABs), which serve as biomarkers of an ongoing autoimmune process. These ABs target various components of the pancreatic islets, such as insulin (IAA), glutamic acid decarboxylase, insulinoma-associated antigen-2, and zinc transporter 8. The appearance of one or more islet ABs marks the initial stage of the disease, even before clinical symptoms manifest, highlighting the importance of early detection and monitoring. 1,2
Genetic predisposition also plays a significant role in the risk of developing T1D, estimated to account for nearly one-half of the total risk of T1D. The human leukocyte antigen (HLA) region on chromosome 6p21 is the most significant genetic determinant, with certain HLA haplogenotypes, specifically DR3-DQ2 and DR4-DQ8, being strongly associated with an increased risk. In addition to HLA genes, over 100 non-HLA genetic loci have been identified, further contributing to the complex genetic architecture of T1D; however, genetic variation in the HLA region accounts for 33%−50% of T1D genetic risk. The interplay between genetic susceptibility and environmental factors ultimately leads to the immune-mediated destruction of beta cells, culminating in the onset of clinical diabetes. 3,4 Therefore, identifying individuals at risk of developing T1D early is crucial for implementing preventive strategies and delaying the onset of clinical symptoms.
Over the past two decades, continuous glucose monitoring (CGM) systems have advanced significantly, offering noninvasive, real-time tracking of glycemic fluctuations and trends. These systems not only optimize medical therapy and reduce hyperglycemia and hypoglycemia risk but also improve quality of life and enhance diabetes screening and diagnosis. 5,6 CGM-derived metrics 7 provide valuable insights into glucose dynamics, offering a more comprehensive assessment of glycemic control than traditional methods. Recent studies have increasingly focused on using CGM to understand dysglycemia’s role in the early stages of T1D. 8 –10 CGM-derived metrics, such as the percent of time spent above 140 mg/dL, have been used to detect early hyperglycemia and predict progression to stage 3 T1D, particularly in adolescents and children. 10 –13 A 1-week CGM test has shown potential in identifying those at high risk for rapid T1D progression, even among individuals with normal an oral glucose tolerance test (OGTT) results. 14 However, the effectiveness of CGM as a replacement for OGTT in detecting imminent T1D risk is debatable and may largely depend on the way the CGM data are analyzed. 15
Recent findings indicate that integrating CGM data into machine learning models can enhance the development of predictive tools to improve diabetes screening and treatment. We used a 1-week CGM home test combined with a linear support vector machine (SVM) model to classify participants’ AB status (antibody positive vs. antibody negative). 16 In addition, we used glycemic features derived from home CGM data following standardized liquid mixed meals (SLMM) to predict whether a healthy individual is at risk of progressing to stage 3 T1D (low risk vs. high risk) through a linear SVM with a recursive feature elimination (RFE) algorithm. 17 Furthermore, machine learning classifiers applied to CGM data have recently been used to identify factors influencing diabetic retinopathy and to predict high-risk individuals, facilitating timely intervention for adults with T1D by leveraging different glycemic features and principal component analysis. 18 In addition, CGM-based machine learning approaches, such as XGBoost, have shown strong potential in distinguishing between healthy, prediabetic, and dysglycemic groups, underscoring the utility of CGM metrics for early detection and classification of glucose dysregulation. 19
In this study, we aim to characterize the SLMM-related CGM traces in healthy individuals with different numbers of islet ABs and develop a machine-learning model using post-SLMM CGM-derived glycemic features and their T1D genetic risk score (GRS), which quantifies an individual’s genetic predisposition to T1D based on the presence of multiple risk alleles, to classify individuals with one versus multiple ABs, thereby predicting their immunological risk for developing T1D.
Methods
Study design and data overview
The National Institutes of Health (NIH)-funded TrialNet ancillary study (ClinicalTrials.gov registration no. NCT 02663661) was conducted at the University of Virginia from 2015 to 2019 (Institutional Review Board protocol ID #18568). The study enrolled healthy relatives of individuals with T1D who had varying islet AB status (either one or two or more ABs) and were recruited from the TrialNet Pathway to Prevention study (https://www.trialnet.org/our-research/risk-screening). Participants, aged 12–45, had a close relative with T1D (brother, sister, child, or parent), or individuals aged 12–20 had an extended family member with T1D (cousin, aunt, uncle, niece, nephew, half-sibling, or grandparent). Major exclusion criteria included a diabetes diagnosis, a relevant medical condition, or the use of medications that could interfere with the study. Participants were provided with a blinded Dexcom G4 Platinum CGM, which they wore at home for 7 days. The CGMs were calibrated according to the manufacturer’s instructions. During this 1 week, participants consumed three SLMM (Boost, Nestlé, Switzerland) over 1–5 min on three occasions to replace their breakfasts (6 mL/kg body weight, up to a maximum of 360 mL) and recorded the timing to correlate the start of the SLMMs with their CGM profiles. 16 The use of SLMMs offers the advantage of providing a user-administered known metabolic challenge that can be easily integrated into a home-based testing procedure.
CGM-based glycemia metrics
The post-SLMM CGM-based metrics and characterization of glycemia in the different AB groups were performed for the 2 h post-SLMM traces. CGM traces from the participants were collected and nine glycemic features/metrics were extracted and computed, including the following: (1) percent time of glucose >180 mg/dL (T180), (2) >160 mg/dL (T160), (3) >140 mg/dL (T140), (4) coefficient of variation (CV), (5) the area under the curve (AUC) above the baseline value at t = 0 (the post-SLMM CGM incremental area under the curve [IAUC]), (6) glucose level at t min post-SLMM (Gt), (7) maximal glucose amplitude (Gmax), (8) time to Gmax (Tmax), and (9) slope of glucose 0-t min (S). Those features capture the dynamic characteristics of the post-SLMM CGM traces for each participant in the two different AB groups (i.e., 1 AB vs. ≥2 AB).
Type 1 diabetes genetic risk score
TrialNet participants provided samples for DNA extraction. Single-nucleotide polymorphisms (SNPs) were obtained from a genome-wide array (Illumina HumanCoreExome Beadarray with custom content) and were used to compute the T1D GRS previously described. 20 The TID GRS used in this analysis was calculated by computing the sum of the T1D-associated risk alleles weighted by the effect size estimated from robust fine mapping data and was shown to be predictive of case–control status from the Type 1 Diabetes Genetics Consortium (T1DGC) resource of 16,086 samples of European ancestry (6670 T1D cases), augmented by seven SNPs from analysis of African-ancestry cases and controls. The T1D GRS consisted of 72 SNPs 21 that formed the basis for the development of T1D GRS1 and T1D GRS2. 22 The genotyping panel produced raw data that were analyzed using KING software. 23 Samples and SNPs that passed quality control (e.g., sample call rates ≥80%, SNP call rates ≥95%) were saved in a binary file, with the T1D GRS for each participant generated using PLINK software. 24 The T1D GRS was calculated by computing the sum of T1D-associated risk alleles weighted by the effect size estimated from robust fine mapping data. 21,25
Statistical analyses
All statistical analyses were conducted using R Statistical Software version 4.0.5 (R Foundation for Statistical Computing). Continuous variables were presented as mean ± standard deviation, while categorical variables were summarized as frequency (percentage). The Shapiro–Wilk test was applied to assess whether glycemic features or T1D GRS followed a normal distribution. For variables that were normally distributed, a t-test was used to compare the means between AB groups. For variables that were not normally distributed, a Wilcoxon signed-rank test was used to evaluate statistically significant differences in glycemic features and T1D GRS across different AB groups. Pearson’s correlation matrix was calculated to assess the collinearity between glycemic metrics and T1D GRS. We used DeLong’s and permutation tests to compare AUC values between models, offering a statistically robust approach for assessing differences in receiver operating characteristics (ROC) and precision-recall (PR) curves. A P value of <0.05 was considered statistically significant for all analyses.
AB classification
The extracted glycemic features from the post-SLMM CGM traces combined with T1D GRS were used to define a classifier model based on the AB class (1 AB vs. ≥2 AB). The glycemic features were aggregated per participant, and each feature/metric was mean-centered and scaled before entering the classification procedure combined with the T1D GRS feature. Recursive feature elimination with cross-validation (RFECV) was used as the feature selection method for this analysis to address the dimensionality issues. RFECV is a wrapper-type feature selection algorithm that reduces a model’s complexity by choosing significant features and removing the weaker ones. The RFE technique starts with incorporating the full feature set and proceeds to iteratively remove features that do not contribute to the accuracy of the classification until it has achieved the optimum number needed to assure peak performance. 26 A linear SVM classification model was used to develop an AB classifier in two different scenarios (by using all glycemic features and T1D GRS, or by using the optimal features selected via the RFE procedure). 27 For this classifier model, the Caret function used to build the classifier was used with default tuning parameters.
A fivefold cross-validation technique was used in this analysis. The dataset, consisting of nine glycemic features per participant, was aggregated and combined with the T1D GRS feature before being randomly shuffled. The data were then divided into five approximately equal-sized folds. For each iteration, onefold was designated as the test set to evaluate classification performance, while the remaining fourfolds were used to train the classifier model with the selected features. This process was repeated five times to estimate the average performance of the classifier models. To avoid overfitting and improve generalizability of the results, data from each participant appeared exclusively in either the training or the test set during each iteration.
Classification performance assessment
To evaluate the performance of the classifier model, a confusion matrix was used to present the four possible outcomes when comparing the true and predicted classes: true negative (TN), false negative (FN), true positive (TP), and false positive (FP). We assessed model accuracy using both the AUC-ROC and the AUC-PR curves. AUC-ROC highlights the trade-off between sensitivity (TP rate) and 1-specificity (FP rate), with sensitivity and 1-specificity defined as follows:
AUC-PR focuses on the trade-off between precision and recall (sensitivity), with precision and recall defined as follows:
Higher AUC-ROC and AUC-PR values, closer to 1, indicate better model performance in distinguishing between participants with 1 AB and those with ≥2 AB.
Results
Demographic characteristics
Table 1 shows the clinical and demographic characteristics of the participants included in the current study. A total of 39 participants completed the CGM study. Among them, 18 had one AB (1 AB group), and 21 had more than one (≥2 AB group). The participants had a mean age of 22.1 ± 11.1 years, an HbA1c of 5.3 ± 0.3%, and a body mass index (BMI) of 24.1 ± 5.8 kg/m2 (Table 1). No statistically significant differences were observed between the two AB groups in these characteristics.
Clinical and Demographic Characteristics of the Participants in the Two Different Classes of Islet Autoantibodies Used for Analysis
Statistics presented as N, mean (standard deviation), or (%).
AB, autoantibody; BMI, body mass index.
Characterization of glycemia in the two AB groups
Post-SLMM CGM traces (n = 101) over 120 min were analyzed for 34 participants: 14 in the 1 AB group (44 CGM traces) and 20 in the ≥2 AB group (57 CGM traces). Five participants were excluded from the analysis: four from the 1 AB group and one from the ≥2 AB group. The exclusions were due to three participants consuming breakfast after all SLMMs, one having breakfast 30 min before all SLMMs, and one participant from the one AB group lacking T1D GRS information. Figure 1 illustrates the ambulatory glucose profile (AGP) visual display for the two AB groups, showing that the ≥2 AB group tends to have a higher post-SLMM peak and a different distribution of CGM traces compared with the 1 AB group.
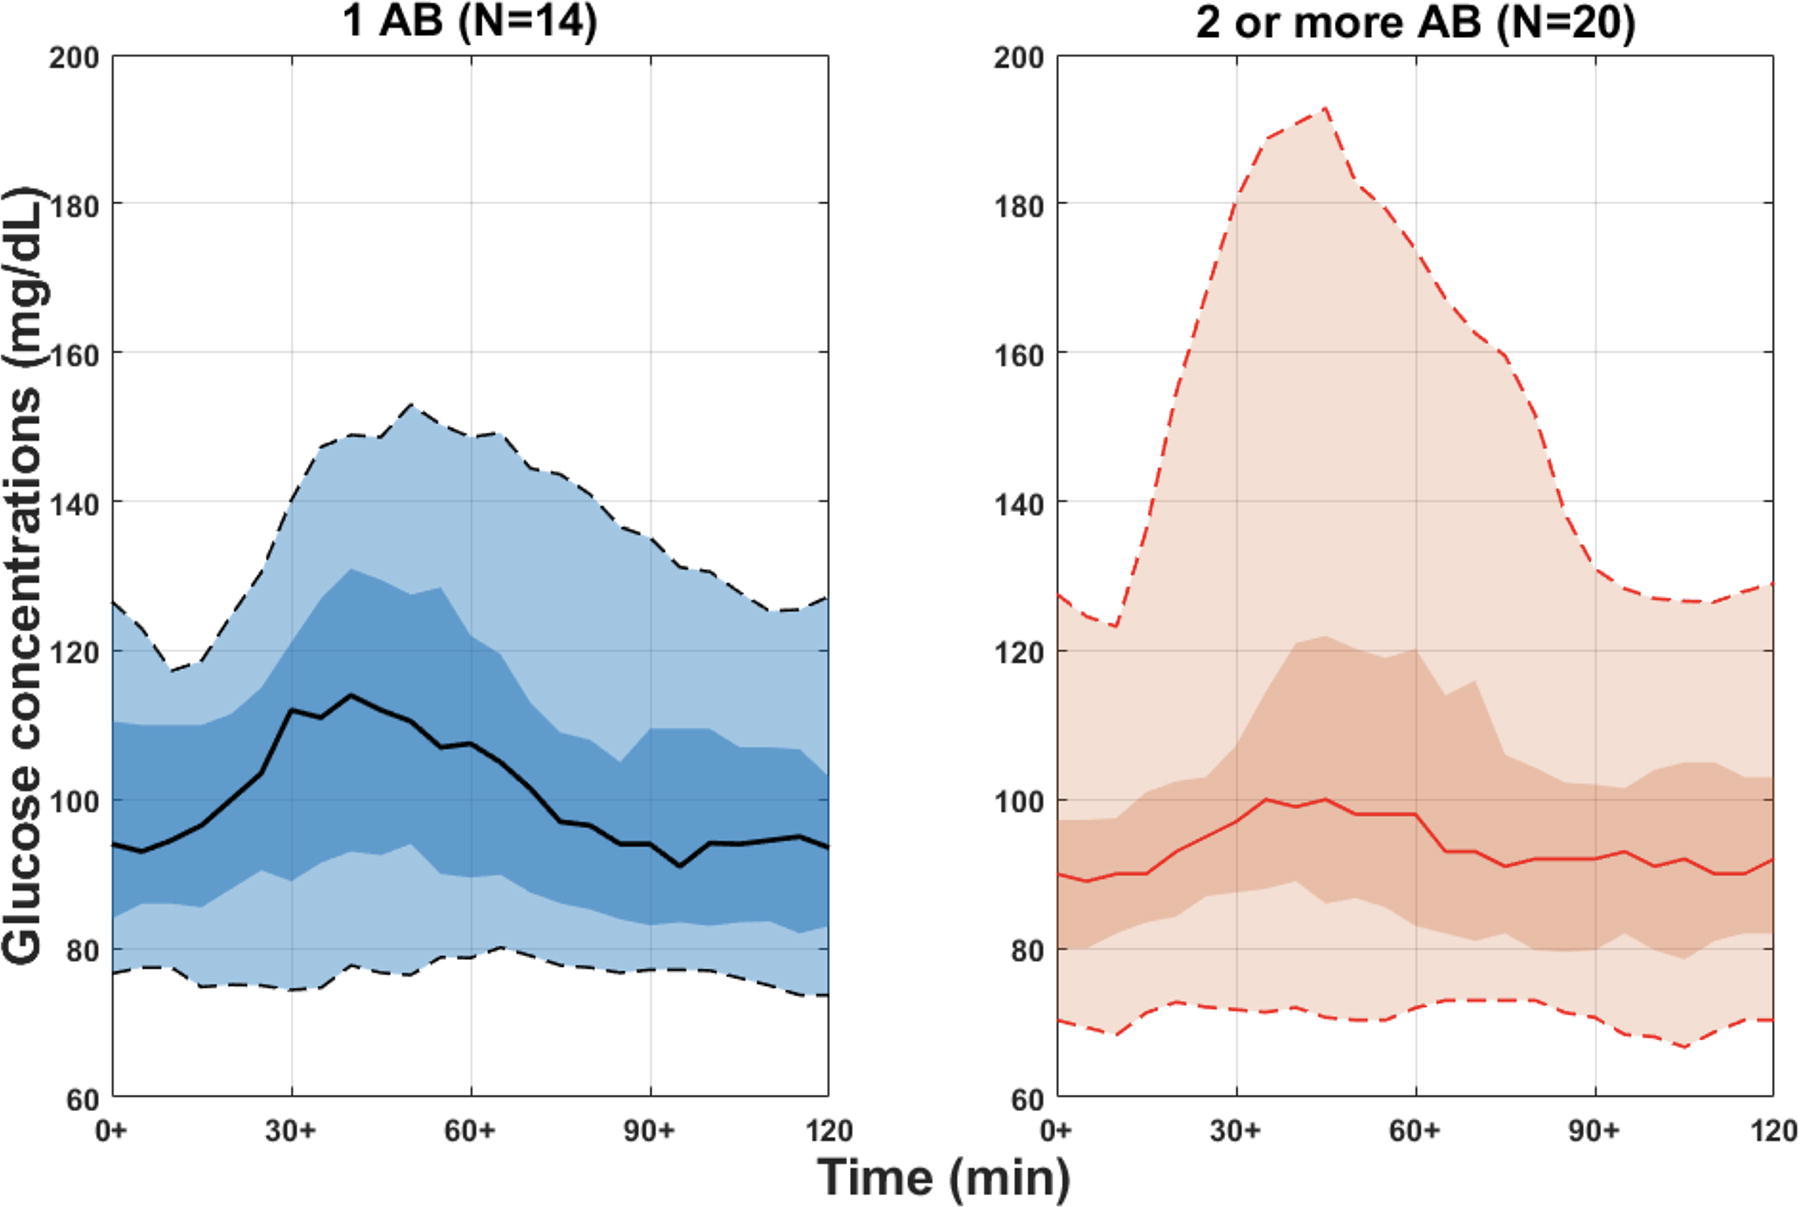
Representation of a panel of continuous glucose monitoring (CGM) traces of 2 h after standardized liquid mixed meals (SLMM) for 34 participants in the two different groups of autoantibodies (ABs) aggregated to create a single ambulatory glucose profile (AGP) as a visual display in different AB groups (i.e., 1 AB vs. ≥2 AB). The solid line in each AB group is the median or 50% line; half of all CGM values are above and half are below this value. The 25th and 75th percentile curves shaded in dark black/red represent the interquartile range or 50% of all CGM values. The dashed outer lines (the 5th to 95th percentile curves) indicate that only 5% of CGM readings were above or below these values. N represents the number of participants in each group.
CGM traces following the SLMM were processed, and the optimal duration to observe distinct post-SLMM excursions among participants was determined to be 75 min, as recently reported. 16 Subsequently, nine glycemic features, as described in Methods section, were calculated. Among these, T180 was the only feature showing a statistically significant difference between the two AB groups (P = 0.020), as shown in Figure 2. The median Gmax was higher in the 1 AB group compared with the ≥2 AB group (137.0 mg/dL vs. 123.7 mg/dL), although this difference was not statistically significant (P = 0.462). Similarly, the median T140 was higher in the 1 AB group than in the ≥2 AB group (9.38% vs. 0.0%), but this difference was also not statistically significant (P = 0.608).

Characterization of post-SLMM CGM data through different glycemic features, combined with a type 1 diabetes (T1D) genetic risk score (GRS) feature. Boxplots for 10 features extracted from 75-min post-SLMM CGM traces and a T1D GRS feature for 34 participants in the two different groups of ABs. A significance level of 5% (P value <0.05) was considered to be significant to distinguish between the different groups of ABs. CV, coefficient of variation; G75, glucose value at 75 min (mg/dL); Gmax, maximal glucose amplitude (mg/dL); GRS, T1D genetic risk score; IAUC, incremental area under the curve (mg/min/dL); S, slope of glucose 0–75 min (mg/dL)/min; T140, percent time >140 mg/dL; T160, percent time >160 mg/dL; T180, percent time >180 mg/dL; Tmax, corresponding time to Gmax (Time [min]).
Characterization of T1D GRS in the two AB groups
The T1D GRS was reported only for the 34 participants who also had SLMM CGM traces. The T1D GRS was significantly higher in the ≥2 AB group compared with the 1 AB group (median GRS: 3.95 vs. 0.22, P = 0.001), as shown in Figure 2. In the ≥2 AB group, the T1D GRS ranged from −0.735 to 7.605, with a median of 3.95 (25th percentile: 2.26, 75th percentile: 5.81). In contrast, the T1D GRS in the one AB group ranged from −4.609 to 7.491, with a median of 0.22 (25th percentile: −0.63, 75th percentile: 1.27).
Figure 3 shows the correlations between glycemic features/metrics and T1D GRS. There is no strong correlation between them, with only weak associations observed. There is a positive correlation between T1D GRS and T160, T180, and Tmax (0.05, 0.09, and 0.05, respectively), while the rest of the glycemic metrics show a negative correlation with T1D GRS.

Pearson correlation between pairs of the nine post-SLMM CGM metrics and the T1D GRS. Darker blue indicates a strong positive correlation and shades of red indicate a negative correlation.
Defining an AB classifier model
Figure 4 presents the ROC curves over five iterations for two classification scenarios. In the first, a linear SVM classifier with fivefold cross-validation was applied using all glycemic features alongside the T1D GRS. The second scenario used a linear SVM with fivefold cross-validation, but only the optimal features selected through RFE—specifically, the T1D GRS and IAUC—were included to classify participants as having one AB versus two or more. The SVM model incorporating all features achieved a mean AUC of 0.80 (95% confidence interval [CI] 0.46–1.0), while the RFE-optimized model reached a higher mean AUC of 0.93 (95% CI: 0.83–1.0). DeLong’s test confirmed a statistically significant improvement in AUC with the RFE approach (P = 0.041), underscoring the enhanced predictive accuracy and stability of the RFE-optimized model across cross-validation folds, as shown in Figure 4.

Comparison of classification performance of the classifier model (support vector machine or SVM with a linear kernel) in terms of area under the receiver operating characteristic curve (AUC-ROC) based on different classes of ABs (i.e., 1 AB vs. ≥2 AB) in two different scenarios (using all features vs. the optimal features through the recursive feature elimination or RFE algorithm (i.e., the T1D GRS and IAUC). The color gradient represents the AUC values of individual folds, ranging from 0.5 (blue) to 1.0 (red). The dashed diagonal line represents a random classifier with an AUC of 0.5.
Figure 5 shows the PR curves over five iterations for the same two scenarios. The linear SVM model with RFE-selected features consistently outperformed the model using all features, achieving a mean AUC-PR of 0.89 (95% CI: 0.71–0.99) compared with 0.82 (95% CI: 0.71–0.93) for the full-feature model. A permutation test confirmed this performance gain as statistically significant (P = 0.038), highlighting the effectiveness of RFE in enhancing model accuracy for this classification task.
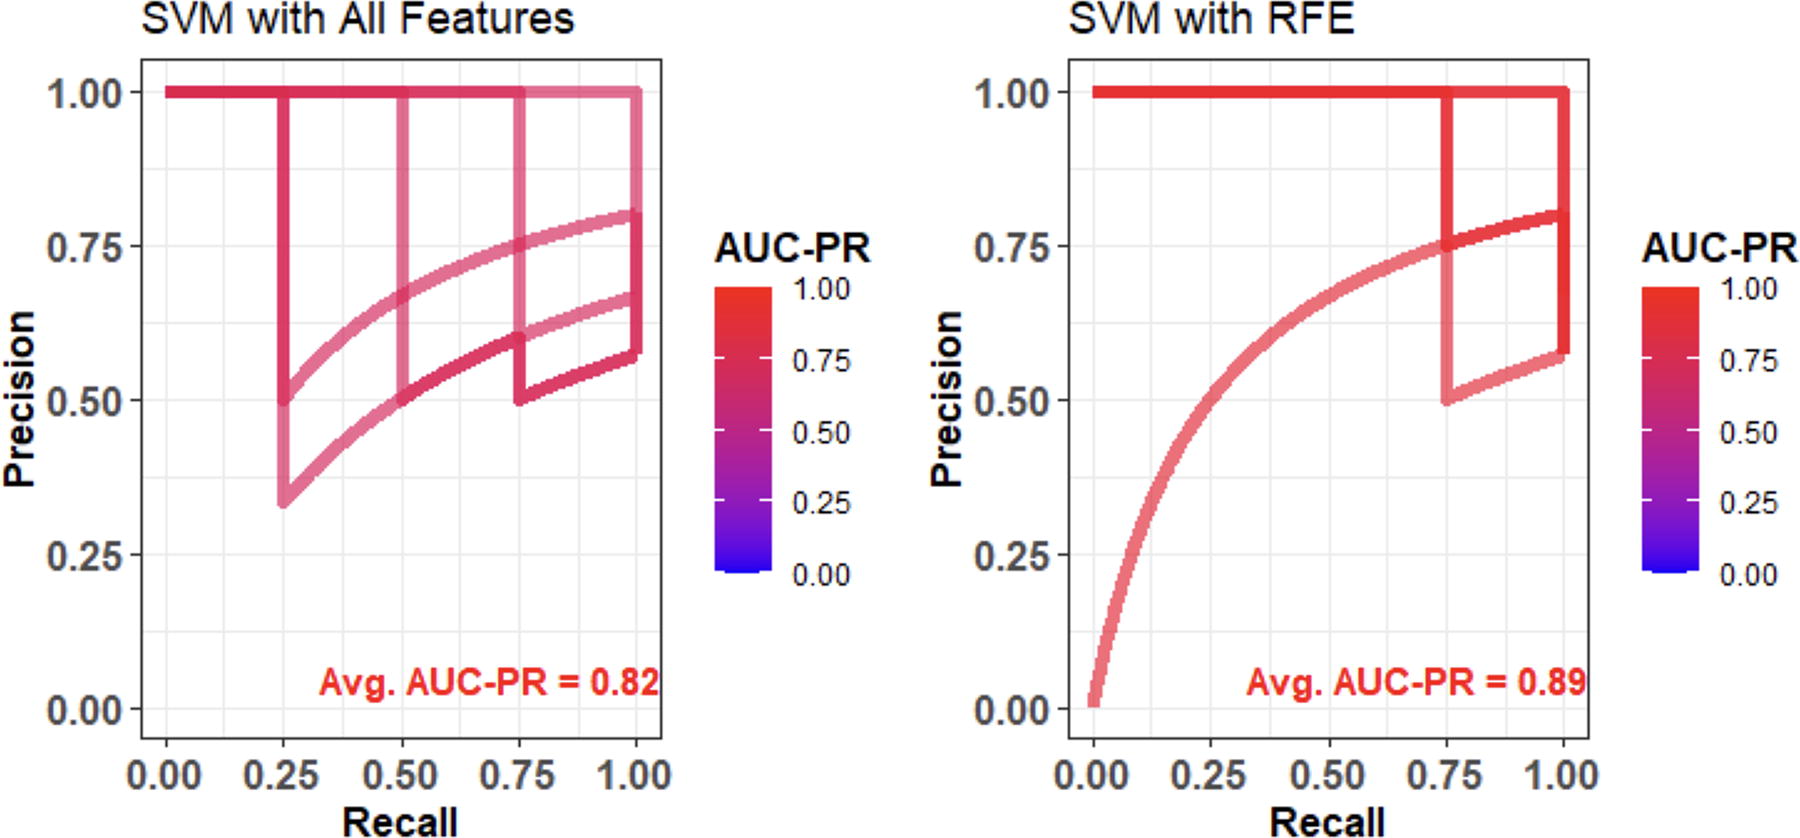
Comparison of classification performance of the classifier model (SVM with a linear kernel) in terms of area under the precision-recall curve (AUC-PR) based on different classes of autoantibodies (i.e., 1 AB vs. ≥2 AB) in two different scenarios (using all features vs. the optimal features through RFE algorithm (i.e., the T1D genetic risk score and IAUC). The color gradient represents the AUC-PR values of individual folds, ranging from 0.0 (blue) to 1.0 (red).
Discussion
In this study, we utilized data from a recent NIH-funded TrialNet ancillary study, which involved relatives of people with T1D aged 12–42 years, to assess how features derived from a 1-week CGM home test with SLMM can differentiate individuals with varying numbers of T1D-specific ABs (i.e., one vs. two or more ABs) to assess the level of progression to stage 3 T1D. We found that the post-SLMM period T180 is significantly different between the two AB groups. This differs from previous research, which generally analyzed the entire CGM trace while we were monitoring the response to a predefined mixed meal challenge. For instance, prior studies have identified that the best predictors of progression to stage 3 T1D were based on the percentage of time spent with CGM readings ≥140 or 160 mg/dL. In one study, 11 participants who progressed (35% of the 14 AB-positive individuals) to stage 3 T1D had a higher percentage of time with CGM values ≥140 mg/dL and a higher daytime glucose AUC. Another study 12 reported that the best predictor of progression was spending ≥18% of the time with CGM readings ≥140 mg/dL. In addition, the same authors found in a larger study that spending more than 10% of the time with CGM readings >140 mg/dL was associated with a higher risk of progression to T1D within 1 year. 13 Furthermore, it was shown 10 that children in the AB-positive group had higher percentages of time with CGM readings ≥140 mg/dL (5.8% vs. 0.4%) and a higher mean 7-day sensor glucose (97.2 mg/dL vs. 84.6 mg/dL). Another study 14 reported that spending ≥5% or 8% of the time with glucose levels ≥140 or 160 mg/dL was linked to progression to stage 3 T1D. This study also noted that stage 2 participants and those who progressed to stage 3 exhibited higher mean daytime glucose values, spent more time with glucose ≥120, 140, and 160 mg/dL, and had greater glycemic variability.
HbA1c has been used as a biomarker to predict the time to T1D diagnosis in children with two or more ABs. 28 Other parameters, such as age, BMI, and insulin and glucose levels during OGTT, have been used to develop risk scores such as the Diabetes Prevention Trial-Type 1 Risk Score to improve prediction. 29 Genetic risk scores have been used to predict progression to T1D and identify at-risk individuals. 30 Importantly, our findings indicate that different features can be associated with T1D risk when a CGM home test is conducted in conjunction with an SLMM.
The data collected during the SLMM CGM study and the resulting glycemic metrics were recently leveraged to develop a highly accurate risk classifier (AUC-ROC = 0.88) that distinguishes between low-risk and high-risk participants and predicts whether a healthy individual is at higher risk of progressing to stage 3 T1D. In addition, when combined with T1D GRS, these data enabled the use of machine learning to create an AB status classifier, accurately predicting the risk of developing ABs and, consequently, the onset of T1D. Notably, glycemic features derived from the post-SLMM CGM traces, along with T1D GRS, achieved high accuracy (AUC-ROC = 0.93) in classifying participants with one AB versus two or more ABs using a linear SVM model with the RFE algorithm. The RFE feature selection used in this study significantly enhanced classification accuracy by identifying the optimal features, reducing multicollinearity, and ultimately improving the model’s performance. Although our approach is not specifically designed to differentiate progressors to stage 3 from nonprogressors, it has identified new metrics, such as IAUC from the post-SLMM CGM periods, which, when combined with T1D GRS information, can be explored to estimate the imminent risk of progression to stage 3 T1D.
While T180 is important in distinguishing between the one AB and multiple AB groups, we used the RFE technique to identify the most predictive features, which ultimately included T1D GRS and IAUC. Notably, there is a difference between T180’s statistical significance in univariate comparisons and its predictive value in combination with other features. Testing the combination of T1D GRS and T180 alone yielded an AUC of 0.90, confirming their strength. However, the model with RFE-selected features, including IAUC, achieved a slightly higher AUC (0.93), underscoring the added value of IAUC in our predictive model. Although IAUC is not significantly different between the one AB and multiple AB (two or more ABs) groups, it remains an important feature in the predictive model. Including T1D GRS and IAUC features, alongside T180, significantly enhances the predictive power of our model (AUC-ROC = 0.93) compared with using T180 alone (AUC-ROC = 0.65), underscoring the added value of our multifeature approach. The results demonstrate that the linear SVM model with RFE, utilizing only the T1D GRS and IAUC, significantly outperforms the model using all features, with an average AUC of 0.93 compared with 0.80. This underscores the critical importance of these two features in accurately distinguishing between individuals based on their AB count. The higher IAUC observed in the one AB group may be attributed to early-stage autoimmunity, where individuals with a single AB likely retain relatively preserved pancreatic beta cell function, resulting in a more pronounced glucose response. Conversely, those with multiple ABs likely experience more extensive beta cell destruction or dysfunction, leading to a blunted glucose response. This suggests that better beta cell function in the one AB group results in higher insulin secretion and glucose uptake, while impaired beta cell function in the two or more AB group leads to reduced insulin secretion and lower IAUC. Although a higher IAUC in the 1 AB group may seem counterintuitive, it can be explained by differences in beta cell function and disease progression. 31,32 IAUC measures the total glucose AUC after a meal, and even with adequate insulin, the initial glucose spike (before insulin fully takes effect) can be more pronounced in this group, resulting in a larger IAUC. Clinically, this insight is valuable for the early detection, monitoring, and management of autoimmune diabetes. In analyzing the follow-up data for this study, we identified four individuals who progressed to clinical T1D, including three with two or more ABs and one with a single AB. Model scores for these individuals, assessed through both the SVM with all features and the RFE-selected feature model, ranged from 0.309 to 0.818 and 0.397 to 0.855, respectively. The higher scores observed in individuals with multiple ABs underscore the model’s sensitivity to this factor as a strong predictor for progression to stage 3 T1D, enhancing its relevance in stratifying risk among high-risk groups.
This study does have limitations, primarily due to the small sample size of volunteers who are relatives of individuals with T1D and aged between 12 and 42 years, which restricts a more thorough analysis of key technological aspects such as model selection and alternative SLMM approaches. The limited number of CGM days available for glycemic characterization and the absence of detailed AB information (e.g., type, persistence) further constrain the findings. In addition, data collection has been performed using the Dexcom G4 Platinum CGM, as opposed to the more accurate G6 or G7 models, which may affect comparability with recently published studies. Future studies will require an independent, larger, ethnically diverse sample to validate our model’s performance and the predictive power of the selected features, and should include younger cohorts, particularly children. This will provide a broader understanding of disease progression across different age groups and enhance the generalizability of our findings.
Conclusions
In conclusion, our study demonstrates that post-SLMM CGM-based metrics, when combined with a T1D GRS, can effectively identify individuals at an elevated risk of progressing to stage 3 T1D. This approach not only enhances our understanding of dysglycemia throughout the natural history of T1D but also offers a practical method for distinguishing between CGM patterns in individuals with different numbers of ABs. By applying machine learning, we developed a robust classifier that accurately differentiates between those with one AB and those with two or more, based on CGM data collected at home combined with predefined liquid meal challenges. The T1D GRS can also be used with an at-home saliva collection that is shipped to a laboratory for DNA extraction and genotyping. If widely implemented, this methodology could significantly improve early T1D risk detection and enable the identification of individuals at risk for stage 3 T1D before symptoms manifest. Such early detection could facilitate timely intervention, potentially leading to earlier diagnosis and opportunities for prevention. These findings underscore the potential of combining advanced CGM metrics with genetic data to enhance predictive models for T1D, ultimately contributing to better clinical outcomes.
Footnotes
Acknowledgments
The authors would like to thank the UVA Center for Diabetes Technology Data Team for organizing the CGM home study data, the UVA Center for Public Health Genomics for providing the genetic information, and the TrialNet Coordinating Center for assistance with recruitment of the AB-positive participants.
Authors’ Contributions
E.M.: Writing—original draft, validation, resources, methodology, investigation, formal analysis, data curation, and conceptualization. L.S.F.: Resources, project administration, investigation, funding acquisition, conceptualization, writing—review and editing, methodology, and formal analysis. S.S.R.: Resources, project administration, investigation, funding acquisition, formal analysis, conceptualization, and writing—review and editing.
Disclaimer
The contents of this article are solely the responsibility of the authors and do not necessarily represent the official views of the NIH or BREAKTHROUGH T1D (FORMERLY JDRF).
Author Disclosure Statement
E.M. and S.S.R. have nothing to declare. L.S.F. declares research support from LaunchPad Ignite and Dexcom and research support and patent royalties from Novo Nordisk, all managed by the University of Virginia.
Funding Information
This study was supported by the NIH,