




Abstract
Hemoglobin A1c (A1c) is the standard for glycemic control in type 1 diabetes. With recent increase in continuous glucose monitoring (CGM), other metrics (time in range 70–180 mg/dL [TIR]) are increasingly available. Data are limited for youth. We evaluated the association between A1c and time in range in a large pediatric cohort. We included patients from 2018 through 2020, aged <22 years with ≥70% CGM usage (n = 2393). A linear correlation between A1c and TIR was observed (correlation coefficient −0.73), similar to studies in adults. Each 1% increase in A1c was associated with a 9.1% lower TIR. The R 2 for A1c versus mean sensor glucose was 0.66 (P < 0.001) and A1c versus TIR was 0.55 (P < 0.001). TIR correlates with A1c in children with type 1 diabetes. TIR should be considered alongside A1c. Further research is warranted to establish long-term outcomes associated with TIR in children.
Introduction
Type 1 diabetes affects over 187,000 people younger than 20 years in the United States. 1 Hemoglobin A1c (A1c) has been the standard for evaluating glycemic management in children and adults with type 1 diabetes. 1 Patients and providers use A1c goals to evaluate and track glycemic control; lower A1c translating to tighter glucose control has been shown to reduce the microvascular complications associated with poor glucose control. 2,3 Recent advances in diabetes technology have provided additional methods of evaluating blood glucose levels. The U.S. Food and Drug Administration’s (FDA) approval of nonadjunctive use of continuous glucose monitoring (CGM), hybrid closed-loop systems, and the first factory-calibrated real-time CGM has made CGM more accessible to pediatric patients. 4 –7 While A1c approximates the average blood glucose over the previous 3 months, CGM allows monitoring of glycemic control over varied time frames using time in the range of 70–180 mg/dL (TIR) and mean glucose. 8 In a study by Beck et al., it was shown that TIR is strongly associated with microvascular complications and can be utilized as an additional outcome measure. 9 These findings were supported by a retrospective analysis from Shah correlating incident diabetic retinopathy with decreases in CGM TIR. 10 Studies have been done primarily in adult populations, but few studies have evaluated the correlation in children. 11 Therefore, this analysis aims to examine the association between A1c and TIR, as well as the influence of age, duration since diagnosis, and diabetic ketoacidosis (DKA) at diagnosis in a pediatric population.
Materials and Methods
TIR versus A1c
This study was approved by the Colorado Multiple Institutional Review Board. The electronic medical record was queried to identify patients with type 1 diabetes seen at the Barbara Davis Center for Diabetes between January 2018 and December 2020, who at time of last visit were <22 years old, had a diabetes duration >3 months, and had available A1c and diabetes technology data at the same clinical encounter. Demographics, A1c, pump usage, and sensor usage at the most recent clinical encounter were extracted from the medical record. The practice at our center is to enter CGM and pump use data for the preceding 14 days into the record at each clinic encounter. In cases where the data were not available in the record, our study team manually reviewed each chart and directly extracted the data from the device download systems. If technology usage was unclear at the most recent encounter, we used the preceding encounter. Patients recorded as not on CGM or with CGM use ≤70% were excluded as >70% usage has been shown to be the standard for sufficient CGM data. 8 Patients were split into the following age-groups for A1c comparison: <6, 6 to <12, 12 to <18, and 18 to <22 years. Age groups cutoffs were modeled after other recent analyses. 12
Pearson’s correlation coefficient and generalized linear models were used to examine the relationship between A1c and CGM TIR. CGM TIR was defined as the percentage of time during which blood sugar levels were between 70 and 180 mg/dL as measured by the CGM system. A1c levels >14% were recoded as 14%, initial analysis was performed including A1c values over 14%, and then run again excluding A1c values over 14% (n = 16). There was no change to the findings when A1c >14% was removed. Therefore, all analyses recoded A1c >14% as 14%. A1c was defined as the independent variable, and TIR was defined as the dependent variable. 11
TIR, A1c, and mean sensor glucose
The relationship between TIR, A1c, and mean sensor glucose was analyzed through a 3D regression model and further assessed between variables using pairwise linear models. Coefficient of determination was calculated between TIR, A1c, and mean sensor glucose.
DKA and severe hypoglycemia
Incidence of DKA and severe hypoglycemia (SH) was extracted from the medical record. The practice at our center is to enter the patient-reported number of DKA and SH events since the previous visit into the medical record at each encounter. Patients whose previous visit to our center was >365 days prior were excluded to reduce recall bias. We utilized DKA and SH information in two analyses; the first counted all events divided by all encounters; the second counted all events divided by encounters where the fields reporting DKA and SH were filled, excluding any null fields. The medical records of all patients reporting any DKA or SH events since their previous visit were manually reviewed. DKA was defined as hospital admission or emergency room visit related to a diagnosis of DKA. SH was defined as hypoglycemia requiring assistance from another person, including hospitalization, seizure, or altered mental status. DKA and SH were reported as events per 100 patient-years.
Results
Demographics
A total of 2393 patients were included in this study (Table 1). Mean age was 13.7 years, and mean duration of diabetes was 5.9 years. This cohort was 70.1% non-Hispanic White, 11% Hispanic, 2.3% non-Hispanic Black, and 11% other/unknown. Mean A1c was 8.12%, the CGM usage was 82.37%, and TIR was 50.24%.
Demographics for Patients with Continuous Glucose Monitoring Use ≥70% (n = 2393)
CGM, continuous glucose monitoring; DKA, diabetic ketoacidosis; SH, severe hypoglycemia.
Unadjusted model
When A1c was compared with TIR in this cohort, the unadjusted correlation was −0.74 (Fig. 1). For each 1% increase in A1c, CGM TIR decreased by 9.1%, which equals 131 min per day. In this cohort, the association between A1c and the presence or absence of DKA at diagnosis of type 1 diabetes was not significant (P = 0.04).
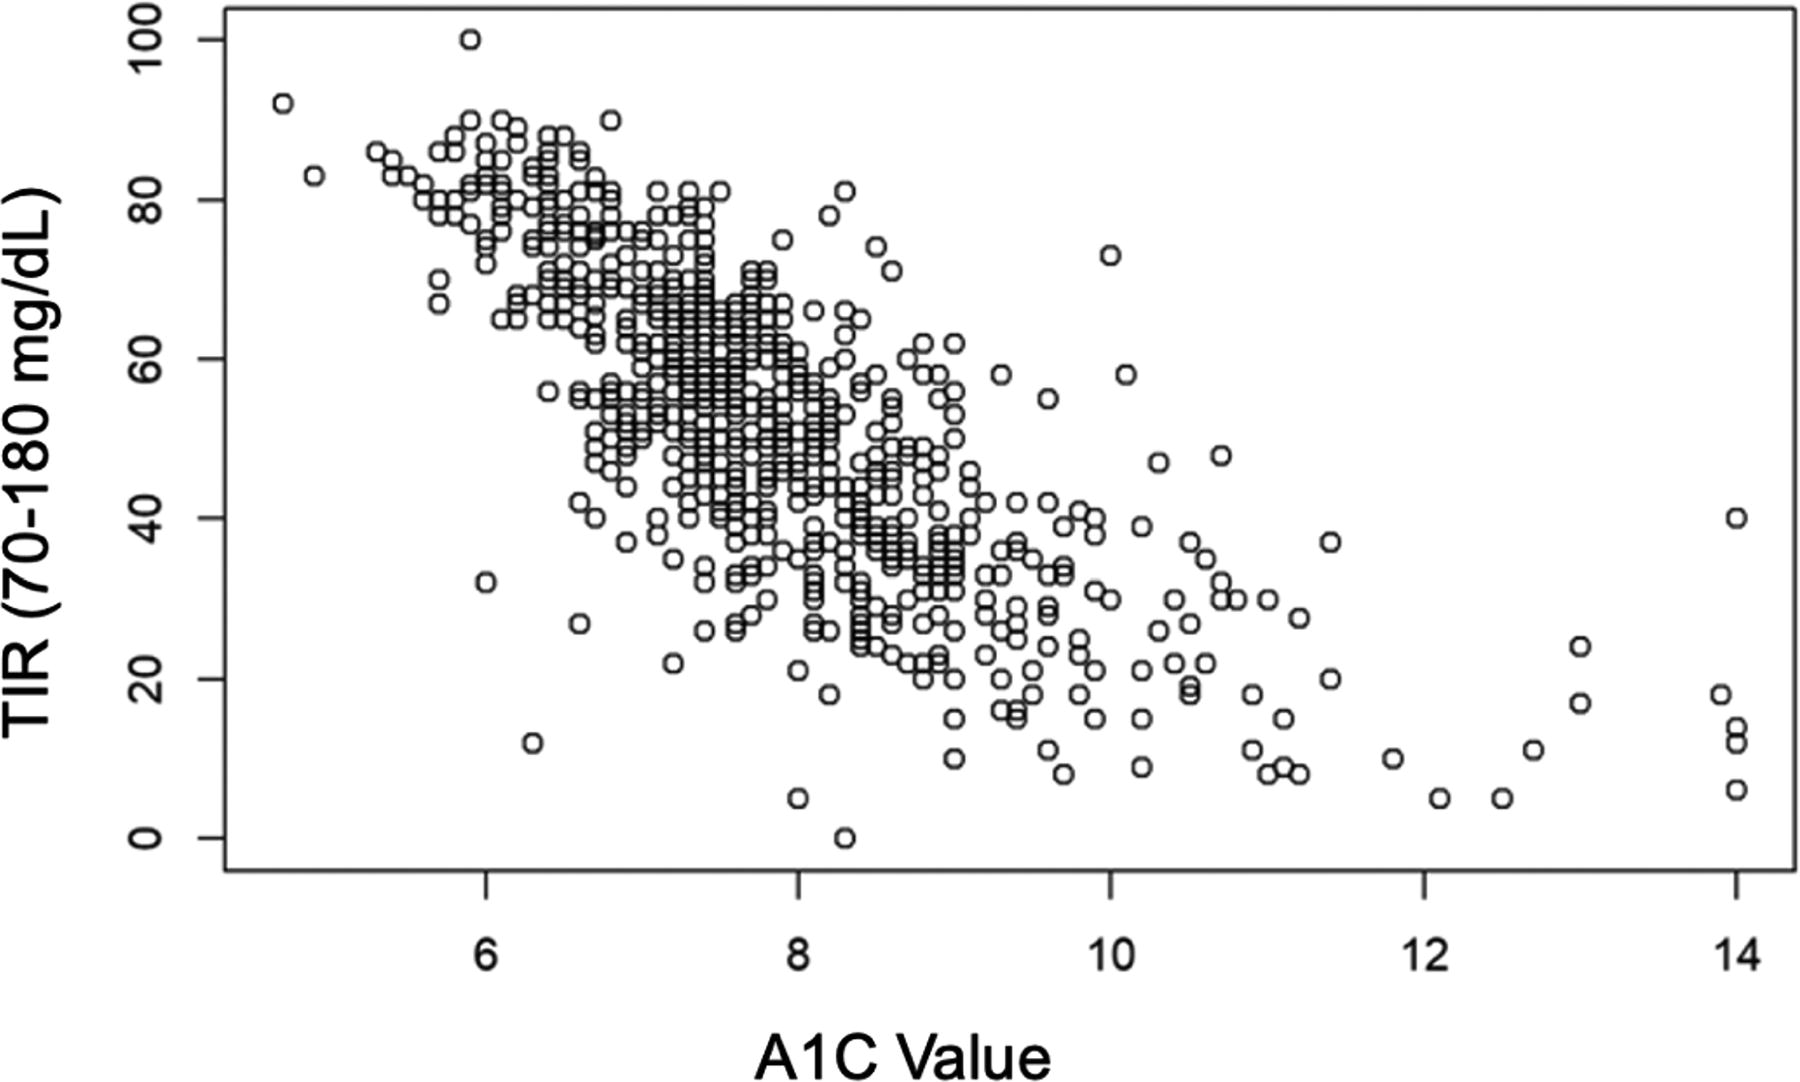
Scatterplot of time in range (TIR) versus hemoglobin A1c (A1c) using unadjusted model.
Model with interaction between TIR, A1c, and mean sensor glucose
The relationship between TIR, A1c, and mean sensor glucose was analyzed through a 3D regression model (Supplementary Fig. S1) and further analyzed between variables through pairwise linear models. The R 2 for A1c versus mean sensor glucose was 0.66 (P < 0.001), A1c versus TIR was 0.55 (P < 0.001), and mean sensor glucose versus TIR was 0.81 (P < 0.001) (Supplementary Fig. S2 A–C, respectively).
Discussion
CGM use increased sharply among pediatric patients with type 1 diabetes 13 in the past decade, from 7% in 2010–2012 to 75.3% in 2020–2021 14,15 and even higher usage in our clinic’s population (82.4%). As such, CGM metrics have become increasingly important to patients’ and diabetes professionals’ understanding of glycemia.
In this study, we found a linear correlation between A1c and TIR. With each 1% increase in A1c, there was an associated 9.1% decrease in TIR. Previous studies, mainly adult populations with type 1 diabetes, have shown similar trends of TIR and its correlation with A1c, supporting that TIR can be a useful metric to assess glycemic control. 11,16,17 Vigersky and McMahon reported that across multiple studies a 10% change in TIR correlates to a 0.78% change in A1c. 11 Beck et al. reported that approximately a 10% change in TIR was associated with a 0.6% reduction in A1c. 16 Shah reported that a 0.5% increase in HbA1c was associated with a 24% increase in incident diabetic retinopathy while a 5% decrease in TIR was associated with an 18% increase in incident diabetic retinopathy. 10 Our findings in a pediatric population are consistent with these prior studies.
In addition, TIR has been used as a metric to assess the risk development of retinopathy and microalbuminuria progression. 9 A study conducted by Beck and colleagues, who utilized data from the DCCT, was able to determine TIR by calculating the percentage of seven-point glucose concentration in blood samples measured every 3 months in DCCT patients. This calculation identified individuals who maintained glucose levels within the range of 70–180 mg/dL, later deriving their total TIR. Each 10% decrease in TIR was associated with a 64% increase in the development of diabetic retinopathy and a 40% increase in the development of microalbuminuria. Lastly among each of the commonly calculated CGM metrics, TIR appears to be the most consistent. 18
Because TIR can be calculated over variable time periods, in some respects it may be a more practical measurement than A1c. It can be calculated from CGM data over various time periods, can be compared with past trends, and can be done at home without an additional blood test. However, CGM use may be intermittent, and a 14-day look-back period may not be representative of glycemia since their previous clinical encounter. Moreover, many patients do not use CGM at all due to a variety of barriers. 19 In addition, only a few studies thus far have correlated CGM with long-term vascular outcome measures. For these reasons, TIR is not being utilized as an outcome measure by the FDA or the National Institutes of Health (NIH). 5 Further studies need to continue to demonstrate whether TIR would act as a useful and informative outcome measure for diabetes management. Nonetheless, TIR is a practical tool for discussion with patients in clinic about their recent glycemic trends.
Another challenge is evaluating the relationship between A1c and TIR at the upper end of the A1c spectrum. Because there were only 16 patients in the study cohort with A1c > 14%, power was limited to evaluate effects at that end of the spectrum. It is notable that many of the individuals with very high A1c had recently started on CGM.
To further understand the relationship between TIR, mean sensor glucose, and A1c, we performed a 3D linear regression and further analyzed each in a 2D analysis through pairwise linear models (Supplementary Figs. S1, Figs. S2C). In the present study, there was a strong linear relationship between mean sensor glucose and A1c (R 2 = 0.66). However, in another recent study, one-third of patients’ glucose management indicator (GMI) had ≥0.5 HbA1c-GMI discordance although not significant (P > 0.05). Further research is needed to understand this relationship better.
Unfortunately, the DKA and SH medical record fields were often left incomplete in clinic. We estimated the incidence of DKA and SH to be between 2.55–4.0 and 2.67–4.21, respectively (Table 1), similar to other contemporary U.S. populations. 20
Longer diabetes duration is associated with higher A1c levels, consistent with prior research. 21
A significant strength of our study is that 11% of patients identified as Hispanic, which is larger than the cohorts reported in most other studies. 22 The major limitation of this study was the retrospective, single-center design. Glycemic trends and rate of diabetes technology use in our clinic population may not be generalizable. In addition, we had 13% of patients who reported “other” or “unknown” race.
Conclusions
In pediatric patients with T1D, A1c correlates with CGM TIR and is not affected by age or the presence of DKA at diagnosis. Therefore, it is appropriate to use TIR over a 2-week interval in conjunction with A1c as a practical tool to understand and discuss glycemia for pediatric patients with type 1 diabetes.
Footnotes
Acknowledgment
The authors thank Bing Wang for database support and Becca Fuhlbrigge for assisting with an early draft of the article.
Authors’ Contributions
G.T.A. and G.P.F. conceptualized the study. M.S. researched the data and wrote and revised the article. A.S., G.P.F., and G.T.A. researched the data and reviewed and edited the article. L.P. performed the statistical analyses. G.T.A. is the guarantor of this work and, as such, had full access to all the data in the study and takes responsibility for the integrity of the data and the accuracy of the data analysis.
Statement of Ethics
This study was approved by the Colorado Multiple Institutional Review Board approval number 20-2686 with a waiver of written consent for secondary use of clinical data.
Data Availability
These data may be made available from G.T.A. upon reasonable request.
Author Disclosure Statement
G.P.F. conducts research sponsored by Medtronic, Dexcom, Abbott, Tandem, Insulet, Lilly, and Beta Bionics and has been a speaker/consultant/advisory board member for Medtronic, Dexcom, Abbott, Tandem, Insulet, Lilly, and Beta Bionics. G.T.A. has been an advisory board member for MannKind. A.S. and M.S. have no conflicts of interest to report.
Funding Information
This study is supported by the University of Colorado Diabetes Research Center Clinical Resources Core NIH, National Institute of Diabetes and Digestive and Kidney Diseases (NIDDK) grant P30-DK116073 and the National Institute of Diabetes and Digestive and Kidney Diseases, NIDDK grant 5T32DK063687-17.
Supplementary Material
Supplementary Figure S1
Supplementary Figure S2