




Abstract
Objective:
Continuous glucose monitoring (CGM) is an effective tool for individuals with type 2 diabetes (T2D) on insulin. This study evaluated the effect of using CGM to reduce hyperglycemia, by focusing on food and lifestyle choices, in people with T2D not taking insulin.
Methods:
A 6-month randomized, prospective four-center study was conducted. The primary end point was a within-group reduction in time above range >180 mg/dL (TAR180) at 3 months. Participants were asked not to make diabetes medication changes in the first 3 months. Seventy-two adults not on insulin or sulfonylurea therapy, with glycated hemoglobin (HbA1c) 7.5%–12%, were randomized to use CGM alone (n = 31) or CGM plus a food logging app (n = 41) to aid diabetes management. Participants attended guided education visits. Differences in CGM metrics, HbA1c, and body weight were compared.
Results:
The CGM alone group decreased TAR180 from 55% at baseline to 27% at 3 months (P < 0.001) and 21% at 6 months (P < 0.001); the CGM plus food logging app group decreased TAR180 from 53% at baseline to 30% at both 3 and 6 months (P < 0.001 for both). For all participants, time in range (70–180 mg/dL) increased from 46% at baseline to 71% at 3 months (P < 0.001) and to 72% at 6 months (P < 0.001). HbA1c and weight were reduced by 1.3% (P < 0.001) and 7 pounds (lbs.) (P < 0.001) for all participants at 6 months.
Conclusion:
People with T2D not taking insulin showed large, clinically significant improvements in CGM metrics and HbA1c when using either CGM alone or with a food logging app. This occurred with a near absence of medication changes in the first 3 months and were therefore likely due to changes in food and/or lifestyle choices.
Introduction
Since their introduction two decades ago, continuous glucose monitoring (CGM) systems have been available to support the management of diabetes. 1 Findings from randomized clinical trials (RCTs) and real-world evidence (RWE) studies led to the establishment of multiple clinical recommendations and formal guidelines on how to use CGM data to support improvement in glycemic outcomes in individuals living with diabetes. 2 –5 Accordingly, recommendations on CGM use are part of the American Diabetes Association (ADA) Standards of Care. 6
In the United States, until recently, CGM was predominantly prescribed for individuals with type 1 diabetes (T1D) and type 2 diabetes (T2D) on intensive insulin therapy. One RWE study using data from the T1D Exchange Quality Improvement Collaborative estimates that approximately half of people living with T1D from 2017 to 2019 were CGM users. 7 In contrast, while CGM uptake is continually gaining traction, one study estimated that only 13% of people with T2D used CGM in 2021. 8 This estimate also showed that, for people with T2D, CGM users were typically using some form of insulin, with only 1.6% not using any insulin.
Recent studies evaluated the effect of CGM in people with T2D not managed with intensive insulin therapy. 9 For example, the MOBILE study demonstrated that 8 months of CGM use among basal insulin users resulted in a 1.1% decrease in glycated hemoglobin (HbA1c), representing a HbA1c improvement of 0.4% greater than those using blood glucose monitoring (BGM). 10 A subsequent analysis further demonstrated that participants over 65 years of age benefited the most from CGM use. 11 These and other studies 9 have helped drive recent policy changes leading to Medicare coverage for CGM for all individuals with diabetes using insulin.
Studies within the T2D population not using insulin have compared the use of CGM (real-time or intermittently scanned) to usual or standard care, and a meta-analysis of six RCTs estimated a 0.31% reduction in HbA1c when using CGM compared with BGM in this population. 12 –18 Despite this, there is a need for more data in this area, particularly regarding the use of CGM in guiding lifestyle choices. To evaluate the effect of using CGM in individuals with T2D not using insulin, a 6-month randomized, multicenter clinical trial was conducted. The trial evaluated the use of CGM with or without a food logging app to guide food and lifestyle choices to reduce time above range >180 mg/dL (TAR180) and increase time in range (70–180 mg/dL, “TIR70-180”).
Methods
Trial conduct and oversight
This multicenter, randomized, open-label parallel-group trial was conducted at four centers in the United States (Supplementary Table S1). The protocol and informed consent form were approved by a central institutional review board for two centers and a local board for the other two centers. Written informed consent was obtained from each participant. The study is registered on clinicaltrials.gov (NCT04843527).
Trial design and participants
Major eligibility criteria included age 18 years or older and T2D treated with at least one diabetes medication in the classes of biguanide (metformin), sodium/glucose cotransporter 2 (SGLT-2) inhibitors, glucagon-like peptide-1 receptor agonists (GLP-1 agonists), or dipeptidyl peptidase-4 (DPP-4) inhibitors. Participants who were on any form of insulin therapy or any sulfonylurea-based medication were excluded. At visit 1, participants must have had an HbA1c greater than or equal to 7.5% and less than or equal to 12% as demonstrated by point-of-care or laboratory HbA1c result (during the study there was a protocol amendment to change the HbA1c upper limit from 9.5% to 12% to enhance recruitment). At the end of the baseline blinded sensor wear period, participants must have had at least 10 days of data recorded and TAR180 between 35% and 85% (8.4 and 20.4 h/day). In addition, participants agreed not to make changes to diabetes medications during the first 3 months of the study, unless clinically indicated. During study months 3–6, medication changes were at the discretion of the participants’ diabetes care provider (not the study team). For a complete listing of the inclusion and exclusion criteria, please refer to Supplementary Table S2.
Study design
The study schedule is shown in Supplementary Figure S1. At visit 3, after meeting all enrollment criteria, eligible participants were randomized to use either the FreeStyle Libre 14 Day system alone (CGM alone group) or the FreeStyle Libre 14 Day system in combination with a food logging app (CGM plus food logging app group) for a period of 6 months. Participants received one-on-one education and training throughout the study to help them use either CGM alone or CGM plus food logging app to identify and manage the causes of TAR180 (and to improve TIR70-180). Participants were trained on CGM target ranges; on how to use CGM data in real-time and retrospectively; and on food and lifestyle choices that aligned with the ADA Standards of Care recommendations, including basic healthy eating strategies and the diabetes “plate method.” Certified diabetes care and education specialists and/or study physicians were involved in providing the education. Up to seven guided education sessions with the participants occurred at visits 3, 4, and 5 (with option for visit 6) during the first 3 months and visits 8 and 9 (with option for visit 10) during months 3–6. These education sessions included discussing the ambulatory glucose profile (AGP) report (e.g., changes in AGP patterns and time in ranges from the last visit), identifying causes of TAR180, discussing food choices, and goal setting. An education session typically lasted up to 30 min.
Participants wore FreeStyle Libre Pro sensors for 2 weeks at baseline, 3 months, and 6 months to collect glucose data for the primary and secondary end points. The primary goal of the study was to reduce TAR180 by identifying and adopting diabetes self-care choices that reduced glucose excursions, particularly around meals.
CGM and food logging application
All study participants used the FreeStyle LibreLink app on their personal smartphones and were asked to scan glucose before and after meals/activity and to make notes using either the notes feature in LibreView or in the food logging app (see below). Participants were also asked to do goal setting each week.
An investigational food logging app was developed as a companion to the FreeStyle LibreLink app and was specifically designed to help individuals manage T2D by focusing on food choices as a part of this study. The app provided meal tracking options and personalized weekly reports to help support understanding the relationship between eating behaviors and glucose responses.
The food logging app was linked to a user’s LibreView account to receive the glucose data. Meals (food and/or drinks) were logged by text entry and/or photos, with the option to describe portion sizes. A glucose trace was annotated with the meal information, which allowed the user to see the meal along with the glucose levels. “Weekly Insight Reports” were also generated, which categorized the meals that resulted in the most TIR70-180 and TAR180.
Study end points
The primary end point of the study was mean reduction in TAR180 from baseline to 3 months within group as measured by the FreeStyle Libre Pro sensor. Key secondary end points included changes in TAR180 from baseline to 3 months (between groups), TAR180 from baseline to 6 months (within and between groups), and changes from baseline to 3 and 6 months (within and between groups) in HbA1c (%), body weight, and additional CGM-measured glycemic metrics, including TIR70-180, time above range >250 mg/dL (TAR250), time below range <70 mg/dL (TBR70), time below range <54 mg/dL (TBR54), mean glucose, and glycemic variability (standard deviation, “SD” and coefficient of variation, “CV”). Hyper- and hypoglycemic events (excursions of at least 15 min) were also recorded. Treatment satisfaction was assessed using the Diabetes Treatment Satisfaction Questionnaire (DTSQ) to determine baseline satisfaction (status version, “DTSQs”) and change in treatment satisfaction (change version, “DTSQc”). 19
Analysis populations
The full analysis set follows the intention-to-treat principle. All randomized participants are included. Participants withdrawn from the study before randomization are excluded from this analysis.
For measures derived from FreeStyle Libre Pro uploads, all randomized participants are included. At baseline, participants must have had at least 10 days of data recorded. In the assessment phases (at months 3 and 6), if a participant had less than 72 h of data, then the previous phase of results recorded in days −15 to 180 were used (i.e., the technique of “last observation carried forward” was used for missing data).
The per-protocol set includes all participants who completed 3 months of the study, except for participants who had protocol deviations that affected primary and secondary end points, and/or participants who did not have sensor utilization of at least 66%.
For glycemic metrics derived from the FreeStyle Libre Pro measurements, the per-protocol set included participants with at least 72 h of sensor glucose results in the assessment phase (days 75–90 or 165–180 as applicable). Safety analyses included all enrolled participants.
Sample size and statistical analysis
Sample size was calculated based on assuming at least 80% power to detect a change in TAR180 of 10% (2.4 h/day) within each group. The results from a previous study showed that the SD of the difference in TAR180 was 4.8 h/day. 20
All data analyses were carried out using SAS software, Version 9.4 (SAS Institute, Cary, NA). A paired t-test was used to compare baseline and assessment phase within each group. Differences between groups were assessed using analysis of covariance on baseline values. Confidence intervals of the least-square mean were calculated for each measure within each group.
Scoring for DTSQ was performed as described. 19 Responses are tabulated using the change version (DTSQc). Mean and spread of score for each group are presented. Eight items were scored from −3 to 3. A total treatment satisfaction score was also calculated by combining the scores for items 1, 4, 5, 6, 7, and 8. Perceived frequency of hyperglycemia and hypoglycemia was indicated by items 2 and 3, respectively.
Results
Study recruitment was conducted across four sites between 2021 and 2023. Supplementary Figure S2 shows the number of consented participants. The first participant enrolled on April 2, 2021, and the last participant enrolled on June 30, 2023. The final visit for the last participant was completed on November 20, 2023. A total of 304 participants were enrolled. Of these participants, 228 were ineligible, with the majority having not met the screening criteria (for HbA1c and TAR180). Four participants withdrew, and the remaining 72 eligible participants were randomized to the CGM alone group (n = 31) or the CGM plus food logging app group (n = 41). Following randomization, three participants withdrew from the CGM alone group and 9 from the CGM plus food logging app group.
The participant demographics and characteristics are shown in Table 1. Of the total randomized participants, 53% were male, 71% were White, and 93% had some form of college education (1–4 years) and/or university degrees. On average, randomized participants were 56 years old, had diabetes for 8 years, and a body mass index of 34 kg/m2. At baseline, participants had an HbA1c of 8.5%. Only 4% of participants identified as being Hispanic or Latino. All participants were on at least one diabetes medication in the classes of metformin, SGLT-2 inhibitors, GLP-1 agonists, and DPP-4 inhibitors.
Participant Demographics and Characteristics
BMI, body mass index; CGM, continuous glucose monitoring; HbA1c, glycated hemoglobin; SD, standard deviation.
Primary and key secondary outcomes
The full analysis set follows the intention-to-treat principle. A per-protocol analysis for the combined groups is also included in Supplementary Table S3 for reference. The primary outcome of TAR180 (within group) at 3 months compared with baseline, using 2-week blinded CGM assessment periods, showed significant reductions in both groups (Fig. 1). The CGM alone group showed a reduction in TAR180 of 28% (from 55% to 27%; P < 0.001), whereas the CGM plus food logging app group showed a reduction of 23% (from 53% to 30%; P < 0.001). Comparing baseline to 6 months, reductions in TAR180 were largely sustained for both the CGM alone group (from 55% to 21%; P < 0.001) and the CGM plus food logging app group (from 53% to 30%; P < 0.001). At 3 months there was no difference in the changes from baseline between the groups (P = 0.36), whereas at 6 months the difference from baseline reached statistical significance (P = 0.031). Combining all participants, the reduction in TAR180 was 26% at 3 months (from 54% to 29%; P < 0.001) and 28% at 6 months (from 54% to 26%; P < 0.001).

Time above range >180 mg/dL (TAR180) and time in range (70–180 mg/dL, “TIR70-180”) at baseline, 3 months, and 6 months.
Secondary outcomes such as TIR70-180 (Fig. 1) were assessed at both 3 and 6 months and compared with baseline. From baseline to 3 months, the CGM alone group showed an increase in TIR70-180 of 27% (from 45% to 72%; P < 0.001), whereas the CGM plus food logging app group showed an increase of 23% (from 46% to 69%; P < 0.001). Comparing baseline with 6 months, TIR70-180 was increased for both the CGM alone group (from 45% to 76%; P < 0.001) and the CGM plus food logging app group (from 46% to 69%; P < 0.001). There was no difference in the TIR70-180 changes between the groups from baseline to 3 months (P = 0.36) or from baseline to 6 months (P = 0.06). Combining all participants, the increase in TIR70-180 was 25% at 3 months from baseline (from 46% to 71%; P < 0.001) and 26% at 6 months from baseline (from 46% to 72%; P < 0.001).
Other CGM metrics also demonstrated within-group differences for each group and can be seen in Table 2. Combining both groups for all participants, TAR250 was reduced by 8% from baseline to 3 months (from 13% to 5%; P < 0.001) and by 8% from baseline to 6 months (from 13% to 5%; P < 0.001). Consequently, the number of events per day >250 mg/dL dropped from 1.5 events at baseline to 0.6 events at 3 months (P < 0.001) and 0.5 events at 6 months (P < 0.001).
Other Continuous Glucose Monitoring Metrics at Baseline, 3 Months, and 6 Months
Data are presented as mean ± SD. Within-arm comparisons were made at baseline and at 3 months or at 6 months, for the CGM alone group (N = 31), CGM plus food logging app (N = 41), and combined (N = 72).
CV, coefficient of variation.
For all participants, TBR70 increased from 0.1% at baseline to 0.8% at 3 months (P < 0.001) and 2.1% at 6 months (P < 0.001). TBR54 was less than 0.1% at baseline. It increased to 0.2% at 3 months (P = 0.001) and 0.6% at 6 months (P = 0.001). These changes are within the consensus target limits. At 6 months, the number of hypoglycemic events per day only rose to 0.3 events (<70 mg/dL) or 0.1 events (<54 mg/dL).
The mean glucose of all participants also demonstrated an improvement of 34 mg/dL from baseline to 3 months (from 193 to 159 mg/dL; P < 0.001) and by 39 mg/dL from baseline to 6 months (from 193 to 154 mg/dL; P < 0.001). The glucose variation as assessed by SD was reduced by 10 mg/dL from baseline to 3 months (from 47 to 37 mg/dL; P < 0.001) and by 11 mg/dL from baseline to 6 months (from 47 to 36 mg/dL; P < 0.001). In contrast, there were no significant changes in the CV for the participants.
In general, participants in both arms scanned consistently, and sensor and app utilization were similar among participants throughout the study. From baseline to 3 months, the CGM alone arm had 91% sensor active time with an average of 7.9 scans per day and the CGM plus food logging arm had 88% sensor active time with an average of 6.9 scans per day. From 3 to 6 months, the CGM alone arm maintained 90% sensor active time with an average of 6.6 scans per day and the CGM plus food logging arm had 87% sensor active time with an average of 5.8 scans per day.
The other two key secondary outcomes included the within-group differences in HbA1c and body weight (Fig. 2) at 3 and 6 months compared with baseline. At 3 months, both groups showed an HbA1c reduction of 1.1%; the CGM alone group reduced their HbA1c from 8.5% to 7.4% (P < 0.001), whereas the CGM plus food logging app group reduced their HbA1c from 8.4% to 7.3% (P < 0.001). At 6 months, the CGM alone group showed a reduction in HbA1c of 1.4% (from 8.4% to 7.0%; P < 0.001), whereas the CGM plus food logging app showed a reduction of 1.2% (from 8.4% to 7.2%; P < 0.001). There was no difference in changes between the groups from baseline to 3 months (P = 0.78) or from baseline to 6 months (P = 0.36). Combining all participants, the reduction in HbA1c at 3 months from baseline was 1.1% (from 8.4% to 7.3%; P < 0.001) and 1.3% at 6 months from baseline (from 8.4% to 7.1%; P < 0.001).
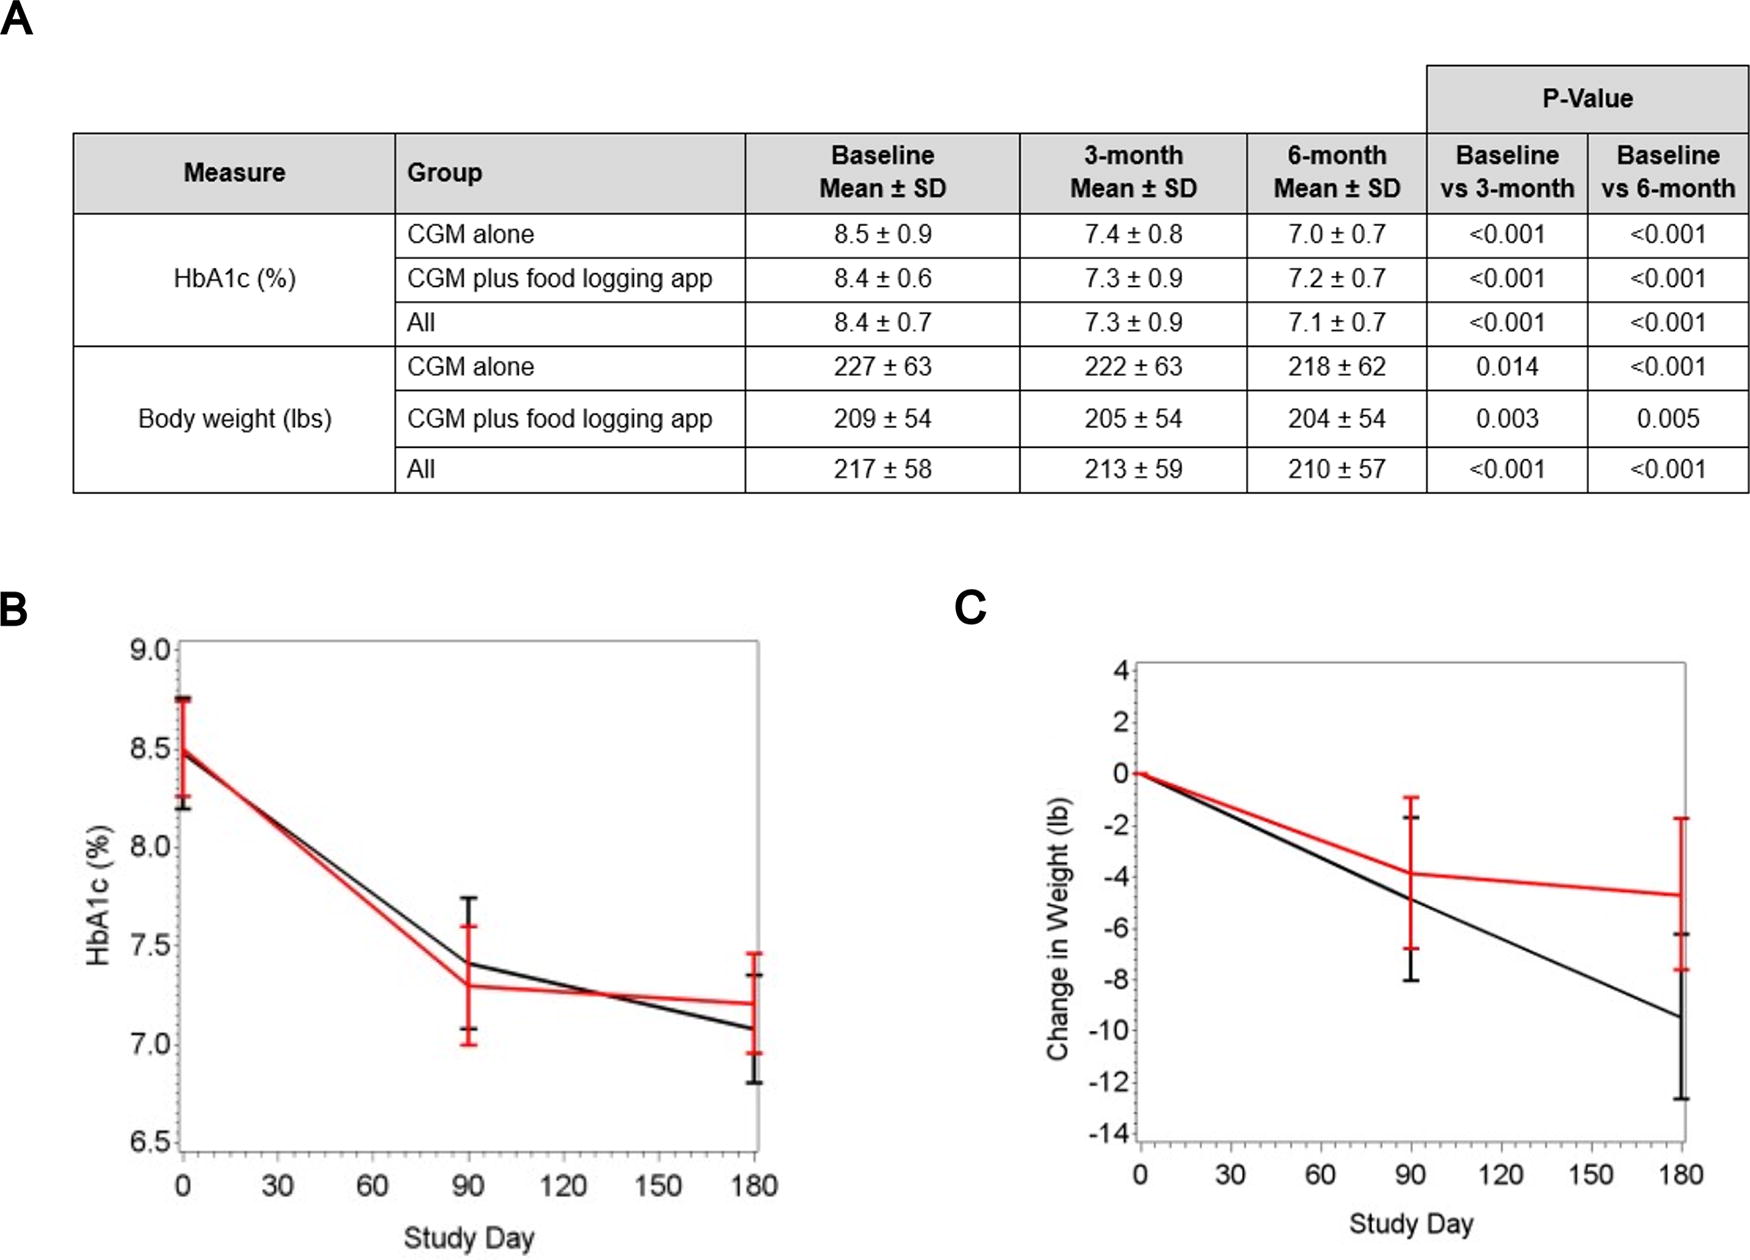
Glycated hemoglobin (HbA1c) and body weight at baseline, 3 months, and 6 months.
For body weight, the CGM alone group showed a reduction of 5 pounds (lbs.) at 3 months (from 227 to 222 lbs; P = 0.014), whereas the CGM plus food logging app showed a reduction of 4 lbs (from 209 to 205 lbs; P = 0.003). At 6 months, the CGM alone group showed a reduction of 9 lbs (from 227 to 218 lbs; P < 0.001), whereas the CGM plus food logging app showed a reduction of 4 lbs (from 208 to 204 lbs; P < 0.001). There was no difference in weight reduction between the groups at 3 months from baseline (P = 0.66) or at 6 months from baseline (P = 0.06). Combining all participants, the decrease in weight at 3 months from baseline was 4 lbs (from 217 to 213 lbs; P < 0.001) and 7 lbs at 6 months from baseline (from 217 to 210 lbs; P < 0.001).
Participant satisfaction
The DTSQ was used to measure patient satisfaction with treatment. Participants answered the questions in the DTSQ status version (DTSQs) at baseline and the DTSQ change version (DTSQc) at the 3- and 6-month end points. The DTSQc scores were tabulated (Table 3). Each item was scored from −3 to 3. Total treatment satisfaction (combination of items 1 and 4–8) was significantly increased in both groups at 3 and 6 months. Perception of hyperglycemia (item 2) was reduced only in the CGM plus food logging app group at 3 months and only in the CGM alone group at 6 months. Perception of hypoglycemia (item 3) was reduced in the CGM alone group at 3 months and in both groups at 6 months.
Participant/Treatment Satisfaction
Item 2 gives the perceived frequency of hyperglycemia score and item 3 the perceived frequency of hypoglycemia score. A lower score here indicates blood glucose levels that are perceived closer to the ideal.
The total treatment satisfaction score is the sum of items 1, 4, 5, 6, 7, and 8. Here, a higher score indicates greater satisfaction with treatment.
DTSQ, Diabetes Treatment Satisfaction Questionnaire; DTSQc, Diabetes Treatment Satisfaction Questionnaire (change version).
Adverse events
There were 127 adverse events among all enrolled participants (Supplementary Table S4). Only two of these were considered serious adverse events (symptoms related to COVID-19 or wildfire exposure). There were no episodes of diabetic ketoacidosis or hyperosmolar hyperglycemic state reported. There were no reports of hypoglycemic adverse events, including no severe hypoglycemia. There were also no unanticipated adverse events related to the device during the study.
Discussion
The objective of this study was to evaluate the impact of using CGM with or without a food logging app to reduce hyperglycemia in people with T2D not using insulin, by focusing on food and lifestyle choices. The primary end point was a within-group reduction of TAR180 at 3 months. This study showed that CGM use alone or with a food logging app resulted in improved glycemic outcomes in people with T2D who do not use insulin.
At 3 months, the primary outcome of reducing TAR180 was achieved for both the CGM alone group (from 55% to 27%) and the CGM plus food logging app group (from 53% to 30%). Combined, this results in a reduction of TAR180 from 54% to 29%, approaching the consensus target goal of 25% or below. 2,21 Secondary outcomes for all participants, such as TAR250 and TIR70-180, reached the clinical targets. HbA1c also decreased by 1.1% at 3 months. Importantly, all these improvements were essentially maintained at the 6-month time point, suggesting the durability of effect. With the above improvements in glycemic metrics, an increase in TBR70 was observed, but remained below the consensus clinical target of less than 4%, as would be expected in a population not using medications that pose risks for hypoglycemia. Overall, results from the DTSQ indicated an increase in total treatment satisfaction for all participants.
At the start of the study, participants were primarily taking metformin with or without additional medications, and these medications largely remained stable for the first 3 months (Supplementary Table S5). It is noteworthy to emphasize that the glycemic improvements in the first 3 months occurred in the near absence of medication changes, with only four participants requiring a change as directed by their health care provider (Supplementary Table S6). This suggests that the glycemic improvements during the first 3 months of the study were due to the value of CGM as a means to guide food and lifestyle choices. In the subsequent 3 months, when changes in medications were allowed if the participant’s primary care provider felt this was clinically indicated, 36 participants (60%) did not make changes in medication class or dose. In the 40% of participants who made a medication adjustment in the subsequent 3 months, 10 participants (17%) made additions (eight added GLP-1 agonists RAs and two added SGLT2 inhibitors), whereas three participants (5%) discontinued an existing medication. Eleven participants made only dose adjustments to one medication type, with seven participants (12%) increasing a dose and four participants (7%) decreasing a dose. The near absence of medication changes in the first 3 months and minor changes in the subsequent 3 months further highlight the impact of CGM on improvement in glycemic management.
Investigation of the impact of CGM in people with T2D who are not using insulin is important given that only 1.6% of this population were estimated to be CGM users during 2021. 8 Research in this population is ongoing, with some studies having been completed with results favoring CGM over finger-stick BGM. 18 The intent of our study was to further evaluate the effect of using CGM to help guide food and lifestyle choices in this population. When reviewing the recent IMMEDIATE study, 12 which examined a diabetes education program either with or without CGM utilization in individuals with T2D not using insulin, our results are similar. After 16 weeks, CGM users in the IMMEDIATE study showed improvements in TIR70-180 (56.3%–76.3%) and HbA1c (8.5%–7.6%). This is comparable to the 3-month results of the current study, with participants improving TIR70-180 from 46% to 71% and HbA1c from 8.4% to 7.3%. Of interest, the IMMEDIATE study used a comprehensive education program, whereas in our study, the study team (e.g., certified diabetes care and education specialists, registered dietitians, registered nurses) focused specifically on helping participants use CGM data to guide food and lifestyle choices. This likely underscores the importance of training and education to optimize CGM use. Perhaps integration of a more intensive education program into our study could have led to even better outcomes. Future research should consider the optimal frequency and type of education when using CGM to guide food and lifestyle choices; as well, future research should consider whether continuous CGM use is optimally effective or if intermittent use offers similar benefits.
Limitations
First, a significant portion of this study occurred during the COVID-19 pandemic, leading to unanticipated challenges such as requiring increased number of rescheduled visits due to illness and limiting opportunities to bring supportive companions to study visits. Second, the study duration was only 6 months, so it is unclear whether these benefits would be maintained or further improved in the long term. Third, since self-care behaviors were not measured, it is unclear what specific changes led to the reduction in TAR180 and improved TIR70-180. Fourth, regarding our participant characteristics, racial diversity largely mirrored the population of the United States, but Hispanics (4%) were underrepresented; as well, nearly 90% of our participants had at least some college education and many had advanced degrees. These facts may limit the generalizability of our findings. Finally, the food logging app experienced several technical issues due to mobile operating system upgrades, which may have limited the benefits of the app.
Conclusions
From baseline to 3 months, people with T2D not using insulin showed large, clinically significant improvements in TIR70-180 (from 46% to 71%), TAR180 (from 54% to 29%), and HbA1c (from 8.4% to 7.3%) when using either CGM alone or CGM plus a food logging app, and these improvements occurred with a near absence of medication changes. These improvements were maintained in the subsequent 3 months, when medication changes were permitted, with 60% of participants maintaining stable medication class and dose. This randomized control trial adds to the growing number of studies that demonstrate the value of CGM for people with diabetes who are not treated with insulin.
Footnotes
Acknowledgments
The authors would like to kindly thank all the participants in the study. The efforts of the study staff (e.g., certified diabetes care and education specialists, registered dietitians, registered nurses) are also greatly appreciated.
Role of the Sponsor
Authors’ Contributions
T.W.M., H.J.W., R.M.B., D.F.K., E.K.-F., and D.W.S. were investigators for the study. T.W.M., H.J.W., and R.M.B. were involved in the initial conception and design of the study. All authors were involved in the analysis, the interpretation of the results, and the drafting of the article. T.W.M. is the guarantor of this work and, as such, had full access to all the data in the study and takes responsibility for the integrity of the data and the accuracy of the data analysis.
Author Disclosure Statement
T.W.M. has received research support, has acted as a consultant, or has been on the scientific advisory board for
Funding Information
No funding was received for this article.
Supplementary Material
Supplementary Figure S1
Supplementary Figure S2
Supplementary Table S1
Supplementary Table S2
Supplementary Table S3
Supplementary Table S4
Supplementary Table S5
Supplementary Table S6
References
Supplementary Material
Please find the following supplemental material available below.
For Open Access articles published under a Creative Commons License, all supplemental material carries the same license as the article it is associated with.
For non-Open Access articles published, all supplemental material carries a non-exclusive license, and permission requests for re-use of supplemental material or any part of supplemental material shall be sent directly to the copyright owner as specified in the copyright notice associated with the article.
