
Abstract
Background:
Use of automated insulin delivery (AID) systems improves glycemic control, however, racial and ethnic disparities in glycemic control among youth with type 1 diabetes (T1D) persist. We studied whether the Omnipod 5 (OP5) AID system could close gaps in glycemia between White and Black youth with T1D.
Methods:
This retrospective longitudinal analysis compared matched pairs of White and Black youth with T1D using OP5 at two pediatric academic centers. In unadjusted and adjusted models, we assessed changes in the gap in time in range (TIR), average continuous glucose monitor (CGM) glucose, and hemoglobin A1c (HbA1c) between White and Black youth from baseline to 9 days and 90 days.
Results:
Matched pairs (n = 132) of White and Black youth using OP5 (61% female, mean age 11.6 years, 40% publicly insured, median T1D duration 2.9 years, mean HbA1c 8.6%) were included. Within 9 days of OP5 use, the baseline TIR gap of 7.8% points decreased to 3.9% points (P = 0.052), and the average CGM glucose gap of 20.5mg/dL at baseline decreased to 8.0 mg/dL (P = 0.012), demonstrating a reduction in the gap between groups. At 90 days, there was no significant reduction in gap from baseline for TIR (P = 0.35) or CGM glucose (P = 0.09). When adjusting for insurance and baseline insulin delivery method, there was no significant reduction in gaps at either 9 days or 90 days. All youth had decreases in HbA1c. At 90 days, time in automated mode (88% vs. 94%, P < 0.0001) and boluses per day (3.9 vs. 5.3, P < 0.0001) were lower in Black youth. In multivariable analysis, youth transitioning to OP5 from multiple daily injections had the greatest increases in TIR at 9 days (P < 0.001) and at 90 days (P < 0.01).
Conclusions:
Gaps in TIR and average CGM glucose between White and Black youth narrow with AID use, but do not close completely. Equitable access to AID should be encouraged for all youth, however, differences in AID interaction emphasize the need for additional interventions to overcome social determinants of health that likely explain the inability of diabetes technology to fully close the gaps.
Introduction
Use of diabetes technology, including continuous glucose monitors (CGM), insulin pumps, and automated insulin delivery (AID) systems, in both youth and adults with type 1 diabetes (T1D) has increased. 1 The first AID system received FDA approval in 2016 and as of 2020 nearly 30% of people with T1D captured in the T1D Exchange QI Consortium were using these systems. 2 Use of AID systems in clinical trials and real-world studies has led to significant glycemic benefits, including increased time in range (TIR, 70–180 mg/dL), 3,4 less time spent in hypoglycemia, 5 and lower hemoglobin A1c (HbA1c) levels. 1,3
The Omnipod (OP5) tubeless AID system was FDA approved for children ages 2 and older in 2022. Clinical trials in youth using the OP5 system demonstrated efficacy with a 15.6%-point increase in TIR for youth ages 6–13.9 years, 6 and the percentage of children ages 2–5 attaining the HbA1c target of <7.0% increasing from 31% to 54%. 7 These improvements in glycemia were echoed in a real-world cohort of nearly 70,000 OP5 users across various age groups. 8 In our previous studies of youth switching to OP5, we demonstrated improvements in percent TIR within 9 days of OP5 initiation, with these improvements sustained over the first 90 days. 4
Despite the known benefits of AID use, there are inequities in utilization between racial and ethnic groups, confounding already existing disparities in glycemic outcomes. 4 For decades, research has shown that non-White youth with T1D, including those identifying as non-Hispanic Black and Hispanic, have higher HbA1c levels 9 –11 and have greater risk for diabetes-related complications than their White peers, with the most disparate outcomes occurring in non-Hispanic Black youth. 11 Our prior real-world studies of AID systems have shown overall glycemic improvements in diverse cohorts of youth with T1D, yet to our knowledge, there are no data assessing whether the use of AID systems can close the gap in glycemic control between White and Black youth. With its tubeless design and approval for ages ≥2 years, the OP5 AID system is widely used in pediatrics and so we sought to further study the impact of this system on closing glycemic gaps in youth. We hypothesize that use of the OP5 AID system could close the gap in TIR and HbA1c between White and Black youth with T1D.
Methods
Study Design
This is a retrospective study of youth with T1D using the OP5 AID system at the Johns Hopkins Pediatric Diabetes Center (JHU) and the Children’s Hospital of Philadelphia (CHOP). Data were collected from July 2022 through June 2024. IRB approval was obtained at both institutions in accordance with the Declaration of Helsinki with a waiver of consent.
Inclusion and Exclusion Criteria
Youth were included if they were between ages 2 and 21 years, were diagnosed with T1D for more than a month at OP5 start, and were using an OP5 insulin pump. Subjects were excluded if they had less than 10% time in automated mode in the first 90 days of OP5 use, or if verifiable follow-up data were not available in Glooko. Youth included in the “White” group self-identified as non-Hispanic White, while youth in the “Black” group identified as non-Hispanic Black, Hispanic Black, or as multiracial, including Black.
Each Black subject was matched with a White subject based on similar demographic and diabetes characteristics: sex, age (±2 years), OP5 start date (within 200 days), duration of diabetes (>1 year or <1 year), and site. Although the initial design included matching for insurance type (public vs. private), there were an insufficient number of publicly insured White youth; insurance type was therefore included as a covariate in the multivariate models. At JHU, 81 Black youth met the inclusion criteria and at CHOP, 51 Black youth met the inclusion criteria. All Black youth were matched to the closest eligible candidate from a pool of 182 White youth at JHU and 286 White youth at CHOP.
Data Collection
Demographic data, clinical diabetes data, and HbA1c values were collected from the electronic health records. Study data were collected and managed using REDCap electronic data capture tools hosted at JHU and CHOP. 12,13 Baseline HbA1c values were recorded up to 180 days before starting OP5. Follow-up HbA1c values were collected approximately 90 days after starting OP5 (the closest value to 90 days between 6 weeks and 12 months). For youth using the Dexcom G6 CGM before OP5 initiation, baseline CGM data from the 14 days before OP5 initiation were collected from Dexcom Clarity. If the subject was not using CGM in the 14 days immediately before OP5 initiation but had recently used CGM, the most recent 14-day data within 90 days before OP5 start were used. Baseline CGM data were not available for youth who were CGM naïve. We collected OP5 data from Glooko to capture the first nine days of OP5 use, based on previously published data from our group, 4 and the first 90 days on the system.
Outcomes Measured
The primary outcome was the change in the gap in TIR between the Black and White cohorts. This outcome was evaluated at 9 days of OP5 use, and at 90 days of OP5 use. The secondary outcomes were differences in the gaps in average CGM glucose and HbA1c. Other CGM parameters, including the gaps in time above range (TAR), time below range, time in automated mode, glucose management indicator (GMI), and coefficient of variation, were considered exploratory outcomes to be investigated only if primary or secondary outcomes were significant.
Statistical Analysis
A priori power calculations aimed to achieve 80% power with a type 1 two-tailed error rate of 5%. The primary outcome is a 5%-point change in the TIR gap between Black and White youth. Assuming a TIR gap standard deviation of 19% points and estimated attrition of 12.5% due to missing data, a minimum sample size of 131 Black/White pairs (262 total subjects) was required.
Duration of diabetes and percentage of CGM time active are highly skewed variables and are presented as median and IQR. All other continuous variables are presented as mean and standard deviation. Categorical variables are presented as frequency and percentage of the total or stratified group. For descriptive tables, differences between groups were tested using Wilcoxon rank-sum tests, two-sample t tests, or chi-squared tests, as appropriate. GMI is automatically calculated only when at least 12 days of CGM data associated with OP5 use are available. For this article, GMI for days 1–9 was calculated using the published formula as follows: 3.31 + (0.02392 × average glucose). 14
To evaluate changes in the gap in glycemic control from baseline to follow-up, subjects were evaluated in matched Black and White pairs. For CGM-related data, only those pairs with CGM time active >15% at both baseline and follow-up were analyzed (n = 222). For HbA1c outcome, only pairs in which both subjects had baseline and follow-up HbA1c data available were analyzed (n = 258). Gaps between matched pairs were measured at baseline and follow-up periods. Differences between baseline gaps and follow-up gaps were measured and tested for significance using paired t tests. Differences between baseline and follow-up gaps were all approximately normally distributed, except for CGM time below range (<54 mg/dL and 55–69 mg/dL). For time below range comparisons, Wilcoxon sign rank tests were used to test differences in gaps. Because there were significant differences in average CGM glucose, exploratory testing for changes in other related CGM variables was also conducted.
Multivariable models were created for the primary and secondary outcomes, TIR and average CGM glucose at 9 days and 90 days, and HbA1c at 90 days. The outcome measures of these models are the differences in the variable of interest from baseline to follow-up. The primary covariate of interest is race. The goal is to understand whether AID can close gaps in glycemic control by assessing the difference in estimated changes in glycemic control in the Black and White youth groups, when the model is controlled with possibly confounding variables. Covariates in the models include site, insurance type, sex, age, multiple daily injections (MDI) use at baseline, duration of T1D, diabetic ketoacidosis at diagnosis, and percentage of time in OP5 automated mode. TIR at baseline is purposefully excluded from the models due to collinearity with race; controlling for baseline TIR would wash out the association of interest, race, and improved glycemic control. Of secondary interest is understanding what other variables are associated with improvements in glycemic control in this matched sample of subjects. Analyses were conducted using SAS software v. 9.4 (SAS Institute, Cary, NC, 2020).
Results
A total of 132 matched pairs were included, with a mean age of 11.6 years (range 2–20), 61% were female, and 40% had public insurance. At baseline, the median duration of T1D was 2.9 years (1.3, 5.9), with mean HbA1c of 8.6% (SD 2.4). For those pairs with CGM data at baseline and follow up (n = 111 pairs), the average CGM glucose at baseline was 214 mg/dL (± 47.1), with TIR of 40.5% (±18.1). As shown in Table 1, Black youth have a higher mean HbA1c (9.1 vs. 8.0%, P < 0.001), higher average CGM glucose (224 vs. 204 mg/dL, P < 0.01), and lower TIR (37 vs. 44%, P < 0.01) at baseline. Black youth were also more likely to be publicly insured (60 vs. 21%, P < 0.001), and this was accounted for in the multivariable analysis described below.
Baseline Characteristics of Subjects at Initiation of Omnipod 5
aStudent's two sample t-test. bPearson's chi-squared test.cWilcoxon rank-sum test.
Note: HbA1c, hemoglobin A1c; DKA, diabetic ketoacidosis; CGM, continuous glucose monitor; T1D, type 1 diabetes.
Groups are matched on sex, age (within 2 years), site, and Omnipod 5 start date (within 200 days), duration of diabetes (>1 year or <1 year); CGM and HbA1c data are only presented where matches both have complete baseline and follow-up data.
There were several differences in the cohorts between sites (Supplementary Table S1). At CHOP, youth initiating OP5 were more often female (68.6% vs. 55.6%, P = 0.04), had a shorter median duration of T1D (1.8 vs. 3.4 years, P < 0.01), and were more likely to have transitioned from MDI (78 vs. 27%, P < 0.001).
As shown in Table 2, the baseline TIR gap between the cohorts was 7.8% points, which decreased to 3.9% points within 9 days, representing a decrease in the gap of 3.9% points (95% CI: –7.8 to 0, P = 0.052). Within 90 days of starting OP5, the TIR gap decreased to 6.1% points, representing a gap decrease of 1.7% points (P = 0.35) from baseline (Fig. 1).
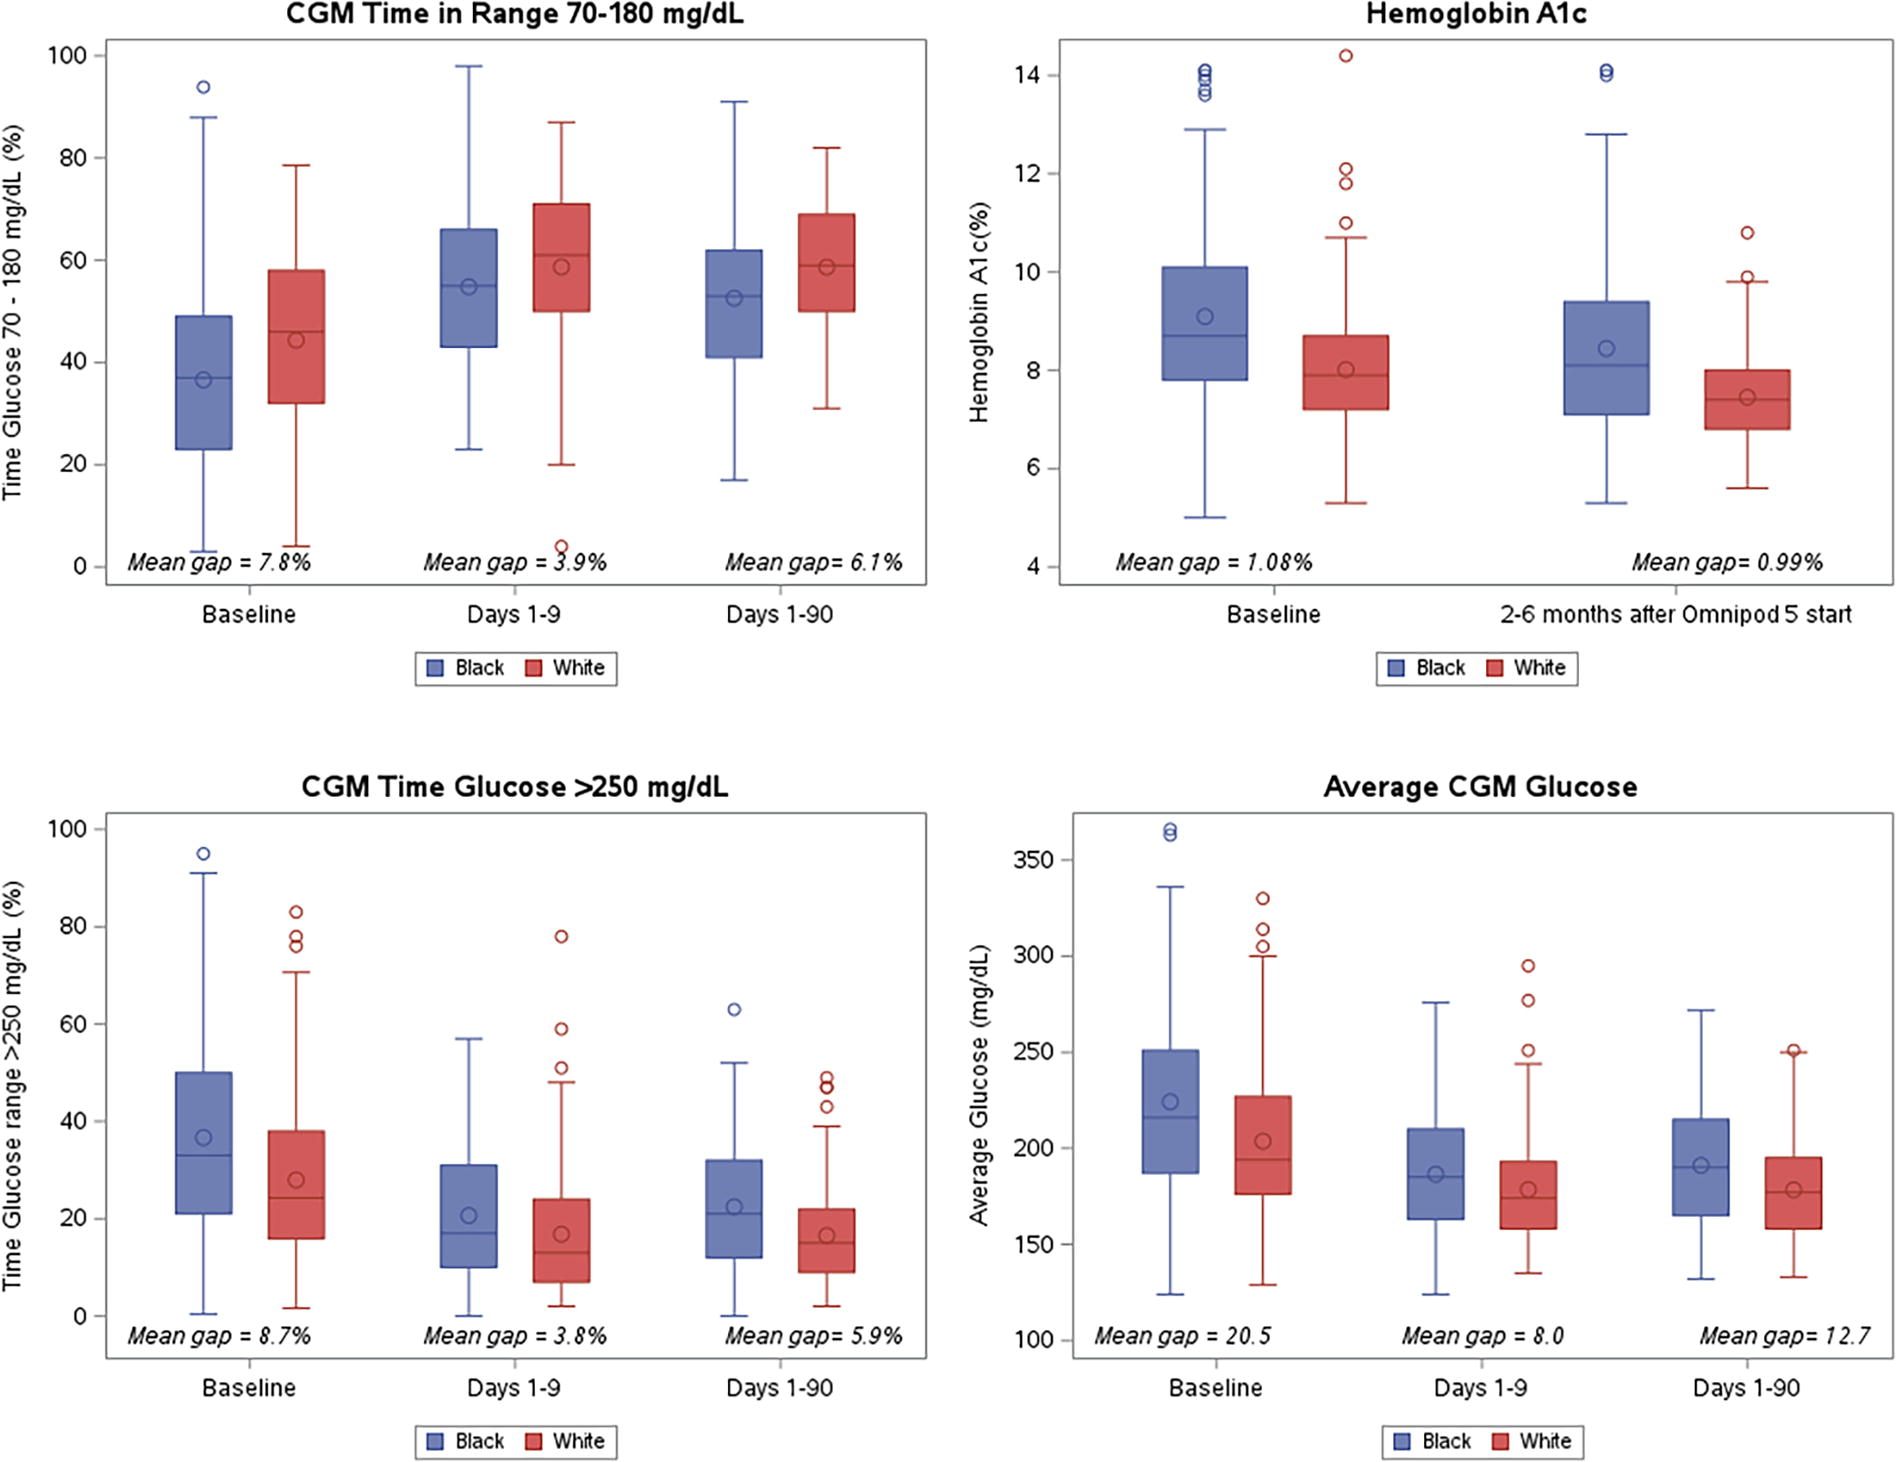
Glycemic control at baseline and after initiation of Omnipod 5. Median is represented by the center line. Upper and lower quartiles are represented by the top and bottom edges of box plot, respectively. Central circle represents the mean. The top and bottom whiskers represent the maximum and minimum observations within 1.5 times the interquartile range (IQR) from the ends of the box. All other observed datapoints are plotted as outliers.
Change in Gap in Glycemic Measures at Baseline and After Beginning Omnipod 5 (n = 222, 111 matched pairs)
Paired t tests, except the following variables: total time below range, low, and very low, which were evaluated with Wilcoxon sign-rank tests; mean and SD shown.
Mean gap is defined as the value for Black individuals minus the value for White individuals.
The baseline average CGM glucose gap of 20.5mg/dL between the cohorts decreased to 8.0 mg/dL within 9 days of starting OP5, representing a mean gap reduction of 12.5 mg/dL (95% CI: –22.2 to –2.9mg/dL, P = 0.012). Within 90 days, the mean gap decreased to 12.7 mg/dL, representing a nonsignificant reduction in the gap of 7.9 mg/dL (P = 0.09).
Both groups experienced decreases in TAR (>180 mg/dL and >250 mg/dL) with OP5 use. The mean TAR >250 mg/dL gap decreased from 8.7% points to 3.8% points within 9 days, representing a statistically significant mean reduction in the gap of 4.9% points (95% CI: –9 to –0.8%, P = 0.02). After 90 days of OP5 use, the gap was 5.9% points, representing a mean reduction in gap of 2.8% points from baseline, but this was not statistically significant (P = 0.15). The gap in TAR > 180 mg/dL decreased from baseline to 9 days (7.2% points to 3.6% points, P = 0.09) and 90 days (7.2% points to 5.8% points, P = 0.47).
The baseline average GMI gap between the cohorts was 0.5% points and decreased to 0.2% points within 9 days of starting OP5, representing a mean gap reduction of 0.3% points (95% CI: –0.5 to –0.1 mg/dL, P = 0.009). There was no statistically significant change in the GMI gap at 90 days. Both groups had similar decreases in HbA1c levels of approximately 0.6% points with no significant reduction in the gap. Missing data analysis was conducted and there was no statistically significant difference in the baseline HbA1c of those with missing CGM data compared with those with complete CGM data.
As shown in Table 3, there was no difference in automated mode use between the groups in the first 9 days of OP5 use (P = 0.44), however, the Black cohort spent less time in automated mode during days 1–90 (88% vs. 94%, P < 0.001). The Black cohort had fewer bolus entries (at 90 days 3.9 vs. 5.3, P < 0.001) and carb entries per day (at 90 days 3.1 vs. 4.5, P < 0.001) and used activity mode less frequently than the White cohort (at 90 days 0% vs. 1%, P < 0.001) during both time windows of OP5 use.
Summary Pump and Continuous Glucose Monitor Usage (n = 264)
Note: median (IQR) shown.
Wilcoxon rank-sum test.
Multivariable models (Table 4, 5, 6 and 7) assessing factors associated with changes in TIR from baseline to 9 days and 90 days demonstrated that those who transition to OP5 from MDI had a greater increase in TIR (β 9.4, 95% CI: 4.8, 14, P < 0.001; and β 6.1, 95% CI: 1.8, 10.3, P < 0.01, respectively). Similarly, those who were using MDI at baseline also had a larger decrease in average CGM glucose at 9 days and 90 days (β −23.5, 95% CI: −34.8, −12.3, P < 0.001; and β −17.4, 95% CI: −28.1, −6.7, P < 0.001, respectively) when controlling for other factors. At 9 days, time in automated mode was associated with improvements in TIR (P = 0.0001), average CGM glucose (P = 0.039), and TAR >250 mg/dL (P = 0.03), but this did not persist to 90 days. There were no other significant predictors when controlling for sex, race, site, insurance type, age at OP5 start, duration of diabetes, and time spent in automated mode. Importantly, once all factors were adjusted for in the model, there were similar improvements in TIR, average CGM glucose, and HbA1c regardless of race at all time points.
Multivariable Analysis with Outcome: Change in Average Time in Range
Adjusted models also control for site, sex, age, duration of diabetes, and DKA at diagnosis.
MDI, multiple daily injections.
Multivariable Analysis with Outcome: Change in Average Continuous Glucose Monitor Glucose
Adjusted models also control for site, sex, age, duration of diabetes, and DKA at diagnosis.
MDI, multiple daily injections.
Multivariable Analysis with Outcome: Change in Average Hemoglobin A1c
Adjusted models also control for site, sex, age, duration of diabetes, and DKA at diagnosis.
MDI, multiple daily injections.
Multivariable Analysis with Outcomes: Change in Continuous Glucose Monitor Glucose >250 mg/dL
Adjusted models also control for site, sex, age, duration of diabetes, and DKA at diagnosis.
MDI, multiple daily injections.
Discussion
In this multicenter analysis of youth with T1D, we sought to determine if use of the OP5 AID system could close gaps and mitigate long-standing inequities in glycemic control between White and Black youth. Although the gap in TIR, average CGM glucose, and GMI narrowed between the two cohorts in the first 9 days of OP5 use, these gaps did not close completely. Similar to other studies of AID systems, 6,15 –17 youth switching from MDI to AID experienced the greatest benefits from OP5 use. 18 It is also well-recognized that those with lower baseline TIR experience greater improvements in TIR with AID use. 19 –22 Despite these improvements, racial disparities in glycemic control remain, reinforcing prior findings that racial and ethnic differences in rates of technology use alone do not account for the gap in glycemic control between White and Black youth. 23,24 These findings indicate the need for further efforts to support health equity and adoption of technology for all youth with diabetes.
Use of the OP5 AID system led to improvements in CGM parameters for all youth—including higher TIR, lower average CGM glucose, and lower TAR. The gaps in these parameters between White and Black youth narrow, suggesting that, for those who are able to access technology, AID use decreases inequities rather than worsening them. However, the gaps in glycemic metrics between those who do and do not use technology will likely widen. 25 Significant racial and socioeconomic disparities in diabetes technology use exist, and thus, there is a need for efforts to support health equity when offering and providing technology to all youth with T1D. Several initiatives aimed at overcoming barriers to technology use have included early initiation of CGM and insulin pumps at diagnosis, complementary CGM placement at routine outpatient visits, and additional technology support with initiation of AID. 26 –30
Similar to other studies, our results also demonstrate the consistency in improved glycemic control experienced by patients utilizing AID systems. In our prior study assessing real-world use and glycemic outcomes of OP5, we demonstrated that improvements in glycemic control, including increased TIR and decreased average CGM glucose, occurred within the first 9 days of OP5 use and then remained stable throughout the first 90 days of use. 4 A trial of very young children with OP5 showed improvements in TIR and other CGM parameters within the first 3 months of OP5 and continued over time for up to 2 years. 8,17,31 These improvements are realized despite decreases in bolus frequency that are often seen with longer duration of AID use. 4,6,32 –34 In this study, there was no difference in the time spent in automated mode between groups in the first 9 days of OP5 use, during which time we also saw the greatest narrowing of the gap in TIR and average CGM glucose. However, when we evaluated the entire 90-day period, time in automated mode was higher in the White cohort and the gap between White and Black youth widened following the first 9 days of improvement. There is a strong association between time in automated mode and TIR. 35 To close this gap in time automated mode and TIR, it is important to educate patients and caregivers on the different modes of the pump, the importance of bolusing for carbohydrate intake, and maximizing time in automated mode.
Whereas gaps in TIR, TAR, and GMI between Black and White youth narrowed with OP5 use, we did not identify a significant change in the HbA1c gap. HbA1c levels improved in all subjects after starting the OP5 system, which we have shown previously in other studies of AID use, 4,34 but the disparate gap in HbA1c between Black and White youth remains. It is reported that HbA1c overestimates mean glucose concentration in Black individuals, likely due to differences in glycation of hemoglobin or red blood cell turnover. 36 With this knowledge, and the increasing use of telemedicine in diabetes care where HbA1c levels are not always measured, 37 it highlights the need to be mindful of the outcome variables chosen to assess for the ability of technology to close long-standing gaps in glycemic outcomes.
A strength of this study is the large and diverse sample size from multiple institutions, thereby increasing the generalizability of the study. In addition, access to digital CGM and pump data ensured detailed and accurate data. However, this study is limited by the retrospective design, where inherent to the design, there may have been some data missingness. As telemedicine appointments have become more common, HbA1c data from clinical care are less widely available, and thus, HbA1c was a secondary outcome of this study. Not all subjects used CGM, and those pairs with missing CGM data could not be evaluated for CGM metrics. Although we matched for other demographic characteristics, we were unable to match our pairs for insurance type, a surrogate marker for socioeconomic status, and there were significant differences in the percentage of publicly insured youth between the groups. These characteristics likely reflect real-world differences between the groups, as demonstrated by the unadjusted analyses. This study was limited to evaluation of the OP5 AID system, so results may not be applicable to other hybrid closed-loop systems.
Conclusions
In summary, we demonstrate that use of the OP5 AID system was associated with a narrowing of the gap in TIR and average CGM glucose between White and Black youth but does not completely mitigate disparities in glycemic control. All users of the OP5 system experienced improvements in glycemic control, with patients transitioning from MDI experiencing the greatest benefit. Given the known racial/ethnic disparities in technology usage, promoting use of diabetes technologies to all patients with diabetes may help continue to close gaps in care and outcomes. The inability to completely close these gaps highlights the persistent need to prioritize health equity, health literacy, and efforts to address social determinants of health. Future studies could explore more long-term usage data of OP5 and other AID systems, as well as efforts to increase uptake of technologies in underserved communities.
Footnotes
Authors’ Contributions
B.E.M., E.B., and R.M.W. formulated the clinical question. D.P., G.M., T.D., S.M., and S.G. collected data. B.E.M. and R.M.W. wrote the article with contributions from D.P., G.M., T.D., and E.B. E.B. completed the statistical analyses and created the figures and tables. All authors made critical contributions to the article. All authors edited, reviewed, and approved the article.
Author Disclosure Statement
R.M.W is supported by the National Institutes of Health (1R01DK134955 and 1R01EY033233). R.M.W. is the site PI of sponsored clinical trials by Novo Nordisk, Lilly Diabetes, and Sanofi. B.E.M. is supported by the National Institutes of Health (PI: Marks, NIH: K23DK129827), and has received investigator-initiated research support from Tandem Diabetes Care, Inc, and the Cystic Fibrosis Foundation, industry-sponsored research support from Medtronic, research supplies from Dexcom, Inc. and Diagnostics, and consulting fees from Insulet. The other authors have no conflict of interest to disclose.
Funding Statement
This was an investigator-initiated study, and no funding was received from Insulet.
Supplementary Material
Supplementary Table S1
References
Supplementary Material
Please find the following supplemental material available below.
For Open Access articles published under a Creative Commons License, all supplemental material carries the same license as the article it is associated with.
For non-Open Access articles published, all supplemental material carries a non-exclusive license, and permission requests for re-use of supplemental material or any part of supplemental material shall be sent directly to the copyright owner as specified in the copyright notice associated with the article.