




Abstract
Background:
Automated insulin delivery (AID) systems improve glycemic outcomes, but the roles of user interaction and insulin pump settings in these findings remain underexplored.
Objective:
To investigate how AID initiation influenced glycemic outcomes over a year and assess the impact of user behavior and insulin pump settings.
Methods:
This was a retrospective observational study on real-world data from 156 pediatric individuals initiating AID (Tandem Control-IQ or MiniMedTM 780G). Data collected at baseline and a year following AID initiation included measures of glycemic outcomes, user interaction (e.g., daily meals, carbohydrates, and user-initiated insulin bolus), and insulin pump settings.
Results:
Percentage of time in range (TIR: 3.9–10.0 mmol/L) improved after AID initiation and remained stable over the follow-up year (baseline: 61.9% vs. month 12: 69.1%, P < 0.001). The percentage of individuals reaching target (TIR >70%) declined after an initial increase (baseline: 29.5% vs. month 1: 60.0% vs. month 12: 43.7%, P < 0.005). The predefined measures for user interaction also increased over a year, such as user-initiated insulin boluses (baseline: 53.7% of total daily dose [TDD] vs. month 12: 59.9% of TDD, P = 0.034), reduced carbohydrate intakes relative to body weight (baseline: 5.0 g/[kg·d] vs. month 12: 4.6 g/[kg·d], P = 0.004), and longer active continuous glucose monitoring (CGM) wear time (baseline: 87.2% vs. month 12: 94.1%, P = 0.011). A positive association between TIR and daily registered meals (P < 0.001) and daily registered carbohydrates (P = 0.003) was found in the multivariate analysis while adjusting for insulin pump settings and total daily insulin dose.
Conclusion:
Glycemic outcomes improved 12 months after AID initiation and were positively associated with the number of meal announcements and daily carbohydrates registered in the pump. User-initiated bolus insulin and percentage of active CGM wear time had no impact on AID performance. Our findings emphasize the importance of continuous assessment of diabetes management, even with advanced technology, as user engagement remains crucial.
Introduction
Diabetes technology has become increasingly accessible, and it is widely accepted that automated insulin delivery (AID) systems improve glycemic outcomes across all age-groups for individuals with type 1 diabetes (T1D). 1 –6 These systems use insulin-dosing control algorithms that continuously deliver insulin in response to continuous glucose monitoring (CGM). In Denmark, several AID systems are used for adults and children, but the first introduced and most frequently used are as follows: The MiniMedTM 780G system (Medtronic, Northridge, CA) and Tandem t:slim X2 Control-IQ system (Tandem Inc., San Diego, CA). Both systems are advanced hybrid closed-loop systems, meaning they rely on users’ interaction, for example, announcing carbohydrate intake in meals and partaking in exercise.
The superiority of AID treatment in achieving better glycemic outcomes has been demonstrated in randomized controlled studies and subsequently confirmed in real-world settings, showing significant improvements in time in range (TIR; 3.9–10.0 mmol/L) without increasing the time spent below range (TBR; <3.9 mmol/L). 1,2,4,7 –11 Some studies have even reported improvements in TBR. 12,13 Until now, the primary focus has been on identifying optimal AID settings. For the 780G system, a blood glucose target setting of 5.5 mmol/L and an active insulin time (AIT) of 2 h have been shown to be associated with TIR and HbA1c, without increasing TBR in people aged 15 years old and above. 5,8,14 For individuals under 15 years of age, a target of 6.1 mmol/L with no change in AIT may provide similar TIR and a reduced TBR. 14 The insulin pump settings for the Tandem Control-IQ system have been less extensively studied. However, a recent real-world study found that having a more aggressive insulin sensitivity factor (ISF) improves TIR without affecting TBR. 15,16 Despite these advancements, there is still a need to explore how AID initiation influences the users’ interaction with the system and the factors associated with glycemic outcomes.
Consequently, we aimed to examine how AID usage correlated to change in TIR over a year of follow-up while also exploring the relationship between user-interaction measures and glycemic outcomes when adjusting for AID settings. We hypothesized that increased user interaction would be positively associated with improved glycemic outcomes, regardless of AID settings.
Materials and Methods
This retrospective longitudinal study used real-world data from individuals with T1D, aged 0–18 years, who attended Steno Diabetes Center Copenhagen (SDCC), Denmark. SDCC provides care to approximately 1000 children and adolescents, of whom 194 were treated with an AID system at the time of data collection. The study was approved by the Danish Data Protection Agency in the Capital Region (R-22031406).
Study population and data
The study includes individuals initiating AID treatment in the period April 2020 to October 2022. Data were collected at four different time points for each individual: before starting AID (baseline) and 3, 6, and 12 months after AID initiation. At each timepoint after AID initiation, 90 days of data were collected and subsequently divided into 3 periods, each of 1 month duration. In order to be eligible for inclusion, participants needed to have sufficient data (defined as at least 10 days per month, with 70% active CGM wear time) in no less than 3 periods with a minimum of 2 months between the first and the last period throughout the year of follow-up. CGM and insulin pump data should be accessible at relevant uploading platforms as follows: (1) CareLink Professional (Medtronic); (2) Diasend (Palo Alto, CA); (3) Glooko (Palo Alto, CA); (4) LibreView (Abbott, Abott Park, IL); or (5) Stenopool (SDCC’s own uploading system).
Data on date of birth, sex, diabetes duration, AID system, previous treatment, HbA1c, weight, height, Z-body mass index (BMI) scores, severe hypoglycemic events, and diabetic ketoacidosis (DKA) were extracted from the electronic medical records (EPIC Systems, Verona, WI) for the period spanning 6 months before to 15 months after AID initiation. From this dataset, the closest available values to predefined time points (baseline, 3, 6, and 12 months) were selected for analysis.
The primary outcome was change in TIR from baseline to 12 months after AID initiation. Secondary outcomes were time in tight range (TITR; 3.9–7.8 mmol/L), TBR, time above range (TAR; >10.0 mmol/L), HbA1c, glycemic risk index (GRI), and safety measures (hospital admissions due to DKA or severe hypoglycemia [loss of consciousness and/or seizures]).
User interaction and insulin pump settings
Parameters to identify user interaction were chosen by the clinical experts within the study group and were as follows: grams of carbohydrates entered per day, number of meals per day (one meal was defined as all carbohydrates announced within a 2-h window), mean number of days between infusion set changes, percentage of daily user-initiated bolus insulin (calculated as a percentage of the total daily dose [TDD] and included all user-initiated insulin on a daily basis), and percentage of the active CGM wear time. For the latter, we grouped individuals into “high wear time” (≥85% active CGM wear time) and “low wear time” (<85% active CGM wear time) groups.
Insulin pump settings were grouped into two categories as follows: optimal and suboptimal. Based on findings from previously conducted real-world studies of the MiniMed 780G pump, a blood glucose target of 5.5 mmol/L and AIT of 2 h were set to “optimal.” 5,8,14 The target and AIT values were calculated as the average for each period. For the Tandem Control-IQ, we grouped users based on ISF. Those with ISF ≤100/TDD were grouped as “optimal,” whereas the rest were grouped as “suboptimal.” 16
Statistical analyses
Clinical and baseline characteristics are presented as mean and standard deviation (SD) if continuous and percentages if numeric. The overall correlations between TIR, TITR, and GRI were analyzed using Pearson’s correlation coefficient. The changes in user-interaction measures and insulin pump settings are reported as mean and SD. Statistical differences between time points were assessed using linear mixed modeling for numeric variables with time as fixed effect and subjects set as random effect, with no adjustment for age, sex, and diabetes duration. For categorical outcomes, differences were assessed using chi-square tests/generalized linear mixed modeling.
To identify factors that were associated with TIR after AID initiation, we conducted univariate and multivariate linear regressions. The factors included are listed in Table 3, and those factors with P < 0.2 in the univariate analysis were retained for inclusion in the multivariate model. We performed a linear mixed model with time and user-interaction factors as fixed effects and adjusted for insulin pump settings, TDD per kilogram, age, diabetes duration, and sex. Random effect was set to subject. Furthermore, we included interaction terms between time and predictors, but these were nonsignificant and therefore removed in the model simplification process. In order to minimize collinearity, we also excluded daily carbohydrates relative to body weight, as this predictor displayed high correlation with daily carbohydrates (r = −0.702). The remaining predictors remained in the model. This final simplified model showed improved model fit, with similar restricted maximum likelihood and decreased bayesian information criterion while ensuring increased parsimony and interpretation of the model. P-values <0.05 were considered to be statistically significant. Data management was performed in Python (version 3.11), whereas statistical analyses were conducted using R (version 4.2.2).
Results
A total of 194 children and adolescents initiated an AID system during the inclusion period of which 156 ended up in the final analysis (Fig. 1). Overall, 97 started on MiniMed 780G and 59 on Tandem Control-IQ. Individuals had previously used different treatment modalities, that is, multiple daily injections (MDI, n = 33), insulin pumps without sensor integration (SUP, n = 45), and sensor augmented pump therapy (SAP, n = 78). The mean age at baseline was 10.7 (±3.9) years, 42.3% were female, and the mean diabetes duration was 4.9 (±3.5) years. Baseline characteristics are shown in Table 1. Noticeably, those changing from MDI had shorter diabetes duration and those using SAP treatment generally had lower GRI at baseline. There was no difference in Z-BMI at baseline, and the amount of daily insulin dose was similar between the SUP and the SAP group. We did not have data on the TDD of the MDI group. In the year after AID initiation, weight (baseline: 42.5 ± 1.5 kg vs. month 12: 46.9 ± 0.19 kg, P < 0.001) and height (baseline: 145.9 ± 1.9 cm vs. month 12: 151.4 ± 0.3 cm, P < 0.001) increased significantly, whereas Z-BMI score remained stable (baseline: 0.77 ± 0.11 SD vs. month 12: 0.78 ± 0.06 SD, P = 0.772). There were no registered events of hospitalization due to DKA or severe hypoglycemia events during the follow-up period.
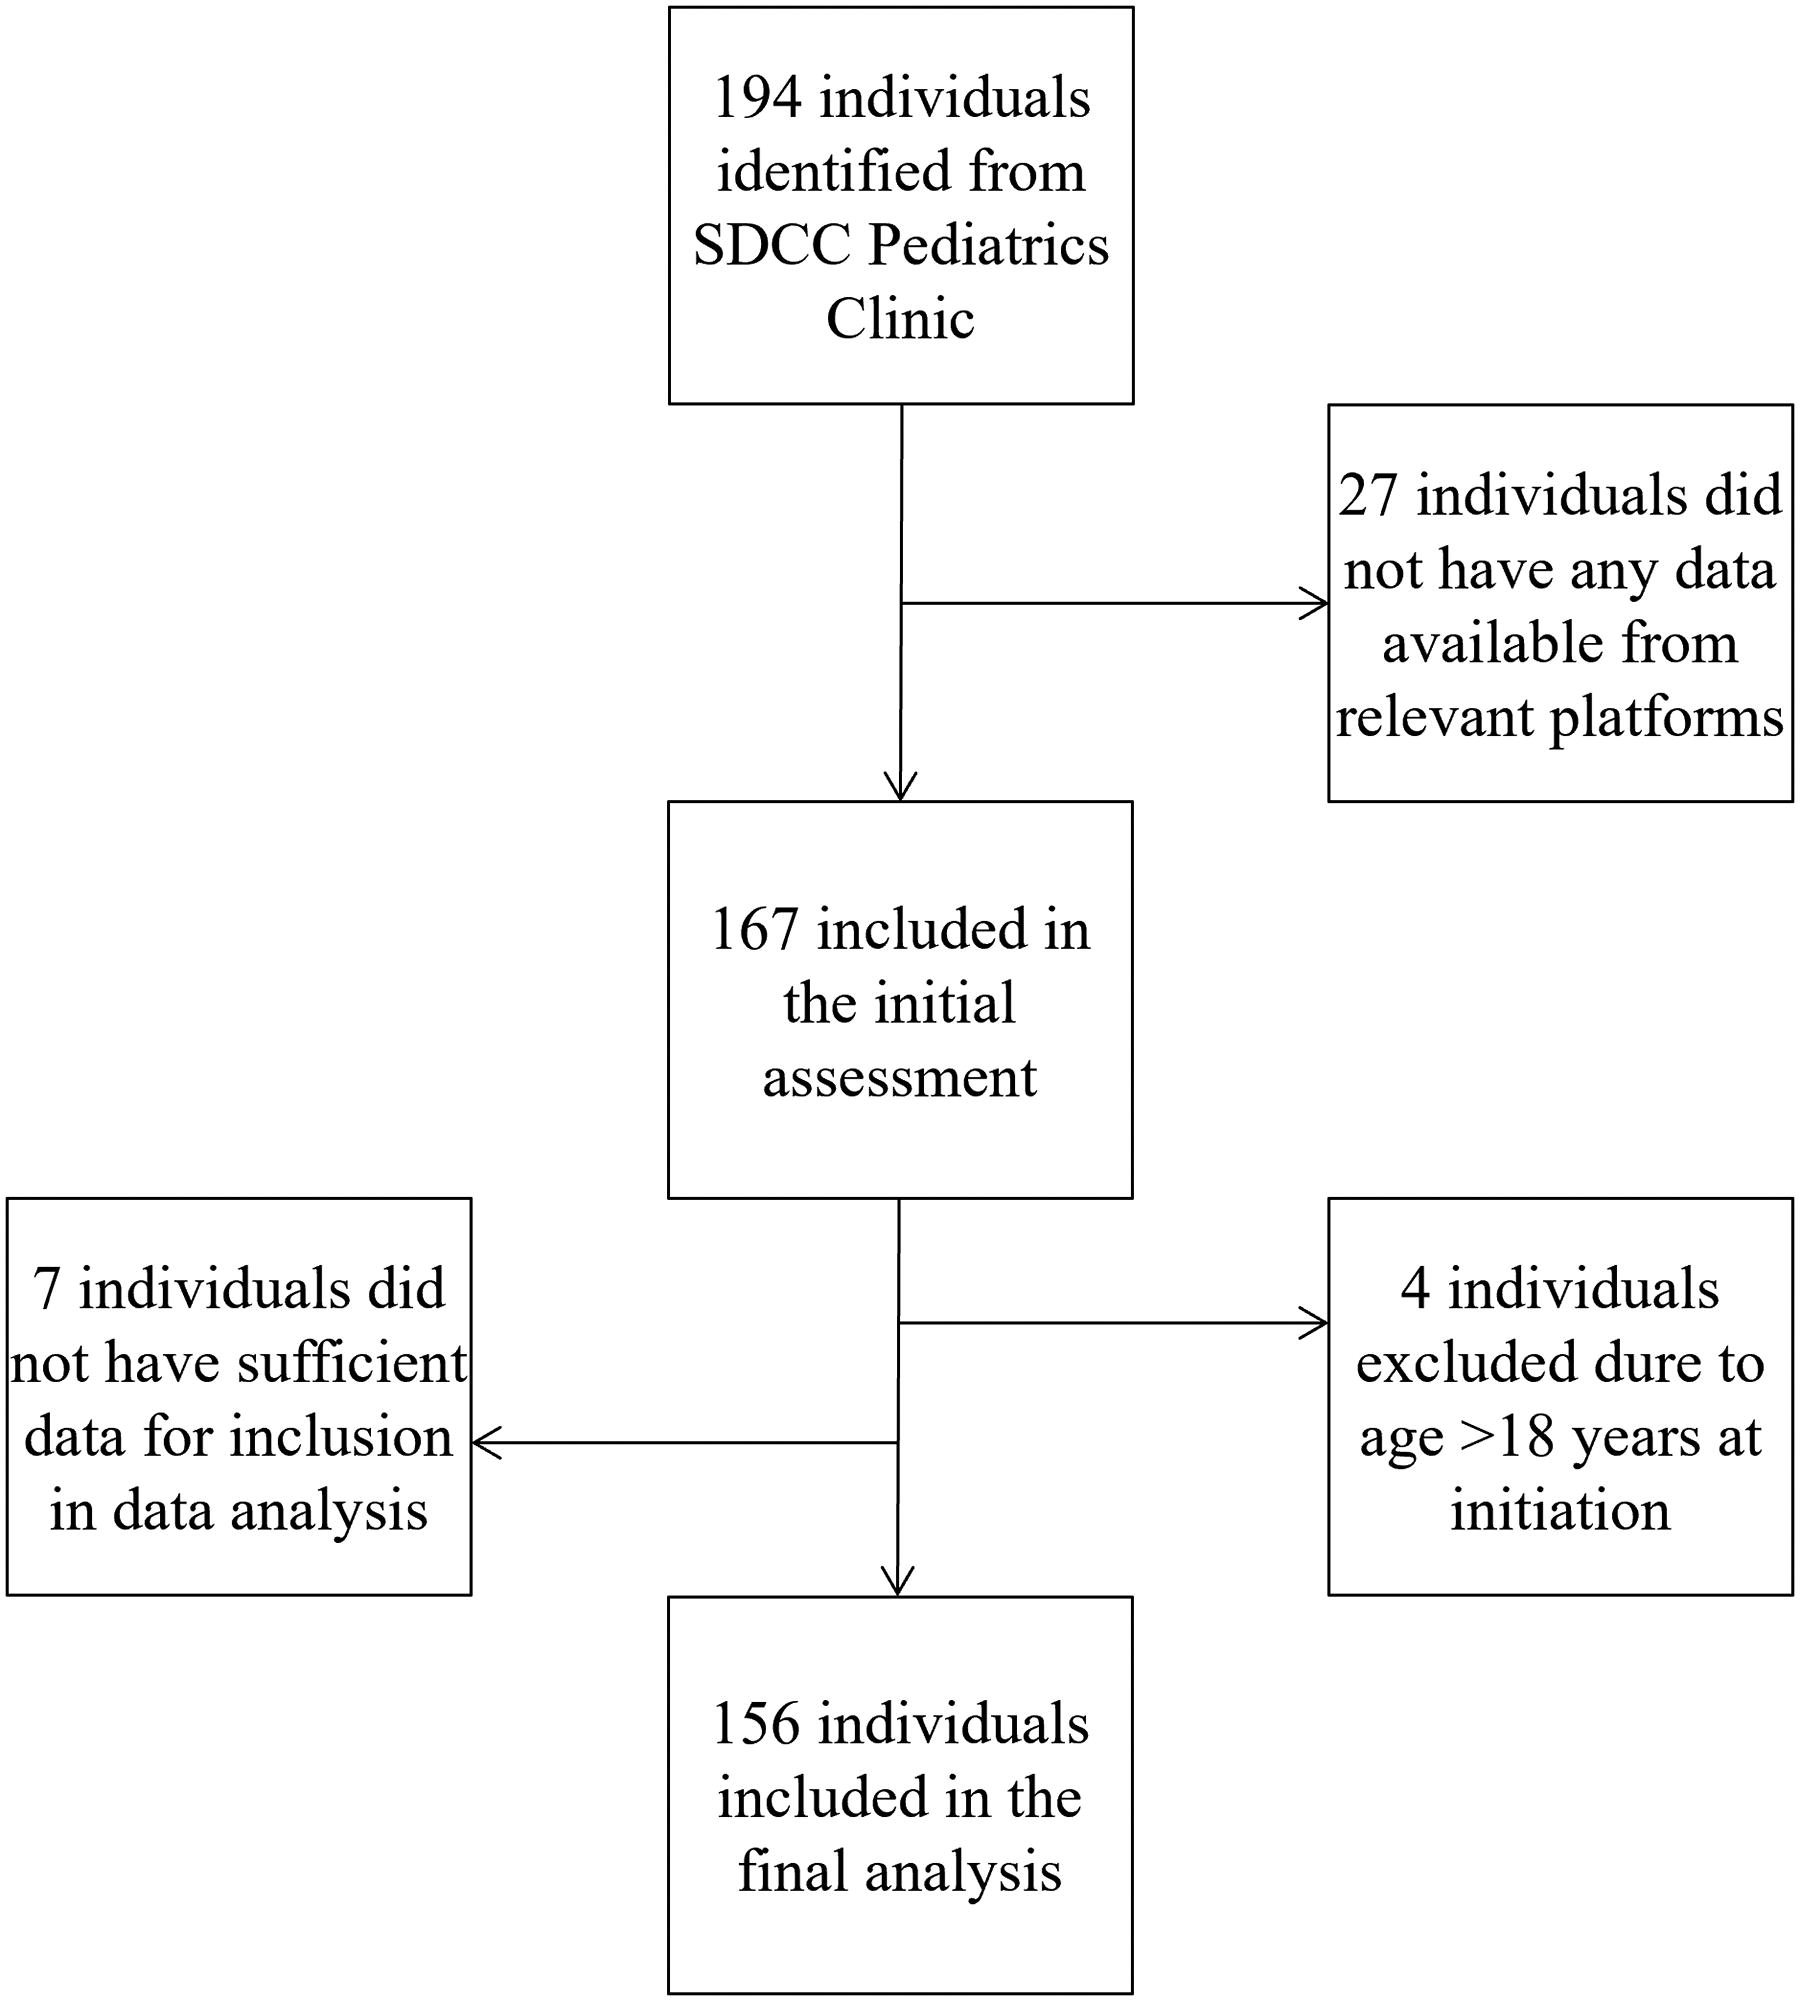
Consort diagram.
Baseline Characteristics
Measures are represented as mean (SD), median [IQR], or number (percentage of total). Statistically significant p-values (<0.05) are shown in bold.
AID, automated insulin delivery; BMI, body mass index; IQR, interquartile range; MDI, multiple daily injections; SAP, sensor augmented pump therapy; SD, standard deviation; SUP, insulin pumps without sensor integration.
Glycemic outcomes
Compared with baseline, TIR increased significantly after initiation of AID system and remained significantly improved throughout the follow-up period (baseline: 61.9 ± 13.6% vs. month 1: 71.2 ± 9.5% vs. month 12: 69.1 ± 9.1%, P < 0.001; Fig. 2). When grouping individuals based on their baseline TIR, individuals with baseline TIR of <70% improved significantly within the first month of initiation and sustained this improvement throughout the study period (P < 0.001), whereas individuals starting at a higher TIR (>70%) did not improve significantly, but they had a higher TIR consequently throughout the study period (P < 0.001). The secondary glycemic outcome measures (TBR, TAR, TITR, and HbA1c) exhibited similar trends in changes over time (Fig. 2). No effect of age, diabetes duration, or sex on any of the outcome variables was demonstrated.

Glycemic outcomes from baseline over 1 year of follow-up. Measures are displayed as percentage means. TAR, time above range (>10.0 mmol/L); TBR, time below range (<3.9 mmol/L); TITR: time in tight range (3.9–7.8 mmol/L); TIR, time in range (3.9–10.0 mmol/L).
The analysis revealed a very strong positive correlation between TIR and TITR (r = 0.93) (Supplementary Fig. S1). Furthermore, a strong negative correlation between TIR and GRI (= −0.94) was observed, showing that higher TIR was associated with lower GRI (Supplementary Fig. S1). These correlations remained robust across all time points examined.
At baseline, 21.0% of the individuals fulfilled the clinical guidelines of TIR ≥70% and TBR <4%, 17 which increased to 45.0% (P < 0.001) after AID initiation. There was a decrease in this percentage over time resulting in 31.1% of the users after 1 year of AID usage, still significantly higher than at baseline (P = 0.021). Similarly, TIR as such increased following AID initiation but decreased over the observation period (baseline: 29.5% vs. month 1: 60.0% vs. month 12: 43.7%, P < 0.005). For the number of participants achieving TBR <4%, there was no change by AID treatment nor over time (baseline: 78.1% vs. month 1: 74.3% vs. month 12: 78.5%, P = 0.889).
User-interaction measures and insulin pump settings
Initiation of AID systems significantly influenced user-interaction behavior. The percentage of individuals with high CGM wear time increased after initiation, peaking at 88.5% by month 6 before slightly declining to 78.8% by month 12 (baseline: 51.3%, P < 0.001), whereas the overall active CGM wear time increased with AID initiation and remained stable (Table 2). Similarly, the percentage of daily manually administered insulin (for meals and correction) increased with AID initiation (for those previously using insulin pumps) and remained stable throughout the year of follow-up (baseline: 53.7 ± 9.8% vs. month 1: 58.7 ± 12.9% vs. month 12: 59.9 ± 13.9%, P < 0.001; Table 2). Daily carbohydrates intake relative to body weight showed a modest decline (baseline: 5.0 ± 2.3 g/[kg·d] vs. month 1: 4.9 ± 2.3 g/[kg·d] vs. month 12: 4.6 ± 2.3 g/[kg·d], P < 0.001; Table 2), whereas no changes were observed in total daily carbohydrates announced (P = 0.510), number of daily registered meals (P = 0.091), or set change behavior (P = 0.150).
Table Represents User-Interaction Measures at Different Timepoints
Measures are reported as mean (±SD), number (percentage of all), or mean [total range].
Optimal settings were defined as a target 5.5 mmol/L and active insulin time of 2 h for MiniMed 780G and insulin sensitivity factor ≤100/TDD for Tandem Control-IQ.
CGM, continuous glucose monitoring; AIT, active insulin time; ISF, insulin sensitivity factor.
Univariate and Multivariate Measures
Estimates are represented as percentage change in time in range. Statistically significant p-values (<0.05) are shown in bold.
TDD, total daily dose.
Total daily insulin use (unit per kilogram per day) increased over time, reaching significant difference from baseline only at months 10 and 12 (baseline: 0.81 ± 0.20 U/[kg·d] vs. month 1: 0.78 ± 0.23 U/[kg·d] vs. month 12: 0.82 ± 0.21 U/[kg·d], P = 0.001; Table 2). Insulin pump settings could not be evaluated at baseline but were assessed at each follow-up time point. Overall, a relatively small proportion of individuals achieved the predefined “optimal settings” (14.4%); however, we observed a significant increase in the probability of individuals reaching optimal settings over time (month 1: 12.0% vs. month 12: 19.3%, odds ratio = 1.13, P < 0.001).
Predictors of glycemic outcomes
Table 3 displays the univariate analyses and the final multivariate analysis. The predictors that had a positive correlation with TIR were number of daily meals (estimate: 1.22% per daily announced meal, P < 0.001) and daily carbohydrate announcement (estimate: 0.15% per 10 g announced carbohydrates, P = 0.003), showing that a higher amount of daily announced meals and carbohydrates was associated with higher TIR. The analysis also revealed a positive association between mean number of days between set changes (estimate: 1.25% per day between set changes, P < 0.001) and TIR, indicating that more days between set changes were correlated to higher TIR. CGM wear time and percentage of daily administered manual insulin (estimate: −0.01% with every percentage of TDD, P = 0.682) did not show a significant correlation in the model.
Notably, total daily insulin dose (TDD/kilogram) showed the largest negative correlation with change in TIR, with an estimate of −6.92% per IU/(kg·d) (P < 0.001). Insulin pump settings were positively associated with change in TIR with an estimate of 2.62% (P < 0.001) for those with “optimal settings” compared with those without. In the final model, there was no effect of age, sex, or diabetes duration.
Multivariate analyses of subpopulations based on the AID system are represented in Supplementary Table S2.
Discussion
In this retrospective observational study of 156 children and adolescents initiating AID systems, we found that glycemic outcomes improved with AID initiation and remained stable over a year of follow-up. Furthermore, we found that initiation was associated with changes in user interaction, and we identified key predictors of changes in TIR, most importantly, number of daily meals, infusion set change behavior, as well as optimization of insulin pump settings.
Overall, we found a significant improvement in glycemic outcomes after AID initiation, a finding that is widely supported in the existing literature 10,11,18 –20 for periods up to 48 months after initiation. Baseline TIR was strongly associated with improvements in TIR after AID initiation, aligning with previous clinical and real-world studies. 8,11,18,21 These findings emphasize the importance of offering AID systems, particularly to those struggling with glycemic outcomes, as they demonstrate significant benefits in improving outcomes while maintaining safety regarding DKA and severe hypoglycemia as observed in our study as well as others. 22
Even though more individuals achieved TIR recommendations after AID initiation, we also found a significant decline over time, particularly after 6 months. 17 The saturation effect is a well-known phenomenon seen with many novel therapeutic approaches, but, surprisingly, even the adaptive features of these AID systems failed to prevent it. Similar findings were also reported in the extension phase of the FLAK study, where 11% fewer individuals achieved TIR recommendations at 21–24 months compared with 12 months. 19,23
This was one of the first studies looking at user-interaction measures before and after AID initiation, as well as evaluating their predictive values in relation to glycemic outcomes. The initiation of new diabetes technology provides a critical window of opportunity to address user interactions, making it essential for health care professionals to understand which behaviors are most likely to change and whether these changes potentially affect glycemic outcomes. One key behavior is the announcement of daily carbohydrate intake. While we did not find any change in daily registered meals or total daily carbohydrates, we identified a slight but significant decrease in daily registered carbohydrates relative to body weight, amounting to approximately 0.5 g/kg by months 10 and 12. It is unclear whether this reflects increased trust in the system—resulting in fewer “fake” carbohydrate entries—or greater familiarity with the system, allowing users to rely on it for managing missed boluses or under bolusing. Regardless, the finding is a bit concerning, as growing children have increasing energy requirements, often necessitating greater carbohydrate intake to support their growth and development. This aspect remains underexplored in previous studies, which have primarily focused on the number of meals registered daily rather than meal size. 8,20 Interestingly, we found that daily carbohydrates relative to body weight did not have predictive value for TIR. Instead, total daily carbohydrate entry had a larger impact, although these measures were strongly correlated. Another study that examined carbohydrates relative to body weight also found this predictor to be nonsignificant. 20 Given the predictive value of total daily carbohydrates for TIR, it is clear that individuals could benefit from consistently announcing their carbohydrate intake. This underscores the importance of health care professionals discussing meal sizes and carbohydrate content as children and adolescents grow, to ensure effective system use and improved outcomes.
We did not find any change in infusion set change behavior following AID initiation, with the average interval between set changes remaining approximately 3 days, as recommended by health care professionals. Interestingly, our predictive model demonstrated a positive correlation between TIR and the interval between set changes. This finding was unexpected, as clinical assumptions typically suggest that shorter intervals between set changes would improve glycemic outcomes. One possible explanation is that suboptimal infusion sets are replaced sooner, whereas well-functioning sets are retained for longer durations. In addition, during this period of time, the 7-day infusion set was introduced for those using the 780G system, and these data might additionally show that longer wear is more optimal. However, since 7-day infusion sets are more expensive, it is likely that relatively few participants were using them, which could limit their influence on the observed results. Unfortunately, in this study we do not have data on what infusion set was being used by the participants, and we were therefore not able to account for this in our analysis. Nonetheless, to our knowledge, this is the first study to examine infusion set change behavior as a potential predictor of glycemic outcomes, highlighting the need for further research in this area.
In our study, we observed an increase in the size of daily user-initiated boluses, likely attributed to an increase in daily announced carbohydrates. Alternatively, this could be due to an intensification of the carbohydrate-to-insulin ratio (CIR). However, since CIR data were unavailable in our analysis, the exact cause remains uncertain. Another study examining biobehavioral changes after AID initiation also reported changes in user-initiated bolus behavior, finding a decrease in total user-initiated boluses while meal boluses increased, suggesting that the reduction primarily occurred in correction boluses. 24 Unlike our study, which focused on the size of boluses, their findings were based on the number of daily boluses. Although our observations of user interaction changes following AID initiation differ, our predictive model aligns with existing literature. Specifically, the percentage of manual, user-initiated boluses did not show a significant predictive effect on TIR in our final simplified model. Similarly, previous studies examining the predictive value of the number of daily user-initiated boluses 8,21 have also found this variable to be nonsignificant in their adjusted multivariable models.
In line with previous studies, we found a positive association between optimal insulin pump settings and TIR. 8,16,21,22 To our knowledge, this is the first study to assess insulin pump settings across different AIDs using real-world data from a single clinic. While several studies have explored optimal settings for the 780G pump, the recent proposal of the 90/TDD rule by Messer et al. 16 marks a significant advancement for the Tandem system. While we also used the ISF as a marker of optimal/suboptimal settings, we used the 100/TDD rule rather than the 90/TDD rule, thus making the margin for optimal settings bigger. Interestingly, still only a small portion of our population had optimal settings. This is likely because, at the time the data were generated, there was no information available about optimal insulin pump settings for either system, as this knowledge only emerged in recent years. With increasing knowledge about the importance of optimizing pump settings, the current population has likely improved in this regard. However, at the time of our study, the situation was notably suboptimal (Table 2).
The increase in TDD combined with more optimal glycemic outcomes emphasizes the point that individuals are getting too little insulin before AID initiation, rather than too much insulin after. This finding has been seen multiple times earlier. 8,24 However, our study included data on weight and BMI, allowing us to examine whether the increase was primarily driven by weight gain (and thus a higher insulin requirement) or by an actual increase in insulin need. While we did observe weight gain over the year of observation, the increase in daily insulin was also higher when relativized by weight.
Compared with the multivariate analysis of the entire group, a subgroup analysis of the two AID systems revealed differences in which behaviors correlated significantly with the glycemic outcomes (Supplementary Table S2). For Control-IQ, number of daily user-initiated bolus insulin and mean days between set changes displayed a positive significant association with TIR, whereas among 780G users, the number of daily meals, amount of daily carbohydrates, number of days between set changes, and insulin pump settings were positively associated to TIR.
A key strength of this study is its use of real-world data, which provides valuable insights into outcomes outside the controlled environment of clinical trials. Real-world studies are essential for confirming the findings of large clinical trials, as the influence of human factors and practical challenges often moderates the effects observed in controlled settings. In addition, the inclusion of biometric data adds a unique layer to our analysis that has not been widely explored in previous studies. Another notable strength is Denmark’s health care model, which ensures full coverage for diabetes treatments. This system eliminates barriers to access, such as insurance limitations, and provides equal treatment opportunities for all individuals who wish to use advanced diabetes technologies like AID.
However, this study also has limitations. In a retrospective study, there is an inherent increased risk of missing data. We started by excluding those with insufficient sensor data; however, even for those included in the study, there was also a risk of missing data and thus associated biases. Nevertheless, the statistical methods applied in this study are robust and capable of handling such missing data, particularly when participant numbers remain sufficiently high. Furthermore, we used definitions regarding optimal and suboptimal insulin pump settings based on clinical experience; however, they are becoming increasingly supported in the literature. Finally, while certain potentially relevant data (CIRs, alarm settings, and frequency and duration of exits from automatic insulin dosing) were unavailable, the inclusion of comprehensive biometric data partially offsets this limitation by providing meaningful insights into glycemic outcomes.
Conclusions
In this real-world study, we examined glycemic outcomes, behavioral patterns, and predictors of glycemic outcomes over 12 months in 156 pediatric individuals initiating AID treatment. Understanding behavior changes during AID initiation is crucial, as some user interactions are associated with glycemic outcomes. Our findings underline that user engagement remains a critical factor in achieving optimized glycemic outcomes.
Future research should prioritize individuals who fail to meet clinical guidelines or experience a worsening after initially achieving targets. Exploring whether these challenges arise from changes in user behavior, suboptimal pump settings, or a combination of factors could yield valuable insights. In addition, research should assess the impact of set change behavior and investigate whether different infusion set durations (e.g., 3-day vs. 7-day) influence glycemic outcomes. Research should also evaluate trends in adapting the more optimized insulin pump settings and consider the impact of discussing the importance of optimal system settings with families and health care professionals during AID initiation to help address this gap and improve outcomes.
Footnotes
Acknowledgments
The authors would like to thank Elisabeth Weinreich and Clara Haugaard Knudsen for helping with data extraction, Liv Boelskifte Skovhus and Georgios Kapakoglou for their great work with the initial data wrangling, and Tommi Raimo Leo Suvitaival for his support with data analysis.
Authors’ Contributions
All authors contributed to the conception and design of the study. E.B.L. contributed to the acquisition of data. E.B.L. and A.G.R. were responsible for data analyses. All authors were responsible for data interpretation. E.B.L. wrote the original draft of the article. All authors contributed to revising the article. All authors provided final approval of the version to be published.
Author Disclosure Statement
The authors report having no relevant conflicts of interest to disclose.
Funding Information
No funding was received for this article.
Supplementary Material
Supplementary Figure S1
Supplementary Table S1
Supplementary Table S2
References
Supplementary Material
Please find the following supplemental material available below.
For Open Access articles published under a Creative Commons License, all supplemental material carries the same license as the article it is associated with.
For non-Open Access articles published, all supplemental material carries a non-exclusive license, and permission requests for re-use of supplemental material or any part of supplemental material shall be sent directly to the copyright owner as specified in the copyright notice associated with the article.
