




Abstract
Objective:
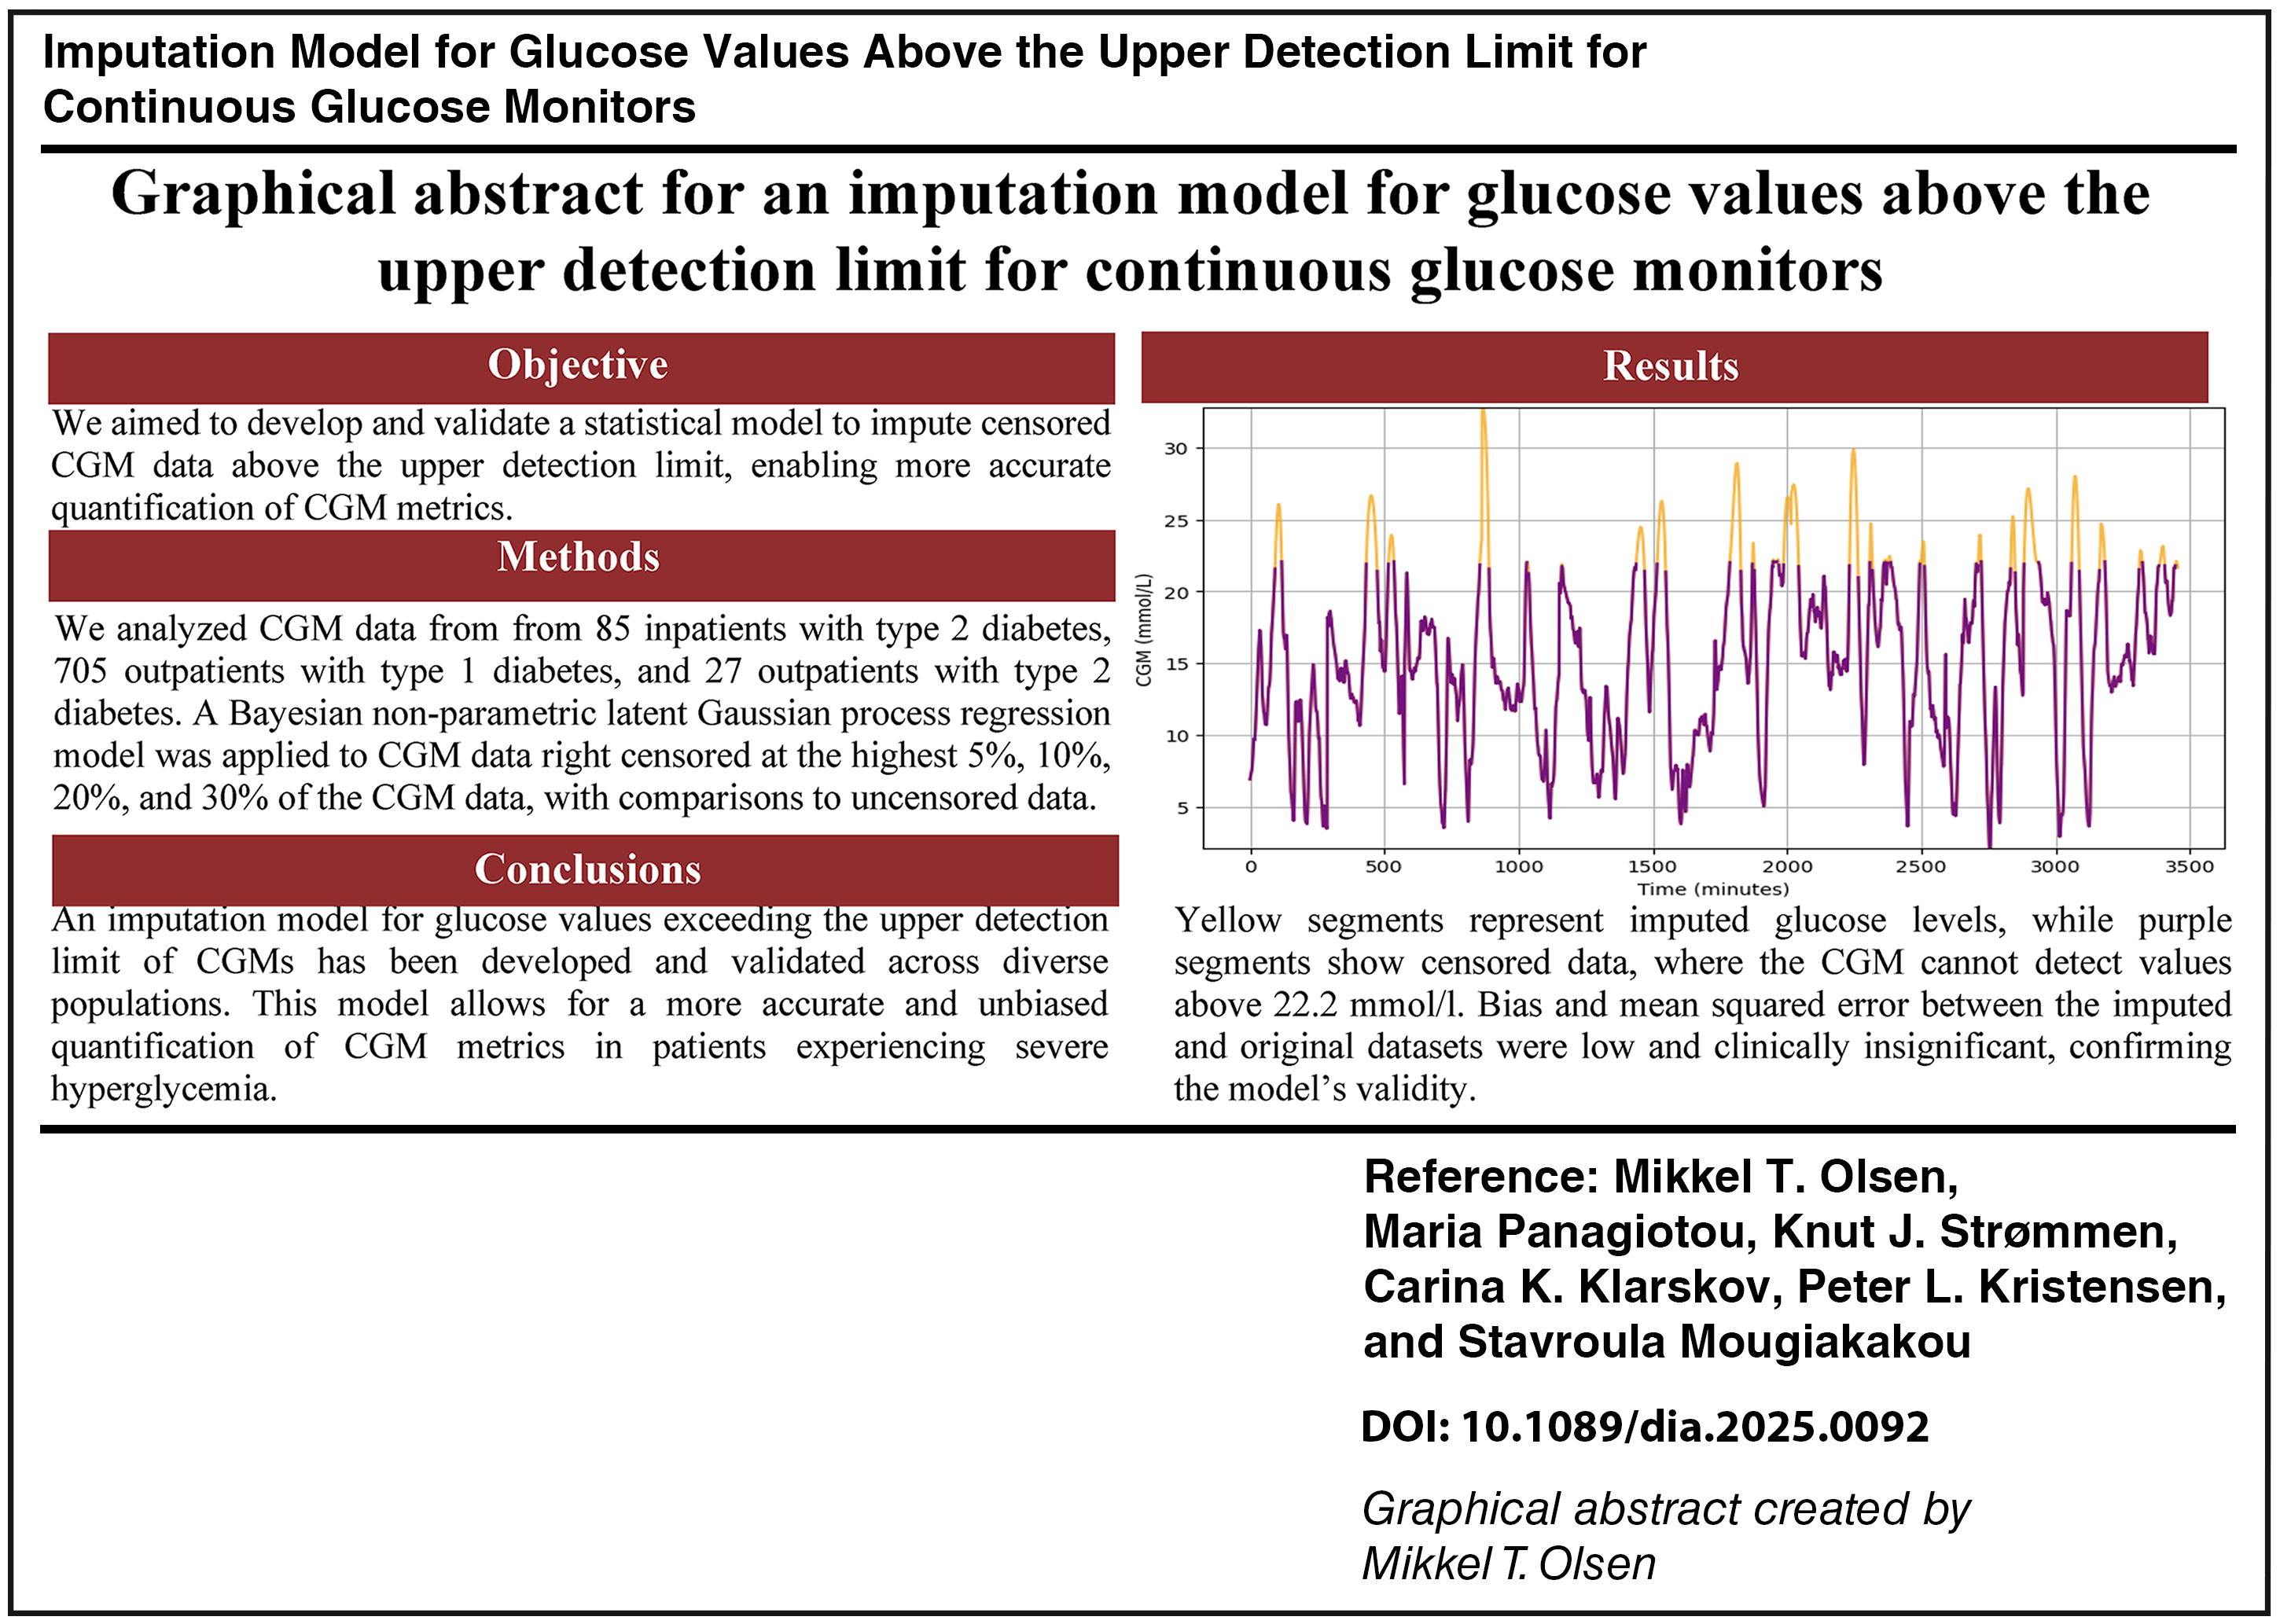
All continuous glucose monitors (CGMs) have an upper detection limit, typically of 22.2 mmol/L. This might bias CGM metrics. We aimed to develop and validate a statistical model for imputing values above this limit.
Methods:
We analyzed CGM data from 85 inpatients with type 2 diabetes, 705 outpatients with type 1 diabetes, and 27 outpatients with type 2 diabetes. A Bayesian nonparametric latent Gaussian process regression model was applied to the CGM data intentionally right censored for the top 5%, 10%, 20%, and 30% and compared with the uncensored CGM data by the bias, mean squared error (MSE), and coefficient of determination (R 2) of mean glucose, standard deviation (SD), and coefficient of variation (CV).
Results:
In hospitalized patients with diabetes, outpatients with type 1 diabetes, and outpatients with type 2 diabetes for 5% to 30% right censoring, respectively, the bias on mean glucose after imputation ranged from −0.012 to 0.362, −0.018 to 0.485, and −0.008 to 0.130, respectively. Bias on SD ranged from −0.024 to 0.226, −0.033 to 0.381, and −0.016 to 0.138, respectively. Bias on CV ranged from −0.207 to 1.543, −0.316 to 2.609, and −0.222 to 1.721, respectively. Similar results indicating good performance of the imputation model were observed for MSE and R 2.
Conclusions:
An imputation model for glucose values above the upper detection limit of CGMs was developed and validated in various populations. This enables a more unbiased quantification of CGM metrics for patients with severe hyperglycemia.
Introduction
The introduction of continuous glucose monitors (CGMs) has revolutionized diabetes management and increased patient satisfaction 1 and is an established technology in diabetes research. 2 However, despite the advantages of CGMs, all CGMs have a limited measuring range. Most CGMs have an upper detection limit of 22.2 mmol/L (400 mg/dL) 2 except for the Abbott Diabetes Care FreeStyle Libre 14-day system, with an upper detection limit of 27.8 mmol/L (500 mg/dL). 3 Conversely, all CGMs currently available have a lower detection limit of 2.2 mmol/L (40 mg/dL). 2 The limited measuring range causes CGM data to be censored. An observation is censored if its value is only partly known. Censoring of data differs from the usual understanding of missing data 4 since censored data, by nature, contain information about whether the value is either higher or lower than the limits of the measuring range of the CGM in question. CGM values above the upper detection limit are said to be right censored and left censored for CGM values below the lower detection limit.
Right censoring and to a lower extent left censoring bias some standard CGM metrics recommended to be reported by international consensus in clinical and research contexts. 5 –7 CGM censoring might lead to a downward bias for metrics of glycemic variability, that is, standard deviation (SD) of all CGM glucose levels and coefficient of variation (CV). Mean glucose level and estimated A1c (i.e., glucose management index) are also downward biased during severe and prolonged hyperglycemia and to a lesser extent upward biased during severe and prolonged hypoglycemia, exceeding the detection limits of CGMs.
We aimed to develop and validate a Gaussian process regression model to impute censored CGM data above the upper detection limit of all CGMs currently available. This enables more accurate quantification of CGM metrics set by international consensus. 5 –7
Materials
Data are from eight open-source datasets, including 85 hospitalized nonintensive care unit patients with type 2 diabetes from the CGM-ISO trial 8 and 705 and 27 outpatients with type 1 diabetes and type 2 diabetes, respectively, from Broll et al., 9 OhioT1DM dataset, 10 Colas et al., 11 D1NAMO dataset, 12 Hall et al., 13 Weinstock et al., 14 and T1DEXI 15 (Table 1).
Demographic Information (Average) for Each Dataset Before (Raw) and After Preprocessing (Processed)
Methods
Data preprocessing
A series of preprocessing steps were applied to ensure standardization of all the datasets. First, all CGM readings were converted to millimoles per liter (mmol/L) and duplicate time stamps were removed. Recordings above 22.2 mmol/L (400 mg/dL) were excluded. Segments with more than 1.5 continuous hours of missing data, those in which over 50% of time points were missing, or those containing fewer than 288 data points in total were discharged. Next, missing data were addressed by inserting “NaN” (not a number) values whenever gaps in the CGM readings exceeded 5 min, reflecting potential interruptions in CGM recordings. CGM data were then segmented into 24-h intervals, aiming to maximize the number of complete 24-h segments, each consisting of 288 time points (corresponding to 5-min intervals over 24 h). In addition, participants with less than a full day of valid data after preprocessing were excluded from further analysis. Finally, we censored recordings above the 70th, 80th, 90th, and 95th percentiles (corresponding to 30%, 20%, 10%, and 5% right censoring during a 24-h interval) to simulate CGM right censoring. Baseline characteristics for the datasets used are depicted in Table 1.
Conceptualization of Gaussian process regression modeling
To impute right-censored CGM glucose values, we built a nonparametric latent Gaussian process regression model. In Gaussian process regression analysis, covariance functions (kernels) encode assumptions about patterns and dynamics of the function we wish to model. 16 We tested three standard covariance functions as follows: squared exponential (SE), Matérn 3/2, and Matérn 5/2. The SE covariance function is one of the most applied covariance function and gives very smooth functions. 16,17 However, such strong smoothness assumptions in modeling physiological processes such as glucose levels are often unrealistic. Instead, Matérn class functions have been recommended in modeling many types of physiological data. 18 In Matérn 3/2 and 5/2, the numbers refer to the smoothness parameter, which controls the resulting functions’ smoothness.
For CGM glucose level time-series data with intervals of 1–15 min per glucose reading, it is expected that the glucose levels with adjacent time stamps naturally have somewhat similar glucose levels. In Gaussian processes, a covariance function expresses this similarity, 16 that is, the covariance function determines how the imputed glucose level at one time stamp xi is affected by glucose levels at other time stamps xj, i ≠ j, i = 1, 2, …, n. The covariance function k(xi,xj) is parameterized in terms of a kernel parameter vector θ. Hence, it is possible to express the covariance function as k(xi,xj∣θ).
For standard covariance functions, kernel parameters include the length scale (ℓ) and the signal variance σ2. The ℓ defines how far apart the input values xi and xj, i ≠ j, i = 1, 2, …, n can be from each other for the responses f (xi) and f (xj) to become uncorrelated. This translates into the smoothness of the function, that is, small values of ℓ allow response values to change rapidly and vice versa. The signal variance (σ2) determines function values’ variation around their means, that is, small values of σ2 characterize functions that stay close to their mean value and vice versa. Defining a correct covariance function for the Gaussian process is therefore crucial since the covariance function will determine the pattern and dynamics of the imputed CGM-related glucose levels, which must be physiologically meaningful.
Building the imputation model
To impute right-censored CGM data, we used a Gaussian process regression model implemented using the GPy library in python. 19 The model’s hyperparameters were carefully chosen to optimize performance: the σ2 was set to the square of the SD of each segment, ensuring the model adapted to the variability in glucose levels across different days. A fixed ℓ equal to 1 was used to control the smoothness of the imputed values, allowing the Gaussian process to capture short-term fluctuations in glucose readings effectively. The noise variance for the Gaussian likelihood was set to a minimal value of 0.00001 to account for the high precision of CGM readings, while ensuring numerical stability. The model was trained using a maximum of 50 iterations to balance computational efficiency with convergence quality.
Validating the imputation model
In this work, the right censoring challenge is circumvented by considering only CGM data within the measuring range of CGMs. We intentionally censored glucose data above the 70th, 80th, 90th, and 95th percentiles (i.e., 30%, 20%, 10%, and 5% right censoring, respectively) and then applied the imputation model to these censored datasets and compared the imputed datasets with the original uncensored datasets by the bias, the mean squared error (MSE), the coefficient of determination (R 2) of standard CGM metrics potentially affected by right censoring of glucose levels, that is, mean glucose level, SD of all CGM-glucose levels, and CV. To ensure consistency and prevent overrepresentation of patients with more recordings, bias, MSE, and R 2 were calculated using per-patient CGM metrics. The censored dataset, without applying the imputation model, was also compared with the imputed dataset to illustrate the bias introduced if the right censoring is not addressed by imputing the censored values. These analyses were conducted separately for patients with type 1 and type 2 diabetes, as glycemic excursions may differ significantly between the two types.
To assess the possibility of estimating a threshold for the amount of censored data before imputation should be applied to avoid bias in reporting glycemic metrics, we assessed the bias in the mean blood glucose level and the SD of the glucose distribution between the censored and uncensored datasets at various censoring percentiles.
Results
Validation of the imputation model
The results in Table 2 demonstrate the bias, MSE, and R 2 before and after imputation under 5%, 10%, 20%, and 30% right censoring conditions for both hospitalized patients with type 2 diabetes and outpatient datasets on the best performing kernel (Matérn 3/2) of the Gaussian process regression model. Generally, the MSE and bias values were low and the R 2 close to 1, supporting the good performance of the model. Results are summarized in the Graphical Abstract.
Validation of the Imputation Model for Hospitalized Patients with Diabetes and Outpatients with Type 1 and Type 2 Diabetes Data Using the Matérn 3/2 Covariance Functions for the Latent Gaussian Process at 5%, 10%, 20%, and 30% Right Censoring of Glucose Level
Detailed tables for each dataset, type of diabetes (type 1 or 2), and kernel are reported separately in the Supplementary Tables S1–S10. No threshold for imputing censored glucose levels could be established, as even with small censoring periods (<1%), there was a statistically significant difference between the censored and uncensored datasets on glycemic metrics (Fig. 1).
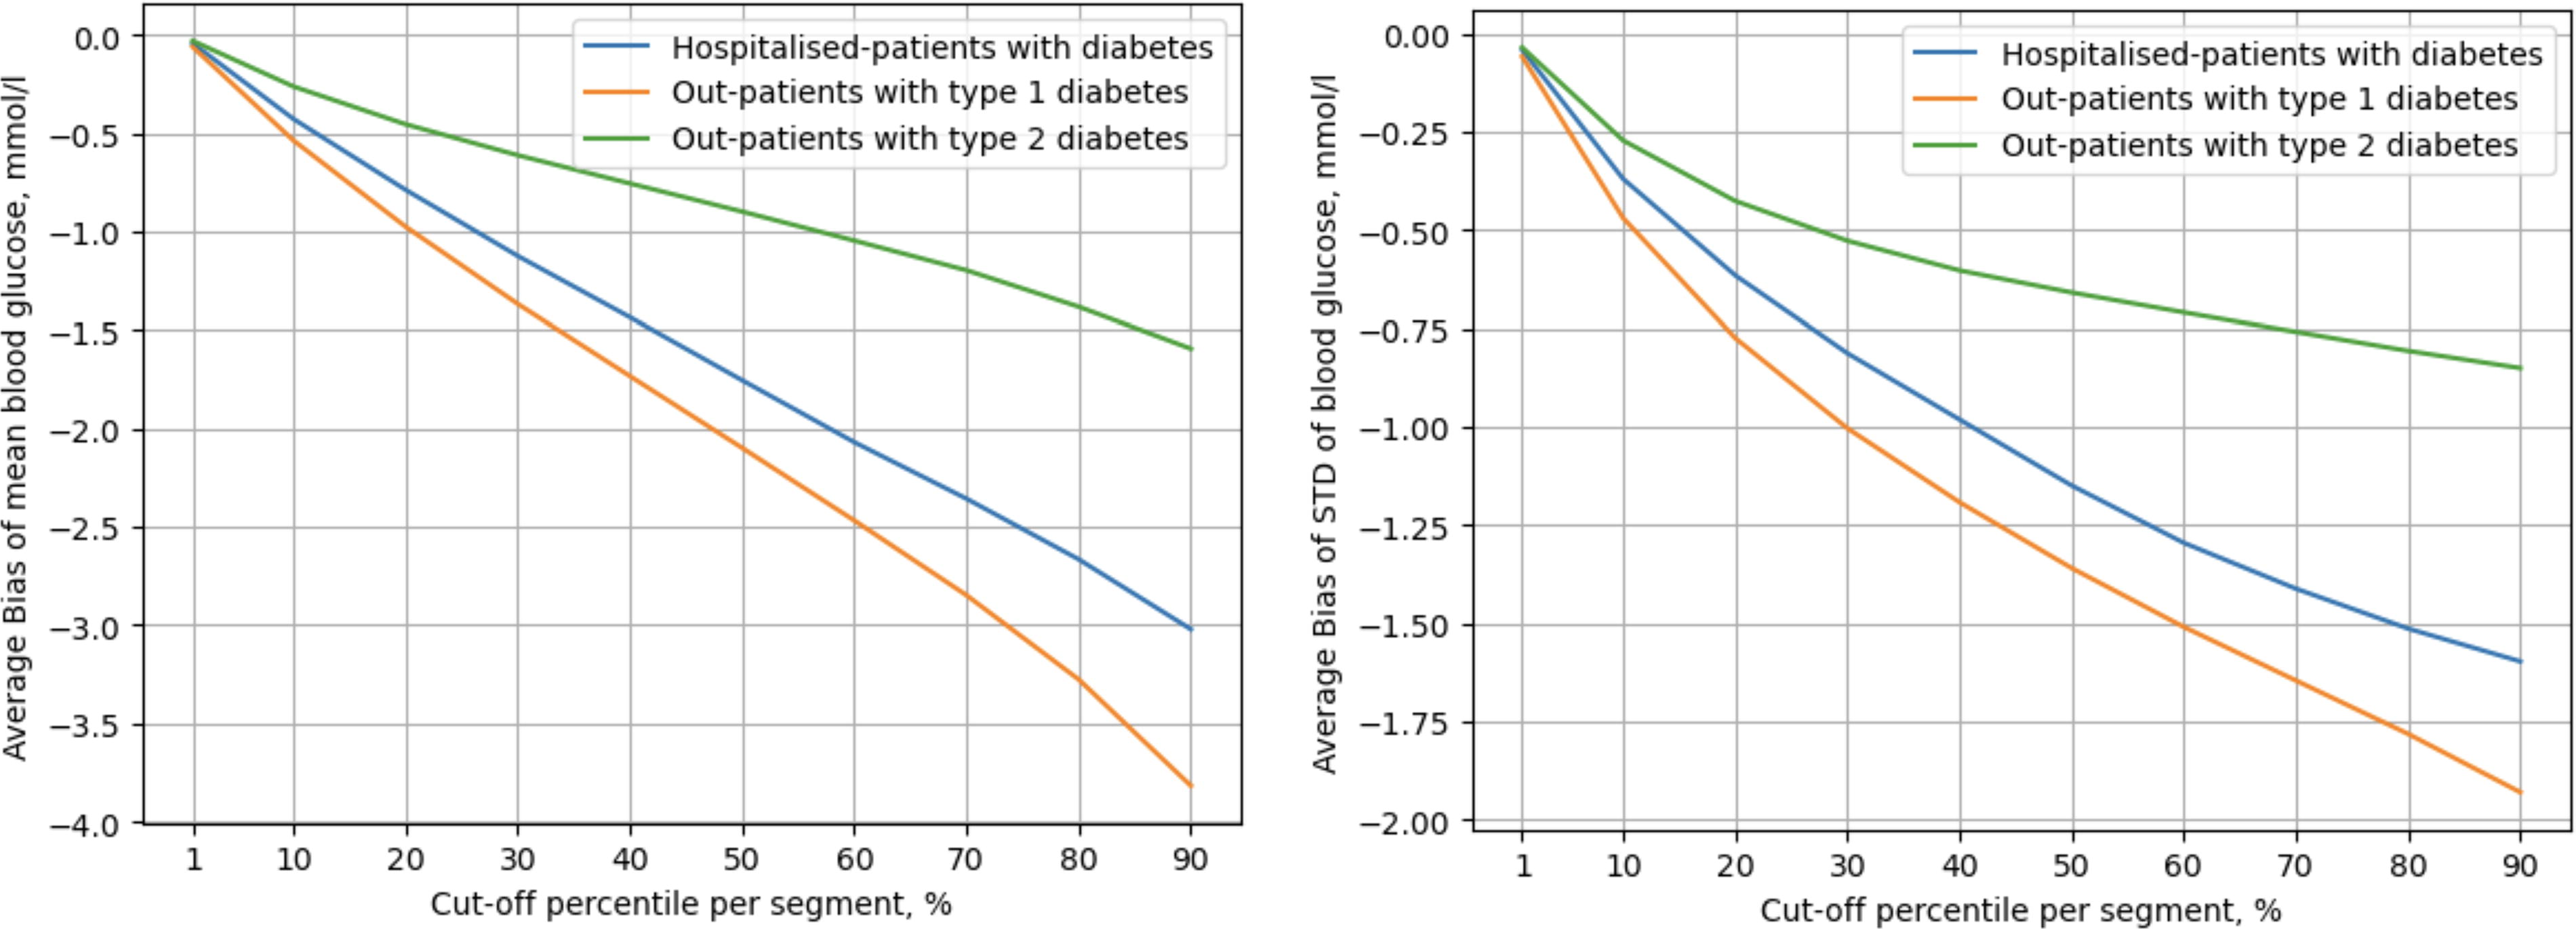
Different levels of right censoring were applied to the CGM data and the average bias of the mean blood glucose level (left panel) and the average bias of the standard deviation of the glucose distribution (SD) (right panel) were calculated. All levels of right censoring from 1% to 90% censoring were statistically significantly different from zero.
Illustration of the imputation model
Fig. 2 provides a graphical representation of CGM data from two participants with type 2 and type 1 diabetes before and after applying the imputation model. Fig. 2 demonstrates the process of the simulated right censoring data of an individual with type 2 diabetes, where the original CGM values (purple line) are censored at the 80th percentile (orange line), corresponding to 20% right censoring. The imputation model is then applied to the right-censored data, producing the imputed predictions shown in the right panel as orange regions that represent the interpolated values. Fig. 2 illustrates the imputation process in a real-life example of an individual with type 1 diabetes, where the CGM system automatically sets the values as a straight line for glucose levels above the measure limit. The left panel depicts the original CGM values (purple line), and the right panel shows the output of the imputation model directly applied to the original data (orange regions).
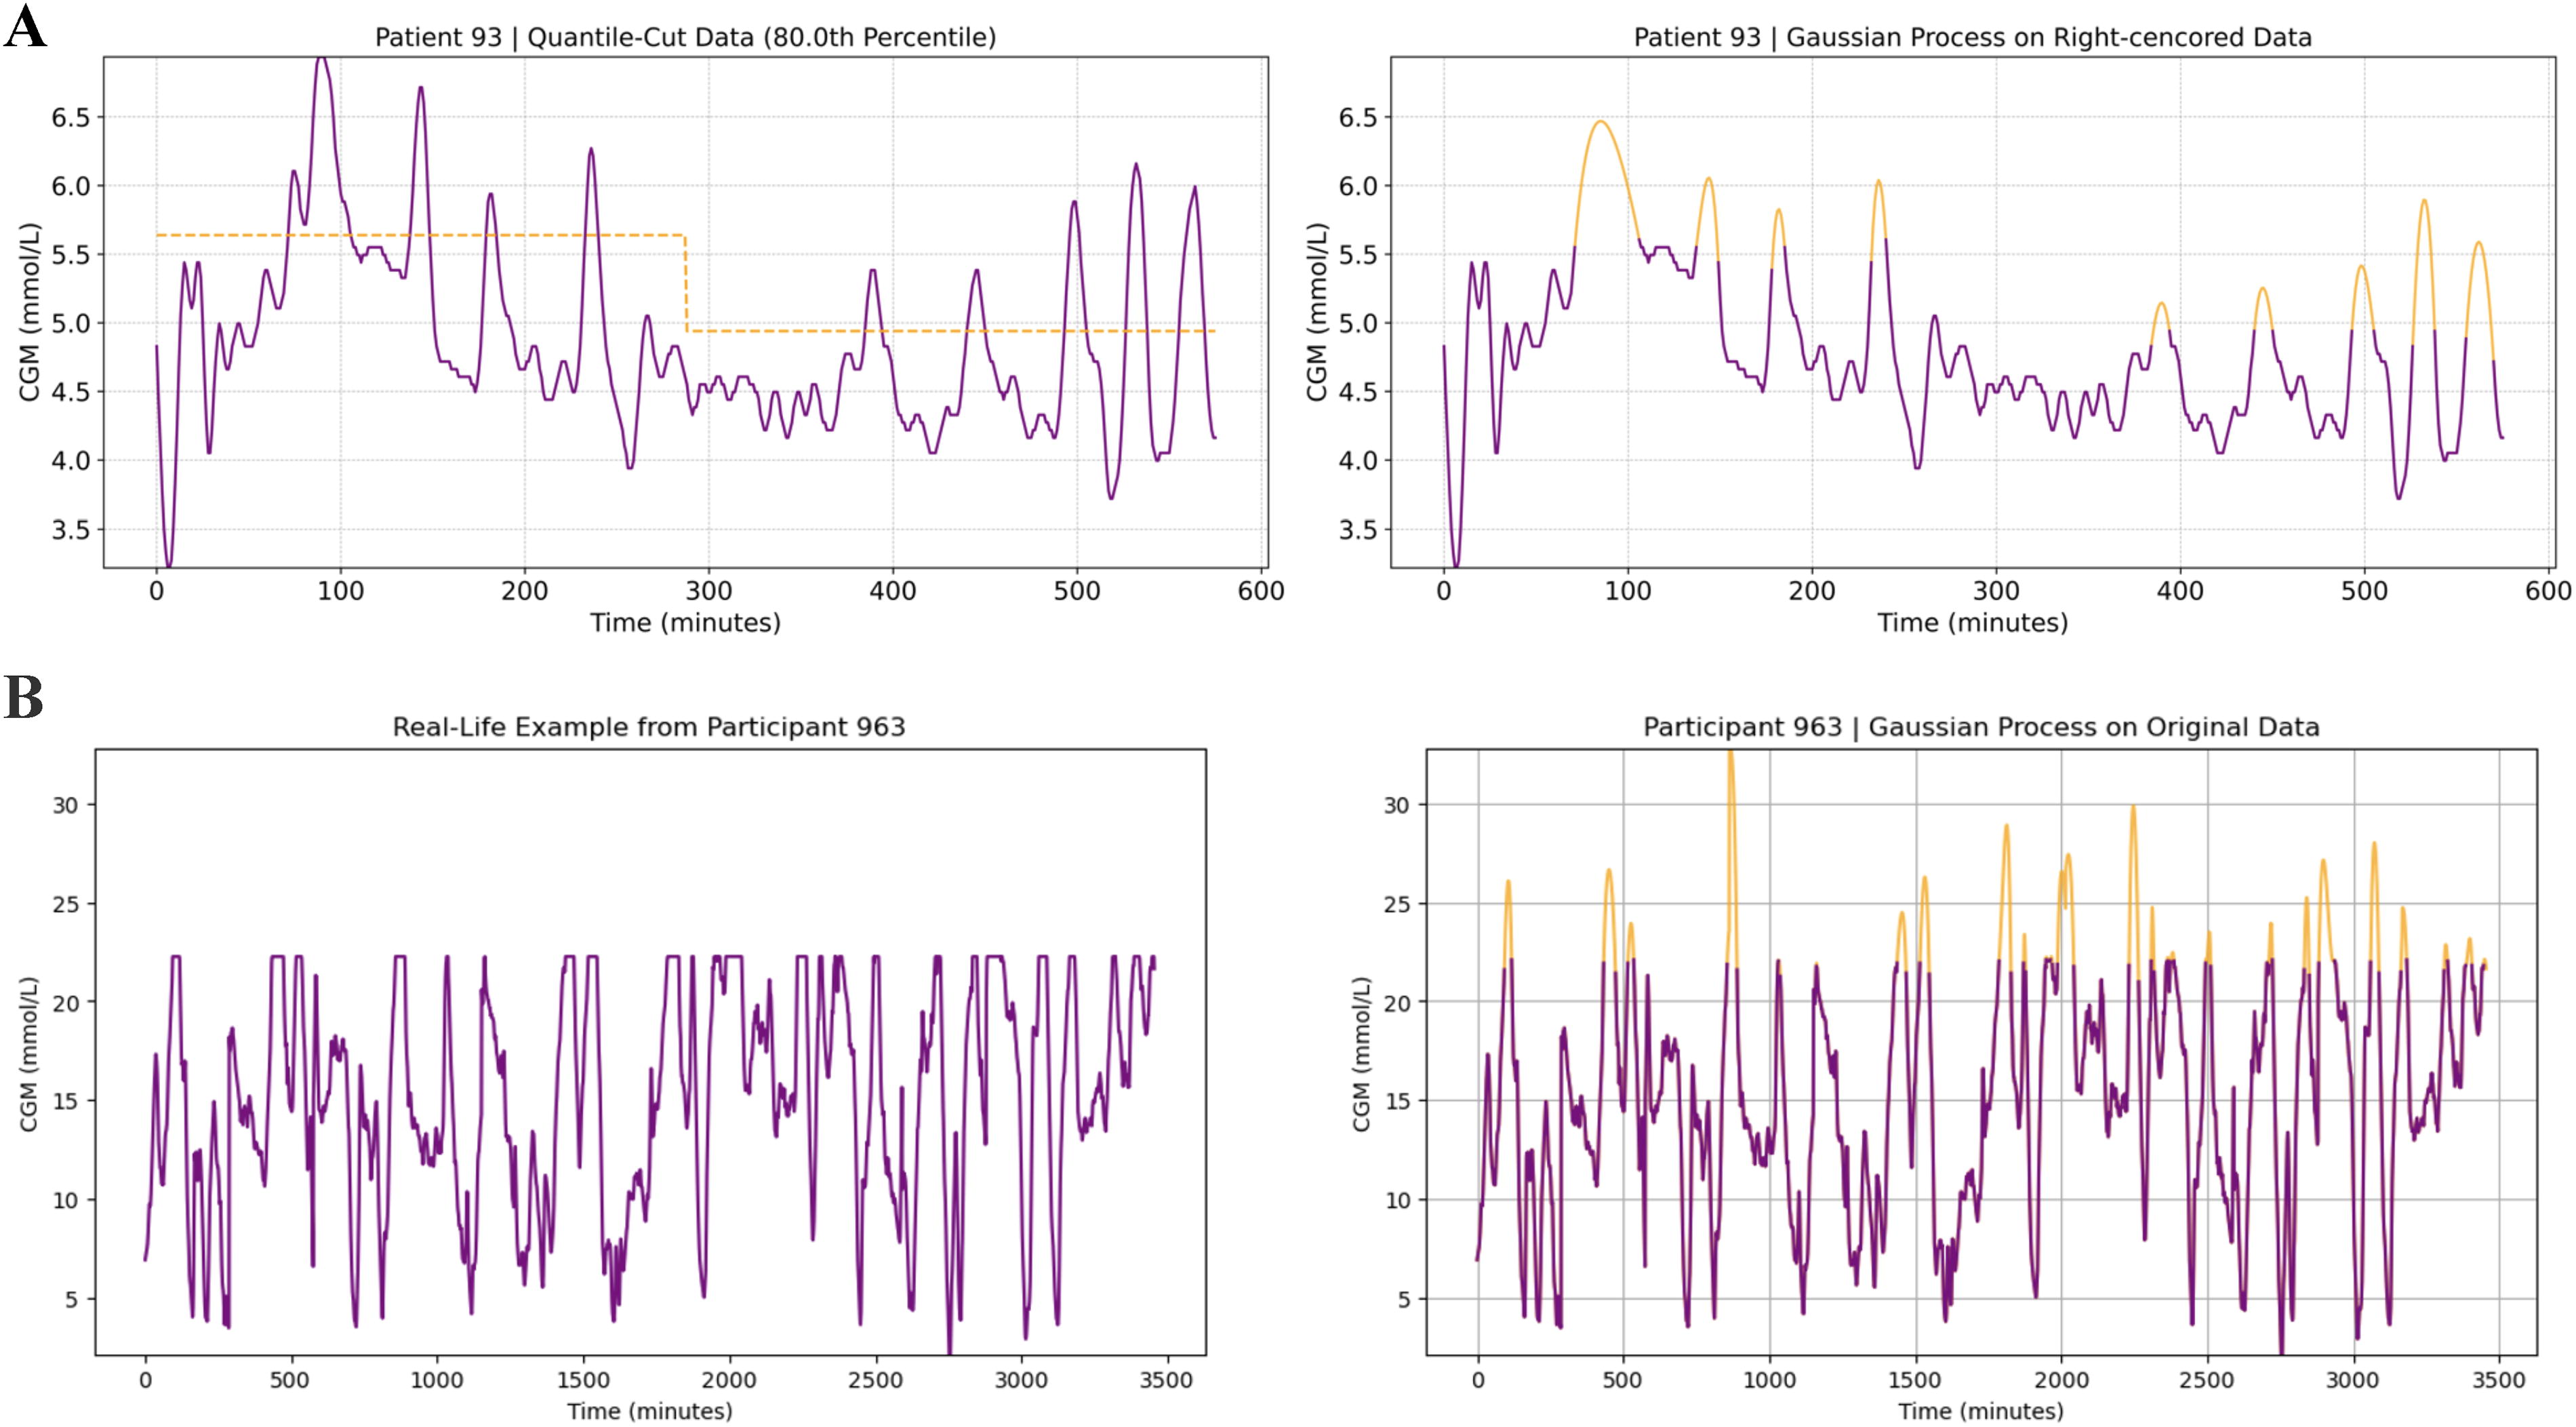
Graphical illustration of the imputation model.
Illustration of bias against the uncensored mean blood glucose levels
Fig. 3 illustrates the relationship between uncensored mean blood glucose levels and bias for hospitalized patients with diabetes (blue dots), outpatients with type 1 diabetes (green dots), and outpatients with type 2 diabetes (red dots). The left panel shows the results for 20% right censoring and the right panel for 30% right censoring. This visualization provides insight into how the bias is stable and unrelated to the original mean blood glucose across patient populations, indicating that the precision of the imputed data is not declining when glucose levels move more and more away from the upper detection limit of CGMs.
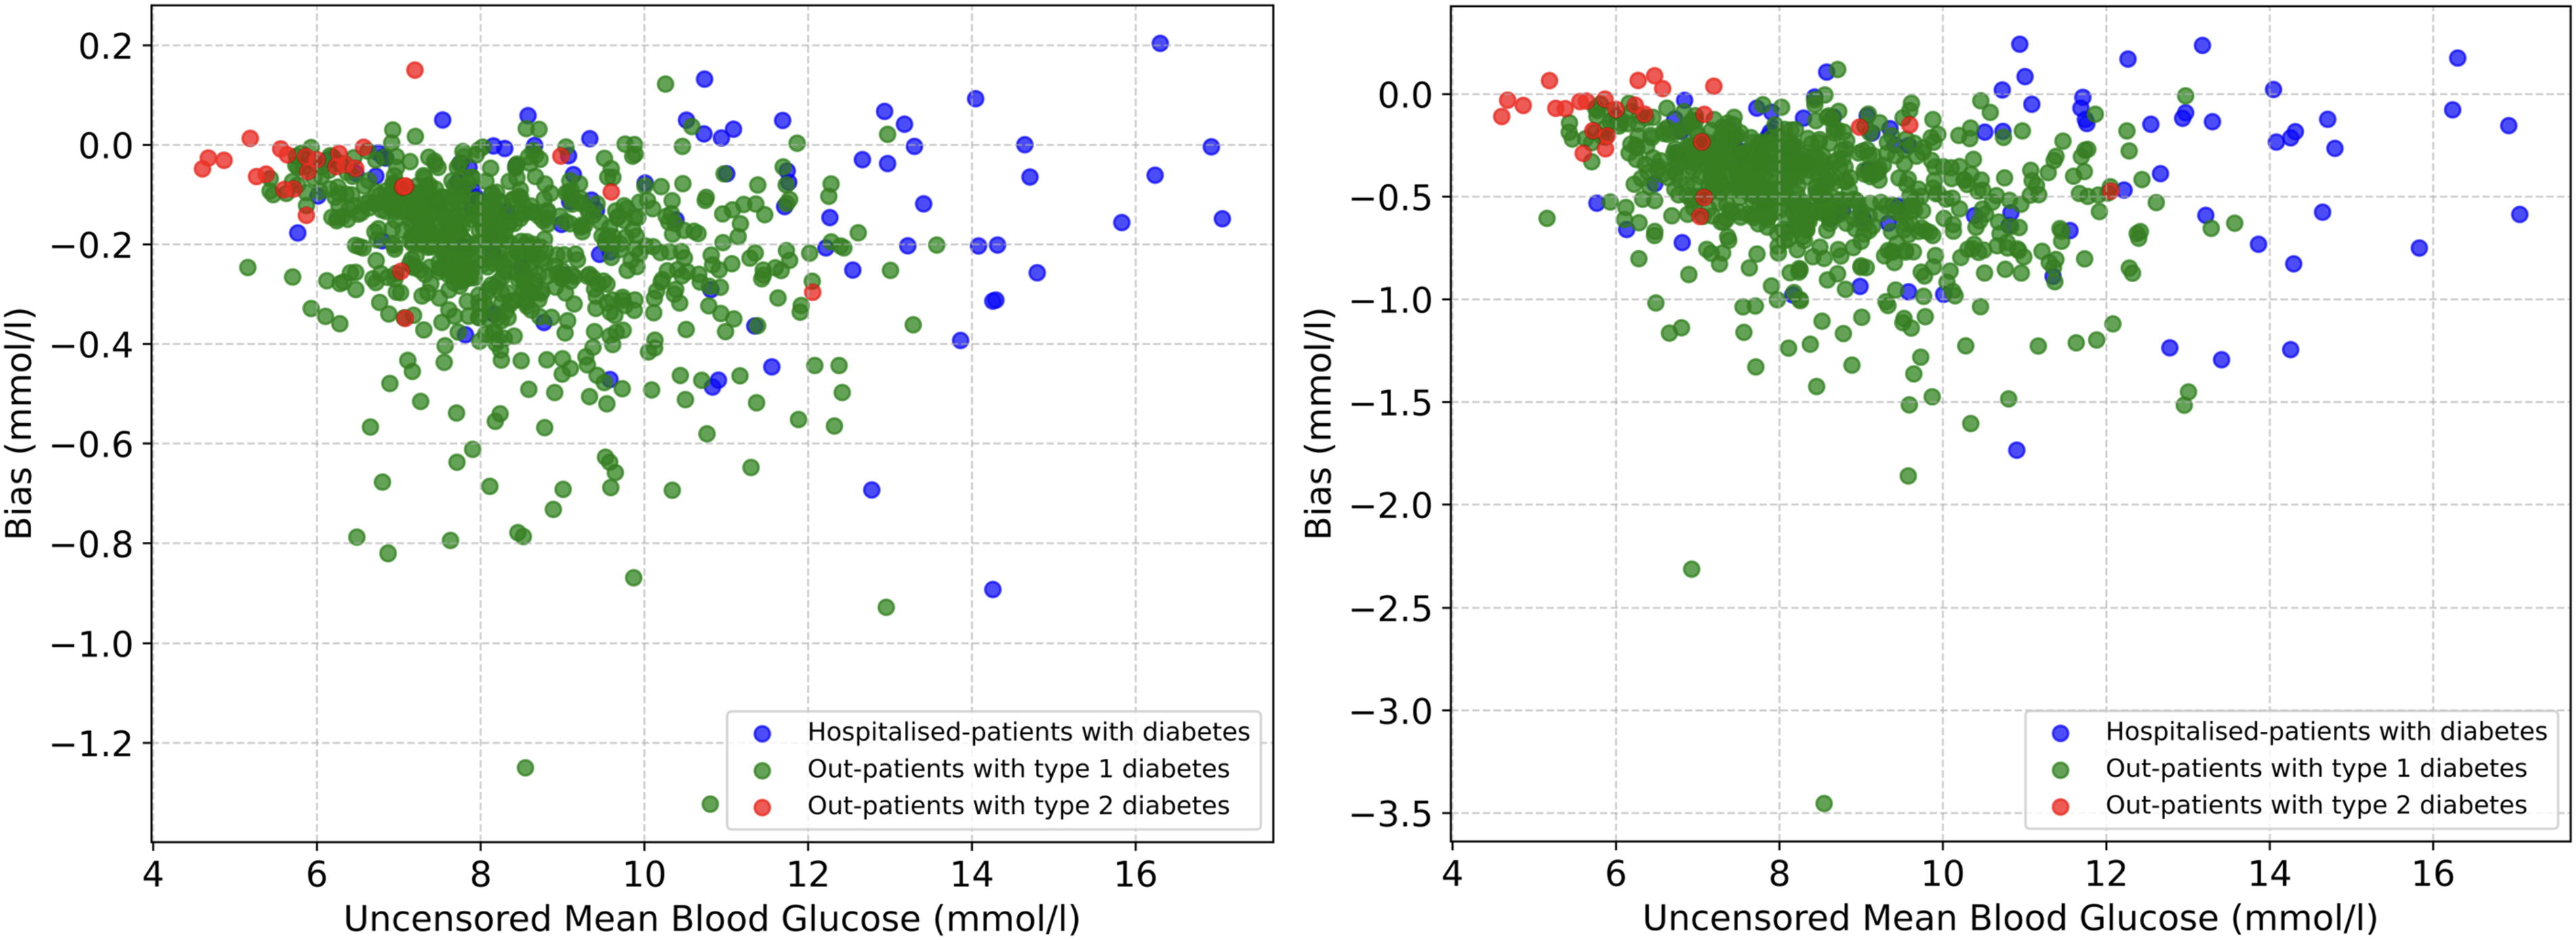
Scatter plot showing the (nonexisting) relationship between uncensored mean blood glucose levels and bias for hospitalized patients with diabetes (blue dots), outpatients with type 1 diabetes (green dots), and outpatients with type 2 diabetes (red dots). The left panel shows the results for 20% censoring and the right panel for 30% censoring.
Discussion
We have developed and validated a Gaussian process regression model for imputing glucose levels above the upper detection limits for CGMs. The model demonstrated good performance, with low bias and MSE R 2 close to 1 in the imputed glucose values across various datasets and in both patients with type 1 and type 2 diabetes. Our imputation model enables more unbiased quantification of specific international consensus CGM metrics (mean glucose level, SD of all CGM-glucose levels, and CV) in patients with severe hyperglycemia exceeding the upper detection limit of CGMs compared with not handling right-censored glucose levels.
Since these CGM metrics are internationally agreed upon, unbiased reporting hereof is crucial for the interpretability of CGM data and, therefore, for the following therapeutic and treatment decisions. 5 –7 Time spent in different ranges such as the percentage of time of CGM-glucose levels in time in range (3.9–10.0 mmol/L or 70–180mg/dL), time above range (>10.0 mmol/L or >180 mg/dL), and time below range (<3.9 mmol/L or <70 mg/dL) is unaffected by the censoring challenge since these metrics are independent on the magnitude of glucose excursions. This may not be a problem on an individual level because an individual’s CGM trace can still be interpreted, for example, in a medical consultation, even though a high fraction of sensor glucose measurements are above or below the measuring range. However, when reporting aggregated data from trials, bias may occur if the patients have a large percentage of censored data.
A great effort is made to investigate the accuracy, feasibility, and effects on clinical endpoints of using CGMs in an outpatient setting 20 and, more recently, in an inpatient setting. 5,21 –26 However, the censoring of CGM data has not been addressed. When working with CGM data, censored and missing data frequently occur. 27 Few statistical packages for detecting and handling missing data in CGM records are available, most of which rely on linear interpolation or linear regression models. 28 Nevertheless, several statistical approaches might be suitable to account for missing time-series data, such as for CGMs, including smoothing techniques, interpolation using splines or other nonparametric approaches, and kernel method. 29 –31 Also, to avoid analysis or clinical interpretation of CGM data containing too much missing data, for example, due to sensor errors, international consensus states that the percentage of time the CGM is collecting data must be at least 70% of 14 consecutive days. 7 Recently, a greater awareness of missing data in a research context has emerged, as evidenced by the guidelines from the International Council for Harmonization of Technical Requirements for Pharmaceuticals for Human Use, 32 the European Medicines Agency, 33 and the US National Research Council. 34 A recent review on handling missing data in the measuring range of CGMs has recently been published, emphasizing that no consensus exists on how to manage missing CGM data. 35 Despite this, no prior work has addressed handling CGM-censored data in the domain of diabetes, although advanced statistical modeling is frequently used in modeling CGM data in other ways such as predicting dysglycemia or diabetes types. 28,36,37 While deep learning techniques are powerful, they present significant challenges for this type of problem due to the absence of training data and difficulties in generalizing out-of-distribution values. 38 Therefore, a simple regression model was chosen for its strong imputation capabilities and the advantage of not requiring training. 16
Censored data are often not addressed in clinical trials utilizing CGM, although censored glucose values might greatly impact CGM metrics. 27 The extensive amount of time-series data is a challenge in treating censored and missing CGM data. 35 The censored data remain a statistical challenge until the CGM measuring range has expanded accordingly, especially regarding hyperglycemia. The left-censored, low glucose values are less of a challenge since the glucose levels from the lower limit of 2.2 mmol/L (40 mg/dL) can physiologically only go to zero, leaving a very small interval to be censored. Furthermore, CGMs are also inaccurate in the lower measurement range, which might lead to biased imputed low glucose values when using adjacent, observed low glucose levels as model input. 39 Conversely, it is not uncommon for glucose levels to exceed the upper limit of 22.2 mmol/L (400 mg/dL) by several units for hours, leading to significant right censoring. 40 Thus, the need for an imputation model for the censored values is most relevant for the hyperglycemic range.
Recognizing the widespread use of CGM in a research context, researchers are encouraged to consider imputation modeling as a tool to address the censored glucose values in research regarding CGM. This might facilitate a more unbiased reporting of glycemic metrics until CGM systems advance in measuring range. No general recommendations can be made for the percentage of time with right-censored CGM data where applying the imputation model would be reasonable. The bias introduced by not applying the imputation model depends not only on the amount, that is, percentage of time, of right-censored data but also on the magnitude of the right-censored glucose levels, the latter of which can only be assessed by applying the imputation model. However, it is important to recognize that hyperglycemia is harmful and should be prevented upfront, whenever possible, rather than being addressed retrospectively through statistical methods such as imputing right-censored glucose levels.
Strengths and Limitations
We included a relatively large number (n = 817) of both hospitalized patients with diabetes and outpatients with type 1 and type 2 diabetes, which we believe increases the external validity for the application of the imputation model. The imputation model was applied and validated on the top 5%, 10%, 20%, and 30% of the readings, which were intentionally censored per day for each patient included. The imputation model was therefore tested in different hyperglycemic ranges, which increases its validity.
A general limitation in imputation modeling is the assumption that the imputed values follow the same dynamics as that of the observed, uncensored values, that is, the dynamics or pattern of the CGM trajectory of the censored glucose levels is similar to the actual measuring range of CGMs. 41 This may not be correct and induce bias in our model. This discrepancy introduces a risk of bias in our model, as the behavior of glucose levels outside the measurable range may differ from those observed within the range, particularly under certain physiological conditions or in individuals with specific health issues such as diabetic ketoacidosis or insulin resistance. To address this, further research is necessary, along with access to actual data beyond the CGM’s measurement limits, to refine and validate our imputation approach.
Conclusions
An imputation model for glucose values above the upper detection limit of CGMs (typically 22.2 mmol/L) was developed and validated. The imputation model enables more unbiased quantification of international consensus CGM metrics (mean glucose level, SD, and CV) for all patients with severe hyperglycemia.
Footnotes
Acknowledgments
This publication is based on research using data from Jaeb Center for Health Research Foundation that have been made available through Vivli, Inc. Vivli has not contributed to or approved, and is not in any way responsible for, the contents of this publication.
Authors’ Contributions
M.T.O. and P.L.K.: Conceptualized the study. M.T.O., P.L.K., and C.K.K.: Contributed data to the study. K.J.S., S.M., and M.P.: Were responsible for data preparations and building and running the imputation model. M.T.O. and M.P.: Drafted the first version of the article. M.T.O. and M.P.: Are the guarantors of this work and, as such, had full access to all the data in the study and take responsibility for the integrity of the data and the accuracy of the data analysis. All authors read and approved the final article.
Data and Resource Availability Statement

Author Disclosure Statement
The authors declare no conflict of interest regarding this article.
Funding Information
No specific funding was received for this work.
Supplementary Material
Supplementary Data
Supplementary Table S1
Supplementary Table S2
Supplementary Table S3
Supplementary Table S4
Supplementary Table S5
Supplementary Table S6
Supplementary Table S7
Supplementary Table S8
Supplementary Table S9
Supplementary Table S10
Supplementary Table S11
References
Supplementary Material
Please find the following supplemental material available below.
For Open Access articles published under a Creative Commons License, all supplemental material carries the same license as the article it is associated with.
For non-Open Access articles published, all supplemental material carries a non-exclusive license, and permission requests for re-use of supplemental material or any part of supplemental material shall be sent directly to the copyright owner as specified in the copyright notice associated with the article.
