




Abstract
Background:
Patients treated for a hematological malignancy are susceptible to hyperglycemia, which can negatively affect treatment outcomes. Therefore, close monitoring of glucose levels is crucial. Data demonstrated that capillary measurement methods underreport hyperglycemic episodes compared with continuous glucose monitoring (CGM). However, the accuracy of CGM during intensive hematological treatments, and the associated metabolic and hemostatic imbalances, is unknown, which we aim to investigate in the current study.
Methods:
For the analysis, data collected during a prospective study that compared CGM with capillary point-of-care (POC) glucose measurements in adult patients hospitalized for intensive hematological care with three different treatment modalities, namely chimeric antigen receptor T-cell therapy, allogeneic stem cell transplantation (allo-SCT), or autologous stem cell transplantation (auto-SCT), were used. POC and CGM measurements were performed concurrently. Accuracy was assessed using mean and median absolute relative difference (MARD), Diabetes Technology Society (DTS) Error Grid analysis as well as percentages of values within 15%/15, 20%/20, and 30%/30 mg/dL.
Results:
A total of 60 patients (28% female, median age 64 [58–68] years and 10% with a history of diabetes mellitus) were included, yielding 1999 matched measurement pairs. The overall mean ARD was 21.5%, whereby the lowest mean ARD was observed during allo-SCT (18.3%) and the highest mean ARD during auto-SCT (27.1%). The percentages of glucose values within 15%/15, 20%/20, and 30%/30 mg/dL agreements were 38.1%, 51.1%, and 75.1%. The DTS Error Grid analysis showed good clinical accuracy with 99.6% of pairs within zone A + B.
Conclusions:
Despite the relative high MARD, the use of CGM is unlikely to result in harmful insulin dosing errors and seems feasible to use during intensive hematological care.
Introduction
Hematological malignancies are a major contributor to the global incidence of cancer, 1 and patients often require intensive treatment regimens. 2 During these treatments, including bone marrow transplantations and chimeric antigen receptor (CAR) T-cell therapy, significant immune-related responses invariably occur. 3 This, combined with other factors such a reduced physical activity and altered nutrition, can potentially lead to increased insulin resistance and glycemic dysregulation.4,5 Importantly, this glycemic dysregulation can occur in patients with and without a medical history of diabetes mellitus (DM) and can negatively affect treatment outcomes.6–8 For instance, data demonstrated that hypoglycemia increases the risk of treatment-related complications, such as infections, 9 graft-versus-host disease (GvHD), 6 lengthening hospital stays, 10 and decreased overall survival. 11 Therefore, improving glycemic control and reducing time spent in hypo- and hyperglycemic range could potentially improve treatment outcomes among patients admitted for intensive hematological care.
In recent years, the traditional method of monitoring blood glucose levels via capillary fingerprick measurements has largely been replaced by continuous glucose monitoring (CGM) via wearable glucose sensor devices, in persons with diabetes. These sensors have allowed for improvements in the glycemic control and quality of life.12,13 CGM devices measure interstitial glucose levels at a 1–5-min interval to provide continuous data on glucose levels; moreover; alarms can be set at predefined glucose levels. These functions enable patients and health care providers to act on hypo- and hyperglycemic episodes that might otherwise be missed with capillary measurements, which are usually measured up to seven times a day. This is especially relevant to persons admitted to the hospital, as previous research indicates that almost one-third of hyperglycemic and over 90% of hypoglycemic events are missed at the general wards.14,15
A number of factors can influence the relationship between capillary and interstitial glucose concentrations and thus the accuracy of CGM. Among these are the blood flow through the skin, the permeability of the capillaries, and metabolism of the cells present in the interstitium.16,17 As all of these situations may be altered during intensive hematological treatments, the accuracy of CGM devices may also be (negatively) impacted. We conducted this prospective study to ascertain whether the usage of CGM in patients admitted to the hospital for intensive hematological care is feasible and accurate.
Research design and methods
The writing of this article was guided by the Strengthening the Reporting of Observational Studies in Epidemiology statement criteria. 18
Study design and population
For this analysis, we used data from a prospective cohort study 19 that included adult patients admitted to the Department of Hematology of the University Medical Center Groningen, The Netherlands, between April 2022 and November 2023. Patients who were hospitalized to receive CAR T-cell therapy, allogeneic hematopoietic stem cell transplantation (allo-SCT), or autologous hematopoietic stem cell transplantation (auto-SCT) as therapeutic intervention for a hematological malignancy were eligible to participate in the study. Both patients with and without DM were included. Patients were not eligible if they had a known allergy to the adhesive material used to attach the CGM. Sample size calculation was previously described. 19
The study protocol was approved by the Medical Ethics Review Board (METc) of UMCG (identifier 202200136), and all participants provided both verbal and written informed consent prior to enrollment.
Measurements
Point-of-care (POC) measurements were performed using the Accu-Chek Inform II System (Roche Diagnostics Corporation, Indianapolis, IN, USA). The accuracy of this device has been shown to be clinically acceptable with high specificity, sensitivity, and low risk of potential insulin dosing errors in a medical setting.20,21 Every day, four POC measurements were performed in all participants at predefined time-points (i.e., before meals and at bedtime) beginning after CAR T- or stem cell infusion.
The Dexcom G6 real-time CGM (Dexcom, San Diego, USA) was used for real-time CGM. This factory-calibrated sensor was initiated 2 h prior to CAR T- or stem cell infusion. The sensor was placed on the abdomen or, if contraindicated, on the upper arm, according to the manufacturer’s recommendations. During the study, both patients and hospital personnel were blinded to the CGM measurements. Blinding was implemented using the blinding mode available in the Dexcom Clarity portal, which disables access to glucose readings as well as alarms or alerts. No treatment decisions were made based upon the CGM measurements. Monitoring was performed for a maximum of 10 days. Data were downloaded using Dexcom Clarity software. Of note, the sensor was removed if a magnetic resonance imaging scan was required. Additionally, the sensor was removed if substances known to interfere with its function, such as more than 4 g of paracetamol per day and hydroxyurea, were required. 22
Any POC value above 22.2 mmol/L (400 mg/dL) and below 2.2 mmol/L (40 mg/dL) was excluded from the analysis due to the measurement limitation (i.e., upper and lower limit of the CGM, respectively). The time of POC measurement was used to match pairs, selecting the CGM value closest in time. Consequently, the maximum time difference between a pair was restricted to 3 min.
As per standard care, measurements of systolic and diastolic blood pressure, body temperature, and respiratory rate were conducted daily. To analyze paired glucose values within a specific vital sign range, paired glucose values measured within 1 h of the vital sign measurement were selected.
Additionally, medication use was collected from the electronic patient record, which included medication type, dose, and time of administration.
Study outcomes
The primary outcome was the mean absolute relative difference (mean ARD) of the CGM during intensive hematological care. Secondary outcomes included the median absolute relative difference (median ARD), the percentage of matched pairs in Diabetes Technology Society (DTS) Error Grid analysis zones, and the percentage of glucose reading within ±15%/15, ±20%/20, and ±30%/30 mg/dL.
The DTS analysis is used to assess the clinical safety of a CGM. 23 DTS plots were created on the DTS website (https://www.diabetestechology.org/dtseg/). A DTS plot is divided into five zones, zone A till E. Assessing the percentage of values within zones A + B, which are considered clinically acceptable, is a common practice in reporting Error Grid analysis results. 24 Since the DTS Error grid is developed recently, a comparison was made with the Clarke Error Grid (CEG) analysis, 25 Parkes Error Grid analysis, 26 Surveillance Error Grid, 27 and DTS Error grid to evaluate differences in the percentages across zones. Concerning 15%/15, 20%/20, and 30%/30 mg/dL analyses, this measure calculates the proportion of glucose values that fall within a specified percentage range of POC values. For glucose values above 5.6 mmol/L (100 mg/dL), a percentage (15%, 20%, or 30%) is used; for values below 5.6 mmol/L, a fixed amount (15, 20, or 30 mg/dL) is used instead.
Statistical analysis
Data were presented as mean (±standard deviation) or median (interquartile range [IQR]) for continuous variables, depending on the normality of the data, and frequency (percentage [%]) for categorical variables. Where appropriate, 95% confidence intervals (CIs) were also reported to indicate the precision of the estimates. The mean ARD, median ARD, the percentage of matched pairs in DTS zones, and the percentage of glucose reading within ±15%/15, ±20%/20, and ±30%/30 mg/dL were calculated based on the matched pairs by POC and CGM. To analyze matched pairs in certain vital sign ranges, pairs were matched with vital sign measurements if the measurements were taken within 1 h of each other. This approach ensured enough matched pairs remained available for analysis. Each analysis was performed for all matched pairs available, and separate analysis was performed per treatment type, body temperature ranges, glucose ranges, systolic and diastolic blood pressure ranges, days of wear, and with and without paracetamol use. Subanalyses were only performed if more than five pairs were available, to ensure sufficient power for the analysis. A Spearman–Rho test was used to check for correlations between vital signs and the ARD. Statistical analyses were performed using SPSS version 28.0.1.0 (142) and R version 4.3.1. A P value of <0.05 was considered statistically significant.
Results
Study population
In total, 102 adult patients were screened for eligibility. Among these, 12 patients were ineligible for inclusion due to the absence of a hematological malignancy (n = 2), prior participation in this study, that is, receiving an additional line of treatment (n = 2), transfer to another hospital within a few days after infusion (n = 4), admittance to the intensive care unit prior to infusion of the CAR T- or stem cells (n = 1), or the unavailability of the informed consent form in the language spoken by the participant (n = 3). In addition, 30 patients declined to give informed consent.
Baseline characteristics of the 60 patients included in this study are summarized in Table 1: 28% of the patients were female, with a median age of 64 years (58–68) and body mass index of 25.1 kg/m2 (23.3–27.6). Six patients had a documented history of type 2 DM with a median duration of 9.5 (3–12) years, and they all used glucose lowering medication, including insulin (n = 3, 50%), metformin (n = 2, 33%), and gliclazide (n = 1, 17%). Baseline characteristics of the three different treatment groups were similar (Table 1).
Patient Characteristics

ALL, acute lymphoblastic leukemia; Allo-SCT, allogeneic stem cell transplantation; AML, acute myeloid leukemia; Auto-SCT, autologous stem cell transplantation; BPDCN, blastic plasmacytoid dendritic cell neoplasm; CAR, chimeric antigen receptor; CLL, chronic lymphoblastic leukemia; CML, chronic myeloid leukemia; CMML, chronic myelomonocytic leukemia; CTCL, cutaneous T-cell lymphoma; DLBCL, diffuse large B-cell lymphoma; ET, essential thrombocythemia; HGBCL, high grade large B-cell lymphoma; HL, Hodgkin lymphoma; IQR, interquartile range; MCL, mantle cell lymphoma; MDS, myelodysplastic syndrome; MM, multiple myeloma; PCL, plasma cell leukemia; PLL, prolymphocytic leukemia; tFL, transformed follicular lymphoma.
In total, 62 sensors were initiated, of which two sensors were replaced within 24 h after initiation. One sensor was removed due to a minor bleeding after application (grade 1) and another sensor detached within 24 h postplacement. The median active percentage of the remaining 60 sensors was 100% (IQR [99.8–100]). The mean sensor wear was 9.4 (±1.0) days. In total, 1999 matched pairs were available for analysis.
Overall accuracy and accuracy of different treatment regimens
The overall mean ARD was 21.5% and median ARD was 19.4%. Agreement rates at 15/15%, 20/20%, and 30/30% were 38.1%, 51.1%, and 75.1%, respectively. Furthermore, 99.6% of the matched pairs fell within zone A + B of the DTS Error grid analysis (Table 2). Of note, there were no differences in percentage in zone A + B in between different Error Grids (Supplementary Data). The mean difference between CGM and POC measurements was 1.3 mmol/L (95% CI: −1.0 to 3.6 mmol/L). Among patients treated with allo-SCT, the mean ARD was best, namely 18.3%, compared with 18.8% during CAR T-cell treatment and 27.1% during auto-SCT. Median ARD was lower, namely 16.1% during CAR T-cell treatment and allo-SCT and 26.4% during auto-SCT. The 15/15%, 20/20%, and 30/30% agreements were 45.9%, 60.3%, and 84% during allo-SCT, respectively. For CAR T-cell treatment, they were 46.0%, 59.4%, and 81.2%, and for auto-SCT, they were 23.0%, 34.3%, and 60.8% (Table 2). In addition, the DTS Error grid percentages in zone A + B were 99.5%, 99.6%, and 99.9% for CAR T-cell therapy, allo-SCT, and auto-SCT, respectively (Table 2, Fig. 1).
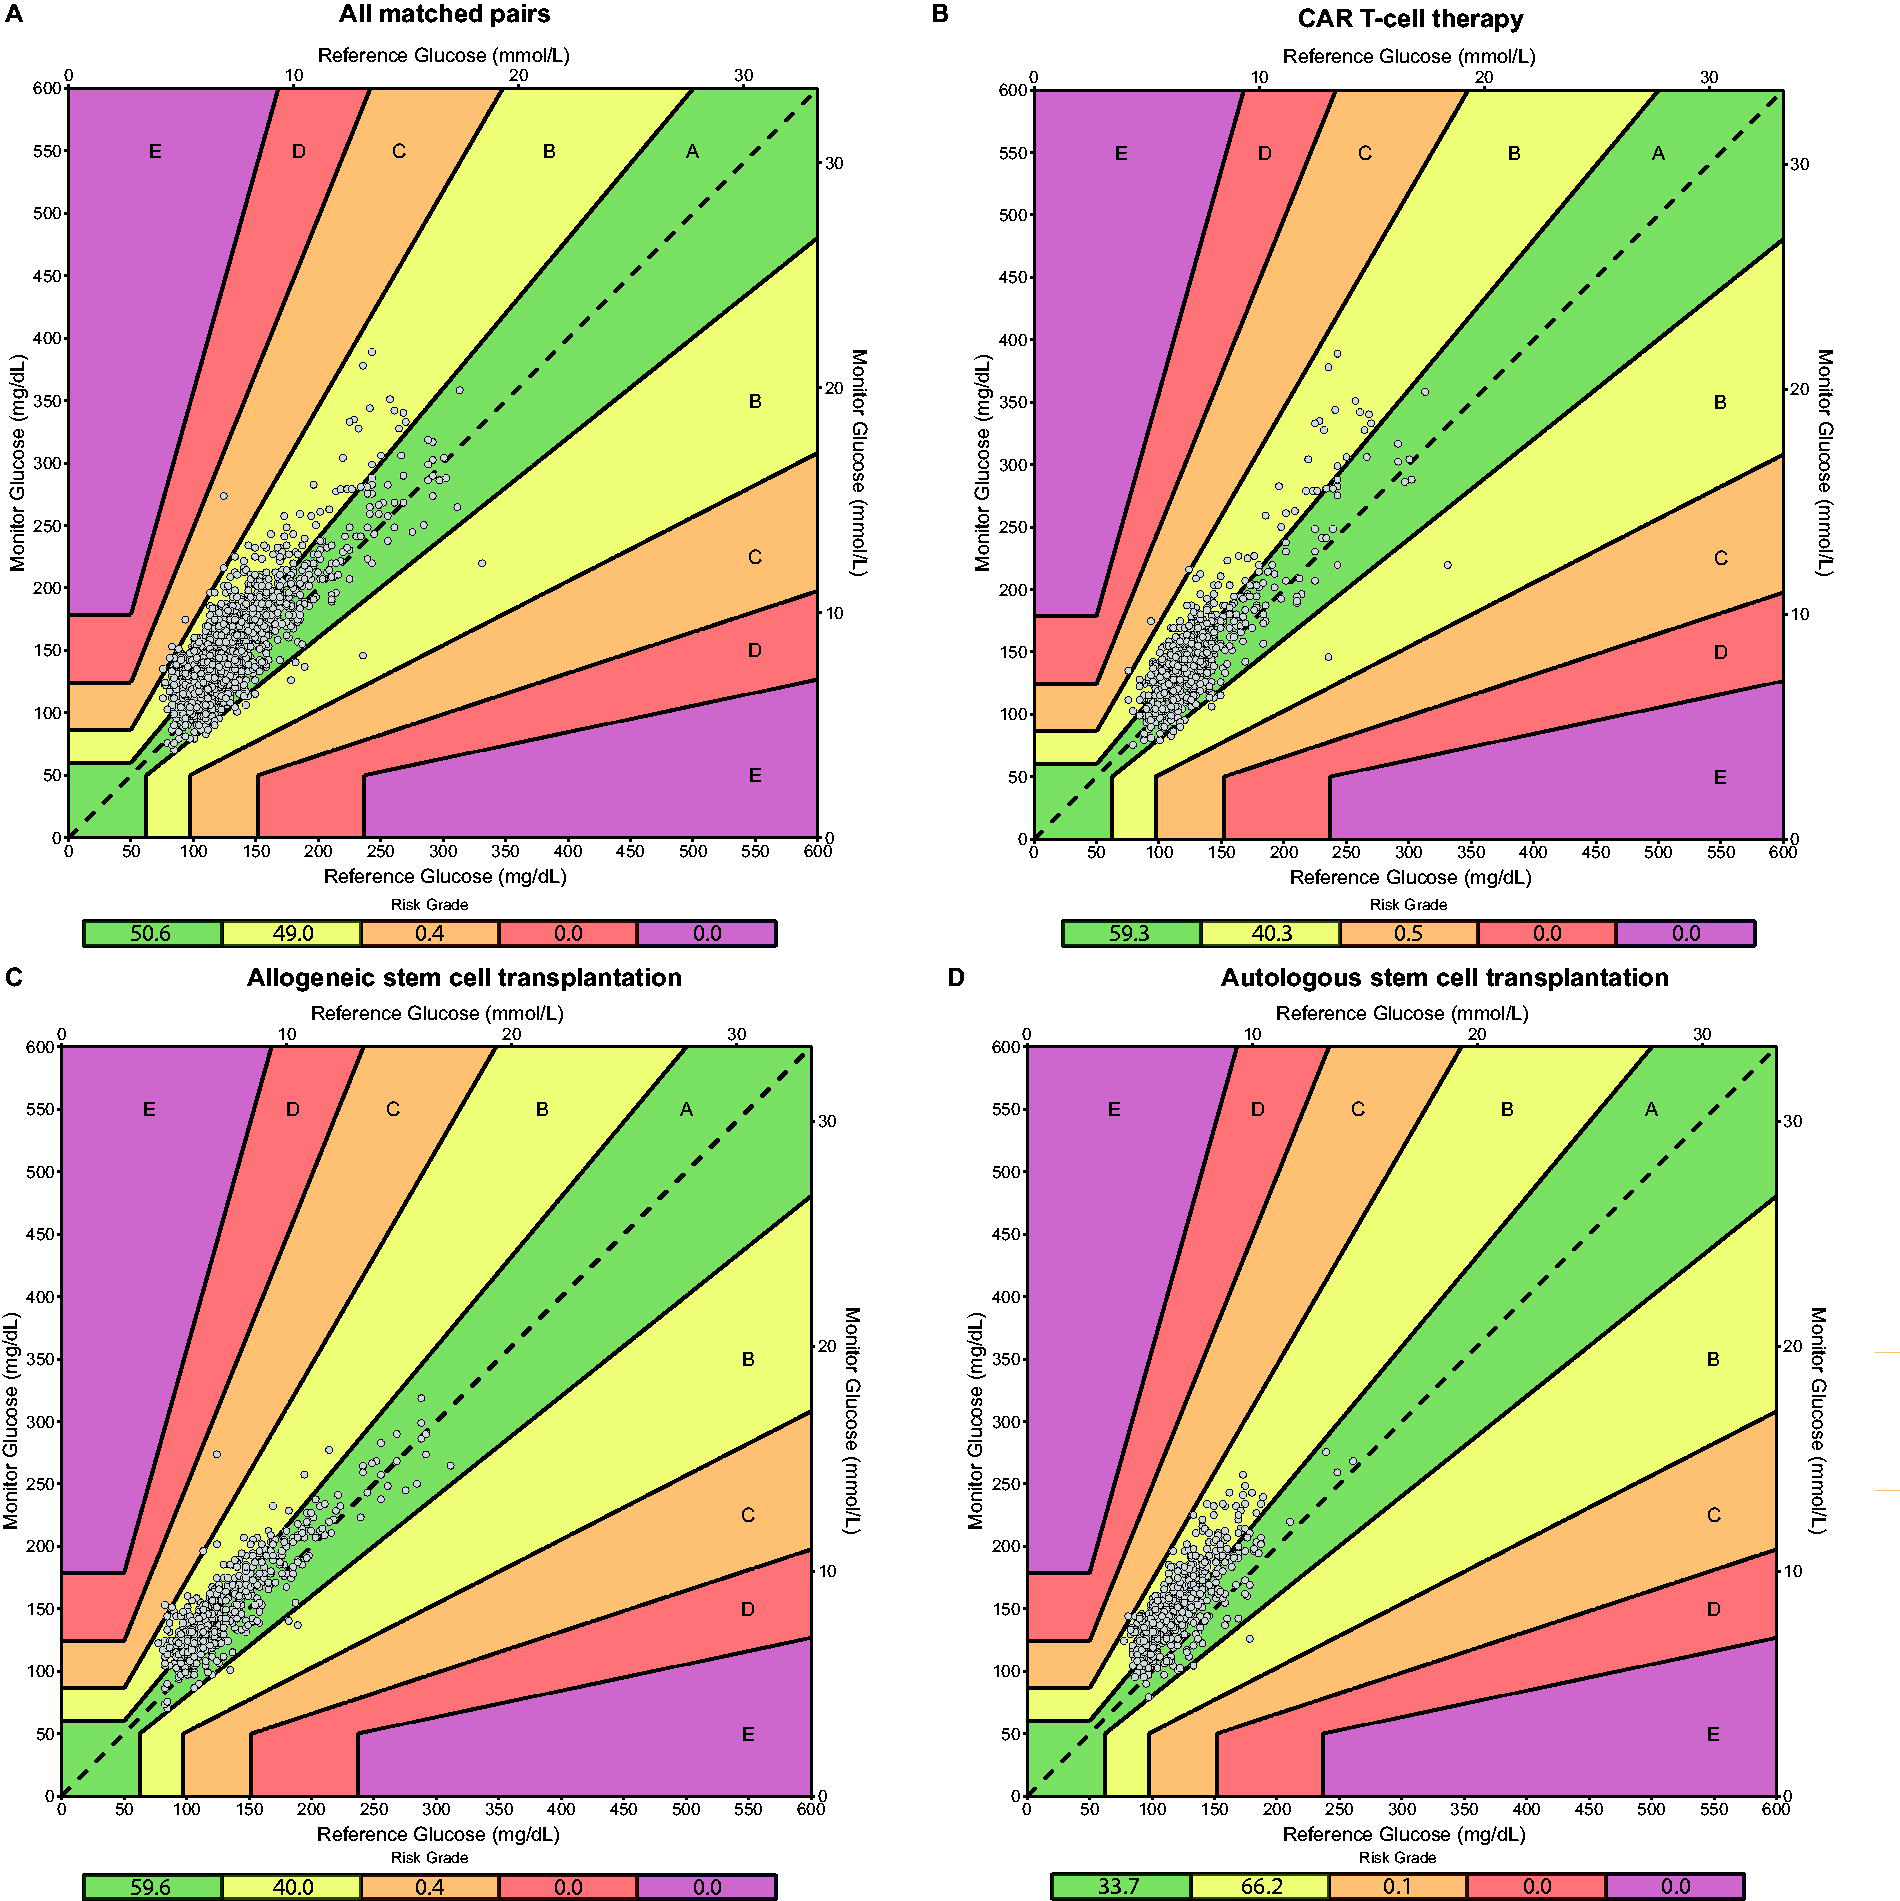
Diabetes Technology Society Error Grid analysis for different treatment types.
Accuracy Statistics During Intensive Hematological Care
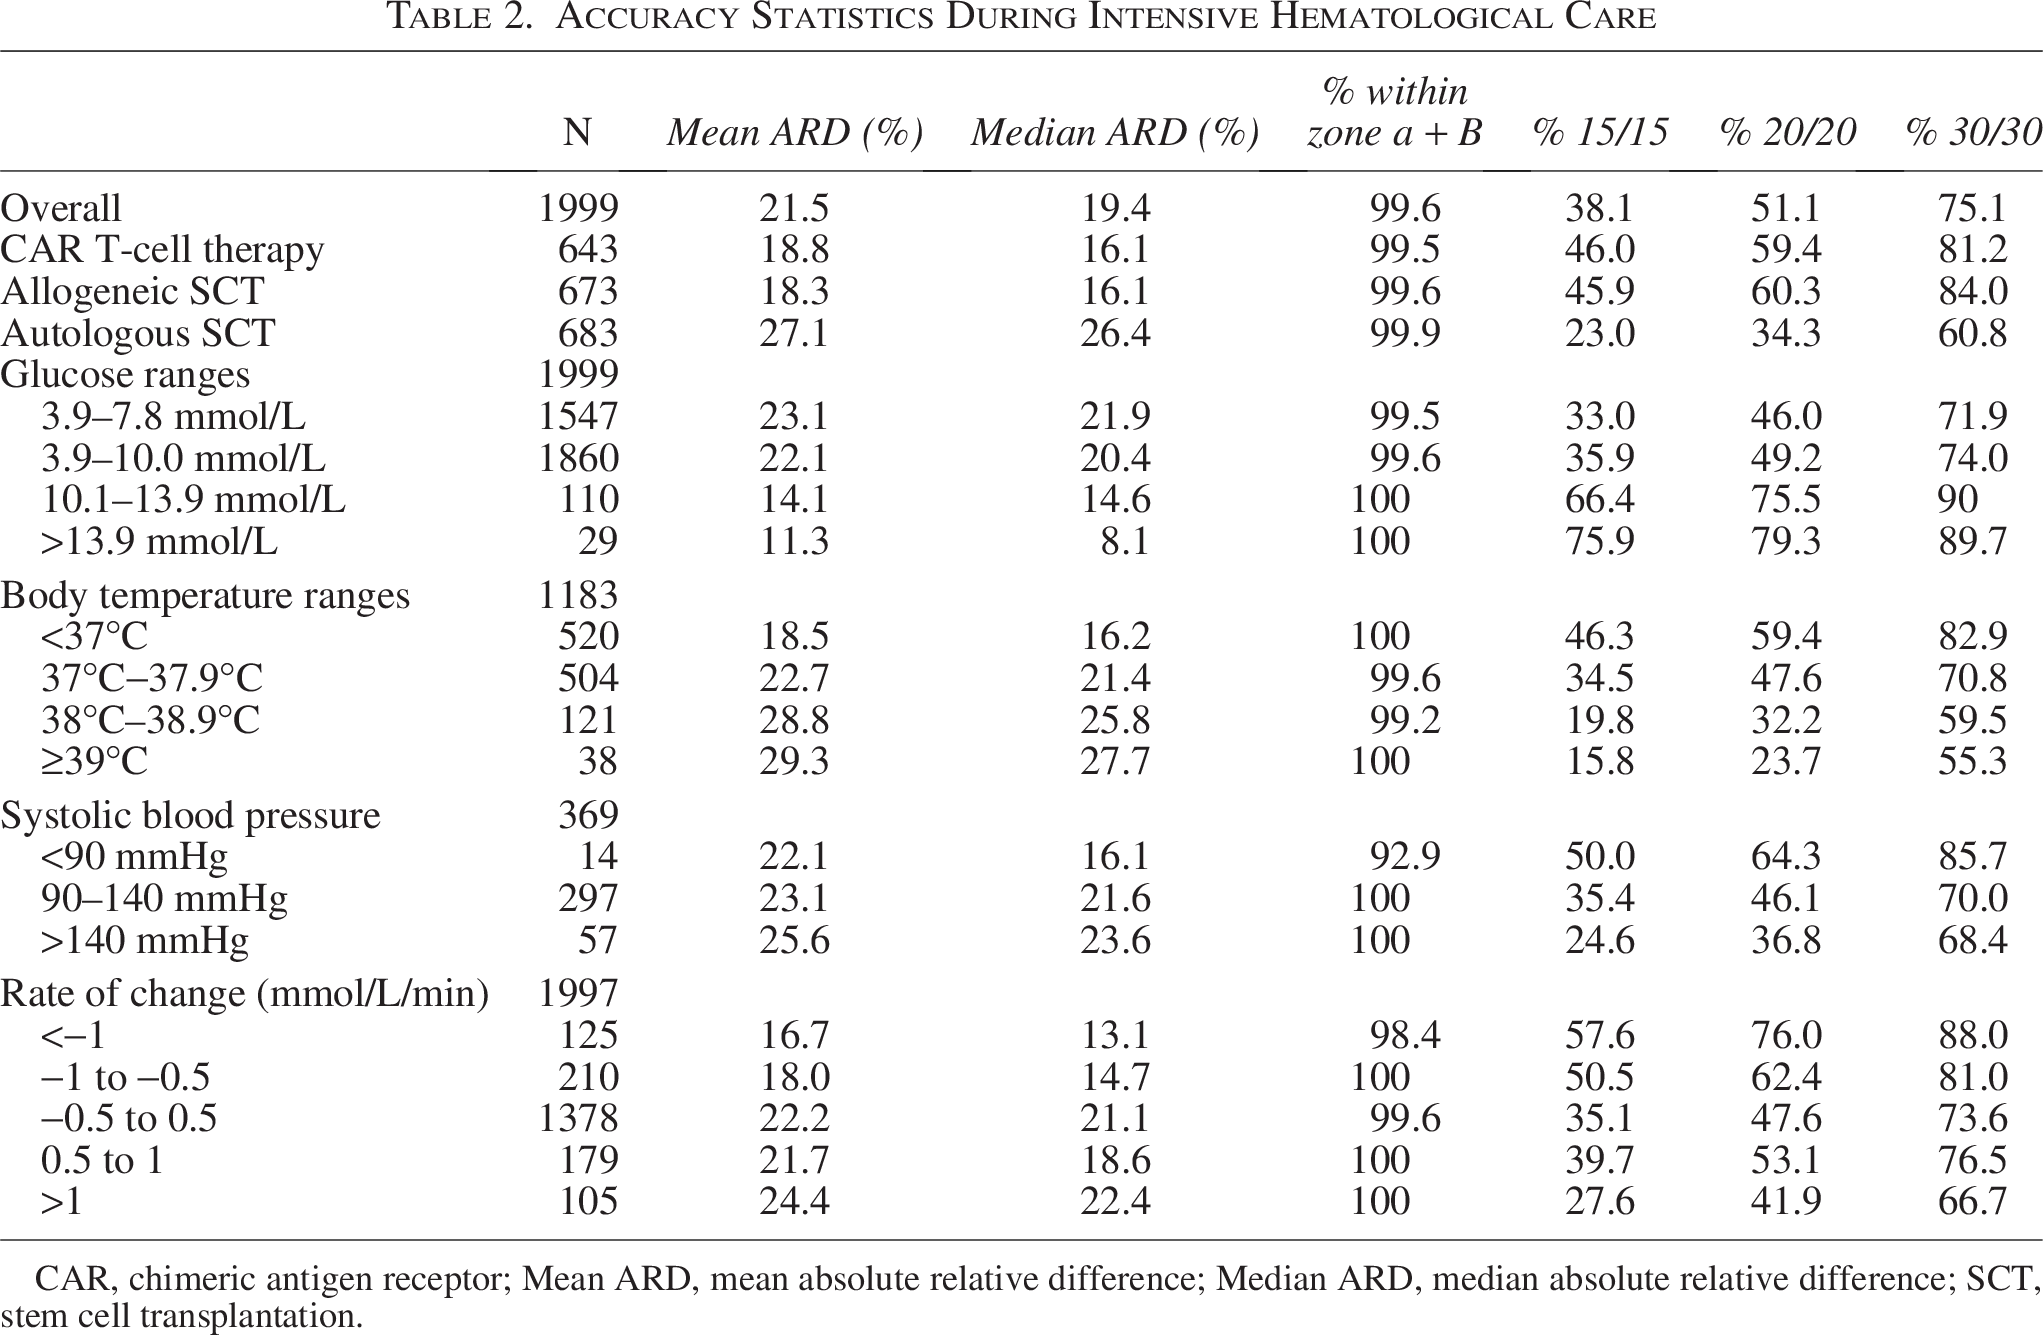
CAR, chimeric antigen receptor; Mean ARD, mean absolute relative difference; Median ARD, median absolute relative difference; SCT, stem cell transplantation.
Accuracy across glucose ranges, vital sign measures, rate of change, and days of wear
For further analysis, matched pairs were stratified by subgroups according to POC glucose categories, vital signs (body temperature and systolic and diastolic blood pressure), rate of change (of glucose), days of wear, and paracetamol dose categories (see Table 2 and Supplementary Data). Overall, the MARD was better with higher glucose levels, lower body temperature, lower blood pressure, lower rate of change of glucose, and lower paracetamol dose. MARD, as well as agreement percentages and DTS analysis, remained consistent throughout the sensor wear-time.
Correlation vital signs and ARD
Spearman–Rho test was performed to test the correlation between body temperature, blood pressure, and the ARD. Results indicate a statistically significant correlation between body temperature and ARD (ρ = 0.255, P < 0.001), between diastolic blood pressure and ARD (ρ = −0.110, P = 0.034), and between paracetamol usage and ARD (ρ = 0.061, P < 0.05). However, all correlations observed are considered weak (ρ < 0.3). Additionally, paracetamol dosage and body temperature were likewise correlated (ρ = 0.258, P < 0.05).
Discussion
Hyperglycemia is correlated with adverse treatment outcomes such as infections, GvHD, a prolonged hospitalization, and decreased overall survival.6,9–11 Within this study, we investigated the accuracy and usability of CGM, specifically the Dexcom G6, for the detection of hyperglycemia during hospital admission for intensive hematological care. We found that, compared with POC measurements, mean ARD was 21.5% and median ARD was 19.4%. Agreement rates at 15/15%, 20/20%, and 30/30% were 38.1%, 51.1%, and 75.1%, respectively. In addition, 99.6% of the matched pairs fell within in zone A + B of the DTS Error Grid analysis, demonstrating general usability for therapeutic glucose management.
The general usability of the CGMs regarding glucose management, combined with the reduced need for capillary measurements and possibility of remote monitoring, could reduce workload burden for nurses. 28 In addition, because CGMs record 24 h of data, it would give health care professionals a more complete overview of the glycemic state of the patient and decrease the number of unknown hyperglycemic events, especially during nighttime. 29 This can potentially further improve patient care and treatment outcomes.
In this study, the mean ARD of all measurements was 21.5% and the median ARD was 19.4%, which is higher than reported in other clinical studies examining accuracy in hospitalized noncritically ill patients with DM and in real-life conditions. Compared with Davis et al., 30 we observed lower overall accuracy (mean ARD: 12.8% vs. 21.5%; 15/15%: 68.7% vs. 38.1%) but similar suitability for use, as indicated by Error Grid (CEG) analysis (98.7% vs. 99.8% in zone A + B). Similarly, Marak et al. 31 investigated Dexcom G6 accuracy using data from the Insulin-Only Bionic Pancreas Pivotal Trial and reported a mean ARD of 11.0%, 15/15% of 78.7%, and 20/20% of 87.2%, although Error Grid analysis was not performed. However, it is important to discriminate accuracy data obtained under controlled experimental conditions and data collected during acute illness in the hospital setting. 32 In this setting, intensive treatments or homeostatic disruptions could affect sensor performance. Notably, some prior studies used a YSI analyzer as reference method, which measures venous or arterialized blood glucose. In contrast, the comparator in our study was a POC device (Accu-Chek Inform II System).
A more recent study conducted by O’Conner et al., 33 which used the same continuous glucose sensor and generated 6.648 matched pairs from adults admitted to the medical or surgical nonintensive wards, found roughly the same mean ARD (19.2%) and agreement rates (59.5% for 20/20% and 98.2% of all pairs fell in zone A + B of the CEG). To improve the accuracy, they performed retrospective calibrations and found that calibrating once daily in the morning significantly improved the accuracy (mean ARD of 11.4%). This is an important observation as this could potentially also be usable for the current data and studied population.
The MARD found in this study does not comply with current standards set by the Food and Drug Administration for integrated CGM systems, 34 nor the ISO 15197:2013, 35 which is the equivalent standard employed by the European Medicines Agency. However, from a clinical perspective, the vast majority of measurements lie within zones A (clinically accurate) and B (benign error) of the DTS Error Grid. Furthermore, current standard practice for stress hyperglycemia recommends the initiation of insulin therapy at glucose levels ≥10 mmol/L. 36 At this range of glucose values, the accuracy is considerably higher compared with that observed at lower glucose levels. As such, we argue that CGM could be a valuable method to guide clinical treatment of hyperglycemia in patients undergoing treatment for hematological malignancies and possibly also in patient-groups exhibiting similar characteristics.
The accuracy of any CGM is affected by imbalances in body temperature and blood pressure, with both high and low extremes affecting sensor performance. This is in-line with the known dynamics between capillary and interstitial glucose levels. 16 For instance, body temperature was previously found to affect sensor performance, 37 which was theorized to be part of the reason behind the overestimation of glucose levels seen in various exercise studies.38,39 To our knowledge, the effects of blood pressures on sensor accuracy have not been investigated in vivo. However, mechanistically, significant hypo- or hypertension would affect the blood flow to the area of the sensor and potentially lower accuracy. 16 Similarly, could it affect lag-time, and as a consequence, MARD during periods with large changes in glucose, such as mealtime. However, our study was not designed to investigate this aspect of sensor accuracy. Meanwhile, the relationship between blood pressure and sensor accuracy was either not significant or negligible, even if power was diminished due to the low occurrence of extreme hypo- or hypertension. Paracetamol usage was also correlated with a decrease in sensor accuracy. However, this is likely due to confounding by the effects of increased body temperature, as paracetamol is often prescribed for its antipyretic effect. Indeed, paracetamol dosage was also correlated with body temperature.
In general, the decreases in accuracy were often due to an overestimation of glucose measurement by the CGM in relation to the POC capillary glucose reading. These overestimated measurements only rarely reached a degree of inaccuracy that would have affected clinical outcomes (as shown by areas C, D, and E in the provided DTS Error Grid analysis). We are unable to comment on the accuracy of the CGM during hypoglycemia because there was only one reading below 3.9 mmol/L using the POC meter. In this instance, the POC glucose concentration was 3.1 mmol/L, whereas the corresponding CGM reading was 6.9 mmol/L, resulting in a discrepancy of 3.7 mmol/L.
The strengths of this study lie within the inclusion of a diverse hematological population, which allows for a large number of measurements across a wide range of body temperatures and blood pressures. Additionally, CGM measurements were double-blinded, enhancing the objectivity and reliability of the data. However, some limitations were present, including the lack of matched pairs in the hypoglycemic range, as well as a limited number of matched pairs in some vital sign subgroups. This can potentially obscure relevant effects on the accuracy in those groups. In addition, the controls used in this study were capillary measurements, which can introduce their own inaccuracies, unlike venous measurements. 40 However, repetitive venous measurements are a burden for the patients; therefore, we chose to use capillary measurements. Lastly, as capillary measurements were only routinely performed during the day, we have no data concerning nighttime glucose levels. Finally, sensors were not calibrated during the study period, since the Dexcom G6 is a factory-calibrated device. However, this may have led to an even better clinical accuracy.
In conclusion, our study highlights the clinical value of CGM in this complex medical scenario, in particular in identifying episodes of hyperglycemia that might lead to changes in clinical care and improved quality of care for the patient and reduce workload for the health care staff. Of course, a clinical trial showing improved outcomes would be a large and expensive undertaking, but these data provide proof of concept that the CGM can be used. These findings also suggest that caution is warranted when interpreting CGM data in both acutely ill and otherwise healthy individuals, due to the potential for increased measurement variability under these conditions. This supports existing recommendations, such as those from the Joint British Diabetes Societies for Inpatient Case, which advise that intermittent POC glucose measurements should still be performed in such settings. 41
Authors’ Contributions
M.T.: Conceptualization (equal); data curation (lead); formal analysis (equal); methodology (equal); visualization (lead); and writing—original draft (equal). R.A.B.: Formal analysis (equal); visualization (supporting); and writing—original draft (equal). J.W.d.B.: Conceptualization (equal); methodology (equal); and writing—review and editing (equal). R.O.B.G., A.P.v.B., H.A.M.K., V.R.W., O.G.M., and P.C.: Visualization (supporting) and writing—review and editing (equal). P.R.v.D.: Conceptualization (equal); formal analysis (supporting); funding acquisition (equal); supervision (equal); visualization (supporting); and writing—review and editing (equal). T.v.M.: Conceptualization (equal); formal analysis (supporting); funding acquisition (equal); supervision (equal); visualization (supporting); and writing—review and editing (equal). M.T. and R.A.B.: Contributed equally to this work. All authors approved the final version of the article.
Footnotes
Authors Disclosure Statement
T.v.M. received research funding from Celgene/Bristol Myers Squibb, Siemens, and Genentech; honoraria from Kite, a Gilead Company, Gilead Sciences, Celgene/Bristol Myers Squibb; and has a consulting/advisory role for Janssen, Lilly. and Kite. P.C. has received personal and/or research support from Abbott, Dexcom, Medtronic, Insulet, Ypsomed, Novo Nordisk, Sanofi, Lilly, Embecta, and Vertex. All other authors declare no potential conflicts of interest.
Supplemental Material
References
Supplementary Material
Please find the following supplemental material available below.
For Open Access articles published under a Creative Commons License, all supplemental material carries the same license as the article it is associated with.
For non-Open Access articles published, all supplemental material carries a non-exclusive license, and permission requests for re-use of supplemental material or any part of supplemental material shall be sent directly to the copyright owner as specified in the copyright notice associated with the article.
