
Abstract
A novel, yet effective method for identifying DNA-binding modes of [Ru(bpy)2dmt]2+ (where bpy = 2,2′-bipyridine and dmt = 2,3-dimethyl-1,4,8,9-tetra-aza-triphenylene) on an indium tin oxide electrode has been successfully developed by introducing Cu2+ ion and ethylenediaminetetraacetic acid. The results from emission spectra and fluorescence microscopic images suggested that [Ru(bpy)2dmt]2+ not only associates with Cu2+ ion in both the absence and presence of DNA but also shows strong affinity with DNA in the presence of Cu2+. Evidence for the strong binding of [Ru(bpy)2dmt]2+ to DNA was determined from the interface studies using electrochemical methods. The present study suggests that a combination of photoluminescence measurement with electrochemical methods identifies the DNA-binding behavior of luminescent molecules with redox activities. [Ru(bpy)2dmt]2+ binds to DNA via an intercalative mode.
Introduction
In addition to the theoretical calculations (Li et al., 2006; Sun et al., 2008; Ambrosek et al., 2010), various experimental techniques have been widely used in the DNA-binding studies of small molecules with drugs, for instance, viscosity and X-ray crystallographic measurements, electronic absorption and fluorescence spectroscopy, surface-enhanced Raman scattering, NMR spectroscopy, and more recently, atomic force microscopy (Liu et al., 2001, 2008; Ujj et al., 2002; Spillane et al., 2008). As some Ru(II) complexes provided vacant nitrogen atoms for chelating metal ions, leading to changes in the photochemical performance, the method of introducing metal ions or chelating agents was recently used to investigate the DNA-binding behavior of Ru(II) complexes (Tysoe et al., 1999; Liu et al., 2005, 2010; Zhang et al., 2010). In our previous study on the DNA-binding nature of mono- and di-ruthenium complexes with intermolecular hydrogen by introducing Cu2+ ions (Zhang et al., 2007; Chen et al., 2009), two types of DNA-binding modes were identified.
In this work, we concentrate on developing an effective method for identifying the DNA-binding mode of [Ru(bpy)2dmt]2+ (where dmt = 2,3-dimethyl-1,4,8,9-tetra-aza-triphenylene) on a substrate surface. Indium tin oxide (ITO) is used as a supporting electrode because of its optically transparent panel. We are interested in the changes in the photoluminescent and electrochemical responses of [Ru(bpy)2dmt]2+ in the absence and presence of DNA owing to the introduction of Cu2+ and ethylenediaminetetraacetic acid (EDTA). As depicted in Figure 1, a combination of photoluminescence measurement with electrochemical methods reveals that [Ru(bpy)2dmt]2+ binds to DNA via an intercalative mode.

Schematic diagrams of [Ru(bpy)2dmt]2+ on the ITO electrode after introducing DNA and Cu2+ ions. The insets show the structure of [Ru(bpy)2dmt]2+
Materials and Methods
Instrumentation
Emission spectra were recorded on a Hitachi RF-2500 fluorescence spectrophotometer. An excitation wavelength of 450 nm was used. The fluorescence images were taken using a Nikon Eclipse TS100 inverted fluorescence microscope system equipped with a 50 W mercury lamp source. The images were captured with a Nikon E4500 camera at an excitation of blue light. Voltammetric measurements were performed on a CHI 660a electrochemical system with a corresponding software package.
Experimental materials and procedures
The synthesis of [Ru(bpy)2dmt]Cl2 was reported in a previous paper (Zhen et al., 1999). Its molecular structure is shown in Figure 1. Tris(hydroxyl methyl) amino-methane (Tris) was purchased from Sigma Chemical Company. All other chemicals were of reagent grade and purchased from commercial vendors. Buffer solution was 10 mM Tris/50 mM NaCl (pH adjusted to 7.2 with HCl). Herring sperm DNA (Qiyun Biological Technology) was used as received. DNA in buffer gave a UV absorbance ratio at 260/280 nm of 1.89, indicating that the DNA was sufficiently free of protein (Marmur, 1961). After diluting the DNA solution, its concentration per nucleotide phosphate was determined by UV absorbance at 260 nm. The molar absorption coefficient of DNA at this wavelength was taken as 6600 M−1 cm−1 (Reichmann et al., 1954). The DNA stock solutions of 5 mM were stored at 4°C and used within 4 days after their preparation. CuCl2 and Na2EDTA were used as the source of Cu2+ ion and EDTA, respectively.
To avoid the complications of solvent water molecules, a given mass of [Ru(bpy)2dmt]2+-based systems was immobilized by placing the mixed solution dropwise onto the ITO surface, followed by solvent evaporation/drying at room temperature. Thus, three kinds of ITO electrodes modified with [Ru(bpy)2dmt]2+-based interaction products were prepared: (i) 0.2 mM [Ru(bpy)2dmt]2+ or 0.2 mM [Ru(bpy)2dmt]2+/0.02 mM Cu2+ as a function of DNA concentration; (ii) 0.2 mM [Ru(bpy)2dmt]2+ or 0.2 mM [Ru(bpy)2dmt]2+/0.2 mM DNA as a function of Cu2+ concentration; (iii) 0.2 mM [Ru(bpy)2dmt]2+/0.02 mM Cu2+ or 0.2 mM [Ru(bpy)2dmt]2+/0.2 mM DNA/0.02 mM Cu2+ as a function of EDTA concentration.
The electrochemical measurements were investigated using cyclic voltammetry and differential pulse voltammetry techniques in a single-compartment cell of 0.4 mL. An ITO plate (sheet resistance: ≈20 Ω cm−2) was used as the working electrode. The ITO electrode with an area of 0.90 cm2 was exposed to electrolyte solutions and its electron conduction was formed by attaching a piece of thin copper belt sealed externally to the polytetrafluoroethylene belt. Effective area of the ITO electrode was 0.91 cm2, which was determined using a reversible system (0.1 mM K4[Fe(CN)6] in 1.0 M KCl) with a diffusion coefficient of 6.3 × 10⁻⁶ cm2 s−1 (Gao et al., 2006). Prior to use, the ITO electrode was ultrasonically cleaned in double-distilled water for 15 min. A platinum wire was used as an auxiliary electrode and the potential was measured with reference to an Ag-AgCl electrode with 50 mM NaCl. All experiments were performed at room temperature (26°C–28°C).
Results and Discussion
Photoluminescence of [Ru(bpy)2dmt]2+ tuned by DNA, Cu2+, and EDTA
The curve 1 of Figure 2 shows the emission spectrum of [Ru(bpy)2dmt]2+ immobilized on the ITO surface. Intense emission is observed at 608.5 nm, arising from the Ru(II)-to-ligand (d–π*) electron transition (Han et al., 2006). Upon the addition of DNA, as depicted in curves 2–6 of Figure 2, the emission peak of [Ru(bpy)2dmt]2+ shows a significant enhancement and a distinct blue shift. For example, at a C DNA/C Ru ratio of 2.5, a 2.5-fold enhancement in the luminescence intensity and a blue shift of 13 nm were shown. The results suggest a high affinity of [Ru(bpy)2dmt]2+ to DNA on the ITO surface.
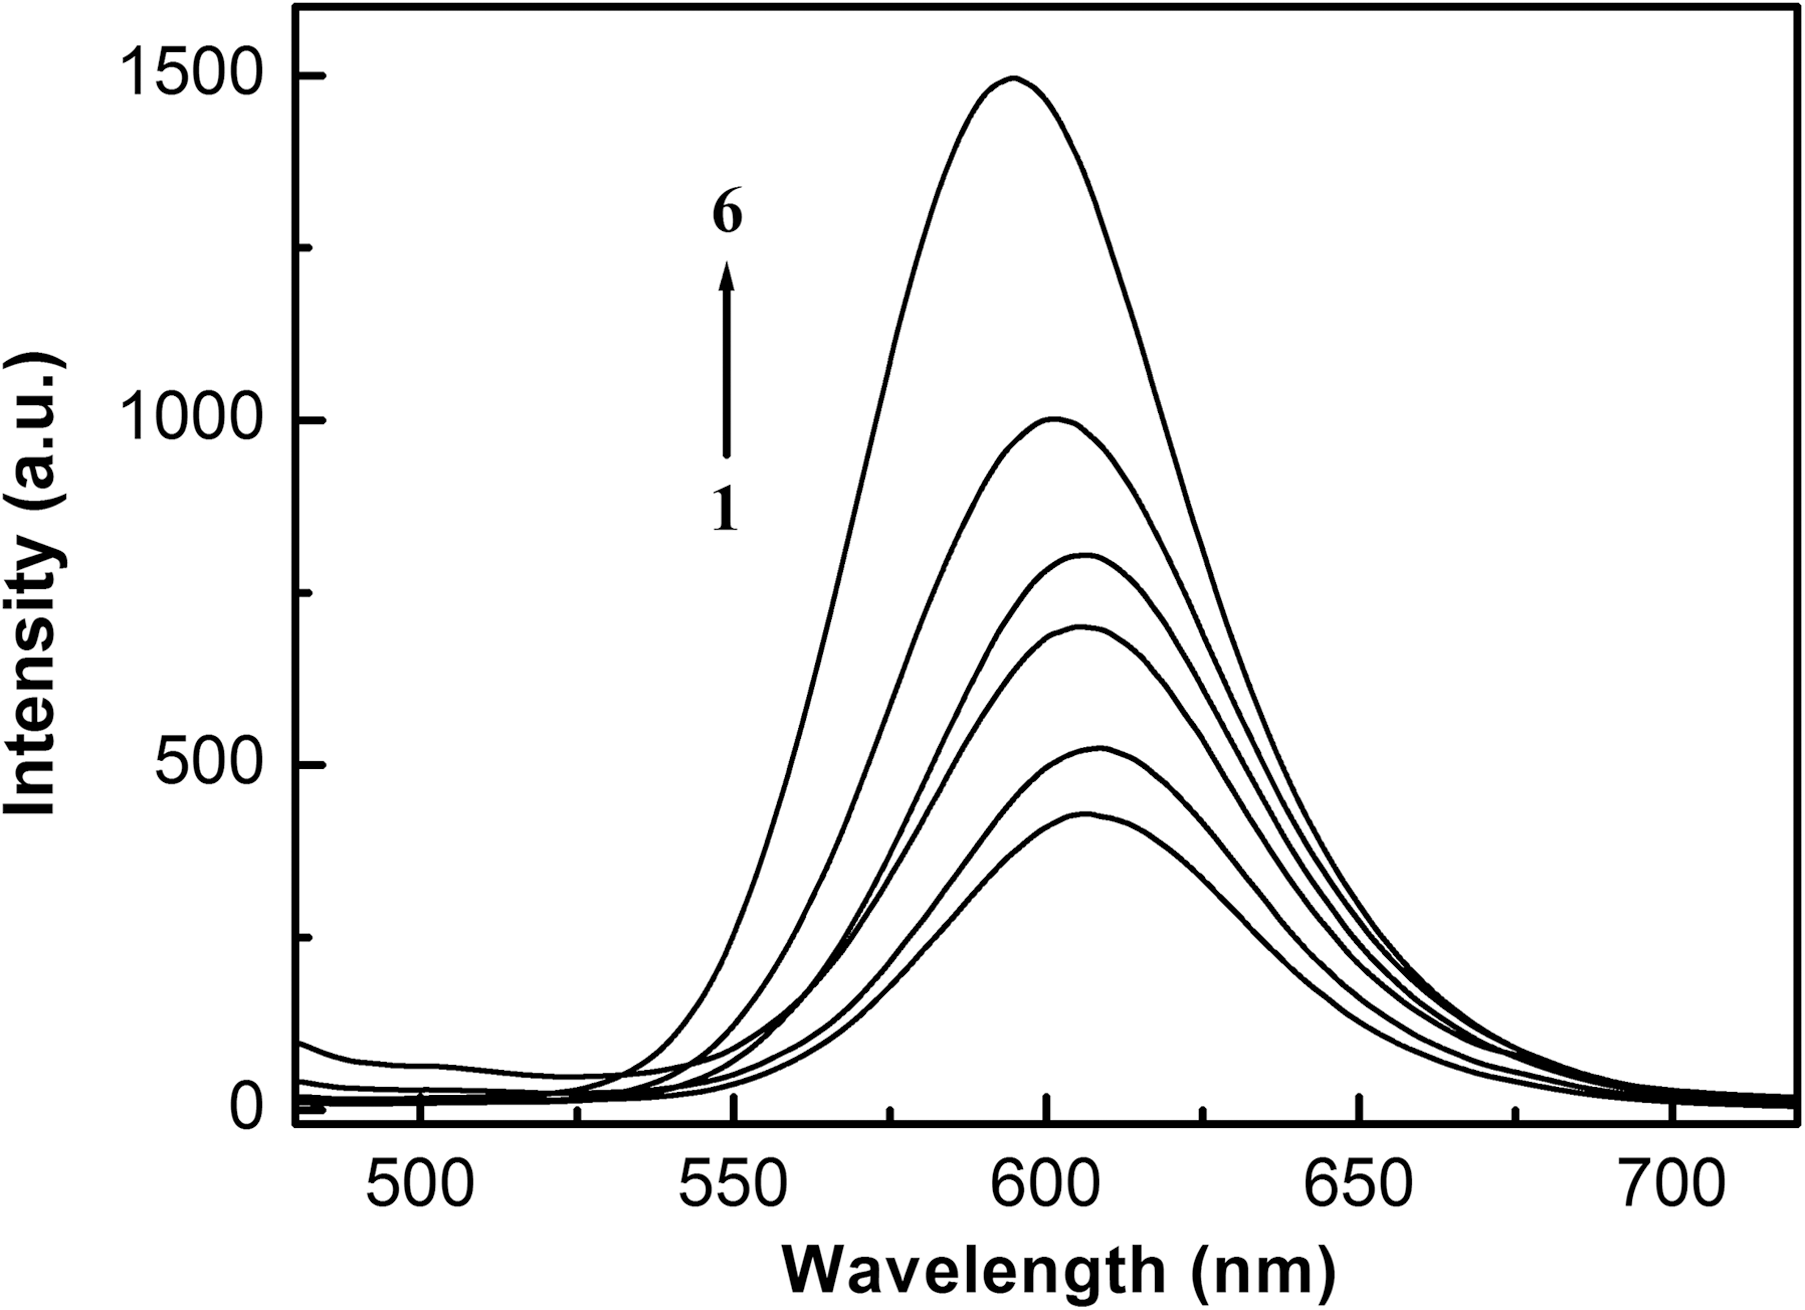
Emission spectra of 0.2 mM [Ru(bpy)2dmt]2+ on the ITO surface in the presence of different concentrations of DNA (mM): (1) 0, (2) 0.02, (3) 0.05, (4) 0.10, (5) 0.20, (6) 0.50.
The fluorescence image of [Ru(bpy)2dmt]2+ on the ITO surface in Figure 3a shows an orange-red appearance under excitation by blue light. The presence of DNA not only increases the luminescence intensity of [Ru(bpy)2dmt]2+ but also alters the morphology of [Ru(bpy)2dmt]2+, distinctly showing many long orange-red strings as shown in Figure 3b. The morphological change of [Ru(bpy)2dmt]2+ on ITO surfaces in the presence of DNA reveals the formation of DNA-bound [Ru(bpy)2dmt]2+ aggregates, accompanied by significant enhancement of photoluminescence intensity. These results agree with the observations from the emission spectra of [Ru(bpy)2dmt]2+ on ITO surfaces in the absence and presence of DNA in Figure 2.

Fluorescence microscopic images of 0.2 mM [Ru(bpy)2dmt]2+ and 0.2 mM [Ru(bpy)2dmt]2+/0.2 mM DNA on the ITO surface in the absence
When Cu2+ is introduced to the [Ru(bpy)2dmt]2+ system in the absence and presence of DNA, as shown in Figure 4, the presence of Cu2+ leads to a decrease in the luminescence of [Ru(bpy)2dmt]2+ and DNA-bound [Ru(bpy)2dmt]2+. This may be due to the formation of a di-metallic system by coordination of the phenazine unit to Cu2+, which serves as an electron acceptor, resulting in a decrease of luminescence. To further clarify the coordination of nitrogen atoms with lone pairs to Cu2+, we determined whether the luminescence quenched by Cu2+ could be recovered by chelating agents. As depicted in Figure 5, when EDTA is added to the [Ru(bpy)2dmt]2+/Cu2+ system, the luminescence of [Ru(bpy)2dmt]2+ is recovered with increasing concentration of EDTA. This implies that the added EDTA coordinates to Cu2+, and hence, the luminescence of [Ru(bpy)2dmt]2+ is recovered because of the separation of Cu2+ from the complex. The fluorescence microscopic images of [Ru(bpy)2dmt]2+ and DNA-bound [Ru(bpy)2dmt]2+ on the ITO surface with Cu2+ and EDTA further confirm these observations, as shown in Figure 3c–f.

Emission spectra of 0.2 mM [Ru(bpy)2dmt]2+

Emission spectra of 0.2 mM [Ru(bpy)2dmt]2+/0.02 mM Cu2+
The photoluminescence of [Ru(bpy)2dmt]2+ in the presence of Cu2+ is enhanced by DNA. As depicted in Figure 6a, with increasing DNA concentration, the quenched luminescence by Cu2+ shows a cumulative enhancement and a blue shift. At a C DNA/C Ru ratio of 2.5 in the presence 0.02 mM Cu2+, the luminescence of [Ru(bpy)2dmt]2+ was enhanced by 332% and the peak position exhibited a blue shift of 14 nm. These results provide additional evidence for the binding of [Ru(bpy)2dmt]2+ to DNA in the presence of Cu2+ and reveal that the DNA binding of [Ru(bpy)2dmt]2+ may take precedence to the coordination to Cu2+. The fluorescence microscopic images in Figure 6b also support this idea. When [Ru(bpy)2dmt]2+ intercalates into the major groove of DNA (Yun et al., 2003), an enhancement in the luminescence is shown. Then, an excess amount of Cu2+ quenchers coordinate to the phenazine unit from the minor groove of DNA. Consequently, as shown in Figure 1, the presence of Cu2+ quenches the luminescence of DNA-bound [Ru(bpy)2dmt]2+ on ITO surfaces.

Emission spectra
Electrochemistry of [Ru(bpy)2dmt]2+ tuned by DNA and Cu2+
The results above show that there may be an intercalative interaction of [Ru(bpy)2dmt]2+ with DNA, and Cu2+ associates with [Ru(bpy)2dmt]2+ or DNA-bound [Ru(bpy)2dmt]2+ immobilized on the ITO surface. The electrochemical method was used to explore the DNA-binding behavior of [Ru(bpy)2dmt]2+. Figure 7a shows the repetitive differential pulse voltammograms of [Ru(bpy)2dmt]2+ in the potential range from 0.2 to 1.3 V. In this figure, an anodic wave at 1.012 V is observed, labeled as wave I. As a similar anodic peak was reported for [Ru(bpy)3]2+ (Yan et al., 2009), wave I is assigned to the oxidation of soluble Ru(II) to Ru(III). After repetitive voltammetric scans of 21 cycles, the effects of scan rate on the electrochemical behavior of [Ru(bpy)2dmt]2+ on the ITO electrode were noted. At a 0.05 V s−1 scan rate, the cyclic voltammograms in Figure 8a show a pair of redox waves at an anodic peak potential (E p,a) of 1.076 V and a cathodic peak potential (E p,c) of 0.992 V, respectively, corresponding to a peak separation, ΔE p, of 84 mV. A formal potential, E°′, of 1.034 V is taken as the half of the sum of E p,a and E p,c. For all the scan rates, the current ratio of anodic peak to cathodic peak is close to 1 and the peak current is proportional to the square root of scan rate as depicted in the inset of Figure 8a. Such electrochemical behavior indicates that the electron transfer process between the Ru(II) species and ITO surface, which is responsible for redox peak I, is reversible on the cyclic voltammetric time scales. Peak I is, therefore, ascribed to diffusion-controlled wave.

Repetitive differential pulse voltammograms of 0.1 mM [Ru(bpy)2dmt]2+ in the absence

Cyclic voltammograms of 0.1 mM [Ru(bpy)2dmt]2+ on the ITO electrode in the absence
When repetitive voltammetric sweeping was carried out over the potential range in the absence of DNA, a new wave (II) is observed at 0.644 V in Figure 7a. The peak II current exhibits an enhancement with increasing voltammetric sweeping number. After repetitive voltammetric scans of 21 cycles, the voltammograms in Figure 8a show not only a scan rate-dependent ΔE p but also peak II currents that linearly increase with scan rate. These electrochemical characteristics indicate that the [Ru(bpy)2dmt]2+-based species with excellent redox activities are assembled on the ITO surface. The peak II potentials display a negative shift of about 0.368 V compared with that of peak I, suggesting that the dissolved Ru(II) reactant is oxidized to form a layer of Ru(III)-based product adsorbed strongly on the ITO electrode. Peak II is, therefore, assigned as surface-controlled waves (Li et al., 2007; Yao et al., 2008).
In the presence of DNA, as shown in Figures 7b and 8b, although the peak I response exhibits a decrease, it conforms to the electrochemical characteristics of diffusion-controlled waves. It is due to the strong interaction between [Ru(bpy)2dmt]2+ and DNA in buffer solution, leading to a decrease in the diffusion coefficient of Ru(II)-based reactants. In addition, the presence of DNA increases the peak II response controlled by surface electrochemical process. As depicted in Figure 1, the negatively charged DNA may act as the bridge molecule to promote the adsorption of positively charged [Ru(bpy)2dmt]3+/2+ on the ITO surface, leading to a cumulative increase of the peak II response in the subsequent voltammetric sweeping.
The repetitive differential pulse voltammograms after Cu2+ is introduced into the Ru(II)-based system in the absence or presence of DNA are shown in Figure 9. The peak II response shows a significant decrease in the presence of Cu2+, revealing that the vacant nitrogen atoms in [Ru(bpy)2dmt]2+ coordinate with Cu2+. However, introducing Cu2+ to the [Ru(bpy)2dmt]2+ system in the presence of DNA does not decrease the peak II response. On the contrary, an enhanced response of peak II is observed. This finding reveals that [Ru(bpy)2dmt]2+ associates with Cu2+ via the vacant nitrogen atoms in either the absence or presence of DNA. Combined with the changes in the luminescence of DNA-bound [Ru(bpy)2dmt]2+ by introducing Cu2+ ions, the DNA binding of [Ru(bpy)2dmt]2+ has precedence over the coordination to Cu2+ and an excess amount of Cu2+ coordinates to the phenazine unit, leading to an increase of the peak II response. All these results demonstrate that [Ru(bpy)2dmt]2+ binds to DNA through an intercalative mode and Cu2+ is regarded as an electron acceptor to quench the excited state luminescence of [Ru(bpy)2dmt]2+ or DNA-bound [Ru(bpy)2dmt]2+ immobilized on the ITO surface. To the best of our knowledge, this work presents the first example of identifying DNA-binding mode by a combination of photoluminescence measurement with electrochemical methods.

Repetitive differential pulse voltammograms of 0.1 mM [Ru(bpy)2dmt]2+
Conclusion
An effective method for identifying the DNA-binding mode of small molecules was successfully developed. It is based on the changes in the luminescent and electrochemical responses of [Ru(bpy)2dmt]2+ in both the absence and presence of DNA owing to the introduction of Cu2+ ion and EDTA. The result from a combination of photoluminescence measurement with electrochemical methods suggests that [Ru(bpy)2dmt]2+ binds to DNA via an intercalative mode. This study provides data for evaluating drug–DNA interactions.
Footnotes
Acknowledgment
This work was supported by a grant from the Specialized Research Fund for the Doctoral Program of Higher Education of China (No. 20094407120008).
Disclosure Statement
No competing financial interests exist.