




Abstract
Two cobalt (II) complexes containing a dipyrido[3,2-a:2′,3′-c]phenazine (dppz) base with the general formulation [Co(dppz)(dmp)2]Cl2, where dmp is 4,7-dimethyl-1,10-phenanthroline ligand (4,7-dmp) (
Introduction
Cobalt complexes have gained importance due to their application as potential hypoxia-activated prodrugs (Ware et al., 2000; Blower et al., 2001; Bonnitcha et al., 2006). Our studies focus on cobalt complexes, which have the same interesting characteristics and DNA cleaving properties as ruthenium complexes, but have not received as much attention as the ruthenium(II) systems (Arounaguiri and Maiya, 1996; Jin and Yang, 1997).
In this article, we describe synthesis of the mixed-ligand coordination complexes of cobalt (II) containing dppz (Fig. 1) and dimethyl-phenanthroline (4,7-dimethyl-1,10-phenanthroline [4,7-dmp] and 2,9-dmp), then extend our studies to complex-DNA binding using a variety of physical methods. The effects of the positions of methyl substitutions in phenanthroline coligands are investigated. The DNA interaction mechanism of this type of cobalt (II) mixed-ligand complexes is not well-studied. The results should be valuable in understanding the mode of the binding of the complexes to DNA and in laying the foundation for rational design of DNA structure probes and antitumor drugs.

Schematic representation and 1H NMR labeling of 1,10-phenanthroline-5,6-dione, dppz, [Co(4,7-dmp)2(dppz)]Cl2 (
Materials and Methods
Materials
2,9-dmp, o-phenylenediamine, 4,7-dmp, dichloromethane, nitric acid, 1,10-phenanthroline (Phen), absolute ethanol, cobalt (II) chloride, diethyl ether, dichloromethane, butanol, methanol, aceton, and Tris-HCl were purchased from Merck. Doubly distilled deionized water was used throughout. Highly polymerized calf thymus DNA (CT-DNA) and Tris-HCl buffer were purchased from Sigma.
Experiments were carried out in Tris buffer at pH 7.2. Solutions of CT-DNA gave an UV absorbance ratio (260 over 280 nm) of >1.8, indicating that the DNA was sufficiently free of protein. Stock solution of CT-DNA was prepared by dissolving ∼1–2 mg of CT-DNA fibers in 2 mL Tris HCl (10 mM), shaken slowly, and stored for 24 h at 4°C. The concentration of DNA solution was expressed in monomer units, which was determined by spectrophotometry at 260 nm using an extinction coefficient (ɛp) of 6600 M−1 cm−1 value, and the solution was used within 4 days.
Synthesis of cobalt (II) complexes
Synthesis of 1, 10-phenanthroline-5, 6-dione
A mixture of 1,10-phenanthroline (1.00 g, 5.04 mmol), potassium bromide (5.94 g, 50.0 mmol), concentrated sulfuric acid (20 mL), and concentrated nitric acid(10 mL) was stirred for 2 h at 80°C–85°C and cooled to room temperature. The solution was poured into 400 mL of water, neutralized with sodium hydroxide, and then extracted with dichloromethane. Removal of dichloromethane gave 1,10-phenanthroline-5,6-dione as yellow needles. 1H NMR (ppm, CDCl3): 9.12 (1H), 8.51 (3H), 7.55 (2H); UV-Vis:λmax: 304, 260, 232; IR data (Cm−1): 1684, 1559, 1458; Yield: 0.91 g (86%).
Synthesis of dppz
A mixture of phen-5,6-dione (0.50 g, 2.40 mmol) and o-phenylenediamine (0.50 g, 4.60 mmol) was refluxed in ethanol for 1 h. Brown solid precipitated after cooling to room temperature was collected by filtration and successively washed with ethanol and acetone. 1H NMR (ppm, CDCl3): 7.8(2H), 7.95(3H), 8.36(5H), 9.27(4H), 9.65(1H); Yield: 1.32 g (69%).
Synthesis of [Co(4,7-dmp)2(dppz)]Cl2. 2H2O (1)
A mixture of CoCl2 · 6H2O (238 mg, 1 mmol) and 4,7-dmp (416 mg, 2 mmol) was dissolved in 50 mL 1-butanol and stirred at reflux temperature for 1 h. The brown precipitate, [Co(4,7-dmp)2Cl2], was collected and washed with 1-butanol and ether. This product was dissolved in water-methanol (20 mL, 1:2 V/V) and dppz (282 mg, 1 mmol) was added. The solution was stirred under reflux. After 3 h, the reaction mixture was cooled to room temperature and filtered. The precipitate was washed with ice water and methanol then dried under vacuum. Yield: 65%. 1H NMR (ppm, DMSO): 11.19 (1 H); 10.07(4H); 9.66(5H); 8.89 (3H); 8.6(2H); 2.71 (Me groups) (Fig. 1). Analysis calculated (Anal. Calc.) for C46H34Cl2N8Co · 2H2O: C, 63.93; H, 3.97; N, 13.02; found: C, 64.6; H, 4.3; N, 13.7%. FT-IR data (cm−1): 1530 (ring), 1515 (C = C), 1429 (CCH), 847 (Phen), 723 (Phen), 1342 (Me), 411 (Co-N); Molar conductance, (Ω−1cm2mol−1) in DMF: 148 (1:2 electrolyte). (Geay, 1971); μeff = 2.05 BM.
Synthesis of [Co(2,9-dmp)2(dppz)]Cl2 · 2H2O (2)
This complex was obtained by a similar procedure as
Instrumentation
1H NMR spectra were recorded using a Bruker Avance DPX200 MHz (4.7 Tesla) spectrometer with CDCl3 as the solvent. The elemental analysis was performed using a Heraeus CHN elemental analyzer. The molar conductance of complexes was measured in DMF at room temperature on an ELICO (CM 82T) conductivity bridge. Magnetic susceptibility measurements were made at room temperature using AGFM and VSM methods (Meghnatis Kavir Kashan Co.).Absorbance spectra were recorded using an HP spectrophotometer (Agilent 8453) equipped with a thermostated bath (Huber polysat cc1). Absorption titration experiments were conducted by keeping the concentration of complexes constant (5 × 10⁻⁵ M) while varying the DNA concentration from 0 to 1 × 10⁻⁴ M (r i = [DNA]/[complex] = 0.0, 0.1, 0.2, 0.4, 0.6, 0.8, 1. Absorbance values were recorded after each successive addition of DNA solution, followed by an equilibration period.
All fluorescence measurements were carried out with a JASCO spectrofluorometer (FP6200) by keeping the concentration of complex constant (5 × 10⁻⁵ M) while varying the DNA concentration from 0 to 40.5 × 10⁻⁵ M (r i = 0.0, 0.5, 1, 2, 3, 4) ri = [DNA]/[complex] at three different temperatures (279, 293, 310 K).Circular dichroism (CD) measurements were recorded on a JASCO (J-810) spectropolarimeter by keeping the concentration of DNA constant (5 × 10⁻⁵ M) while varying the complex concentration from 0 to 1 × 10⁻⁵ M (r i = [complex]/[DNA] = 0, 0.02, 0.05, 0.1, 0.15, 0.2).
Viscosity measurements were made using a viscosimeter (SCHOT AVS 450) that was maintained at 25°C ± 0.5°C using a constant temperature bath. The DNA concentration was fixed at 5 × 10⁻⁵ M, and flow time was measured with a digital stopwatch. The mean values of three replicated measurements were used to evaluate the viscosity η of the samples. The values for relative specific viscosity (η/ηo)1/3, where ηo and η are the specific viscosity contributions of DNA in the absence (ηo) and in the presence of the Co(II) complexes (η), were plotted against ri (ri = [complex]/[DNA]) (Bloomfield et al., 1974).
Results
Synthesis and characterization
The ligand dppz was prepared by condensation of 1,10-phenanthroline-5, 6-dione, and o-phenylenediamine in ethanol. dppz is soluble in ethanol, and its UV-Vis spectrum is shown in Figure 2. It is worth noting that the UV-Vis spectrum of the ligand shows characteristic peaks at 249 and 270 nm, a shoulder at 290 nm, and a multiple in the range 325–400 nm, the latter interpreted as a π-π* transition (Terenzi et al., 2009). The electronic absorption spectra of [Co(4,7-dmp)2(dppz)]2+ and [Co(2,9-dmp)2(dppz)]2+ are well characterized by two intense ligand centered transitions in the UV region. The bands at 325–400 nm are characteristic of the interligand (IL) π-π* transition of the dppz ligand (Fig. 2). The low energy bands at 447 nm are assigned as Co(dπ) dppz (π*) metal-to-ligand charge transfer transition.
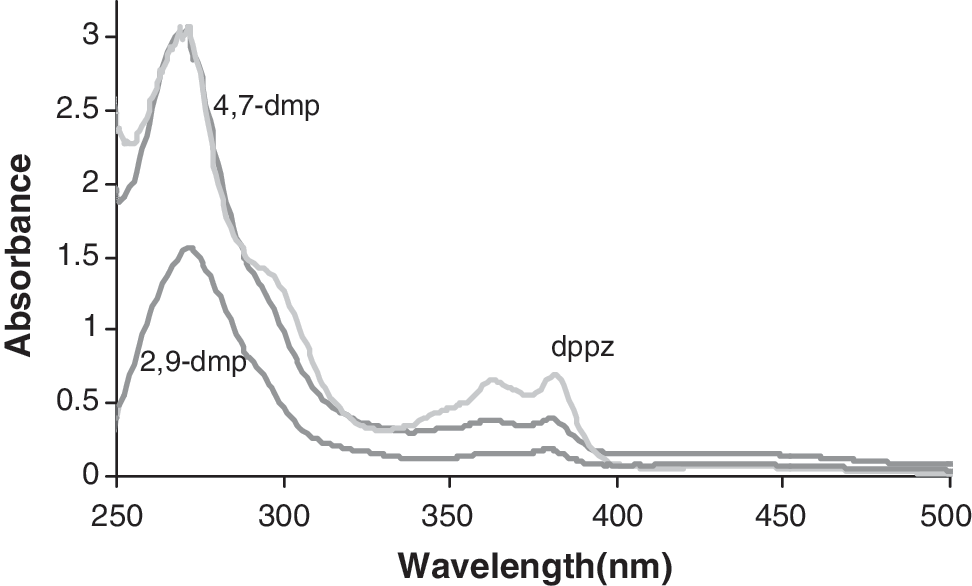
Electronic spectra of dppz ligand, [Co(4,7-dmp)2(dppz)]Cl2 (
The FT-IR spectra of two complexes show bands in the 411 cm−1 ascribable to the Co-N stretching.
The observed magnetic moments of Co(II) complexes are 2.05 and 1.95 for complex 1 and 2, respectively. Magnetic susceptibility measurements of the titled complexes are generally diagnostic of the coordination geometry about the metal ions and reveal that the complexes have low spin (s = 1/2) systems, because in low spin octahedral cobalt (II) complexes, the magnetic moments are close to 1.8–2.0 BM (Faus et al., 1993; Constable et al., 2003).
In the 1H NMR spectra of the two cobalt (II) complexes, the peaks due to the protons of 4,7-dmp, 2,9-dmp, and dppz were shifted in comparison with the corresponding free ligands, suggesting complexation. Molar conductance (Ω−1 cm2mol−1) in DMF showed 1:2 electrolytes (Geay, 1971).
Multispectroscopic methods
The absorption spectra of the complexes in the presence of increasing amounts of CT-DNA (R = [DNA]/[complex]) were measured (Fig. 3). As the DNA concentration is increased, pronounced hypochromism is observed for both complexes. An isobestic point at 385 nm is observed for complex 2. The hypochromism (32.7%) and a red shift (4 nm) observed for the 378 nm band in complex 1 and the hypochromism (23.6%) and a red shift (5 nm) observed for the 378 nm band in complex 2 typical for a stacking interaction of the dppz ligand with the DNA base pairs. To compare the binding strengths of the complexes quantitatively, the intrinsic binding constant kb was determined by using the equation 1 (Kashanian et al., 2007)
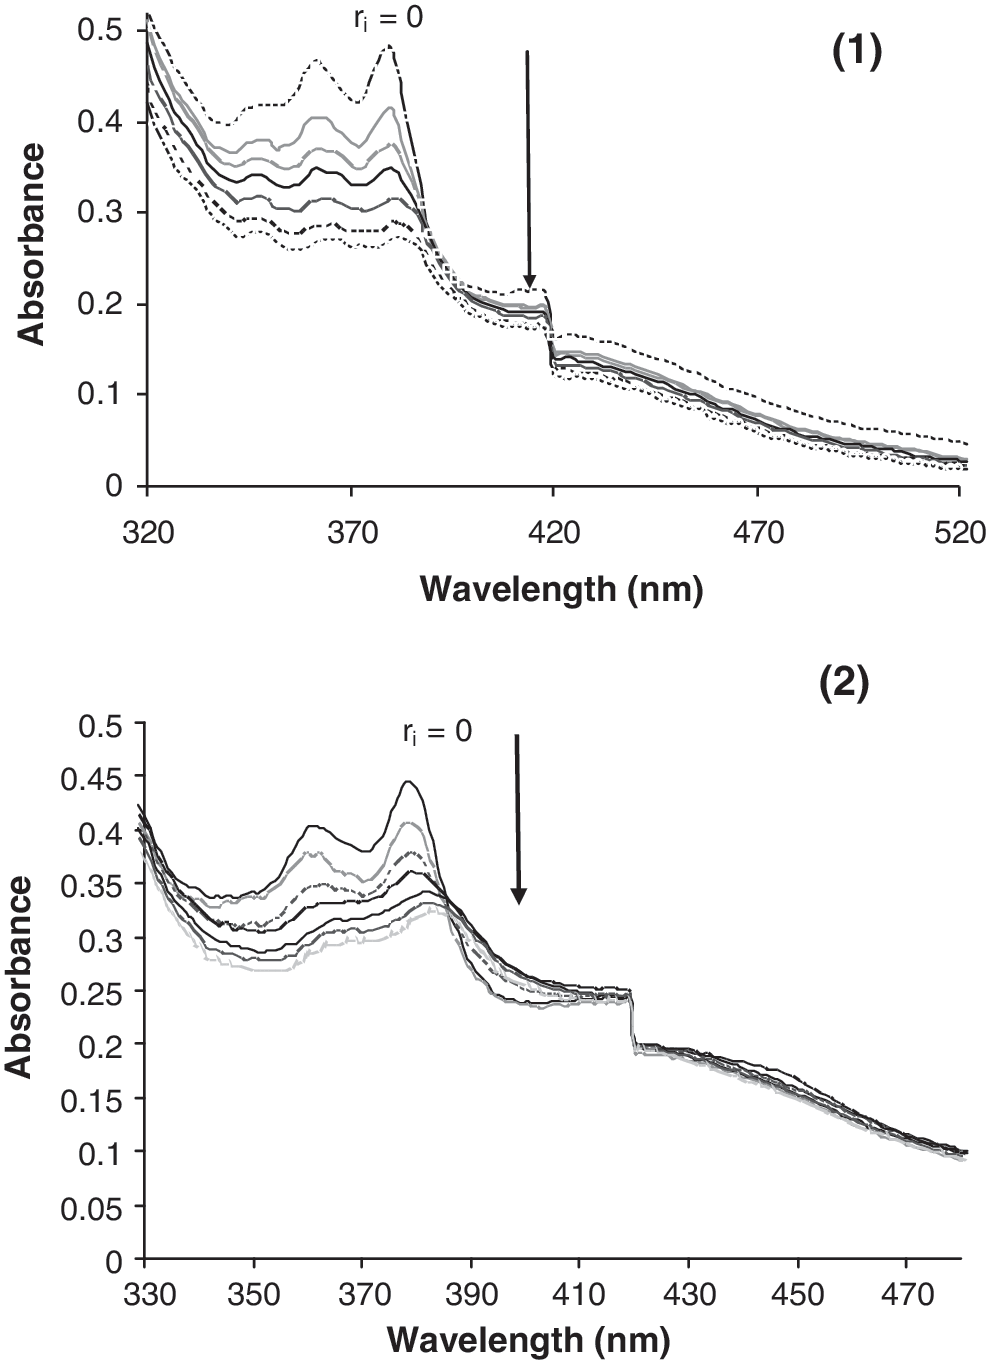
Electronic absorption spectra for the titration of 5.0 × 10⁻⁵ M of complexes [Co(4,7-dmp)2(dppz)]Cl2 (
where ɛ
a is the extinction coefficient observed for the metal-to-ligand charge transfer absorption band at a given DNA concentration, ɛ
f is the extinction coefficient of the complex free in solution, ɛ
b the extinction coefficient of the complex when fully bound to DNA (it is assumed when further addition of DNA does not change the absorbance, all complex is bound and ɛ
b can be calculated from Beer's Law), Kb the equilibrium binding constant, Ct the total complex concentration in nucleotide, and s the binding site size. The plots of (ɛa–ɛf)/(ɛb–ɛf) versus [DNA] have been shown in Figure 4. (Kb = 4.8 ± 0.1 × 10⁵ M−1 (s = 1.04) for complex
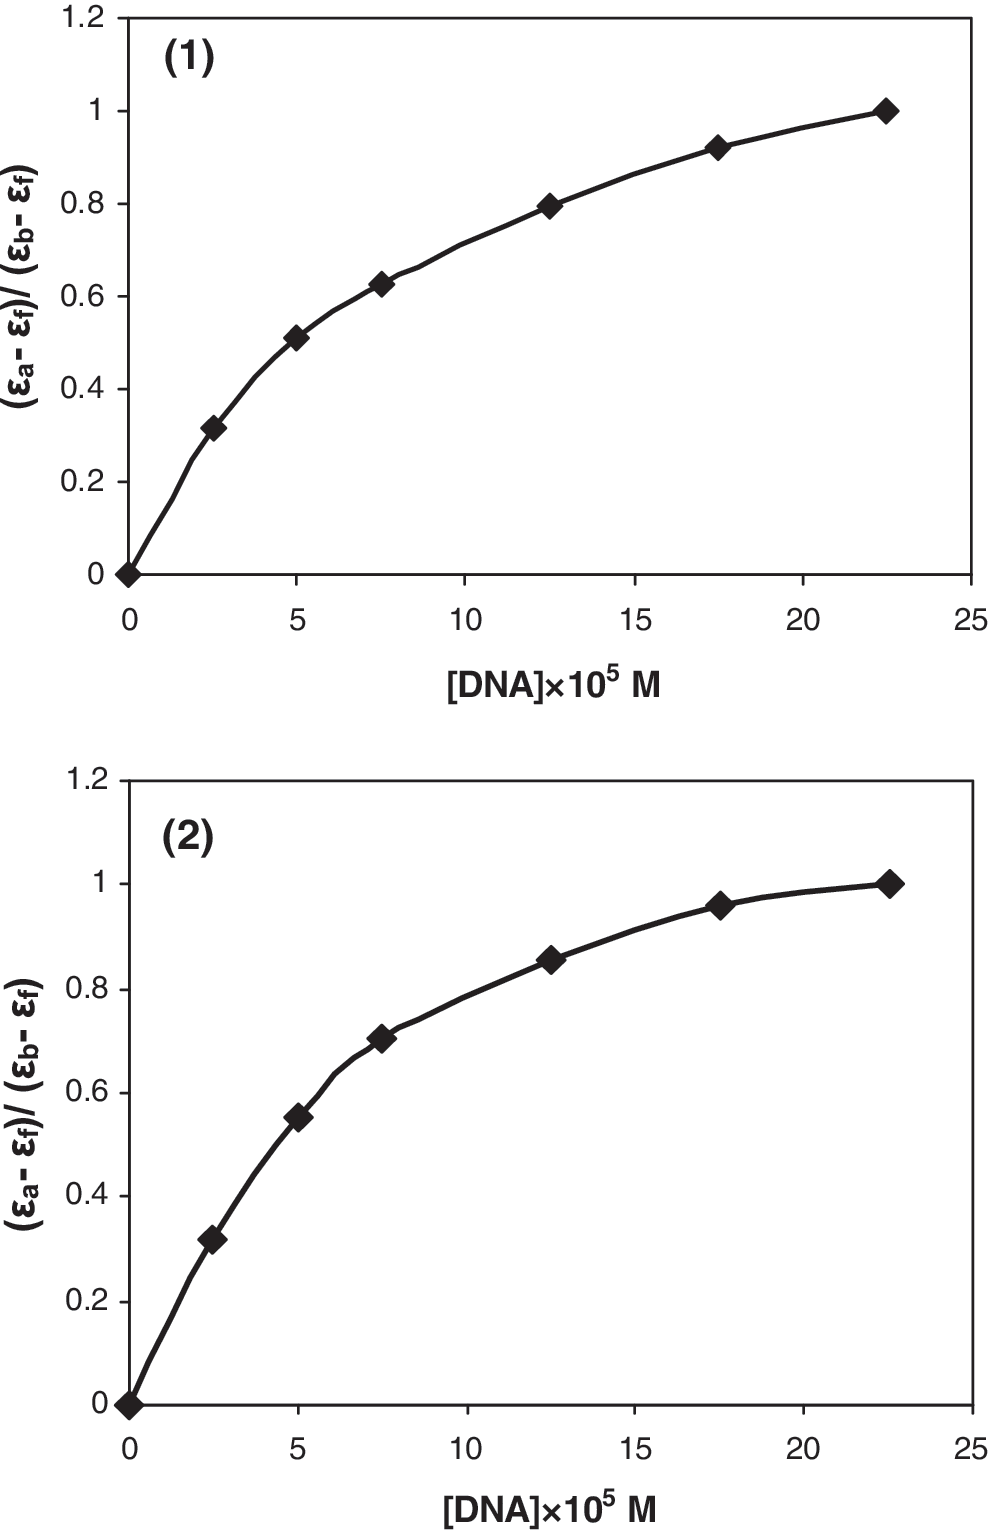
Plots of (ɛa-ɛf)/(ɛb-ɛf) versus [DNA] for the titration of DNA with the complexes [Co(4,7-dmp)2(dppz)]Cl2 (
For both complexes,
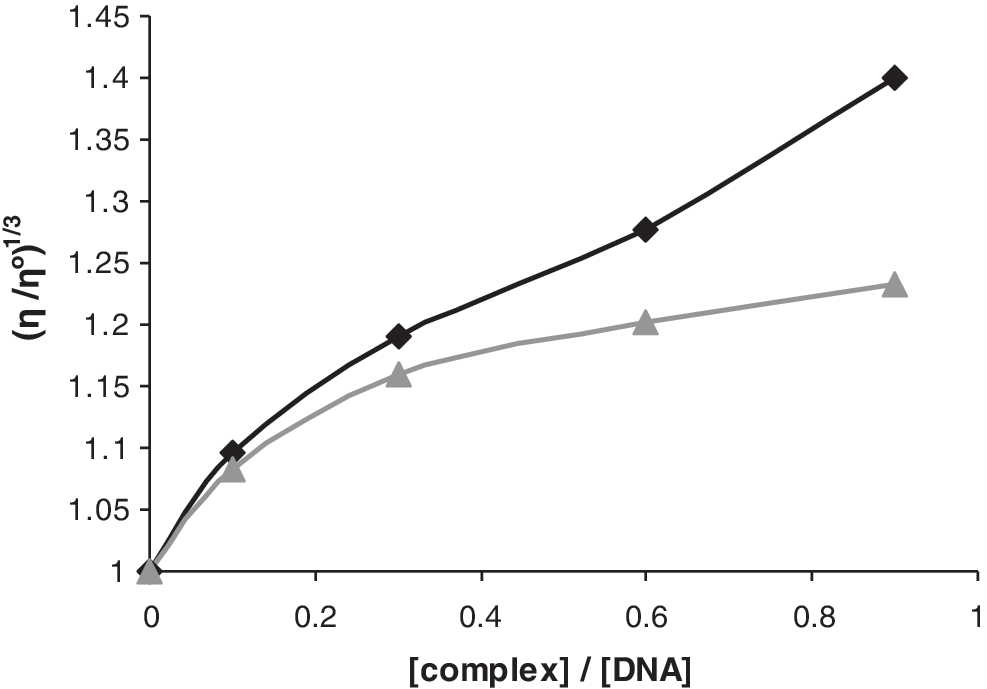
Effect of increasing amounts of [Co(4,7-dmp)2(dppz)]Cl2 (
The two Co(II) complexes can emit luminescence in Tris-HCl buffer with a maximum wavelength of about 558 nm, excited at about 450 nm. The results of emission titration for the two complexes with CT-DNA are shown in Figure 6. On the addition of CT-DNA, the emission intensities at about 558 nm of two complexes increase by about 1.5 and 1.26 times for complexes [Co(4,7-dmp)2(dppz)] and [Co(2,9-dmp)2(dppz)], respectively. The dynamic enhancement constants of cobalt complexes in different temperatures were calculated (Table 1). Stern-Volmer plots are shown in Fig. 7. The linear equations for log (F-F0)/F versus log [DNA] at different temperature values are shown in Table 2.
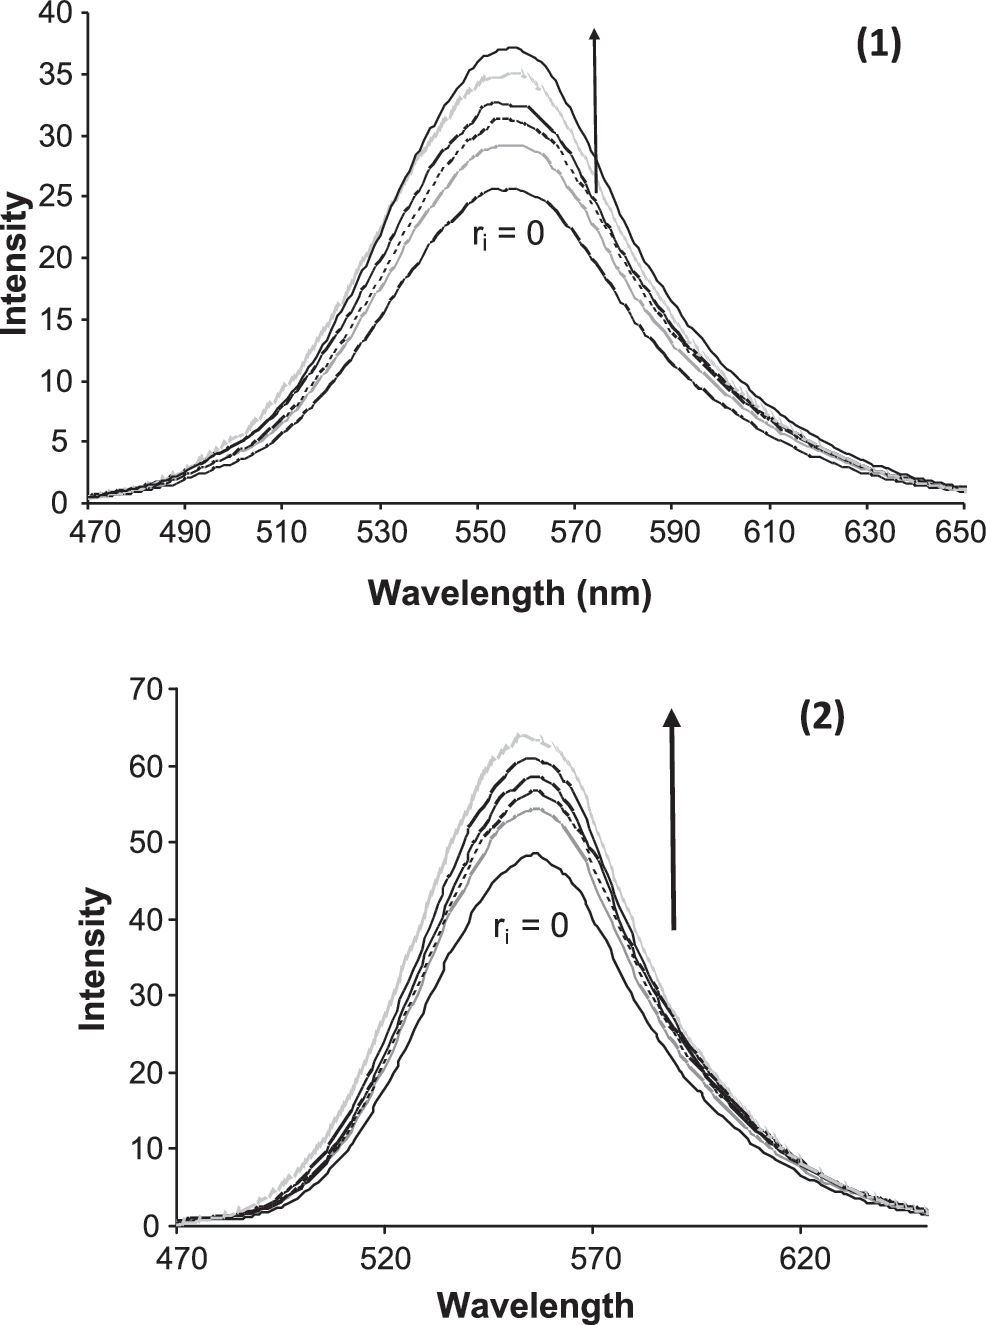
Emission spectra of the complexes [Co(4,7-dmp)2(dppz)]Cl2 (

Stern–Volmer plots for the observed fluorescence enhancement of complexes [Co(4,7-dmp)2(dppz)]Cl2 (
In Figure 8, the changes in the CD spectra of CT-DNA in the presence of increasing concentrations of the two complexes are shown. After addition of incremental amounts of the complexes, the intensity of positive bands diminish and new negative bands at about 292 nm and positive bands at about 260 nm develop for complexes
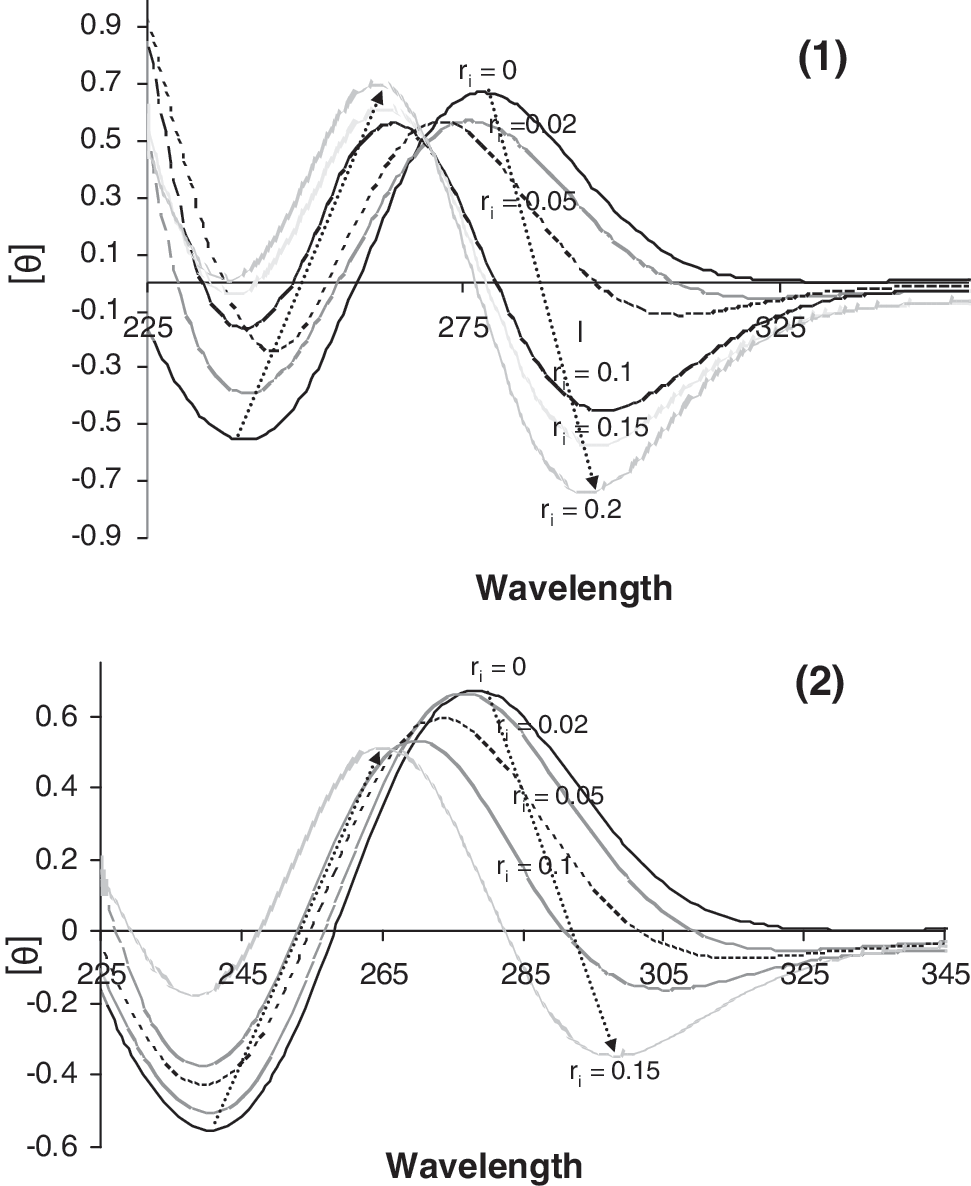
Circular dichroism spectra of DNA (5.0 × 10⁻⁵) in 10 mM Tris–HCl buffer, in the presence of increasing amounts of [Co(4,7-dmp)2(dppz)]Cl2 (
Discussion
Electronic absorption spectral studies
The absorption spectra are the most common means to examine the interaction between metal complex and DNA. In general, the absorption spectra of metal complexes bound to DNA through intercalation exhibit significant hypochromism and red shift due to the strong π-π stacking interaction between the aromatic chromophore ligand, metal complex and base pairs of DNA. The absorption spectra of the complexes
The results in Figure 3 are consistent with preferential intercalation of the dppz ligand into the base pairs of the DNA helix when the dppz ligand of these complexes intercalate into the base pairs of DNA; its π* orbital is coupled with the π orbital of the DNA base pairs to give rise to the decrease in the π-π* transition energies. As a result, the λmax of the IL transition of the dppz ligand is shifted to the longer wavelength (red shift). The extent of hypochromicity in complex
The intrinsic binding constants (Kb) are 4.8 ± 0.1 × 10⁵ M−1 (s = 1.14) for complex
Viscosity studies
Viscosity measurements on solutions of CT-DNA incubated with the cobalt (II) complexes were made to explore DNA binding mode. The results in Figure 5 indicate that the increase in relative viscosity, expected to correlate with the compounds' DNA-intercalating propensities, followed the order complex
Fluorescence spectroscopic studies
The two Co(II) complexes can emit luminescence in Tris-HCl buffer with a maximum wavelength of about 558 nm, excited at about 450 nm. The results of emission titration for the two complexes with CT-DNA are shown in Figure 6. Afteraddition of CT-DNA, the emission intensities at about 558 nm of two complexes increase by about 1.5 and 1.26 times for complexes [Co(4,7-dmp)2(dppz)] and [Co(2,9-dmp)2(dppz)], respectively. This implies that these complexes can interact with CT-DNA and be protected by DNA efficiently, as the hydrophobic environment inside the DNA helix reduces the accessibility of solvent water molecules to the complexes and the complexes' mobilities are restricted at the binding sites, leading to decrease of the vibrational modes of relaxation.(Liu et al., 2009; Sun et al., 2010).
Analogous to the quenching constant in a quenching process, an enhancement constant may be obtained from the following equilibrium:
where F, E, and F–E are the fluorophore, enhancer, and Co(II) complex, respectively. Analogous to a static quenching process (Li et al., 2008) for fluorescence enhancement, the dependence of the intensity on enhancer concentration can be easily derived from the association constant for complex formation (Li et al., 2008). Equation 3 gives the enhancement constant.
If a dynamic process is part of the enhancing mechanism, the above equation can be written as follows (Shahabadi and Fatahi, 2010):
where KD is the dynamic enhancement constant (analogous to a dynamic quenching constant), KB is the bimolecular enhancement constant (analogous to a bimolecular quenching constant), and τ0 is the lifetime of the fluorophore in the absence of an enhancer. The dynamic enhancement constants of cobalt complexes at different temperatures were calculated using Equation 4 (Fig. 7 and Table 1). Since fluorescence lifetimes are typically near 10−8 s, the bimolecular enhancement constant (KB) was calculated from KD = KBτ0 (Table 1).
If the bimolecular quenching and enhancement constants are equivalent, the latter constant (KB) would be greater than the largest possible value (1 × 10¹⁰ M−1 s−1) (Li et al., 2008) in aqueous solutions. Thus, the fluorescence enhancement is not initiated by a dynamic process, but is instead due to a static process involving ground state complex formation. The possibility for ground state complex formation is supported by observed changes in the absorption spectra during the titration of the Co(II) complex with CT-DNA, as shown in Figure 3. Since dynamic quenching only affects the excited state, no changes are expected in the ground state. Alternatively, a static process only involves complex formation in the ground state (Li et al., 2008).
Equilibrium binding titration
Fluorescence titration data were used to determine the binding constant (Kf) and binding stoichiometry (n) for the complex formed between the Co(II) complex and CT-DNA. Figure 6 shows the fluorescence spectra of Co(II) complexes in the presence of different concentrations of CT-DNA. The data show that the fluorescence intensity at 454 nm increases in the presence of CT-DNA. This change in fluorescence intensity at 454 nm was used to estimate Kf and n for the binding of Co(II) complexes to CT-DNA from the following equation (Song et al., 2005):
Here, F0 and F are the fluorescence intensities of the fluorophore in the absence and presence of different concentrations of CT-DNA, respectively. In the case of enhanced emission intensity, that is, F0 < F, Equation 5 becomes
The linear equations for log (F-F0)/F versus log [DNA] at different temperature values are shown in Table 2. The values of Kf clearly underscore the remarkably high affinity of the Co(II) complexes for DNA.
The size of the binding site makes it possible to distinguish between intercalating and nonintercalating binding agents (Krishna et al., 1998). Molecules with large binding site sizes are indicative of nonintercalative binding mechanisms, which require correspondingly lower concentrations to saturate the sites. Wilson and coworkers (1989) reported that the binding of 4′,6-diamino-2-phenylindole to polyGC conforms to an intercalative mechanism following the neighbor exclusion model with Kf = 1.2 × 10⁵ M−1 and n = 2 (approximately). Our results appear to follow a similar trend. Therefore, the calculated binding site size is again indicative of intercalative binding of Co(II) complexes to CT-DNA.
Circular dichroic spectral studies
Circular dichroic spectra provide information about the chirality of spectroscopically active species in solution. They are particularly sensitive to the degenerate/nondegenerate exciton coupling expected to arise when chromophores closely located in space strongly interact (Holmlin et al., 1996). Thus, rac-metal complexes give a zero CD but show induced circular dichroic (ICD) signals on enantiopreferential binding to DNA providing further confirmation of their DNA binding (Hirot et al., 1990; Delaney et al., 2002). Thus, the CD spectral technique has been used to study the enantiopreferential DNA binding of rac-metal complexes. In addition, the technique is useful in diagnosing changes in DNA morphology during drug-DNA interaction, as CD signals are quite sensitive to the mode of DNA interactions of small molecules (Maheswari et al., 2006b).
CT-DNA in the B conformation shows two conservative CD bands, a positive band at 276 nm (due to base stacking) and a negative band at 240 nm (due to helicity) in the UV region. The changes in the CD spectra of CT-DNA in the presence of increasing concentrations of the two complexes are depicted in Figure 8. This is typical of exciton coupled ICD arising due to enantiopreferential binding of the Δ-enantiomer of the rac-complex and/or ligand–ligand interactions among DNA bound/unbound complexes. When the concentration of the complex is systematically increased from 1/R = 0 to 1 (=[Ru complex]/[DNA]), keeping the DNA concentration constant, both the positive and negative components of the ICD increase in intensity. The transitions complete at r
i values of 0.2 and 0.15 for complex
Conclusion
Two novel Co(II) complexes [Co(4,7-dmp)2(dppz)]Cl2 (
Footnotes
Acknowledgments
Financial support from Razi University Research center is gratefully acknowledged.
Disclosure Statement
No competing financial interests exist.