




Abstract
The interaction of quinacrine and 9-amino acridine with right-handed B-form, left-handed Z-form, and left-handed protonated (HL)-form structures of polydG-me5dC was investigated by circular dichroism and absorption spectral analysis. Both the compounds bind strongly to the B-form structure and convert the Z-form and HL-form back to the bound right-handed form. Circular dichroic data revealed that the conformation at the binding site is right-handed even though adjacent regions of the polynucleotide may have left-handed conformation. The rate and extent of B-form–to–Z-form transition were decreased in the presence of these compounds. Scatchard analysis revealed that both quinacrine and 9-amino acridine bind strongly to the polynucleotide in the B-form in a noncooperative manner, in sharp contrast to the highly cooperative binding to the Z-form and HL-form. Results indicated that the cooperative binding of these drugs with the Z-form and the HL-forms was associated with a sequential conversion of the polynucleotide from a left-handed to a bound right-handed conformation. Experimental data enabled the calculation of the number of base pairs of Z-form (7–8 with quinacrine and 9-amino acridine) and HL-form (4 and 25, respectively, with quinacrine and 9-amino acridine) that adopt a right-handed conformation for each bound ligand. As these compounds are known to bind preferentially to alternating guanine–cytosine sequences, which are capable of easily undergoing the B-to-Z or B-to-HL transition, these effects may be important in understanding their biological activities.
Introduction
Apart from B-form and Z-form, other forms of DNA also attracted a good deal of attention (Mirkin and Frank-Kamenetskii, 1994). Generally, DNA undergoes denaturation under extreme pH conditions (below pH = 3.0), but at moderate pH conditions where a partial protonation occurs, DNA may exhibit novel conformations. From extensive absorption spectroscopic and CD studies a new model with formation of Hoogsteen base pairs with a change in handedness of the helix at low pH has been advanced (Suresh Kumar and Maiti, 1994; Suresh Kumar et al., 2003) and the structure was referred as left-handed Hoogsteen paired HL-form. This model of left-handed structure with Hoogsteen base pairing was also confirmed by the FTIR studies of Tajmir-Raihi et al. (1995). Subsequently, Otto and coworkers confirmed the model involving the change in handedness accompanied by formation of Hoogsteen base pair in protonated structures from Raman spectroscopy, absorption spectroscopy, and CD studies (Segers-Nolten et al., 1997). Many of these conformers may have biological importance.
Interaction of small molecules (drugs) have been studied for several decades (Waring, 1981; Chaires, 1998; Maiti and Suresh Kumar, 2007a, 2007b) to design principles for targeting specific DNA sequences to control gene expression (Dervan, 2001). The mode of action of many of these small molecules depends on their binding to DNA for clinical use in the treatment of cancer, genetic disorders, and viral diseases (Denny, 1989; Hurley, 2001, 2002; Palchaudhuri and Hergenrother, 2007). Most of the planar, aromatic molecules bind to DNA essentially by intercalation, that is, by inserting themselves between the base pair, whereas crescent-shaped molecules bind to the floor of the minor groove through H-bonding.
Acridines are important intercalating molecules with mutagenic, antitumoral, and antibacterial properties (Albert, 1966; Ciak and Hahn, 1967; Gorbachev et al., 2007). Quinacrine and 9-amino acridine (Fig. 1) are two planner aromatic molecules that can intercalate with DNA easily. Quinacrine is well known for its antimalarial properties, which may be related to its interaction with DNA (Hossain and Suresh Kumar, 2009). Although the mode of action of quinacrine is not well known, some tumors selectively uptake quinacrine (Rynes, 1998). Quinacrine can act as a radio sensitizer (Koranda, 1981). Clinically, it is used in the treatment of giardisis, a protozoal infection of the intestinal track, and certain types of lupus erythematosus, an inflammatory disease that affects the joints, tendons, and other connective tissues and organs (Gardner and Hill, 2001). To better understand the mode of action of quinacrine, extensive work has been performed and demonstrated that quinacrine intercalates with DNA (Kessel, 1996; Hossain et al., 2008; Hossain and Suresh Kumar, 2009).
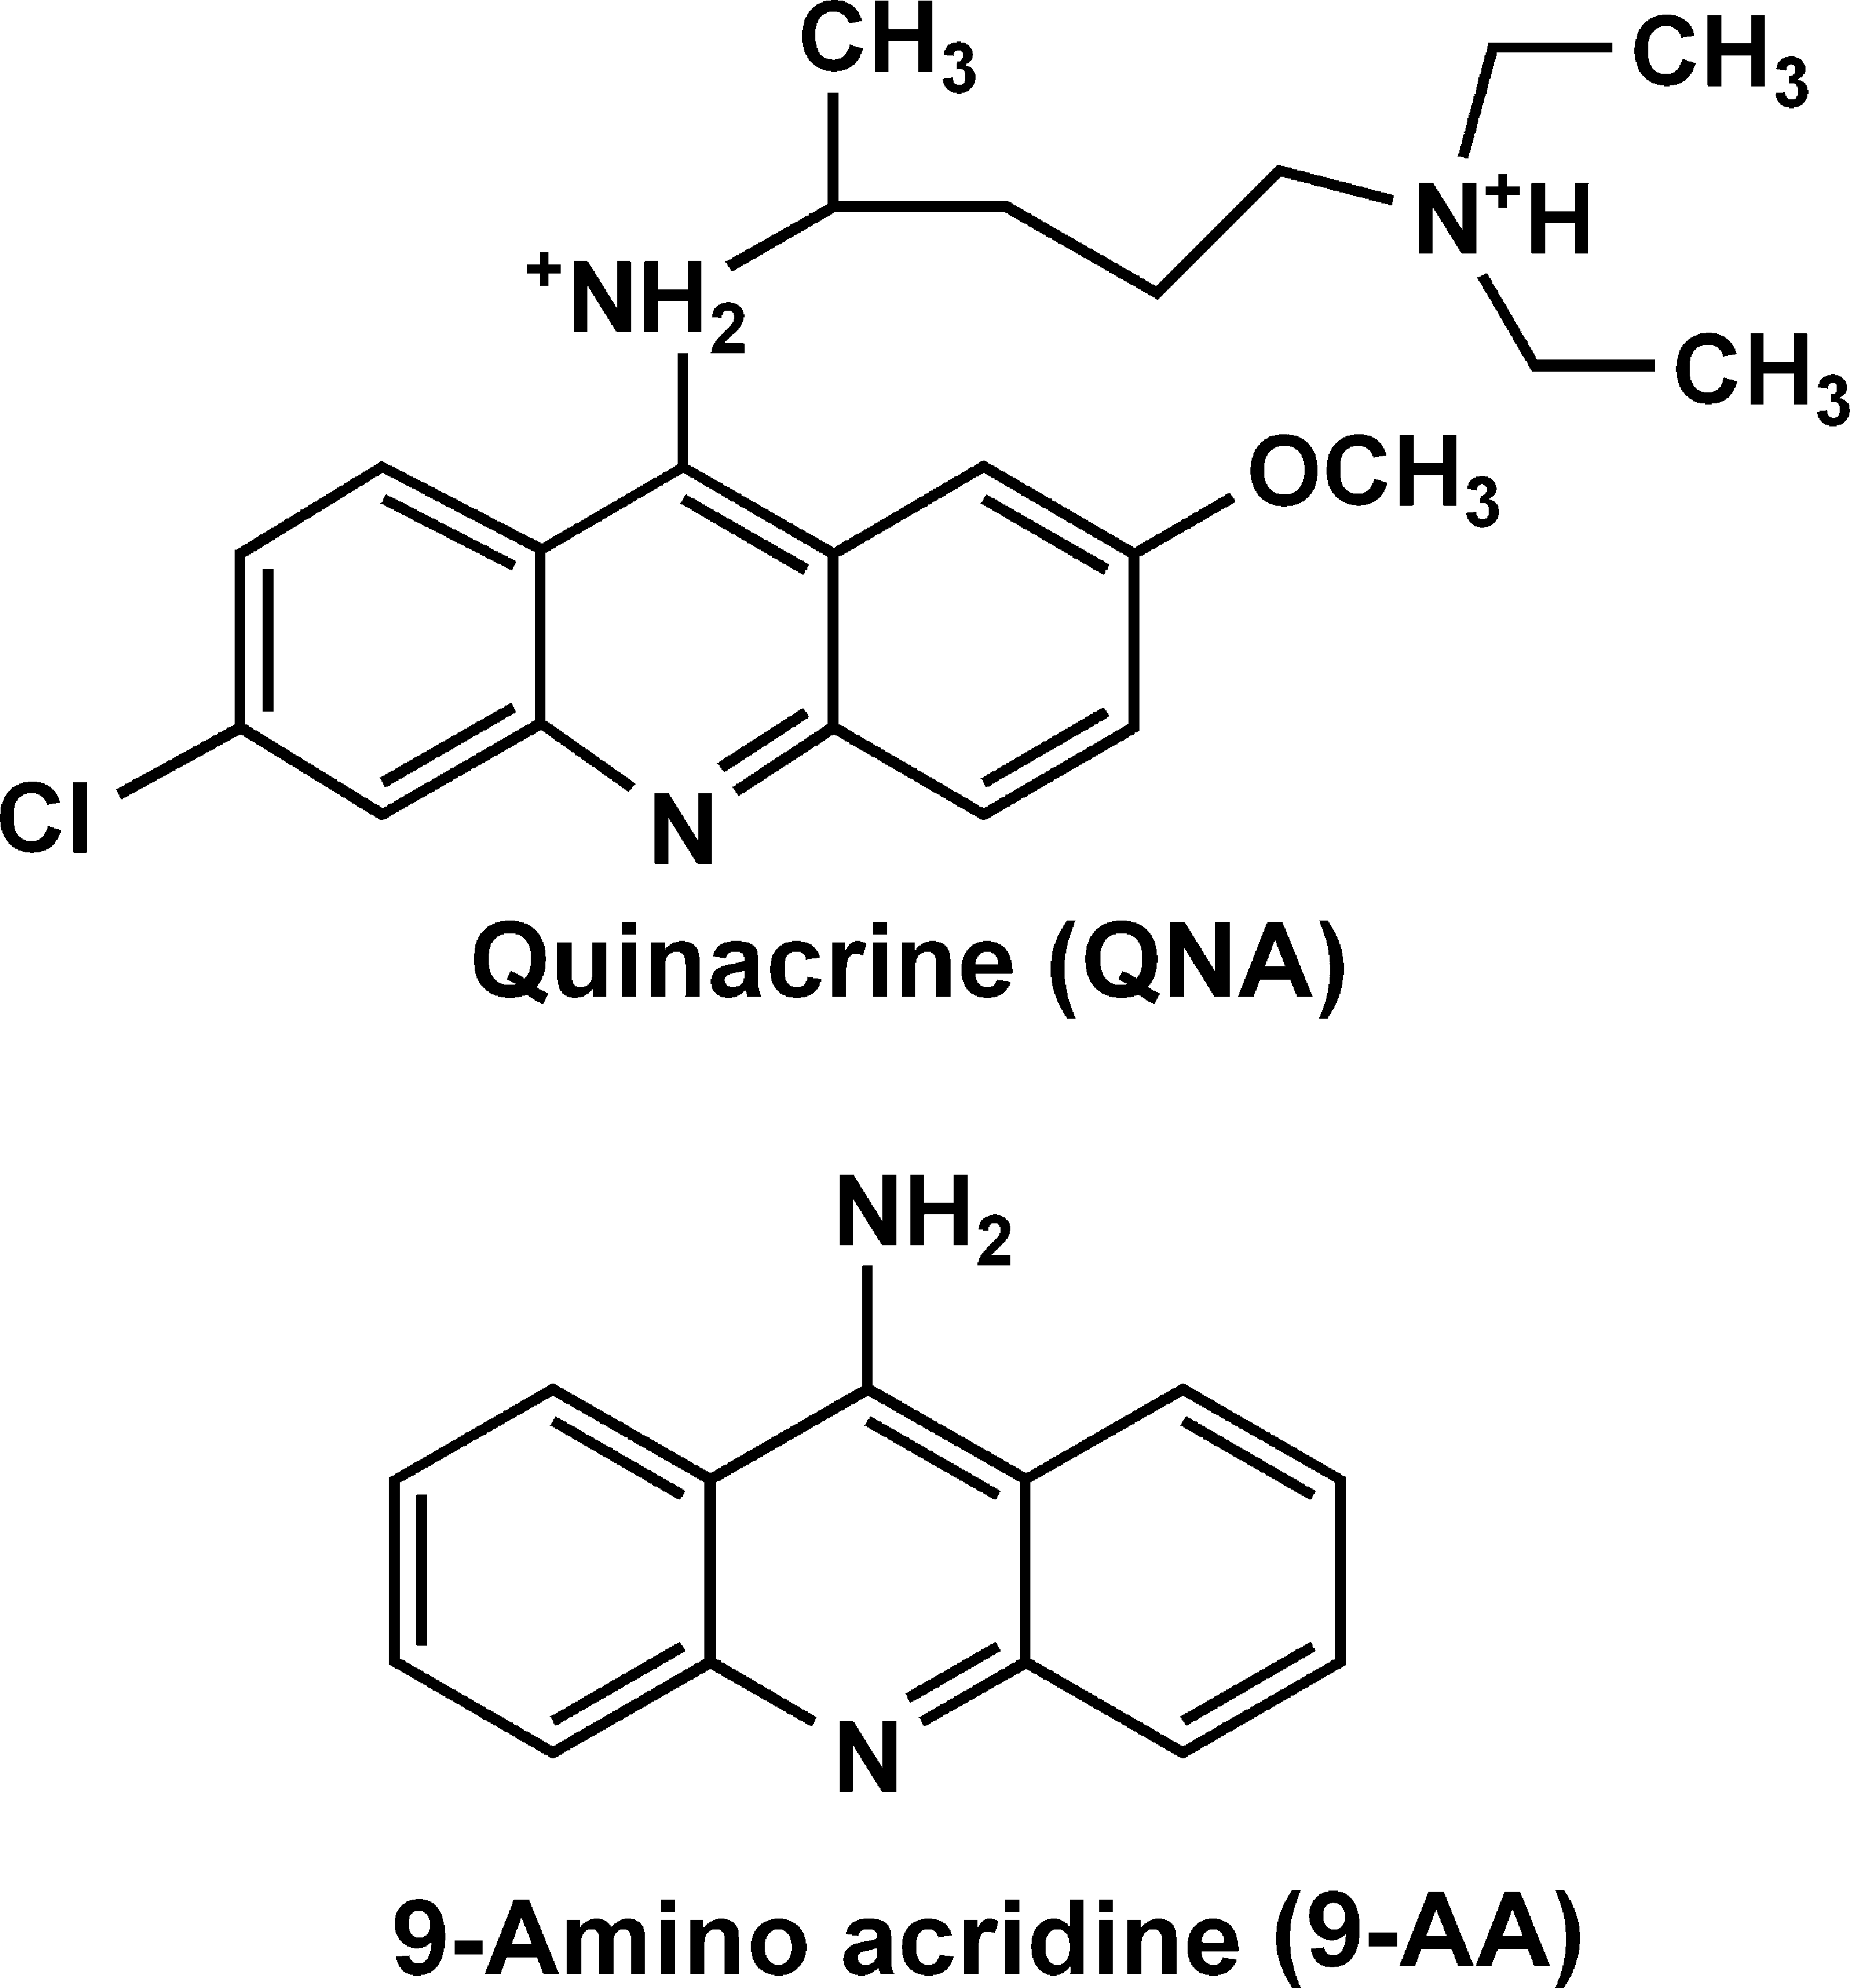
Chemical structures of quinacrine and 9-amino acridine.
9-amino acridine possesses mutagenic activities and binds to DNA. It has long been known to be a potent frameshift mutagen in viruses and bacteria (Georghiou, 1977; Jones et al., 1980; Skopek and Hutchinson, 1984; Bailly et al., 1992; Ferguson and Denny, 2007). 9-Amino acridine–DNA intercalation was demonstrated by Lerman (1961). Compared with other aminoacridines, 9-amino acridine has somewhat more antitumoral activity, because incorporation of bulky groups in the acridine moiety does not allow intercalation of the chromophore between DNA base pairs (Lerman, 1961). The antitumoral activity of quinacrine and 9-amino acridine has been ascribed to various activities such as p53 activation, NF-kB inhibition, and inhibition of Bcl-xL protein (reviewed in Gurova, 2009).
The focus of the present study is the interaction of quinacrine and 9-amino acridine with the right-handed B-form, the left-handed Watson–Crick base-paired Z-form and the left-handed Hoogsteen base-paired protonated form (hereafter referred as HL-form) of polydG-me5dC.
Materials and Methods
Materials
Quinacrine and 9-amino acridine were obtained from Sigma-Aldrich. These compounds were used as received, as no detectable impurities were observed by thin layer chromatography and 1H NMR. Solutions of quinacrine and 9-amino acridine were freshly prepared each day. Molar extinction coefficient (ɛ) values of 8850 M−1 cm−1 at 424 nm and 9656 M−1 cm−1 at 400 nm, respectively, for quinacrine and 9-amino acridine were used for determining their concentrations. No deviation from Beer's law was seen in the concentration range used in this study. Buffer salts, disodium hydrogen phosphate (Na2HPO4), and citric acid monohydrate (C6H8O7 · H2O) were of analytical grade. Disodium hydrogen phosphate (Lot no. 17909) and citric acid (Lot no. MD4M541012) were obtained from Merck. Hexammine cobalt (III) chloride ([Co(NH3)6]Cl3) was a product of Aldrich Chemical Co. Deionized, triple-distilled water was used throughout the experiments.
Buffers of different composition and varying ionic strength and pH were prepared according to Gomori (1955) and these are as follows: (1) Nucleic acid stock solutions were prepared in citrate-phosphate (CP) buffer containing 50 mM Na2HPO4, pH 6.90 (buffer 1). Binding studies with B-form structure were performed in this buffer. (2) Formation of Z-DNA structure and its interaction with quinacrine and 9-amino acridine were performed in CP buffer containing 50 mM Na2HPO4, pH 6.90, with 20 μM hexammine cobalt (III) chloride ([Co(NH3)6]Cl3) (buffer 2). (3) Formation of the protonated structure (HL-form) and interaction with quinacrine and 9-amino acridine were performed in CP buffer containing 40 mM Na2HPO4, pH 3.4 (buffer 3).
pH measurements were performed on a digital pH meter (Electric Corporation of India Ltd.; accuracy: ± 0.01). The pH meter was calibrated accurately by the use of standard buffer solutions (Glaxo India Ltd.). All the experimental buffer solutions were passed through 0.45-μM Millipore filter (Millipore India, Pvt. Ltd.) to remove any particulate matter.
Nucleic acid polynucleotide polydG-me5dC (Lot no. QL81793802) was the product of Pharmacia LKB Biotechnology. The polynucleotide was tested for its nativeness and purity by UV absorption and CD characteristics (Bressloff and Crothers, 1981; Hung et al., 1994). The DNA polynucleotide exhibits B-form structure as evidenced from CD spectrum. Its concentration was determined spectrophotometrically using a molar extinction coefficient (ɛ) value of 14,000 M−1 cm−1 at 255 nm. The polynucleotide was sonicated in a Labsonic 2000 sonicator (B. Braun) by using a needle probe of 4 mm diameter. The average length of sonicated fragments was found to be 280 ± 60 bp as determined from viscosity measurements (Ray and Maiti, 1996).
Methods
Formation of left-handed Z-DNA structures
The formation of Z-DNA structures was measured by absorption and CD spectroscopy. Before initiating interaction studies, B-to-Z transition potential of polydG-me5dCwas confirmed using [Co(NH3)6]Cl3 solution. An equilibrium time of 40 min was generally allowed after initiating the conformational transition. UV and CD spectra were recorded before and after the transition. The ratio of absorbance at 260 nm to that at 295 nm was used as a measure of the B-to-Z transition (Pohl and Jovin, 1972; Das et al., 1999).
Kinetics of right-handed (B-form) to left-handed (Z-form) transition
The kinetics of the B-to-Z transition was measured by monitoring the change in the absorbance of polydG-me5dC solution at 295 nm at 20°C. PolydG-me5dC at a concentration of 90 μM was maintained with constant stirring at 20°C in buffer 1. The structural transition was initiated by the addition of [Co(NH3)6]Cl3 solution to give a final concentration of 20 μM. To examine the effect of quinacrine on the B-to-Z transition, the B-form of the polynucleotide was added to a solution of [Co(NH3)6]Cl3 containing quinacrine and the absorbance at 295 nm was recorded with constant stirring until no change in absorbance was observed. In all experiments, the same amount of drug was added to the reference solution.
Formation of HL-form structure
The formation of HL-form structure was also measured by absorption and CD spectroscopy by slowly adding the polynucleotide stock solution to buffer 3 maintained at 20°C under constant stirring. The structural transition from B to HL-form was completed within 1 s. The hypochromicity change at 255 nm during B–to–HL-form transition was generally about 23%–25%, resulting in a characteristic UV spectrum for the HL-form polydG-me5dC duplexes (Suresh Kumar and Maiti, 1994; Das et al., 1999). For HL-form polydG-me5dC, the characteristic negative CD band appeared around 310 nm. The spectral pattern was clearly different from that of an acid-denatured spectrum (Suresh Kumar and Maiti, 1994).
Spectrophotometric measurements
UV–visible spectroscopy
A Shimadzu Pharmaspec 1700 spectrophotometer (Shimadzu Corporation) was used for absorption spectral studies, wherein a constant concentration of the polynucleotide was treated with increasing concentration of drug in 1 cm path length matched quartz cuvettes with continuous stirring throughout the course of the titration. The reference cuvette always contained the same amount of polynucleotide as the sample cuvette.
Analysis of binding and evaluation of the binding parameters
The theory and methods presented by Scatchard for the analysis of the interaction of a large polynucleotide with ligand were employed to characterize the binding process (Scatchard, 1949). Binding data obtained from spectrophotometric titration of increasing concentrations of drug to a fixed concentration of polynucleotides were analyzed in a Scatchard plot of r/C f versus r, where r is the number of drug molecules bound per mole of base and C f is the free drug concentration.
Polynucleotide solution was added to the buffer to yield a concentration of 50 μM in both sample and reference cuvette. Successive aliquots from a stock solution of ligand were added to the sample cuvette, whereas the same amount of buffer was added to the reference cuvette. After 30 min of equilibration, the absorbance at the characteristic λ max (424 nm for quinacrine) and the isosbestic point (457 nm for quinacrine) was noted. The amount of free and bound quinacrine was determined as follows:
The total ligand (C
T) present was calculated from
where ɛ 457 = 5030 M−1 cm−1 at the isosbestic point for quinacrine.
The expected absorbance at 424 (A
o) is
The difference between A
o and the observed absorbance was then used to calculate the amount of bound ligand as
where ɛ f424 = 8850 M−1 cm−1 and ɛ B424 = 4390 M−1 cm−1 for quinacrine.
ɛ
B was determined independently by adding a known quantity of quinacrine to a large excess of DNA and assuming total binding. The amount of free drug was then estimated by the difference,
Similarly, for 9-amino acridine, the absorbance at its characteristic peak, 400 nm, and isosbestic point, 429 nm, was noted after each addition. C T and C B were calculated as described above using ɛ f400 = 9656 M−1 cm−1, ɛ B400 = 3720 M−1 cm−1, and ɛ 429 = 3800 M−1 cm−1 for free, bound, and isosbestic point, respectively.
Nonlinear binding isotherms were observed in each case, and the data were fitted to a theoretical curve drawn according to the excluded site model (Crothers, 1968) developed by McGhee and von Hippel (1974) for a nonlinear noncooperative ligand binding system using the following equation:
where K′ is the intrinsic binding constant to an isolated binding site, and n is the number of nucleotides occluded by the binding of a single ligand molecule. The binding data were analyzed using Origin 8.0 software to determine the best fit parameter of K′ and n.
Nonlinear binding isotherms where a positive slope was observed at low r values were fitted to a theoretical curve drawn according to the excluded site model of McGhee and von Hippel (1974) for cooperative ligand binding system using the following equation:
where
CD measurements
CD measurements were carried out on a PC-driven JASCO J815 spectropolarimeter (Jasco International Co.) attached with a temperature controller and a thermal programmer model PFD-425L/15 interfaced in a rectangular quartz cuvette of 1 cm path length as reported earlier (Islam et al., 2009). All CD spectra were recorded in the wavelength range of 220–400 nm with a scan speed of 100 nm/min. Each spectrum was averaged from five readings for each sample. Final CD spectra were expressed in terms of molar ellipticity (θ) in units of deg cm2 dmol
where θ is the measured ellipticity, C is the concentration expressed in moles/liter, and l is the path length of the cuvette in cm. The expressed molar ellipticity is based on polynucleotide concentration. All CD spectral measurements were performed at 20°C.
Results
CD and UV spectral characteristics of B-, Z-, and HL-forms of polydG-me5dC
The characteristic CD spectra of B, Z, and HL conformations of polydG-me5dC are shown in Figure 2. The CD spectrum of the B-form (curve 1) is characterized by a large negative band around the 250 nm region along with a positive band in the 275 nm region. This CD spectrum undergoes large change as the polynucleotide switches from the right-handed B to either the left-handed Watson–Crick base-paired Z-form or the left-handed Hoogsteen base-paired HL-form (curves 2 and 3). In the case of B-to-Z transition, the positive band, observed in the 275 nm region of the B-form, is replaced by a more intense negative band in the 290–300 nm region and the negative 253 nm band is replaced by a positive band around 265 nm. Curve 2 in Figure 2 represents the Z-form CD spectrum generated under conditions of 20 μM [Co(NH3)6]Cl3. In the case of B-to-HL transition, a negative band appeared around 310 nm for polydG-me5dC followed by a broad positive ellipticity in the 250–280 nm region. The ellipticity of the negative band of the HL-form is lower when compared with the negative band of the Z-form. These three polymorphic forms exhibited a single sharp isoelliptic point at 281 nm, indicating complete transition equilibrium of each structure from the B-form. The UV spectra of these three polymorphic structures (not shown) were similar to our earlier report (Das et al., 1999). The conversion of the B-form to Z- or HL-form is characterized by significant changes in the nature and intensity of the UV spectrum of the polynucleotide particularly in the 295 nm region and is more pronounced in the HL-form spectrum.
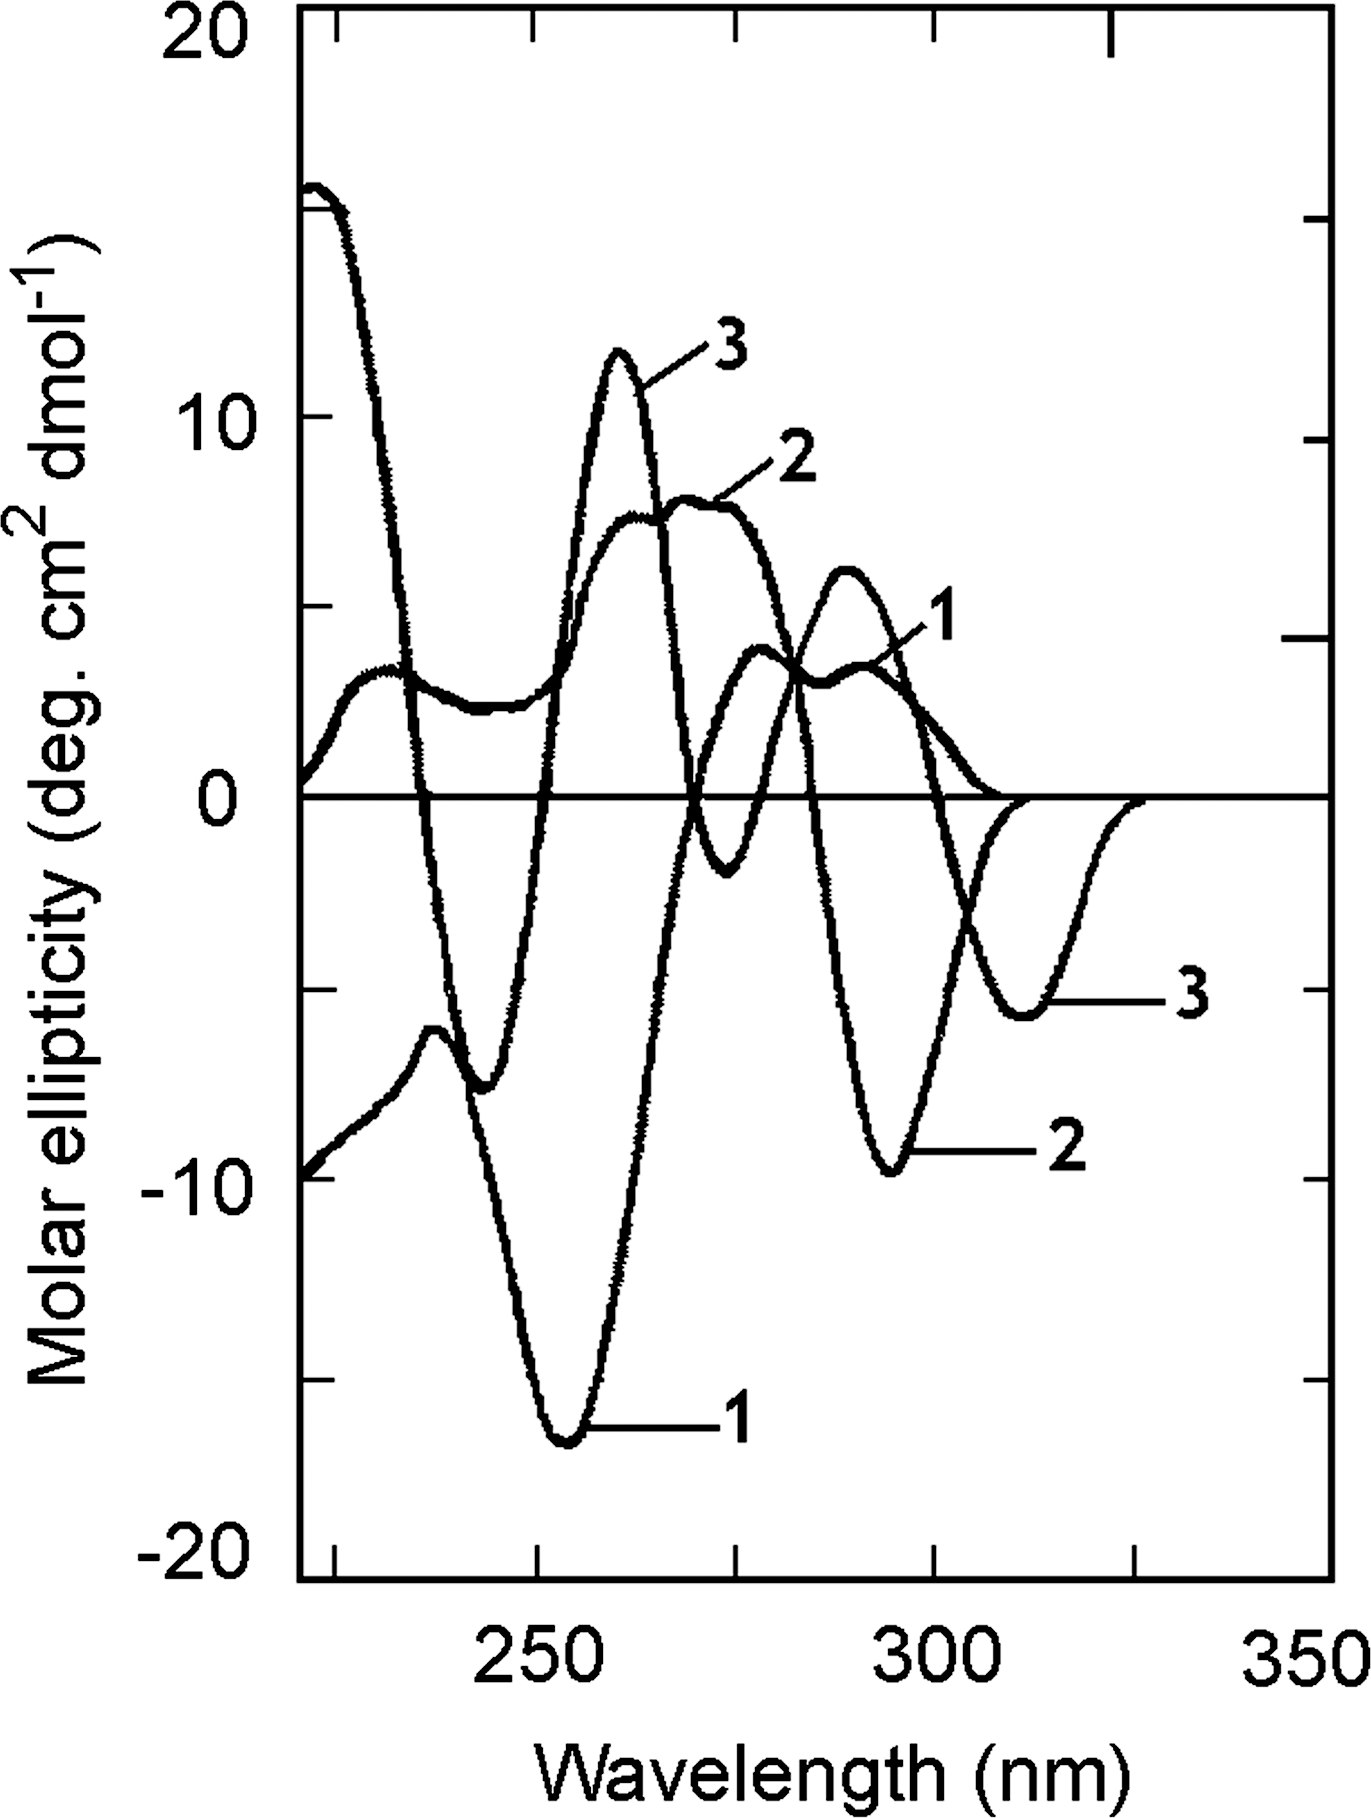
Circular dichroic spectra of polydG-me5dC (54.84 μM) in B-form (curve 1), Z-form (curve 2), and HL-form (curve 3).
CD spectral changes of interaction of quinacrine and 9-amino acridine with the B-, Z-, and HL-forms
B-form–drug interaction
The CD spectral changes associated with the interaction of quinacrine and 9-amino acridine with the B-form of polydG-me5dC are depicted in Figure 3A and B, respectively. Binding of quinacrine and 9-amino acridine perturbed the B-form CD spectrum of the polynucleotide. A large increase in the ellipticity of the long-wavelength CD band (∼280 nm) was observed on binding with quinacrine (Fig. 3A). The ellipticity of this band increased by almost four times the initial value at saturation, showing a strong perturbation in the structure. In the case of 9-amino acridine (Fig. 3B), the positive band is blue-shifted by ∼10 nm and ellipticity became almost five times the initial value at saturation. In the case of quinacrine, the negative band intensity at 250 nm was relatively less perturbed compared to that with 9-amino acridine. A single isoelliptic point was observed at ∼265 nm and ∼256 nm, respectively, for quinacrine and 9-amino acridine-polynucleotide complexation. This indicated equilibrium between the ligand-bound and the free polynucleotide conformations.
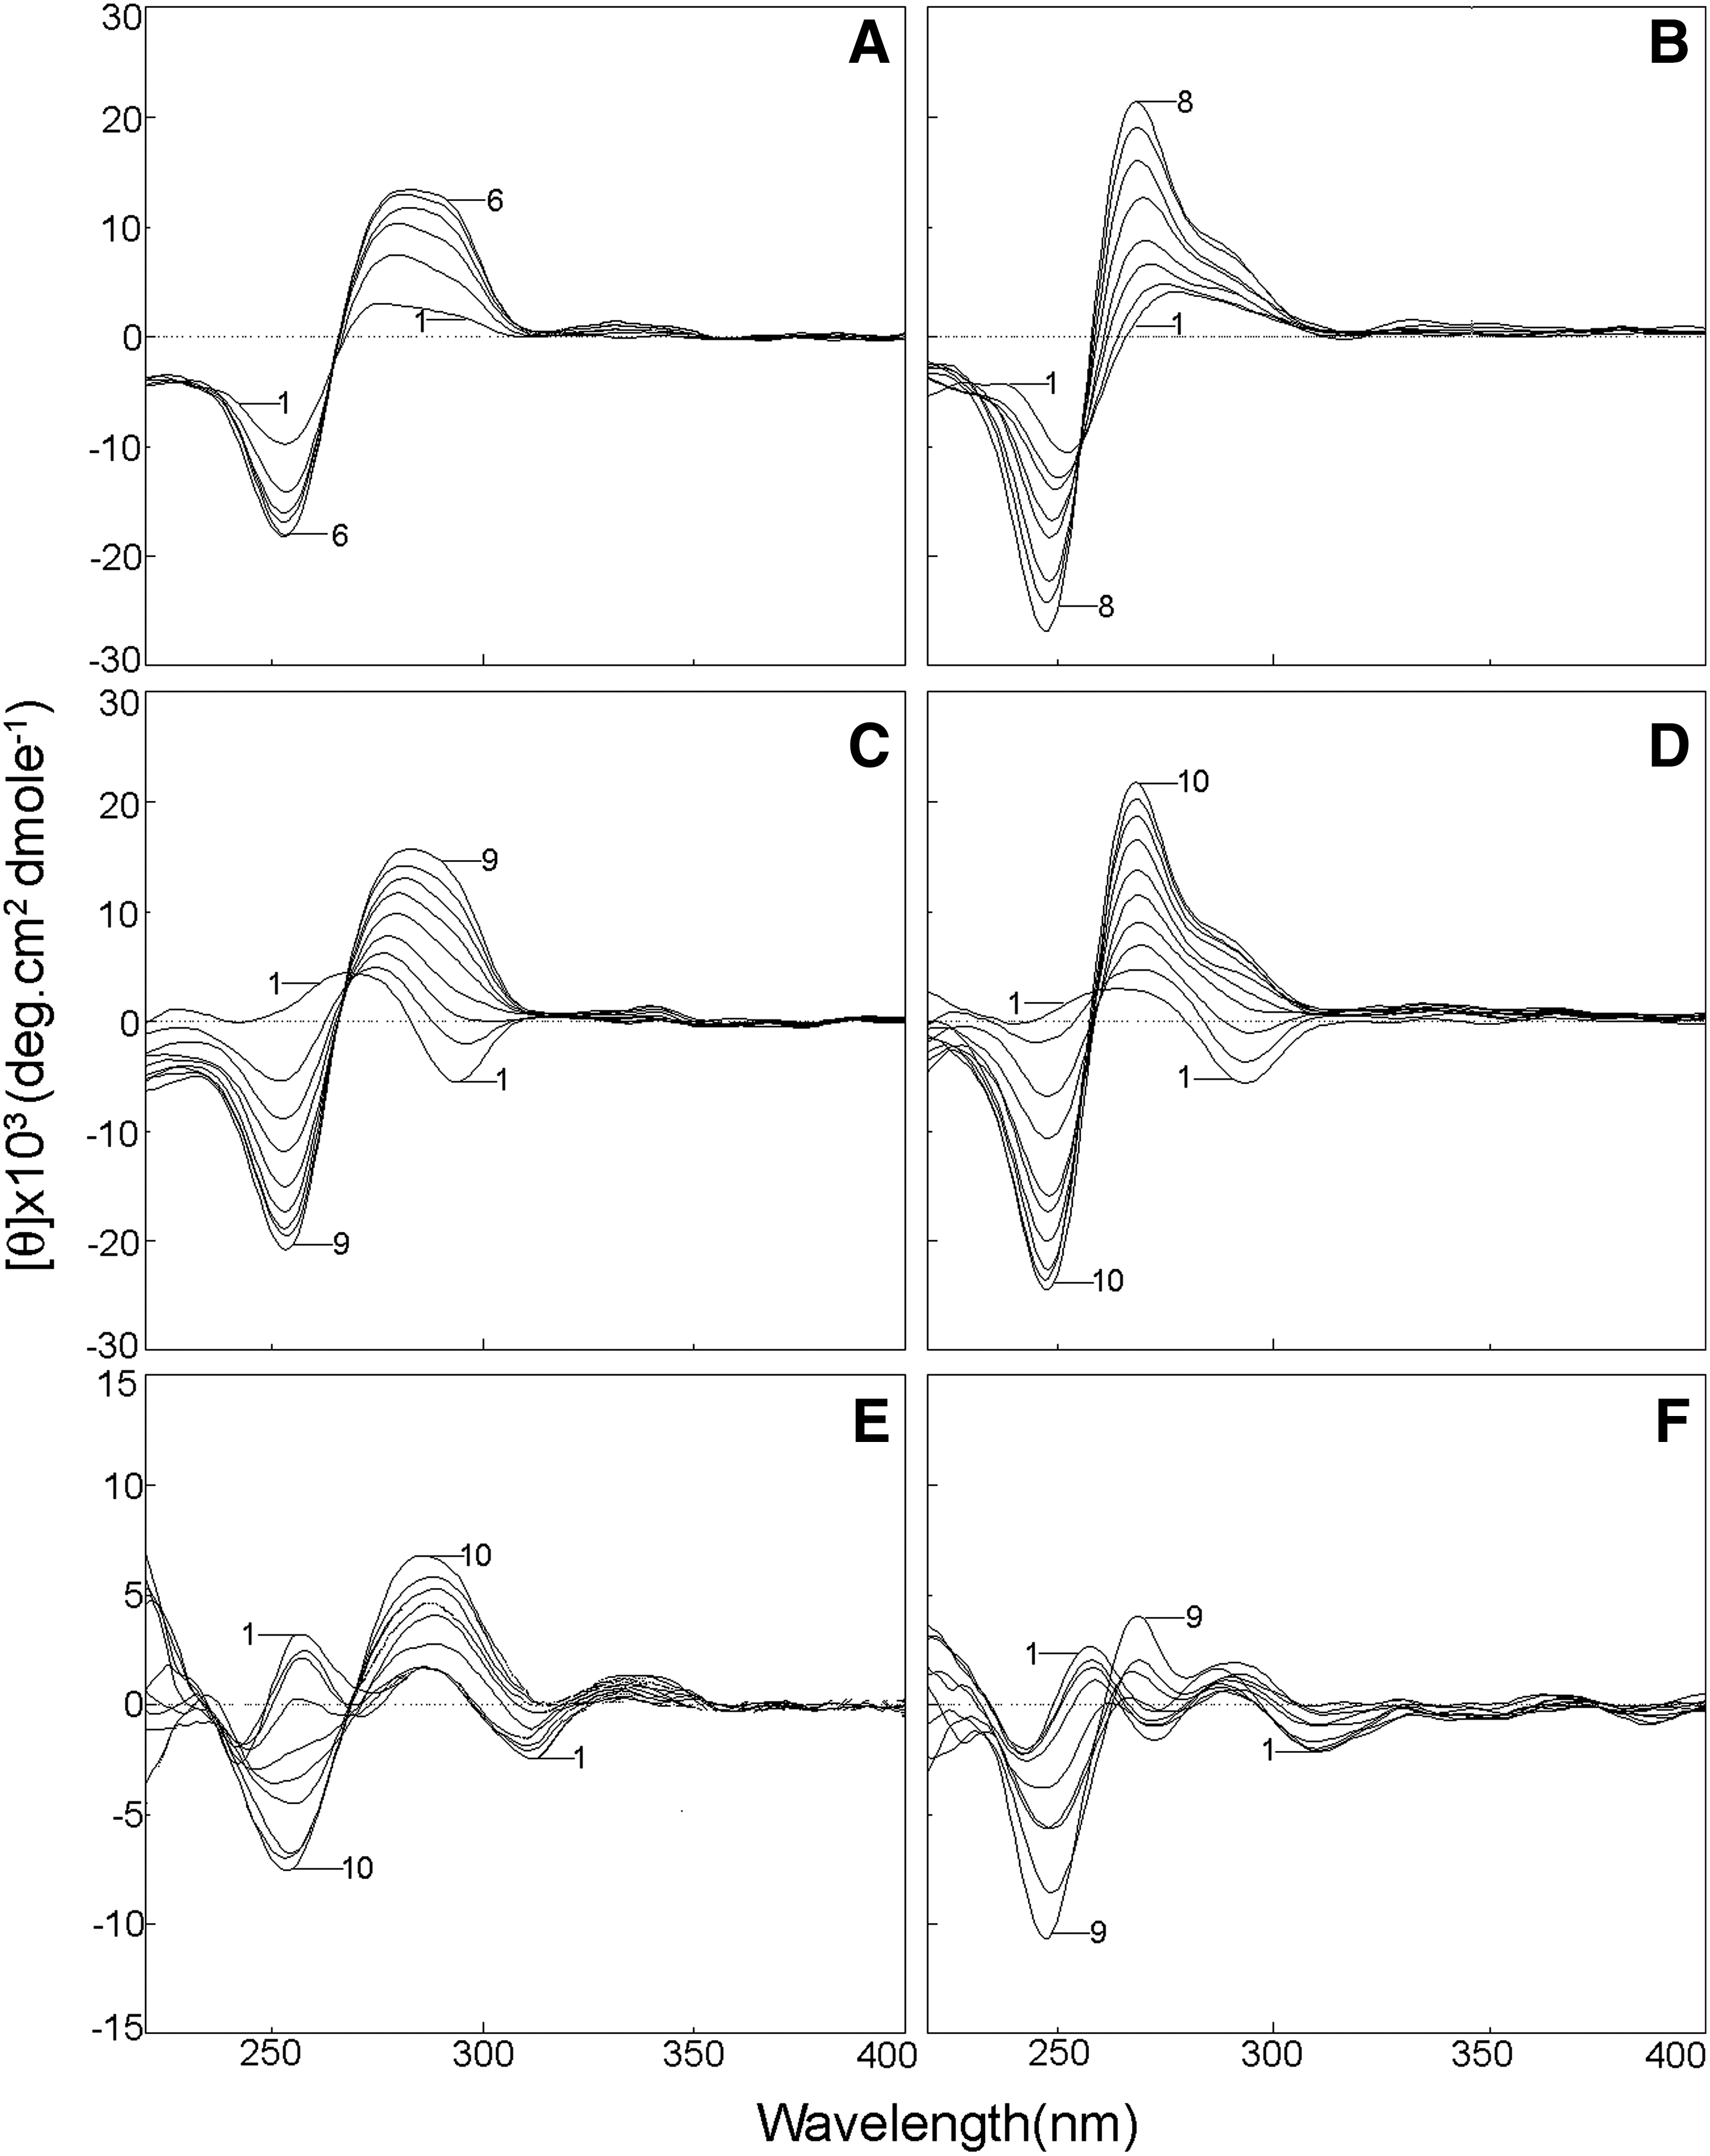
Representative circular dichroic spectra resulting from the interaction of quinacrine and 9-amino acridine with B-form, Z-form, and HL-form of polydG-me5dC:
Z-form–drug interaction
The CD spectral changes associated with the interaction of quinacrine and 9-amino acridine with the Z-form of polydG-me5dC are depicted in Figure 3C and D, respectively. On addition of the drugs, dramatic changes were observed in the 295 nm negative band, which at first rapidly reduced in ellipticity, blue shifted, crossed over to the positive side, and thereafter increased in ellipticity. At saturation, the features of the band at ∼282 nm in terms of ellipticity and wavelength maximum were similar to those seen with bound B-form and quinacrine (curve 6, Fig. 3A). Similarly, in the 9-amino acridine-Z-form polynucleotide interaction, the features of the final bound complex CD is similar to that of the bound complex under B-form condition (curve 10, Fig. 3D). In both the cases, the positive CD band (∼266 nm) in the Z-form partially reduced in ellipticity with concomitant blue shift to form a band around 252 nm similar to the negative 252 nm band of the B-form. At saturation, both intensity and wavelength maximum of this band were similar to that of the drug-bound B-form CD. A single isoelliptic point was observed at ∼268 and ∼258 nm, respectively, for quinacrine and 9-amino acridine-Z-form polynucleotide complexation.
HL-form–drug interaction
The HL-form CD spectrum of the polynucleotide was strongly perturbed on interaction with quinacrine. The changes are depicted in Figure 3E. The broad positive band in the 260–290 nm region enhanced in ellipticity and became a single sharp band with maximum around 284 nm. Concomitantly, the small negative band around 310 nm reduced and disappeared. At saturation the CD spectrum has features similar to a quinacrine-bound B-form CD except that the ellipticity values of the peaks were slightly lower. Figure 3F represents the CD spectral changes of HL-form of polydG-me5dC on interaction with 9-amino acridine. The spectral changes here, however, were significantly different from that observed with quinacrine. There are changes in all the bands, but the extent was less when compared with that seen in B- and Z-forms and with quinacrine. The spectrum obtained at saturation had much lower ellipticity values when compared with B- and Z-forms.
Switching of base pairs from a Z- or HL-form to a right-handed helical form on binding of quinacrine and 9-amino acridine
The variation of molar ellipticity at 295 nm in the case of Z-form and at 310 nm in the case of HL-form was used to derive the number of bases switching to the right-handed form for each molecule of bound quinacrine or 9-amino acridine. In Figure 4, the variations of molar ellipticity versus r for the transition of Z to bound B and HL to bound B-form for quinacrine and 9-amino acridine are compared with the molar ellipticity change for B-form binding. With the Z-form for quinacrine (Fig. 4A), the molar ellipticity at 295 nm exhibited a smooth change from a large negative value to positive values as a function of r and converge with B-form data at an r = 0.06. In the case of the HL-form (Fig. 4B), the value of molar ellipticity variation at 310 nm meet the B-form data at an r = 0.13. For 9-amino acridine, the molar ellipticity change of Z-form (Fig. 4C) and HL-form (Fig. 4D) meeting with B-form were at r = 0.06 and 0.02, respectively. From this the number of base pairs switching from Z-form or HL-form to the right-handed helical form for each bound quinacrine and 9-aminoacridine can be deduced and these are ∼8 and 4 for quinacrine and 8 and 25 for 9-amino acridine with Z-form and HL-form, respectively.
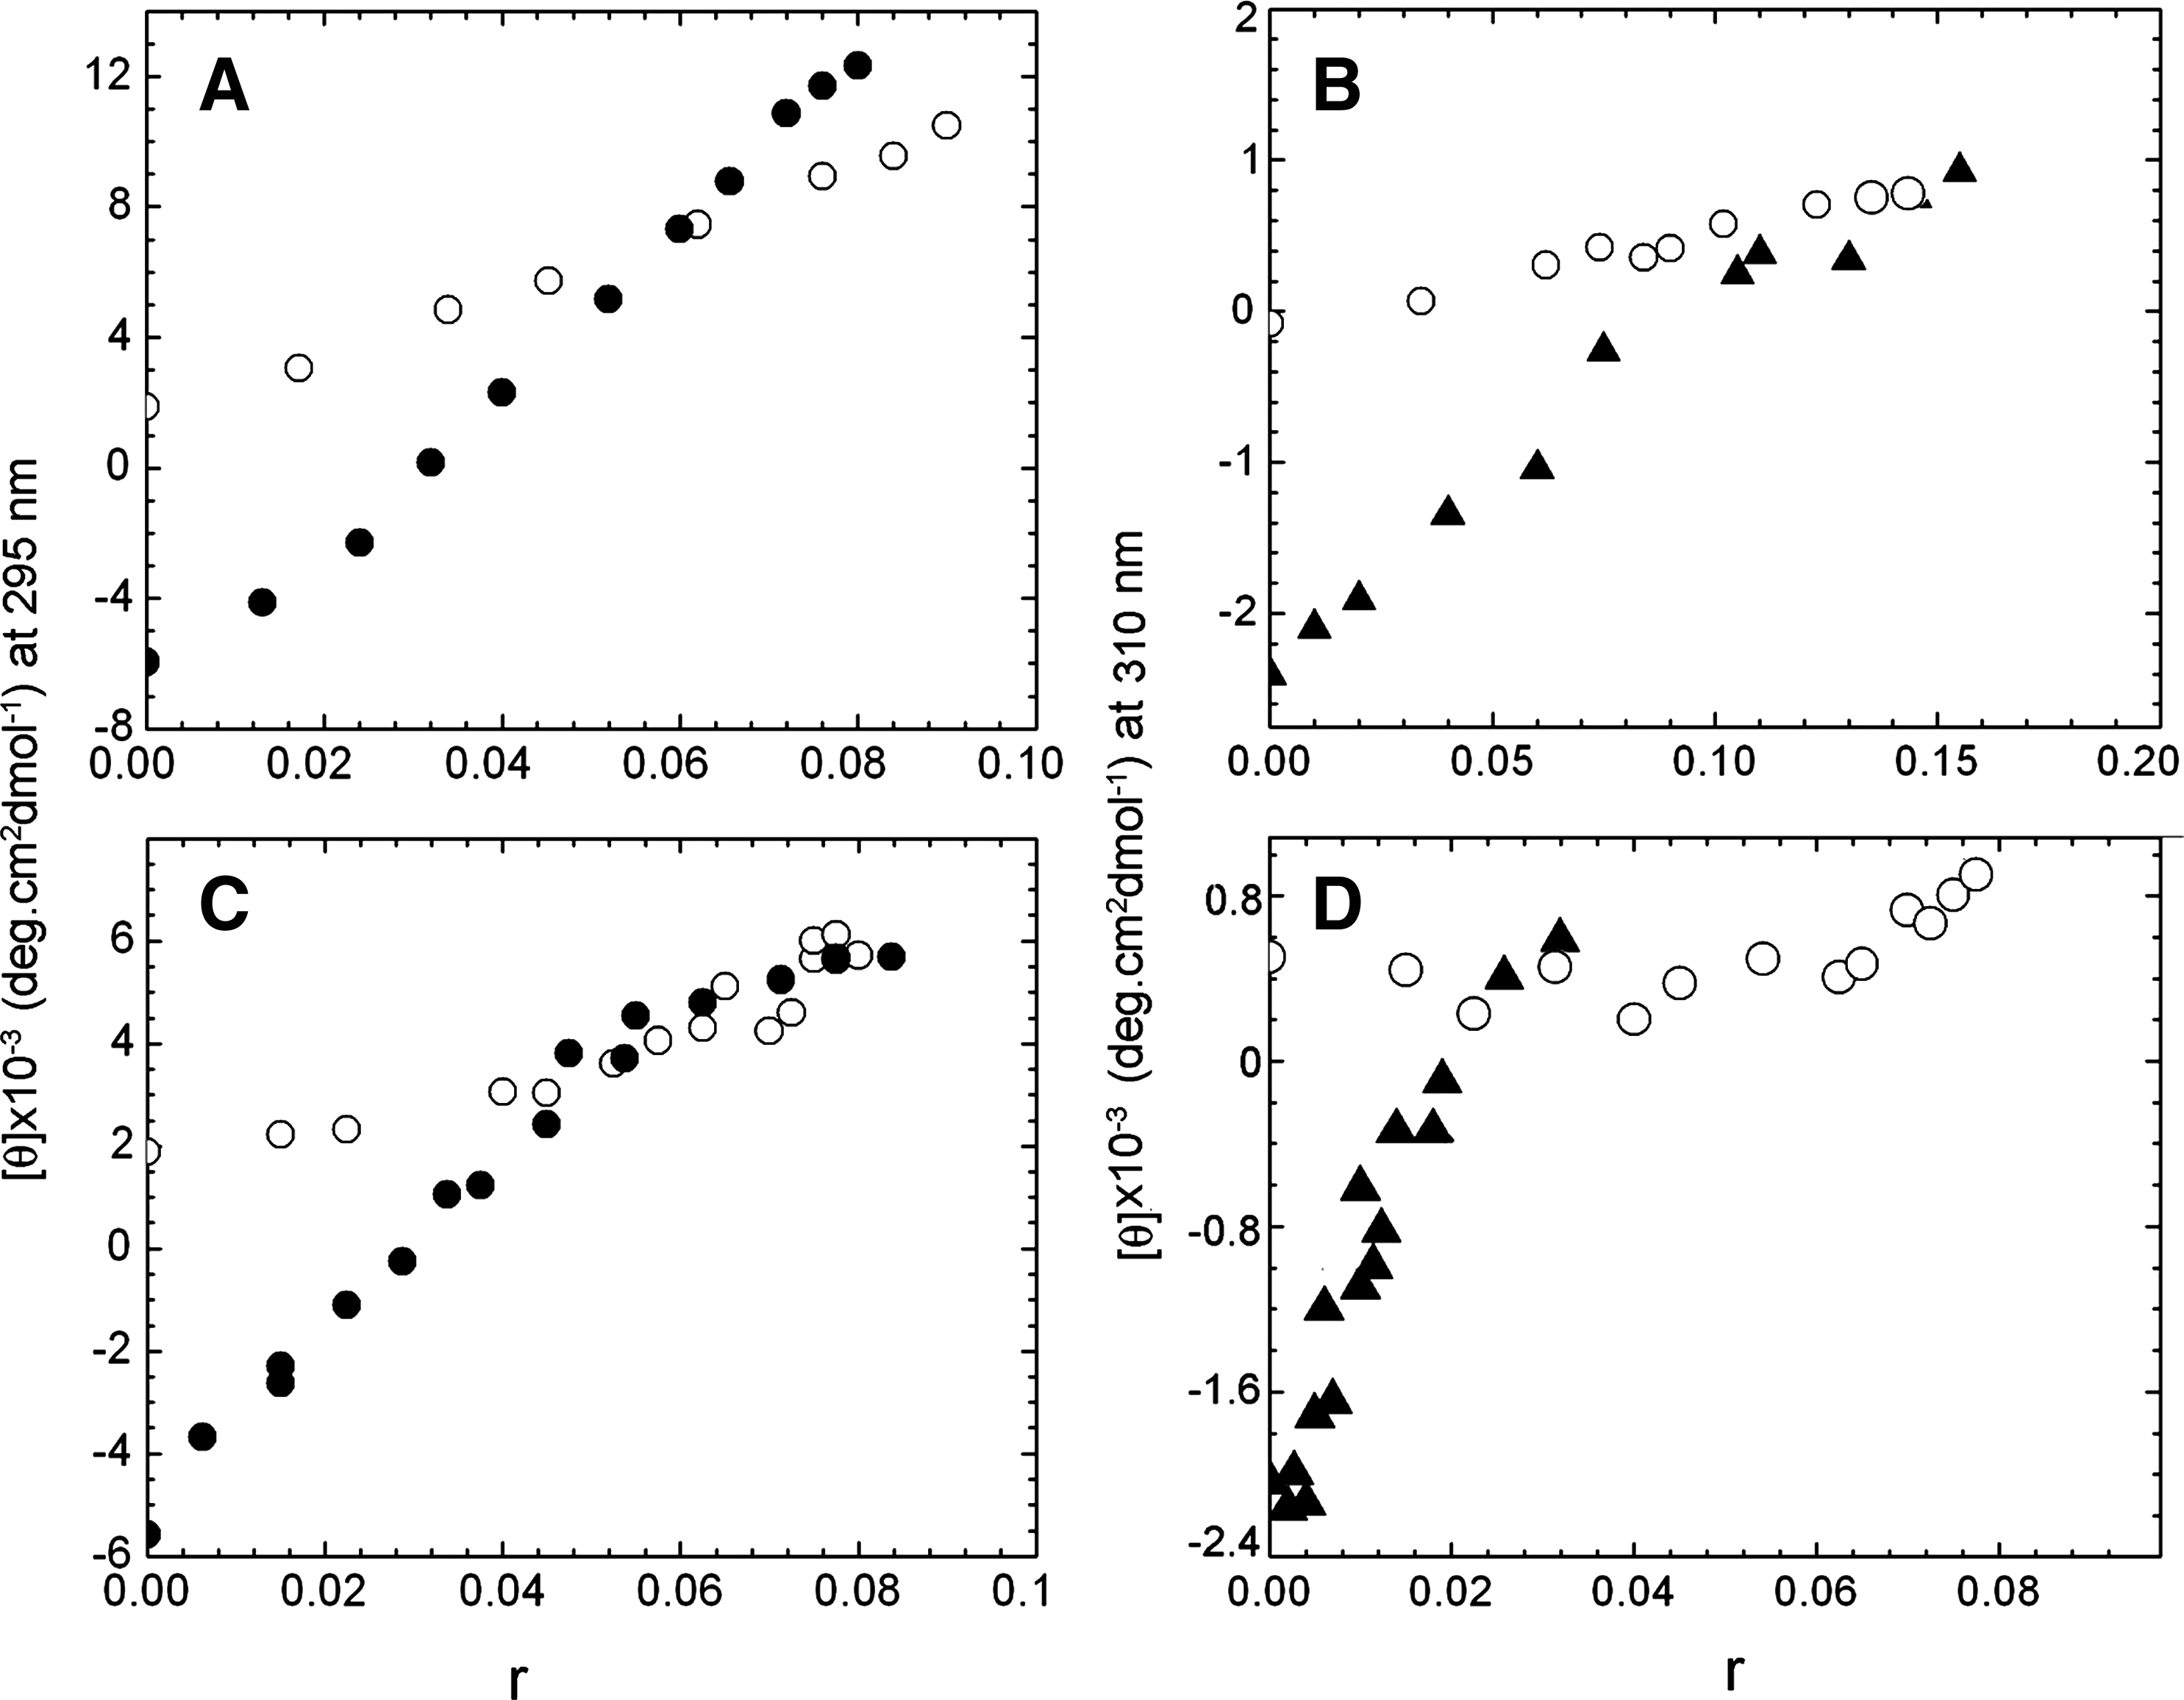
Plot of molar ellipticity values at different wavelengths as a function of r for the interaction of quinacrine
Spectrophotometric titration studies
Cooperative binding of quinacrine and 9-amino acridine to, Z-, and HL-forms and non-cooperative binding to B-form
To understand in more detail the nature of the conformational transitions, CD spectrophotometric binding studies of the drugs with the three polymorphic forms were performed. The Scatchard plot for the binding of quinacrine to the B-, Z-, and HL-forms are depicted in Figure 5. There are remarkable differences in the plots. The Scatchard plot of binding of quinacrine to the B-form (Fig. 5A) showed isotherm with a negative slope at all r values. This is indicative of noncooperative binding. In Figure 5B and C, the Scatchard plots for the binding to the left-handed Z- and HL-forms are depicted. These isotherms showed a change from a positive to a negative slope, indicating positive cooperativity in the binding reactions. The noncooperative B-form binding plot was analyzed by the neighbor exclusion model of McGhee and von Hippel (1974), whereas the cooperative plots were analyzed by the cooperative equation. The best-fit values of the binding parameters are presented in Table 1. The K′ value for the binding to B-form was 3.70 × 10⁵ M−1, to the Z-form was 1.08 × 10⁴ M−1, and to the HL-from was 1.70 × 10⁴ M−1.

Equilibrium binding curves for the interaction of quinacrine with polydG-me5dC under B-form, Z-form, and HL-form conditions. Scatchard plots are shown for
The values in this table were evaluated by fitting of the Scatchard plots to the noncooperative equation of McGhee and von Hippel for B-form and the cooperative equation for Z- and HL-forms. n is the exclusion parameter in nucleotide phosphates and ω is the cooperativity factor.
Spectrophotometric binding studies of 9-amino acridine with the three conformations of polydG-me5dCwere similarly performed. The binding was noncooperative with B-form, whereas cooperative isotherms were observed with the Z- and HL-forms (data not shown). Binding parameters elucidated are presented in Table 1. The affinity of 9-amino acridine with the B-form (8.90 × 10⁵ M−1) was greater by more than twofold than that for quinacrine. The affinities of 9-amino acridine to the Z- and HL-forms were 0.80 × 10⁴ and 1.10 × 10⁴ M−1, respectively, and were lower when compared with those of quinacrine.
Kinetics of B-to-Z transition and the effect of quinacrine
The conformational switching from left-handed Z to right-handed B-form structure observed in CD on binding of quinacrine and 9-amino acridine was supported by kinetic experiments monitoring the change in absorbance at 295 nm. The variation of absorbance with time showing the effect of quinacrine on the rate of the B-to-Z transition in polydG-me5dC is presented in Figure 6. The reaction was initiated by adding polydG-me5dC solution to buffer 2 in the presence or absence of quinacrine. On addition of quinacrine, both the rate and extent of transition were inhibited. Varying the amount of quinacrine slowed down the transition to different extents, complete inhibition was observed at a molar ratio of drug to polynucleotide (D/P) of 0.15 (r = 0.095). Kinetic analysis showed that the presence of quinacrine inhibited both the rate and extent of the B-to-Z transition. Moreover, the ligand converted the Z-form of the polynucleotide back to the bound B conformation. Similar results were also obtained for 9-amino acridine. The semilog plots of absorbance versus time for polydG-me5dC alone and in the presence of quinacrine and 9-amino acridine are presented in Figure 7. The plots are nonlinear even in the case of the ligand-free sample and this could be due to the length polydispersity of the polynucleotide. In the presence of ligand, the amount of B-form decreases as the transition proceeds and the differences in affinity of the ligand to the two forms resulted in altered binding densities, which was shown by the complex plots. Quinacrine is a more effective inhibitor of the B-to-Z transition when compared with 9-amino acridine (Table 2).
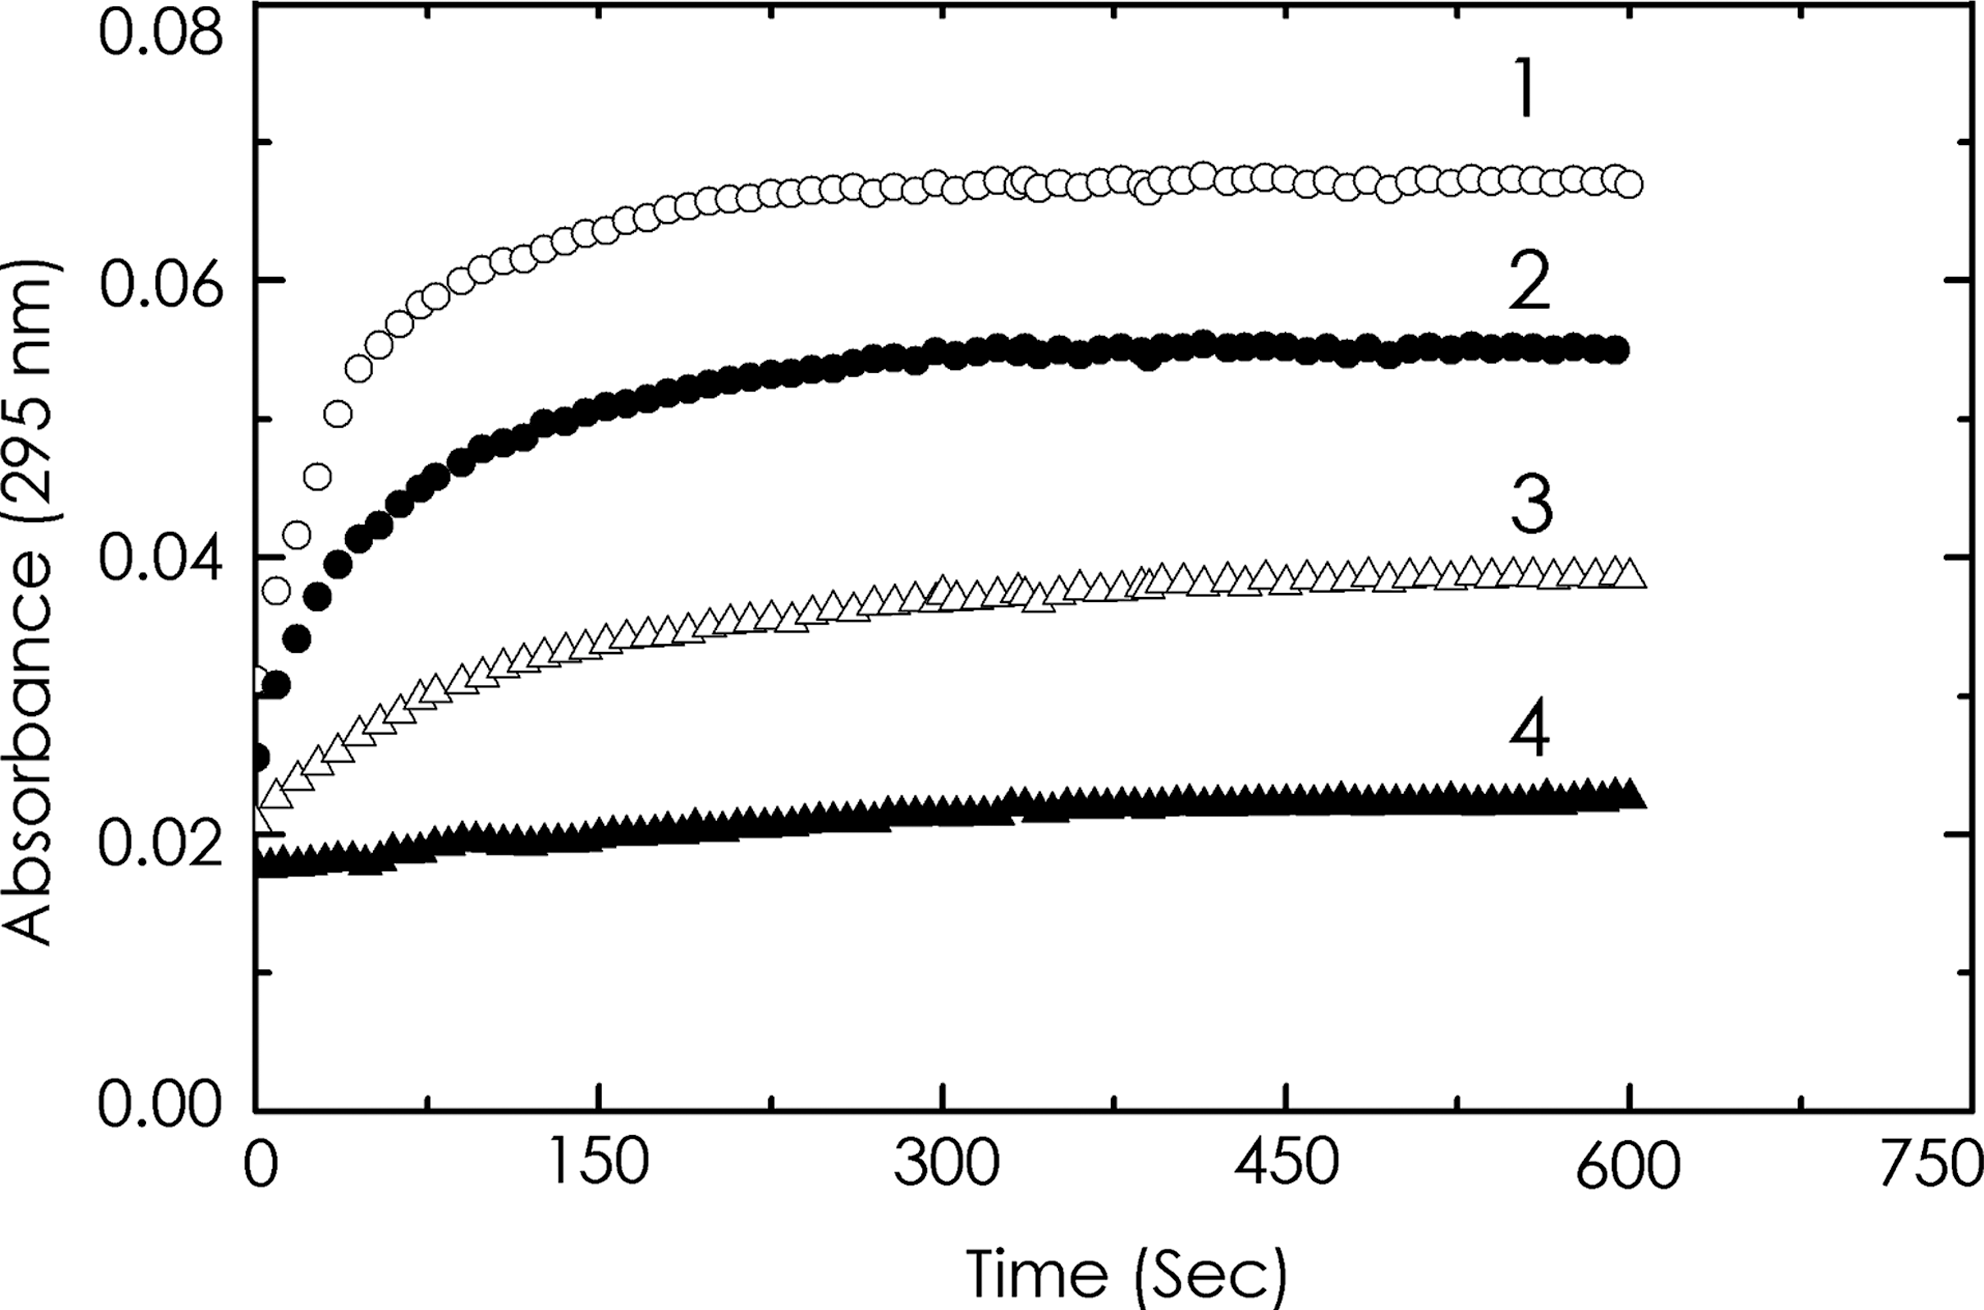
Kinetic analysis of B-to-Z transition of polydG-me5dC (90.0 μM) in the absence and presence of quinacrine. The reaction was initiated by adding polynucleotide to the buffer containing quinacrine, as represented by curves 1 (0 μM), 2 (4.5 μM), 3 (9.0 μM), and 4 (12.5 μM).
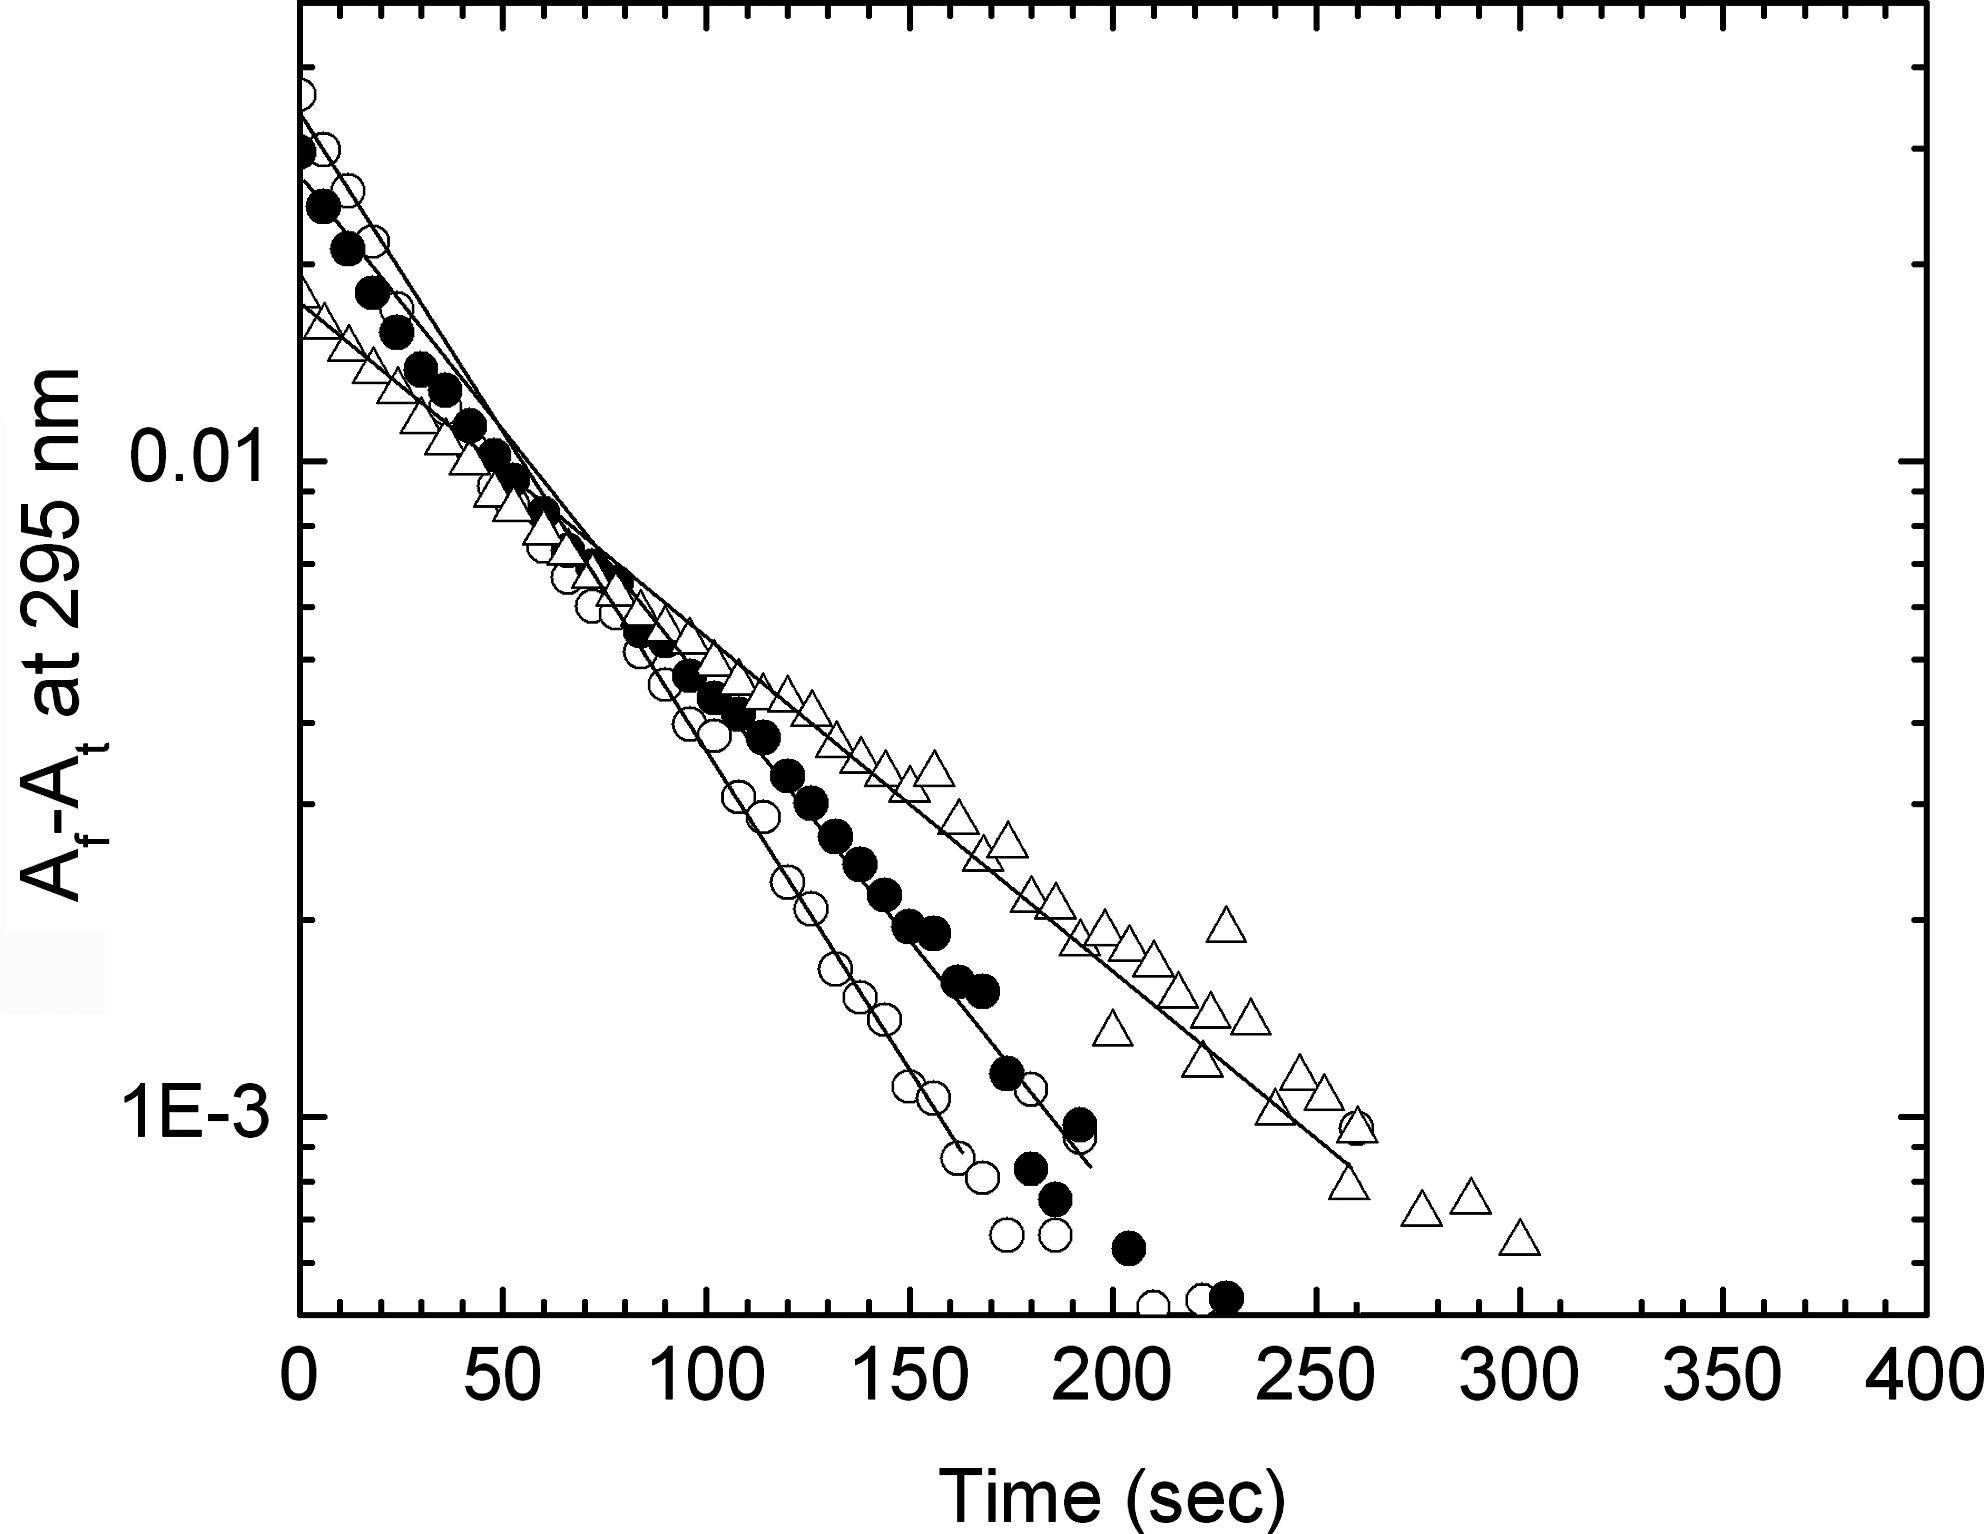
Semilog plots of the difference in absorbance at time t, At , and the final absorbance at 295 nm, A f, versus time for polydG-me5dC free (○) and in the presence of 4.50 μM quinacrine (Δ) and 4.50 μM 9-amino acridine (•), respectively, at 20°C. The initial rates were calculated from the linear regression of the initial points as shown by the solid lines.
r values were calculated from the relation r = C B/P as described in the text.
K is the initial rate constant from the slope of Figure 7.
The extent of relaxation (%) was calculated as [(ΔA°295)/(ΔA°295)D/P=0] × 100. D/P is the molar ratio of drug to polynucleotide.
Discussion
Acridines are a class of long-known molecules that intercalate between hydrogen bonded base pairs causing significant changes in the physicochemical properties of DNA (Lerman, 1961; Blake and Peacocke, 1968; Georghiou, 1977; Jones et al., 1980; Bailly et al., 1992; Rivas et al., 2000; Ferguson and Denny, 2007; Hossain and Suresh Kumar, 2009). The binding behavior of acridines to methylated DNA is significantly different from that of unmethylated DNA (Georghiou, 1977). Although binding of many acridines to B-form is known, no study with other polymorphic forms has been reported. We performed physicochemical measurements on the interaction of quinacrine and 9-amino acridine with B-, Z-, and HL-forms of polydG-me5dC. These interactions may be used for conformational recognition to search for new structures of DNA and understand sequence-specific differences along the helix.
B-form DNA–drug interaction
Both quinacrine and 9-amino acridine have strong affinity toward B-form polydG-me5dC. Binding analysis from spectrophotometric data indicated that both drugs bind to the B-form polynucleotide in a noncooperative manner, with binding constants of 3.70 × 10⁵ and 8.90 × 10⁵ M−1, respectively, and the number of occluded sites were 2.9 and 2.5 bp, respectively. The CD spectral characteristics are typical for intercalation and similar to those reported with other intercalators, including actinomycin D, aristololactam-β-
Z-form DNA–drug interaction
Under a variety of environmental conditions, polydG-me5dC assumes left-handed Z-form conformation. In this study, 20 μM [Co(NH3)6]Cl3] was used to stabilize the Z-form conformation of this polynucleotide. In solution, the formation of negative CD around 295 nm (Fig. 2) is the diagnostic feature of isomerization of the right-handed B-form polynucleotide to the left-handed Z-form (Behe and Felsenfeld, 1981). The CD spectral changes on binding of quinacrine and 9-amino acridine (Fig. 3C, D) indicated a direct conversion of the Z-form toward the characteristic right-handed bound complex. The CD spectral data are similar to those obtained with other DNA binding ligands and indicated that the local environment of the polynucleotide at the binding site is a right-handed conformation (Das et al., 1999). The ellipticity changes in the 295-nm band was used to deduce the number of base pairs converted to the right-handed helical form of bound quinacrine and 9-amino acridine as demonstrated previously (Chaires, 1986; Das et al., 1999). These results (Fig. 4) indicated that in our experimental conditions, 7–8 bp of the left-handed Z-form were converted to bound right-handed helical form by both quinacrine and 9-amino acridine. The larger cooperativity factor for quinacrine compared with 9-amino acridine and the higher K′ value for quinacrine may reflect the influence of the extra chain in the conformational rearrangement. The results presented in Figure 6 demonstrate that quinacrine inhibited both the rate and extent of the B-to-Z transition of polydG-me5dC. A similar effect was also seen for 9-amino acridine. Gilbert et al. (1991) reported that the size of the ligand is a crucial determinant of its efficiency as an inhibitor of the B-to-Z transition and these small differences might be a direct consequence of the smaller size of 9-amino acridine compared with the quinacrine molecule. The spectrophotometric binding data of quinacrine to Z-form was cooperative in nature, as demonstrated in Figure 5. Comparative studies with 9-amino acridine also revealed a cooperative binding effect similar to quinacrine (not shown). The cooperative binding affinity of quinacrine was higher when compared with 9-amino acridine. Our data indicated that the transition may follow an allosteric model at stoichiometries of approximately one quinacrine or 9-amino acridine molecule per ∼7–8 bp. The CD results also suggested that a right-handed bound conformation is formed at the intercalation site. Thus, it is likely that the conversion of the polynucleotide from a Z-form to a right-handed bound conformation is a sequential one, so neither quinacrine nor 9-amino acridine needs to bind the Z-form. Our results indicate that both quinacrine and 9-amino acridine are efficient in inhibiting B-to-Z transition and an effecter of Z-to-B conformational transition.
HL-form DNA–drug interaction
Protonation of DNA leads to conformational changes before acid denaturation (Suresh Kumar and Maiti, 1994). Spectroscopic studies by Marck et al. (1978) suggested formation of Hoogsteen base pairs due to protonation of the N7 position of guanine and subsequent swinging to syn conformation to share the proton with the N3 of cytosine in GC polynucleotides. The duplex nature of this left-handed conformation was established and a new model of Hoogsteen base-paired left-handed duplex structure (HL-form) was proposed (Suresh Kumar and Maiti, 1994; Das et al., 1999). PolydG-me5dC is an ideal model for B-to-HL equilibrium transformation studies (Fig. 2). In solution at pH 3.4 and at 20°C, the formation of a characteristic negative CD band around 310 nm in this polynucleotide is considered to be the diagnostic feature for its isomerization to the left-handed HL conformation (Suresh Kumar and Maiti, 1994; Das et al., 1999). This conformational isomerization under the influence of low pH confirms our earlier report (Das et al., 1999) exhibiting an isoelliptic point with the B-form, indicating that two conformations of the polynucleotides coexist under these experimental conditions.
The CD spectra presented in Figure 3E showed the changes after binding of quinacrine to HL-form of polydG-me5dC structures. The results indicate a direct conversion of HL-form toward the bound right-handed form. Comparative studies with 9-amino acridine also support this argument (Fig. 3F). However, it is noteworthy that there are significant differences in the CD spectral changes in the HL-form–9-amino acridine interaction compared with the quinacrine interaction. The CD spectral changes, although reminiscent of bound right-handed conformation, exhibited ellipticity values lower than that obtained with bound form with B-form and Z-form structures. These differences can probably be due to the differences in asymmetry induced in the complex by the structural differences. The ellipticity changes at 310 nm were used to deduce the number of base pairs converted from HL-form to the bound right-handed form B-form DNA on complexation. Results indicated that in our experimental conditions, ∼4–5 bp of the HL-form were converted to the bound right-handed B-form with quinacrine, whereas about 25 bp of HL-form were converted to the bound right-handed B-form by 9-amino acridine. The reason for a higher number of base pair switching with 9-amino acridine may be due to the ease of intercalation of the structure and the higher affinity to the B-form. The spectrophotometric titration data on binding of both quinacrine and 9-amino acridine to HL-form was cooperative. The affinity of quinacrine was higher than that of 9-amino acridine. This trend is similar to the affinities with Z-form. The studies suggest that quinacrine and 9-amino acridine behave similarly in terms of their interaction with HL-form. The conversion of B-form to HL-form was very fast and it was not possible to detect whether quinacrine or 9-amino acridine could inhibit the rate and extent of formation of HL-form from B-form structure. Thus, the results showed that the energetically unfavorable HL–to–B-form transition at low pH is driven by coupling to the energetically favorable binding of quinacrine and 9-amino acridine to the right-handed conformation.
A pH-dependent enhancement of DNA binding by the ultra bithorax homeodomain has been reported by Li et al. (1996), who highlight the relevance of the protonation-induced conformation of nucleic acids in biological systems. Pozzi et al. (1992) have shown that the fusion of Epstein-Barr virus with Raji lymphoblastoid cells at low pH is significantly enhanced when compared with neutral pH. The survival of Helicobactor pylori, the major aetiological factor in chronic gastritis in humans, in a low pH environment is probably related to its pathogenicity (Colins, 1992). The influences over DNA topology of pH-regulated genes is thus of particular interest. The differential ability of various DNA conformations to interact with acridine drugs may influence their biological applications.
Conclusions
Both quinacrine and 9-amino acridine exhibit significant affinity toward the B-form structure of polydG-me5dC and the binding process is noncooperative in nature. Binding of both quinacrine and 9-amino acridine converts the left-handed Z-form and the left-handed HL-form of the polynucleotide to bound right-handed form cooperatively. Both inhibit the rate and extent of B-to-Z transition. If Z-DNA plays a significant role in different cellular processes, these results may suggest a potential mechanism by which the ligand might inhibit replicative events and gene transcription, probably leading to its usefulness as an antitumor agent.
Footnotes
Acknowledgments
The authors thank all the members of the Biophysical Chemistry Laboratory, Indian Institute of Chemical Biology, CSIR, Kolkata, for their help and cooperation during the course of this work.
Disclosure Statement
No competing financial interests exist.