
Abstract
Extracellular matrix (ECM) and cell adhesion molecule (CAM) genes are involved in the regulation of skeletal muscle development; however, their roles in skeletal muscle development in pigs are still poorly understood. 65 days postcopulation (dpc) is a critical time point in pig development. Therefore, we analyzed expression of ECM and CAM genes in the longissimus dorsi muscles at 65 dpc from Landrace (lean-type: L65), Tongcheng (obese-type: T65), and Wuzhishan pigs (miniature-type: W65) using microarray technology. A total of 35 genes were differently expressed between the breeds, and of them, 18, 18, and 20 genes, were observed in the comparisons of L65 versus T65, L65 versus W65, and T65 versus W65 (L65/T65, L65/W65, and T65/W65), respectively. In L65/T65, differently expressed genes were widely distributed, whereas in L65/W65 and T65/W65, they mostly focused on the genes encoding CAMs and ECMs proteins. Moreover, the largest number of up-regulated genes involved in skeletal muscle development was detected in L65, a moderate number in W65, and the smallest number was in T65. Cluster analysis suggested that T65 showed a more similar expression pattern to L65 than W65. In addition, we validated that five genes from microarray data were more highly expressed in the prenatal as compared to postnatal periods in Landrace and Tongcheng pigs and showed a greater range of high-level expression during gestation in Landrace than Tongcheng pigs. Our data indicated that ECM and CAM genes are differently expressed among the three breeds, and more complicated molecular events involving CAMs and ECMs were observed in Wuzhishan pigs. This study advances our knowledge of the molecular basis of phenotypic variation and provides a helpful resource for the identification of candidate genes associated with meat production traits in pigs.
Introduction
In pigs, as in other mammals, skeletal muscle development involves two different developmental phases: prenatal skeletal muscle hyperplasia and postnatal skeletal muscle hypertrophy. Prenatal skeletal muscle development involves the formation of primary and secondary myofibers: the number of these fibers is fixed before birth and remains constant after birth. Prenatal skeletal muscle development largely determines the number of muscle fibers in the adult pigs, whereas postnatal skeletal muscle development determines the muscle fiber size (hypertrophy). Thus, myogenesis is an exclusive process of prenatal skeletal muscle development. During gestation, key time points correspond to specific developmental events. At 65 days postcopulation (dpc), primary myofiber proliferation eases, and secondary myofiber morphology is detected clearly (Wigmore and Stickland, 1983). In addition, our previous study showed that more mRNA transcripts were detected at 65 dpc than other selected developmental stages, a more rapid skeletal muscle cell growth rate was found at 65 dpc in Landrace compared with Tongcheng pigs, and many differently expressed ECM and CAM genes were detected by LongSAGE analysis (Tang et al., 2007). These findings suggest that the 65 dpc is a critical time point during skeletal muscle development in pigs and requires further investigation.
Growth performance differs between pig breeds. Landrace is well known for high growth rate and lean meat content. The Tongcheng pig, a typical indigenous Chinese breed, possesses strong adaptability and superior meat quantity, but an inferior growth rate and lean meat content; in our studies, the Tongcheng pigs are considered the obese-type breed. The Wuzhishan pig is a special miniature Chinese breed with a high inbreeding coefficient that is a desirable model for human disease and medical research, and it features a high lean percentage, but a small size and a low-level of body weight and back-fat. Different genotypes cause variability in phenotypic features, and the progression of skeletal muscle development differs in different pig phenotypes. Obese-type breeds, such as Tongcheng, exhibit slow muscle growth and complicated molecular events, whereas lean-type breeds have increased cellular growth and myoblast survival (Tang et al., 2007). The molecular mechanisms underlying phenotypic variation remain poorly understood.
Previous studies mostly focused on the genome-wide analysis of molecular mechanisms of genotype-phenotype correlation and the identification of novel or differently expressed genes using microarray technology. By this approach, it is difficult to systemically investigate the effects of certain categories of functional molecules on skeletal muscle development because of the complicated molecular mechanisms involved, although it can provide a certain amount of information. Hence, it is necessary to investigate the biological events or molecular mechanisms underlying the formation of biological phenomena by focusing on specific categories of functional molecules. This strategy has been widely adopted in human cancer research, and various categories of functional microarrays have been developed (Flaim et al., 2005; Kuschel et al., 2006).
However, the effects of ECM and CAM genes on skeletal muscle development in pigs remain poorly understood. We hypothesized that these functional molecules play important roles in skeletal muscle development and the formation of phenotypic variation in pigs. To test our hypothesis, we first used Extracellular Matrix & Adhesion Molecules Gene Array (SuperArray Bioscience Corporation, Frederick, MD) to identify differently expressed genes in skeletal muscles from different pig breeds at 65 dpc. Moreover, we selected differently expressed genes related to skeletal muscle development to further investigate their changes in expression during pre-and postnatal skeletal muscle development in Landrace and Tongcheng pigs by quantitative polymerase chain reaction (qPCR). The objective of this study was to further elucidate the differences in the skeletal muscle asynchronization among Landrace, Tongcheng, and Wuzhishan pigs, gain insight into the molecular basis of different types of pig breeds underlying phenotype variation, and provide a resource for the identification of candidate genes associated with meat production traits in pigs by performing comparative analysis and identification of genes encoding ECM and CAM proteins.
Materials and Methods
Animals and sample preparation
All animals were treated in accordance with the animal procedures defined by national and local animal welfare bodies, and all animal work was approved by the Beijing and Hubei province Biological Studies Animal Care and Use Committee. The samples used in this study were specifically from the longissimus dorsi (LD) muscles from Landrace pig (nonindigenous breed), Tongcheng pig (indigenous breed), and Wuzhishan pig (miniature-pig). After copulation with boars of the corresponding breed, three dams per breed were sacrificed at 65 dpc, and three fetuses for each breed (one fetus per dam) were dissected for LD sample collection for microarray experiments. LD samples used for the comparative analysis of expression patterns in the pre-and postnatal periods were only collected from Landrace and Tongcheng pigs, because the Wuzhishan pig population is a conserved resource listed by the China Agriculture Ministry with a size that is insufficient to provide extensive samples. Prenatal samples were collected from 30 fetuses (three for each breed at each time point) at the time points 33, 45, 65, 70, and 90 dpc, whereas postnatal samples were collected from 36 individuals (three for each breed at each time point) at 0, 9, 30, 60, 120, and 160 days after birth. After dissection, all samples were immediately put into collection tubes and stored in liquid nitrogen for RNA extraction. The Extracellular Matrix & Adhesion Molecules Gene Arrays that were used in this study were purchased from SuperArray Bioscience Corporation. A total of 96 genes encoding CAMs and ECMs proteins were spotted on this microarray, including 43 CAMs (integrins, Ig molecules, selectins, cadherin, and catenins), 15 ECM proteins, 32 proteases, and 6 proteinase inhibitors.
RNA extraction and cDNA synthesis
Total RNA was extracted from approximately 100 mg LD using the Total RNA Extraction Reagent (BioTeke, Beijing, China) according to the manufacturer's protocol. The total RNA concentration was determined by spectrophotometry, and the sample integrity and quality were estimated by agarose gel electrophoresis and the OD260/OD280 ratio (between 1.8 and 2.0). After being treated with DNase I to remove the remanent genomic DNA, 1 μg total RNA was reverse-transcribed into cDNA using RevertAid™ First Strand cDNA Synthesis Kit (MBI Fermentas, Vilnius, Lithuania). The cDNA obtained was stored at −20°C for qPCR experiments.
Probe synthesis, microarray hybridization, and detection
The cDNA probes were made by reverse-transcribing a total of 500 ng total RNA with Biotin-16-dUTP (Roche, Basel, Switzerland). After denaturation at 94°C for 5 min, the labeled cDNA probes were ready for hybridization. Before hybridization, prehybridization was carried out by mixing array membranes with heat-denatured salmon sperm DNA (Invitrogen/Life Technologies, Carlsbad, CA). Then, hybridization was performed overnight at 60°C with continuous agitation at 6 rpm by mixing the pre-hybridized array membranes with a GEAhyb Hybridization Solution (SuperArray Bioscience) that contained the denatured probes. Subsequently, the array membranes were washed twice with 5 mL Wash Solution I (2 × salt-sodium citrate [SSC], 1% sodium dodecyl sulfate [SDS]) at 60°C with 30–40 rpm agitation for 15 min each and then washed twice with Wash Solution II (0.1 × SSC, 0.5% SDS) at 60°C with 30–40 rpm agitation for 15 min each. The array membranes were then blocked with GEA blocking Solution Q and detected using CDP-Star chemiluminescent substrate according to the manufacturer's protocol of the Chemiluminescent Detection Kit (SuperArray Bioscience).
Image and data acquisition, data analysis
After exposure to X-ray film, the images of array membranes were converted to a grayscale TIFF file using a desktop scanner and subsequently converted into numerical data using free ScanAlyze software. The background subtraction and data normalization were carried out using GEArray Analyzer software. Each GEArrayTM Q Series membrane was spotted with negative controls (pUC18 DNA and blanks) and housekeeping genes, including β-actin, glyceraldehyde 3-phosphate dehydrogenase (GAPDH), cyclophilin A, and ribosomal protein L13a. All raw signal intensities were corrected for background by subtracting the minimum value to avoid the appearance of negative numbers, and they were also normalized to that of a housekeeping gene. Then, these corrected and normalized signals were used to estimate the relative abundance of particular transcripts. Clustering analysis of all differently expressed genes was performed using Cluster 3.0 (Nacht et al., 2001; Tang et al., 2007) to analyze the similarity in the expression patterns among different pig breeds.
QPCR and data analysis
Primers used for qPCR experiments were designed using Oligo 6.0 software and spanned introns to minimize the negative effect of genomic DNA. All primers were shown in Table 1. The sequences (Sus scrofa) used for designing primers were acquired from NCBI GenBank, and the corresponding GenBank numbers are also shown in Table 1.
The qPCR reactions were performed using the ABI 7500 Real-Time system with SYBR® Premix Ex Taq™ II (Perfect Real Time) reagent using ROX II dye chemistry detection (TaKaRa Biotechnology, Dalian, China). The qPCR conditions were 50°C for 2 min, denaturation at 95°C for 30 s, followed by 40 cycles of denaturation at 95°C for 5 s, reannealing at 60°C for 30 s, and extension at 72°C for 34 s. The dissociation melting curve suggested the specificity of qPCR amplification of cDNA templates and the non-specificity of amplified products. Data analysis was carried out using ABI 7500 System SDS software. In this study, the internal reference gene GAPDH was used to normalize cDNA template quantity, and the 33 dpc time point was chosen to evaluate the relative expression of the target gene at various stages of skeletal muscle development. The data were presented as the fold change in gene expression normalized to the GAPDH gene and relative to the sample at 33 dpc. The relative quantification of target gene expression was calculated by comparative threshold (Ct) method and expressed as 2−ΔΔCt. The ΔCt value was determined by the internal reference gene Ct and target gene Ct (ΔCt = Ct Target − Ct GAPDH), whereas the ΔΔCt was obtained by subtracting the ΔCt of the calibrator sample from the ΔCt of the target sample (ΔΔCt =ΔCt Target − ΔCt Calibrator). Each qPCR reaction was performed in triplicate, and the data were expressed as mean ± standard error (n = 3). The statistically significant differences were detected by one-way analysis of variance using SPSS software 15.0 (SPSS, Chicago, IL), and the post hoc test was performed to analyze the significant differences among different developmental time points. The significant level was all set to 0.05 (p < 0.05).
Results
Summary of microarray analysis
In total, 35 genes were differently expressed among the three breeds, as shown in Table 2. In L65/T65, 18 differently expressed genes (10 proteases and their inhibitors, 6 CAMs, and 2 ECM proteins) were identified, including 15 that were up-regulated in L65. In L65/W65, 18 genes (12 CAMs and 6 proteases and their inhibitors) significantly differed in expression, and 12 of these were expressed at a higher level in L65. Moreover, in T65/W65, 20 differently expressed genes (12 CAMs, 5 proteases and their inhibitors, and 3 ECM proteins) were detected, including 14 that were expressed at a higher level in W65.
Genes showing twofold or greater changes (value ≥2 or ≤0.5) were identified and listed in this table. The L65/T65, L65/W65, and T65/W65 comparative analyses yielded 18, 18, and 20 differently expressed genes, respectively.
Validation for microarray data by qPCR
To validate the microarray results, we selected 10 differently expressed genes, including caveolin-1 (CAV1), catenin b1 (CTNNB1), FN1, integrin b3 (ITGB3), matrix metalloproteinases 20 (MMP20), E-selectin (SELE), L-selectin (SELL), P-selectin (SELP), and tissue inhibitors of metalloproteinases 1 and 2 (TIMP1 and TIMP2), to comparatively analyze their expression patterns by qPCR. Among these genes, ITGB3, which is involved in myogenic differentiation, and CAV1 and FN1, which play important roles in the regulation of myoblast precursor cells proliferation and differentiation, were selected for validation. Genes showing differential expression patterns (CTNNB1 and SELE) were up-regulated in Landrace and Tongcheng pigs, whereas SELL, SELP, MMP20, TIMP1, and TIMP2, which were up-regulated in Landrace and Wuzhishan pigs, were selected for validation.
As shown in Figure 1, the microarray and qPCR results were in agreement (correlation coefficient [r] = 0.97), suggesting that our microarray data were reliable, and different expression patterns of ECM and CAM genes in skeletal muscles were present among L65, T65, and W65.
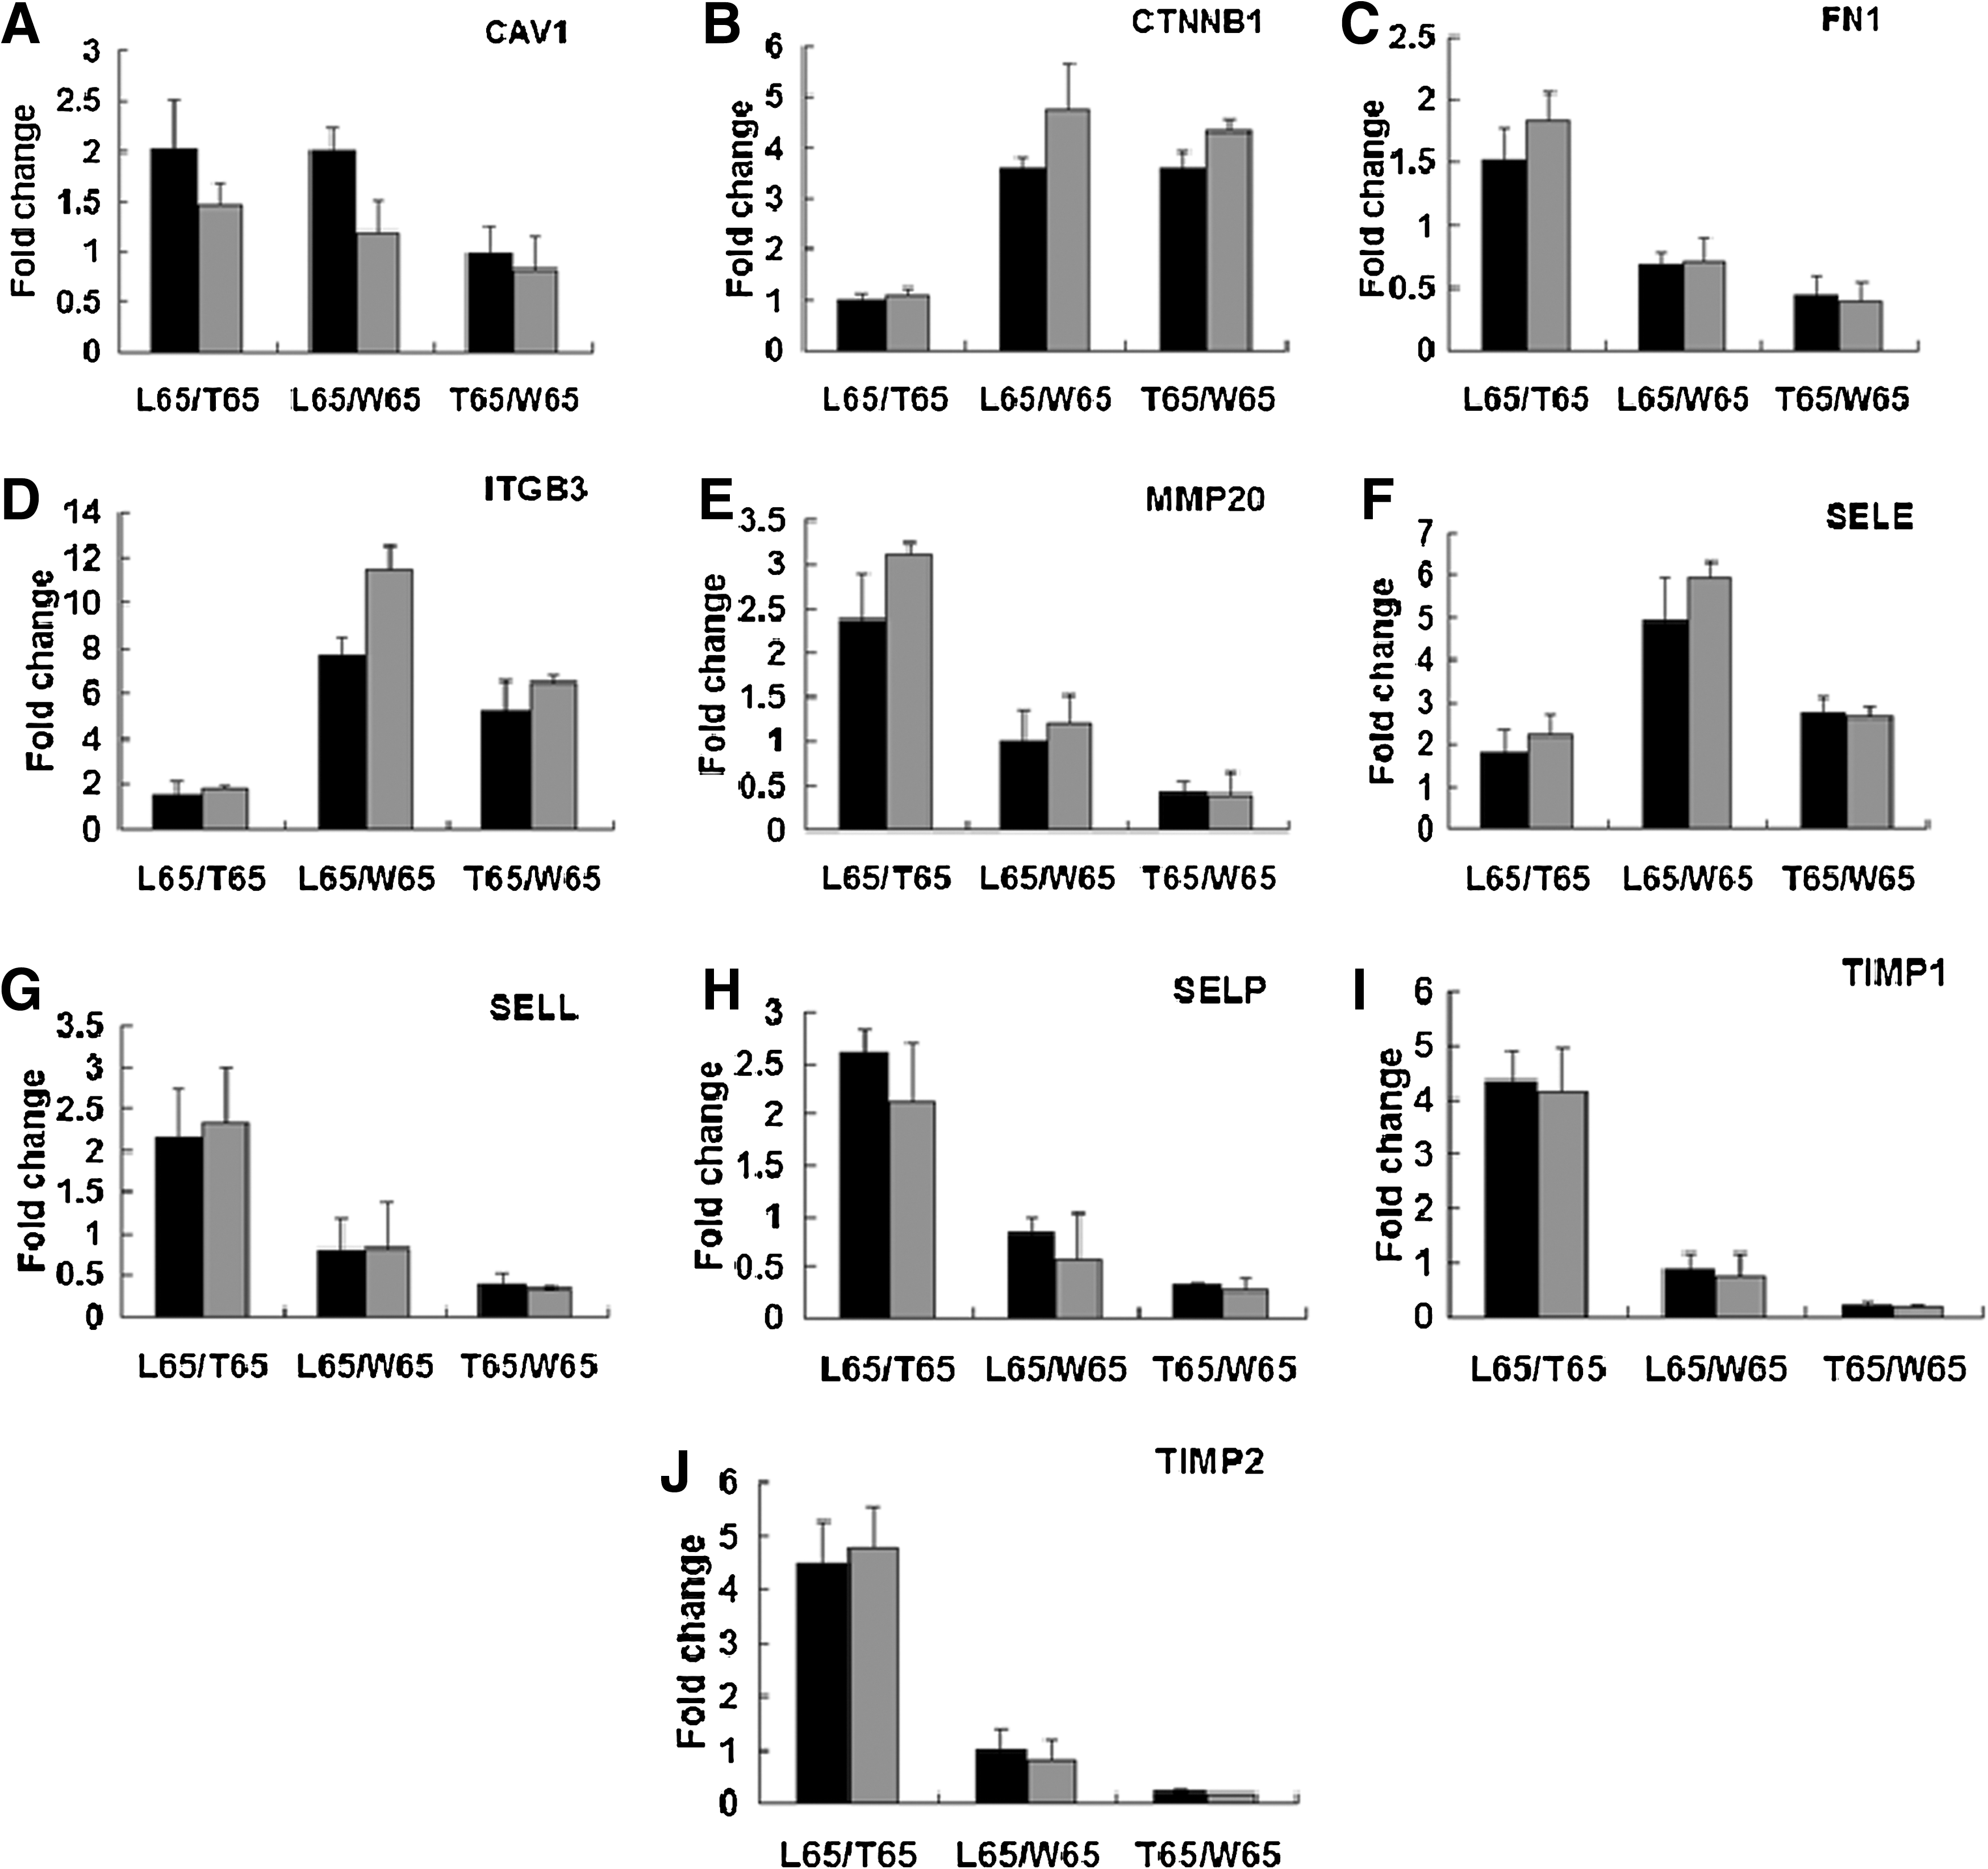
The validation of microarray data by quantitative polymerase chain reaction.
Hierarchical cluster analysis
To acquire more knowledge of the similarity in expression patterns of ECM and CAM genes among the three breeds, we peeformed cluster analysis using the Cluster 3.0 tool. As shown in Figure 2, cluster analysis indicated that L65 and T65 exhibited similar gene expression patterns, whereas Wuzhishan pigs had a different expression pattern and clustered into another group. Transcriptome analysis of the three breeds using the pig oligoarray yielded similar results (data not shown).
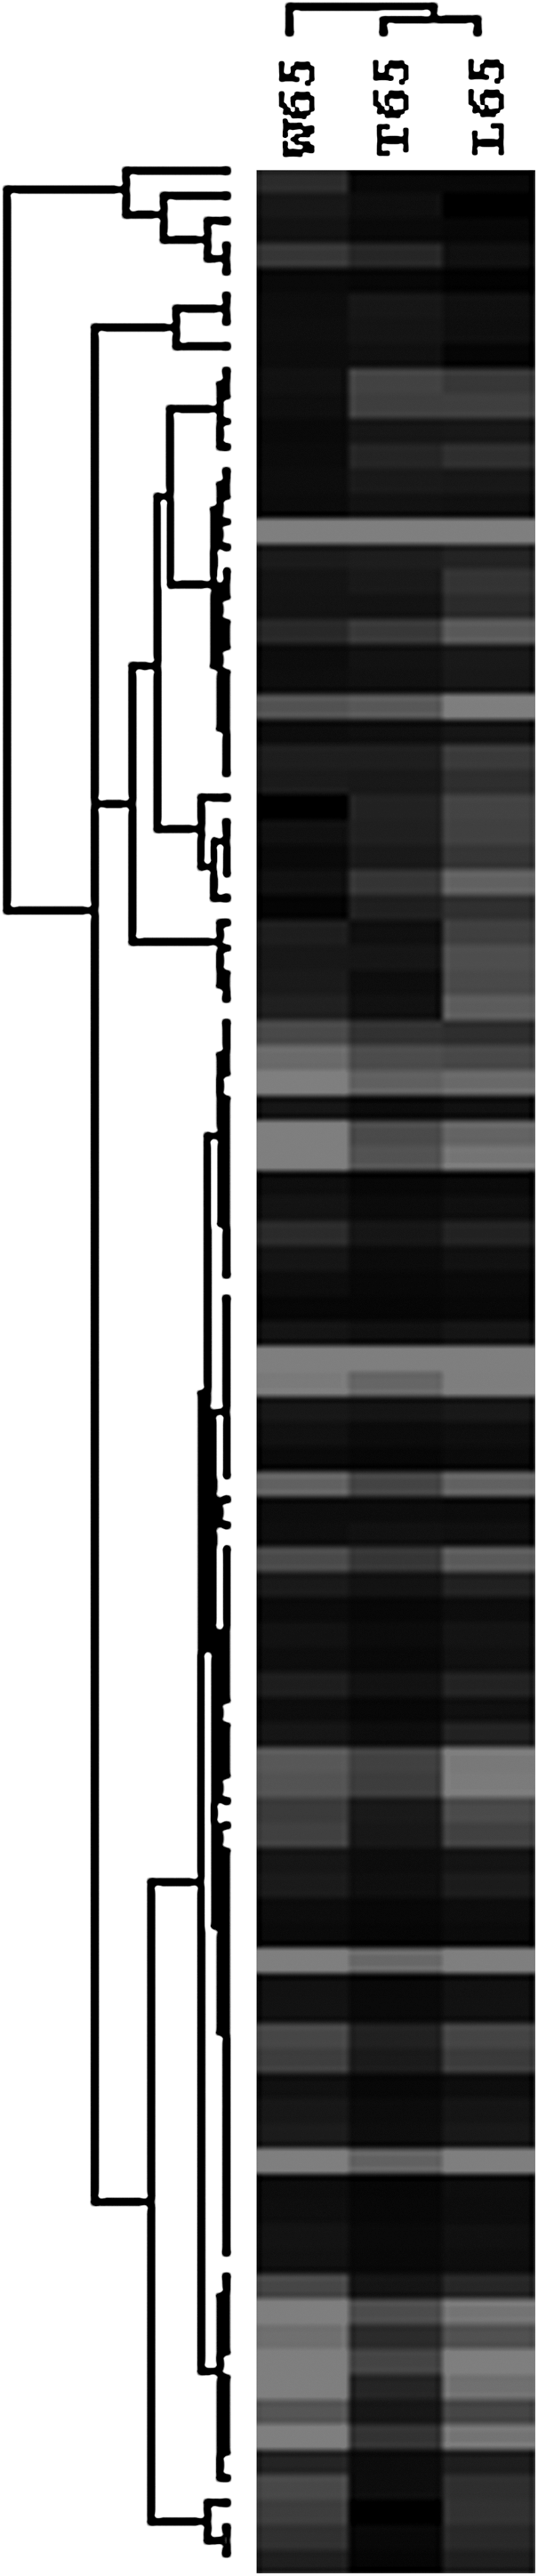
The similarity of the expression patterns of extracellular matrix and cell adhesion molecule genes among three breeds by clustering analysis. The dendrogram of expression patterns was generated using Cluster 3.0. Genes showing significantly different expression levels were included. Red and black indicated high and moderate expression levels in corresponding pig breeds, respectively.
Analysis of differently expressed genes between breeds
Cell adhesion molecules
As shown in Table 2, 18 genes encoding CAMs were differently expressed in the three groups. In L65/T65, 6 genes were differently expressed, including 4 (integrin α5 [ITGA5], NCAM1, SELL, and SELP) that were expressed at a higher level in L65 and 2 (integrin a2 [ITGA2] and catenin d1 [CTNND1]) that were expressed at a higher level in T65. In L65/W65, 12 genes were differently expressed, including 8 (integrin α7 [ITGA7], integrin α10 [ITGA10], ITGB3, CEACAM5 [CEA], catenin a [CTNNA1], CTNNB1, SELE, and CD44) in L65 and 4 more highly expressed (ITGA2, integrin a4 [ITGA4, VLA-4], integrin aM [ITGAM], and CTNND1) that were expressed at a higher level in W65. In T65/W65, 12 of 18 genes were differently expressed, including 6 (ITGA7, ITGA10, ITGB3, CTNNA1, CTNNB1, and SELE) that were expressed at a higher level and 6 (integrin a2b [ITGA2B], ITGA4, ITGA5, SELL, SELP, and CNTN1) that were expressed at a lower level in W65.
ECM proteins
In total, four genes encoding ECM proteins were identified, including CAV1, FN1, THBS2 (TSP-2), and THBS3 (TSP-3). Among these genes, CAV1 and THBS3 were up-regulated in L65 compared with T65, whereas FN1, THBS2, and THBS3 were up-regulated in W65 compared with T65.
Proteases
Among the three groups, 31.3% (10/32) genes encoding proteases were differently expressed, including MMP2 (gelatinase A), MMP3 (stromelysin-1), MMP7 (matrilysin), MMP8 (neutrophil collagenase), MMP16, MMP17, MMP20, cathepsin G (CTSG), CASP9, and cathepsin L (CTSL). In L65/T65, 6 genes (MMP3, MMP7, MMP16, MMP17, MMP20, and CTSL) were up-regulated, whereas only MMP8 was down-regulated in L65 compared with T65. In L65/W65, five genes were identified, including four that were up-regulated (MMP7, MMP16, CTSG, and CASP9) and one that was down-regulated (MMP8) in L65 compared with W65. In addition, MMP2, MMP17, and MMP20 were up-regulated in W65 compared with T65.
Protease inhibitors
We also identified 50% (3/6) of the genes that encode protease inhibitors, including PAI-1 (SERPINE1), TIMP1, and TIMP2. In L65, all of these genes were up-regulated compared with T65, whereas only PAI-1 was up-regulated compared with W65. Moreover, TIMP1 and TIMP2 were up-regulated in W65 compared with T65.
Dynamic expression of ECM and CAM genes during skeletal muscle development
We selected the ITGA7, ITGB3, CAV1, FN1, and MMP2 genes from the microarray data on the basis of differential expression patterns and functional categories to further analyze their expression patterns at 11 stages of pre-and postnatal skeletal muscle development in Landrace and Tongcheng pigs.
As shown in Figure 3, during gestation, the five genes were all highly expressed, although they showed different expression patterns between the two breeds. ITGA7 mRNA was abundant from 45 to 90 dpc in Landrace pigs, whereas two mRNA peaks at 45 and 65 dpc were followed by a trend toward a reduced expression in Tongcheng pigs. CAV1 showed an expression pattern similar to that of ITGA7 in Landrace pigs, whereas in Tongcheng pigs, there was a significant decline at 90 dpc after an initial ascent from 33 to 70 dpc (an mRNA peak at 70 dpc). Nearly the same expression pattern of FN1 was observed in both breeds, with an mRNA peak at 33 dpc followed by a significant decline, except for a significant difference between 70 and 90 dpc in Tongcheng pigs. ITGB3 showed an mRNA peak at 65 dpc followed by an increase at 90 dpc after a decline at 70 dpc in Landrace pigs; in Tongcheng pigs, it showed an mRNA peak at 45 dpc followed by a decline. A peak of MMP2 mRNA was detected at 45 dpc in both Landrace and Tongcheng pigs, but the minimum level was detected at 70 dpc followed by an increase at 90 dpc in Landrace pigs, whereas in Tongcheng pigs, the minimum level was detected at 90 dpc after a gradual decline. In all, all five genes showed significantly higher mRNA levels during gestation than after birth in both Landrace and Tongcheng pigs. Additionally, all the five genes showed a greater range of high mRNA levels in Landrace than Tongcheng pigs.

The expression patterns of ITGA7, CAV1, FN1, ITGB3, and MMP2 in Landrace and Tongcheng pigs.
During the postnatal period, the mRNA levels of all five genes were significantly decreased, and only ITGA7 and CAV1 showed different expression patterns. The expression of ITGA7 was significantly different at 60 days after birth compared with that at birth in Landrace pigs, whereas in Tongcheng pigs, its expression level remained constant from birth to 30 dpc after birth and significantly declined at 60 dpc after birth. The level of CAV1 mRNA decreased at 30 days after birth in Landrace pigs, whereas Tongcheng pigs showed a reduced expression at 60 days and an increased expression at 120 days after birth.
Discussion
Our previous study confirmed differential molecular events between Landrace and Tongcheng pigs during skeletal muscle development and a more rapid growth rate of skeletal muscle cells in Landrace compared with Tongcheng pigs (Tang et al., 2007). In the present study, we further investigated the molecular events related to skeletal muscle development in different pig breeds by focusing on ECM and CAM genes using microarray technology. In total, 35 differently expressed genes were identified, including all four categories of functional molecules, and qPCR validation for 10 differently expressed genes indicated the reliability of our microarray results. In addition, cluster analysis suggested that Tongcheng pigs exhibited a more similar expression pattern to Landrace than Wuzhishan pigs.
Our data showed that CAM genes that were differently expressed included integrins, Ig molecules, cadherins, catenins, and selectins, but only four ECM genes were identified. ITGA7, ITGA10, ITGB3, CTNNA1, and CTNNB1 were up-regulated in L65 and T65 compared with W65, whereas ITGA4 was up-regulated inW65. ITGA7, which is mainly expressed in skeletal and cardiac muscles, plays a critical role in the regulation of myoblast proliferation and the formation of secondary myotubes (Gu et al., 1994), and it also provides a linkage system to maintain skeletal muscle structure (Liu et al., 2008). ITGB3 is involved in the regulation of myogenic differentiation (Tomczak et al., 2004). ITGA7 and ITGB3 all showed a greater range of high mRNA levels in the gestation period in Landrace than Tongcheng pigs, but no significant difference between the two breeds in the postnatal period. CTNNA1, a gene encoding cytoskeletal proteins, is involved in skeletal muscle development (Sadkowski et al., 2008), and CTNNB1 is essential for skeletal myogenesis involving hypertrophy (Armstrong and Esser, 2005). ITGA4, which is expressed in primary and secondary myotubes, plays an important role in secondary myogenesis (Rosen et al., 1992). Moreover, ITGA5, SELE, SELL, and SELP were up-regulated in L65 and W65. ITGA5 is involved in muscle cell proliferation or differentiation depending on integrins' alpha subunit ratios (Sastry et al., 1996; Tomczak et al., 2004), SELE is involved in the regulation of angiogenesis in ischemic muscle (Oh et al., 2007), SELL can enhance the skeletal muscle cell migration ability (Galvez et al., 2006), and SELP is involved in the regulation of skeletal muscle reperfusion injury (Kyriakides et al., 2000). ITGA2, which is widely expressed in cell types entering the final stage of differentiation (Wu and Santoro, 1994), was up-regulated in T65 and W65. CD44, which is involved in the regulation of myoblast proliferation and differentiation in early myogenesis (Mylona et al., 2006), was up-regulated in L65. CAV1 was more highly expressed in L65 than in T65 and W65, whereas FN1 and THBS2 were more highly expressed in W65 than L65 and T65. CAV1, expressed in skeletal muscle satellite cells, is involved in the activation of mitogen-activated protein kinases in skeletal muscle cells (Buitrago and Boland, 2010). FN1 participates in the regulation of myoblast precursor cell proliferation and fibroblast-like myo-cell differentiation (von der Mark and Ocalan, 1989; Osses and Brandan, 2002b), the degradation or alteration of which is required for myoblast fusion (Dourdin et al., 1997). CAV1 and FN1 all showed significantly higher mRNA levels in the prenatal than postnatal periods, and only CAV1 showed a greater range of high mRNA levels in Landrace than Tongcheng pigs in the gestation period. THBS2 plays an important role in the regulation of cell attachment in C2C12 skeletal myoblasts (Anilkumar et al., 2002). These results suggest that, at 65 dpc, skeletal muscle cell growth vitality related to CAMs and ECMs was higher in Landrace than Tongcheng and Wuzhishan pigs.
MMPs have been implicated in the process of proper ECM remodeling, whereas TIMPs, as endogenous inhibitors of MMPs, regulate MMPs activities. The two proteinases with opposite functions play important physiological roles in maintaining the integrity of muscle fibers and homeostasis of the extracellular environment, especially in the regeneration of skeletal muscle. MMP2, which participates in cell migration (Giannelli et al., 1997; Koshikawa et al., 2000) and mediates the activation of skeletal muscle satellite cells (Yamada et al., 2008), was more highly expressed in W65 than in T65. It also showed a greater range of high mRNA levels in Landrace than Tongcheng pigs during gestation, but no significant difference in the postnatal period in the both pig breeds. However, MMP3 and CTSL were more highly expressed in L65 than T65. MMP3 enhances cell proliferation, migration, and survival (Zheng et al., 2009) and induces the infiltration of fibroblasts into gastrocnemius muscle (Ogawa et al., 2005), whereas CTSL is involved in skeletal muscle metabolism (Yamazaki et al., 2010). MMP7, MMP16, and PAI-1 were more highly expressed in L65 than T65 and W65. MMP7 helps myoblast transplantation (Caron et al., 1999), and MMP16 is expressed in coordination with other MMPs in bovine skeletal muscle (Balcerzak et al., 2001), whereas PAI-1 and uPA maintain the homeostasis of muscle fibers and their surrounding ECM (Suelves et al., 2005). CASP9, which is involved in myoblast apoptosis, was more highly expressed in L65 than W65 (Ho et al., 2004). In addition, the expression levels of TIMP1 and TIMP2 were significantly higher in L65 and W65 than in T65. TIMP-1 and TIMP-2 inhibit the activities of all known MMPs in vitro with different binding affinities (Goldberg et al., 1989), including inhibiting the degradation of MMP2 by forming complexes with proMMP2 (Kolkenbrock et al., 1991), and they independently regulate myoblast differentiation during myogenesis (Lluri and Jaworski, 2005). The skeletal muscle cell growth vitality related to MMPs and TIMPs at 65 dpc was highest in Landrace pigs, moderately higher in Wuzhishan pigs, and lowest in Tongcheng pigs.
Our microarray results showed that the largest number of genes involved in skeletal muscle development was up-regulated in L65, a moderately large number was up-regulated in W65, and the smallest number of up-regulated genes was detected in T65. These differential transcriptome patterns were specific to the pig breeds: higher expression levels corresponded to the lean-type breeds (Landrace and Wuzhishan pigs), whereas lower expression levels was corresponded to the obese-type breed (Tongcheng pig) with a lower growth rate and lean meat content, which is supported by the findings of a recent study that more muscular pig breeds exhibited more intense myogenesis in the late gestation period (Cagnazzo et al., 2006). In addition to the above-mentioned genes, the following genes were also differentially expressed among L65, T65 and W65: ITGA2B, ITGAM, CEACAM5, NCAM1, CTNND1, CNTN1, SELE, THBS3, MMP8, MMP17, MMP20, and CTSG. Many of these genes participate in the regulation of disease susceptibility, neural adhesion, inflammatory response, immune response, tumor metastasis, atherosclerosis, osteogenesis, and angiogenesis, although their effects on skeletal muscle development are not defined. Whether or not these genes are involved in the regulation of skeletal muscle development is should be investigated further. Additionally, in our microarray data, it is worth noting that all differently expressed genes in L65/T65 were widely distributed in the four functional categories (CAMs, ECMs, MMPs, and TIMPs), whereas in L65/W65 or T6/W65, most of the differently expressed genes encode CAM and ECM proteins, and only a few genes encode MMPs and TIMPs, although the number of differently expressed genes in the three groups was nearly equal. These differences may be due to the miniature pig breed (Wuzhishan pig) with a high inbreeding coefficient, whereas Landrace and Tongcheng pigs possess large bodies, suggesting that specific molecular events are presumably present in Wuzhishan pigs that require further investigation. These results will be beneficial to further elucidate the molecular mechanisms of skeletal muscle development asynchronization in pigs that may underly phenotypic variation.
In our qPCR data, we found that the transcriptome differences of genes encoding CAM and ECM proteins also occurred during pre-and postnatal skeletal muscle development. However, these transcriptome differences mostly focused on prenatal skeletal muscle development. The high expression of these five genes was more widely distributed during gestation in Landrace than Tongcheng pigs, suggesting that Landrace pigs exhibited a greater range of high skeletal muscle cell growth involving ECM and CAM genes during gestation than Tongcheng pigs that contributes to significant differences in myofiber numbers and ultimately determines phenotypic variation. Although differential expression levels were observed between the two breeds, the expression patterns of these genes during gestation (at 33 dpc, low mRNA levels of ITGA7, CAV1, MMP2, and ITGB3 genes, whereas high FN1 and MMP2 mRNA levels; from 45 to 90 dpc, all five genes exhibiting high mRNA levels; after birth, all five genes exhibiting a significantly reduced expression) were developmentally regulated, corresponding to the progression of prenatal skeletal muscle development involving intense cell adhesion and migration. Primary myofibers emerge first around 30 dpc, reaches maximum number at 60 dpc, and remains unchanged until 80 dpc, whereas secondary myofibers form from 54 to 90 dpc; myofibers formation eases between 85 and 90 dpc (Wigmore and Stickland, 1983; Te Pas et al., 2005). After birth, the mRNA levels of all five genes decreased significantly and were maintained at low levels, corresponding to the change from prenatal skeletal muscle hyperplasia to postnatal hypertrophy, accompanied with a strong reduction in skeletal muscle cell proliferation, differentiation, and fusion. Despite their expression pattern asynchronization, all five genes showed high-level expression at critical stages of gestation involving strong skeletal muscle cell proliferation, differentiation, and fusion, supporting their involvement in the regulation of skeletal muscle cell adhesion and migration, although their effects on skeletal muscle development are still poorly understood in pigs. Additionally, the significantly higher mRNA levels in prenatal compared to postnatal skeletal muscles in both pig breeds suggest that ECM and CAM genes are mainly involved in the regulation of prenatal rather than postnatal skeletal muscle development because of the limited cell proliferation, differentiation, and fusion after birth. However, although postnatal skeletal muscle is terminally differentiated, a small quantity of muscle progenitor cells (satellite cells) still lies between muscle fibers and the basal lamina (Husmann et al., 1996; Sabourin and Rudnicki, 2000). Therefore, low-level ECM and CAM gene expression may continually regulate satellite cell proliferation and subsequent incorporation into myofibers during the regeneration process (Rehfeldt et al., 2000) or maintain tissue homeostasis at postnatal stages of skeletal muscle growth (Adams and Watt, 1993; Damsky et al., 1997).
Conclusion
In conclusion, this study provides information that helps understand the effects of ECM and CAM genes on skeletal muscle development in pigs. During myogenesis, ECM and CAM genes showed different expression patterns are correlated with the specific types of pig breeds, and unusual molecular events are presumably present in Wuzhishan pigs. Moreover, ECM and CAM genes exhibited significantly higher mRNA levels in the prenatal than postnatal periods in both Landrace and Tongcheng pigs and showed a greater range of high-level expression during gestation in Landrace pigs. This study provides a substantial basis for the identification of candidate genes associated with meat production traits in pigs and functional genes associated with human diseases. Although the comparative analysis was only performed on the mRNA level, studies of ECM and CAM genes at the protein level and with histomorphology assays will contribute to the further elucidation of the effects of these genes on skeletal muscle development and the molecular mechanisms underlying phenotypic variation in pigs.
Footnotes
Acknowledgments
We are very grateful to Shutang Feng in IAS, CAAS, and Sanping Xu in the Husbandry Bureau of Tongcheng County for help in animal material collection. This research was supported by the National Key Scientific Program (2009CB011600), the National Natural Science Foundation of China (30830080, 30700569), the National Key Project (2008ZX08009-001), and the Project of Science and Technology Innovation Team “Research and Improvement of Domestic Animal Germplasm,” Institute of Animal Science, Chinese Academy of Agricultural Science (ywf-td-1).
Disclosure Statement
No competing financial interests exist.