
Abstract
The flap endonuclease-1 (FEN-1) gene is involved in DNA replication and repair, and it maintains genomic stability as well as the accuracy of DNA replication under normal growth conditions. However, FEN-1 also plays an important role in apoptosis and cancer development. We cloned the BmFEN-1 gene from Bombyx mori, which was 1343 bp in length and possessed an 1143 bp ORF (123–1266). It consists of seven introns and eight exons that encode a protein with 380 amino acids that has the typical XPG domain. The N-terminal motif is located at amino acids 95–105, and the proliferating cell nuclear antigen interaction motif is located at amino acids 337–344. RNA interference-mediated reduction of BmFEN-1 expression induced cell cycle arrest in S phase in BmE-SWU1 cells. These results suggest that BmFEN-1 can inhibit apoptosis and promote cell proliferation.
Introduction
Material and Methods
Cell line and Bombyx mori
The Bombyx mori embryo cell line BmE-SWU1 (Pan et al., 2007) was cultured in Grace medium containing 10% fetal bovine serum at 27°C. The Bombyx mori DaZao strain larvae were bred with fresh mulberry leaves at 25°C with a 12 h:12 h photoperiod.
Bioinformatics analysis
The databases used for the Bo. mori genomic information included the Bo. mori 9X genomic sequencing database, Bombyx mori EST database (CDS), and the predicted protein database (all found at
RNA extraction and cDNA preparation
Total RNA was extracted from normal BmE-SWU1 cells using Trizol reagent (Invitrogen). The concentration of RNA was calculated by spectrophotometry (Gene Spec V; HITACHI). DNA contamination in the RNA samples was digested with RNase-free DNase I. The first strand of cDNA was synthesized using M-MLV Reverse Transcriptase and 1 μg/μL RNA according to the manufacturer's instructions (Promega).
Preparation of cDNA from cells and larval tissues
Total RNA was isolated from BmE-SWU1 cells and larval tissues (including the hemocyte, malpighian tubule, epidermis, fat body, silk gland, head, testis, ovary, and midgut) on the third day of the fifth instar using Tripure isolation reagent (Invitrogen) according to the manufacturer's instructions. The concentration of RNA was calculated by spectrophotometry (Gene Spec V; HITACHI). cDNA was synthesized from the total RNA samples with a cDNA Synthesis Kit (Promega) according to the manufacturer's instructions.
Cloning the BmFEN-1 gene
The BmFEN-1 primers for polymerase chain reaction (PCR) were designed based on the coding sequences of putative BmFEN-1 genes (Zhang et al., 2010). The sequences of the primers were as follows: forward primer (5′ CATATGTCAGCTGTCCAAATTGCA 3′) and reverse primer (5′ ACAGTTGTCAAAGCCGAAAATGGG 3′). PCR amplification was performed in a total reaction volume of 25 μL containing normalized cDNA (6 μg cDNA for the reaction, with the exception of BmActin3, which used 3 μg cDNA), 1 μL of 15 pmol of each primer, 2 μL of 2 mM MgCl2, 1 μL of 0.25 mM dNTP, 2.5 μL of 1X buffer, 2.5 units of Taq DNA polymerase, and distilled deionized H2O. PCR was performed as follows: initial denaturation at 94°C for 3 min, followed by 25 cycles of 30 s each at 94°C, 30 s annealing at 60°C, 90 s extension at 72°C, and a final extension at 72°C for 10 min. The amplification products were analyzed on 1% agarose gels. The DNA bands were extracted using Qiaex II gel extraction kit (Qiagen) and subcloned into the pGEM-T easy vector (Promega). The cloned insert was sequenced on an ABI PRISM™ 310 Genetic Analyzer (PE Applied Biosystems).
Sequence analysis of BmFEN-1
The exon and intron structures of BmFEN-1 were predicted by Sim4 (
BmFEN-1 expression analysis
The expression of BmFEN-1 was detected by reverse transcriptase (RT)-PCR using a PCR kit (Takara). RT-PCR was performed using primer pair P1 and P2 with 300 ng cDNA template from larval tissues on the third day of the fifth instar. RT-PCR was performed under the following conditions: denaturation at 94°C for 3 min, followed by 30 cycles of 94°C for 30 s, 60°C for 30 s, and 72°C for 90 s, and a final extension at 72°C for 10 min. Primers (forward: 5′ AACACCCCGTCCTGCTCACTG 3′, and reverse: 5′ GGGCGAGACGTGTGATTTCCT 3′) were used for amplifying the silkworm actin-3 gene as an internal control. Products were visualized on a 1% agarose gel stained with ethidium bromide and detected on a Gel Doc 2000 (BIO-RAD).
Ultraviolet-induced apoptosis in BmE-SWU1 cells
BmE-SWU1 cells were digested with 0.25% trypsin in the logarithmic growth phase, seeded in 12-well plates with approximately 1 × 10⁴ cells per well, and cultured at 28°C. When the cells reached the logarithmic growth phase again, they were washed twice with phosphate-buffered saline (PBS) and then exposed to ultraviolet (UV) radiation for 3 min with a vertical distance of 40 cm. The cells were then cultured under normal conditions and collected after 24 h.
MTT assay
The supernatant was carefully removed after the cells were exposed to UV and cultured for an additional 24 h in normal conditions. Two hundred microliters of 0.5% MTT (Sigma) was then added per well, and the cells were cultured for an additional 4 h at 28°C. The MTT solution was then removed, 200 μL dimethyl sulfoxide was added to each well, and the plates were shaken at low speed for 10 min. The absorbance (A value) was detected immediately at a wavelength of 492 nm using an automatic microplate reader (iMark; Bio-Rad). Cell proliferation was calculated, and each group was repeated in triplicate. The cell survival rate was calculated based on the A value, where the cell survival rate (%) = (experimental group A value/control group A value) × 100.
After the cells were exposed to UV radiation, the cells were fixed with fixative solution and maintained at room temperature for 10 min or at 4°C overnight. The fixative solution was then removed, and the cells were washed twice with PBS, each time rocking the plates gently for 2–3 min. The PBS was then removed, and 5 mg/L Hochest33258 staining solution (Sigma) was added to the cells for 10 min while being protected from light. The cells were then washed with distilled water and dried. The result of the Hochest33258 staining was observed under fluorescence microscopy (BX51; OLYMPUS) with an excitation wavelength of 364 nm.
DNA ladder assay
Apoptosis DNA ladder kits were purchased from the BiYunTian Company (Biyuntian, China). DNA ladder analysis was performed according to the manufacturer's instructions. A portion of the cell genomic DNA was used for electrophoretic analysis on a 1% agarose gel.
Double-stranded RNA preparation
Double-stranded RNA (dsRNA) was synthesized using the RibomaxTM Large Scale RNA Production System-T7 and RibomaxTM Large Scale RNA Production System-SP6 (Promega) based on the BmFEN-1 gene amplified with primers P1 (5′ GTAATACGACTCACTATAGGGAGATATGGATGCCCTAACCTTTG 3′) and P2 (5′ GTAATACGACTCACTATAGGGAGATCCGCCTCCTGTCTTAGTTT 3′). The sense and antisense RNAs were mixed, digested, and precipitated to obtain dsRNA.
RNA interference
FuGENERHD Transfection Reagent (Roche) was used for transfection following the manufacturer's instructions. The dsRNA was diluted to 2μg/100 mL with dilution reagent, and then the FuGENERHD Transfection Reagent was added to form a transfection complex. The mixture was incubated at room temperature for 45 min and then added to the cells. Transfected cells were collected and divided into three groups: normal control, transfection reagent alone (18 μL of transfection reagent), and dsRNA transfection (18 μL transfection reagent plus 3 μL dsRNA) with each group triplicated.
Quantitative PCR
Fluorescent quantitative PCR was performed on an ABI Prism 7000 Sequence Detection System (Applied Biosystems). Specific primers were designed based on the BmFEN-1 gene sequence. The forward primer was (5′ TGAAGAACGAGTGAGGAATGGAGC 3′) and the reverse primer was (5′ CACAGTAATCACAGCCAAGGAGTATG 3′). PCR amplification yielded a 146 bps product. Bmactin-3 was used as a housekeeping gene for comparison, with a forward primer of (5′ CACAGTAATCACAGCCAAGGAGTATG 3′) and reverse primer of (5′ CACAGTAATCACAGCCAAGGAGTATG 3′). PCR amplification of Bmactin-3 yielded an 89 bp product. The PCR amplification system was performed using the SYBRRPremix Ex Taq™ kit (Takara). The fluorescent quantitative PCR reaction consisted of 12.5 μL 2X PCR buffer, 50X ROX, 0.5 μL reference dye, 0.5 μL of 0.2 μM forward primer, 0.5 μL of 0.2 μM reverse primer, 2 μL cDNA, and RNase free ddH2O up to a total volume of 20 μL. The PCR conditions were 95°C for 10 s followed by 40 cycles of 95°C for 5 s. The data were analyzed with the relative quantitative method by Livak and Schmittgen (2001).
Cell cycle analysis
The cells from each group were collected and washed twice with PBS. The supernatant was then discarded, and 1 mL 70% cold ethanol was added. The cells were pipetted up and down, fixed for at least 48 h at 4°C, and then washed with PBS to remove the ethanol. The cells were then centrifuged for 5 min at 1000 rpm, and the wash procedure was repeated. Ten mg/mL RNase A was then added to a final concentration of 100 μg/mL, and the cells were stained at room temperature for 30 min. Propidium iodide was then added to a final concentration of 10 μg/mL, and the cells were stained for 30 min at 4°C while being protected from light. The cell cycle was analyzed by flow cytometry (BD FACSAria).
Results
Cloning and sequence analysis of the silkworm FEN-1 gene
The cDNA obtained from the silkworm embryo cells was used as the template for the PCR amplification performed. The amplified fragment was about 1300 bps in length and identical to the predicted size. The amplified fragment was ligated into the PMD18-T cloning vector, and positive clones were selected by blue-white screening. The sequence of positive clone selected was identical to the predicted gene sequence (Fig. 1).

Nucleotide and deduced amino acid sequences of BmFEN-1. The sequences underlined in black represent the forward and reverse primers for the entire clone. The sequences underlined in purple represent the forward and reverse primer of the RNAi fragment. The XPGN, XPGI, and HhH2 domains are indicated by green, red, and blue amino acid residues, respectively. Color images available online at
The cloned fragment of the BmFEN-1 gene (GenBank Accession No. FJ844436) was 1343 bps in length, and the complete ORF (ORF: 123–1266) was 1143 bps in length. Alignment of the coding sequence of the BmFEN-1 gene to silkworm genomic sequences using the Sim4 program showed that the BmFEN-1 gene had 8 exons. The boundaries of the exons and introns followed the GT-AG rule (Table 1). The BmFEN-1 gene encodes 380 amino acids, and the predicted molecular weight is 42.7 kD with an isoelectric point of 8.98. Alignment of the protein sequence with the BLAST program (
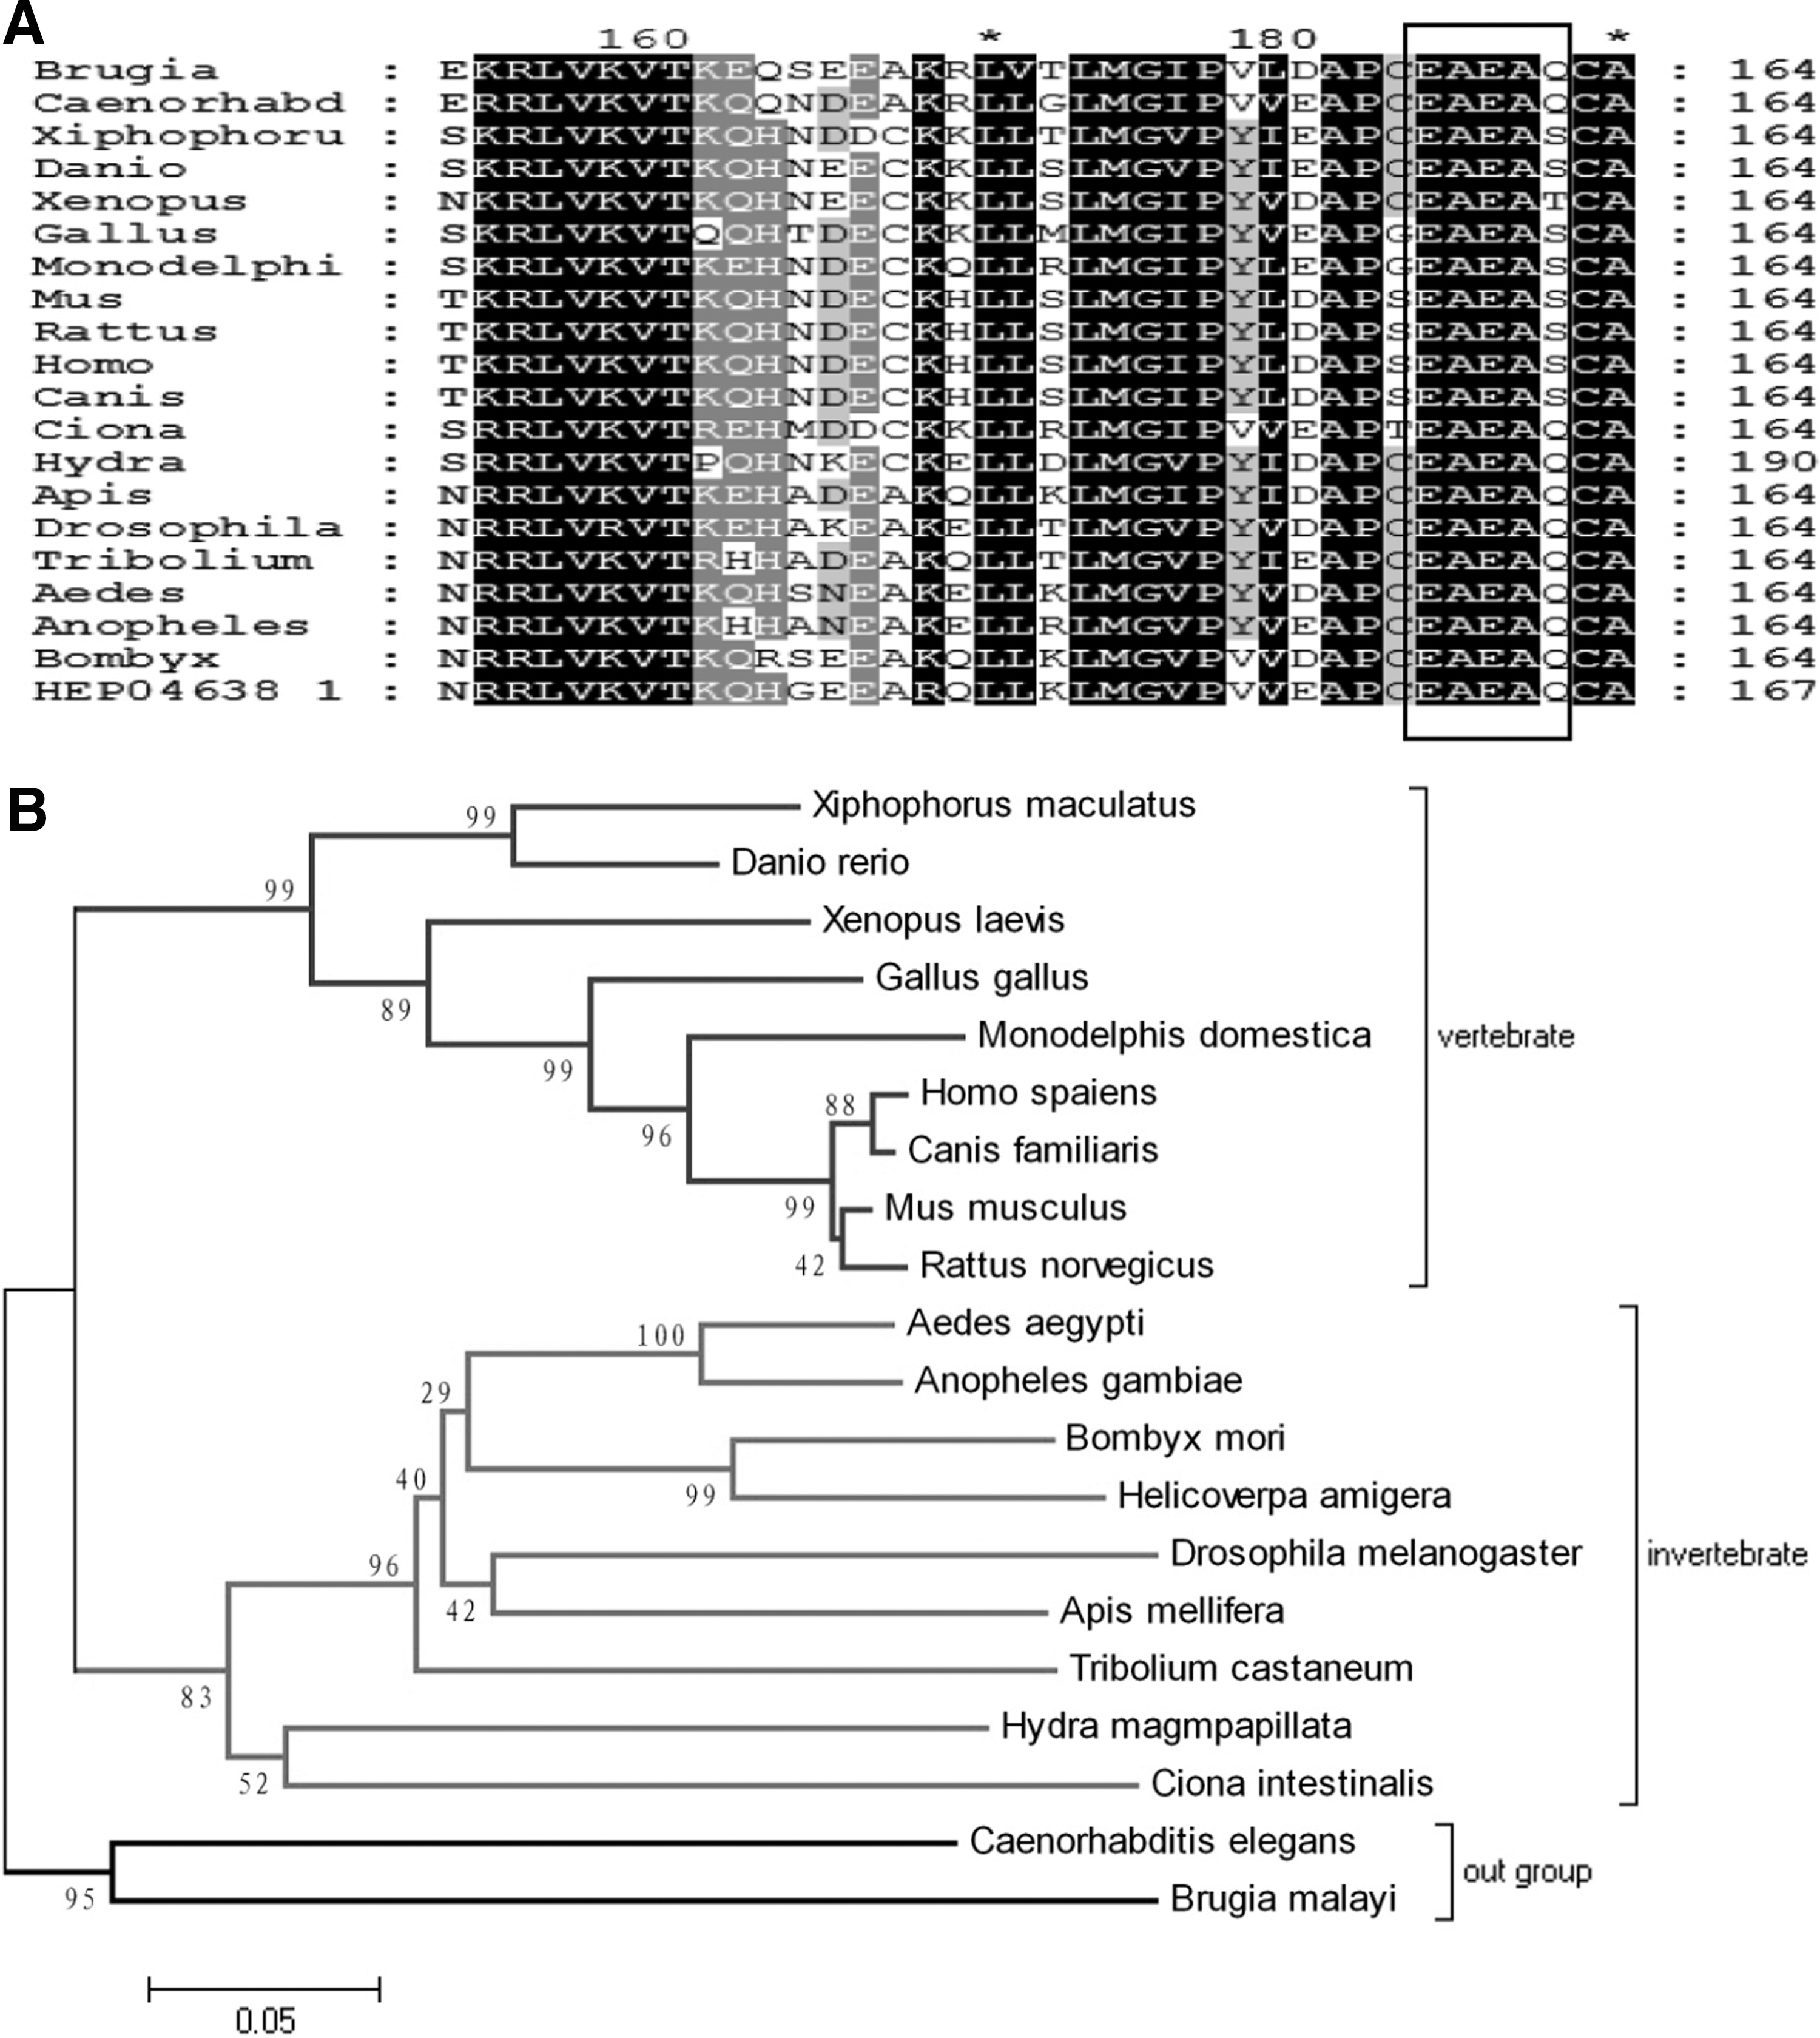
Multi-sequence alignment and phylogenetic analysis of FEN-1. The blasted sequences for FEN-1 are shown in the following order: Brugia malayi, Caenorhabditis elegans, Xiphophorus maculates, Danio rerio, Xenopus laevis, Gallus gallus, Monodelphis domestica, Mus musculus, Rattus norvegicus, Homo sapiens, Canis familiaris, Ciona intestinalis, Hydra magnipapillata, Apis mellifera, Drosophila melanogaster, Tribolium castaneum, Aedes aegypti, Anopheles gambiae, Bombyx mori, and Helicoverpa amigera. Identical residues are shown in black, and similar residues are shown in gray. The dark frame shows the pentapeptide. The cladogram was drawn using MEGA4.0 software and the adjunction method. The node points represent the percentage of node points in 1000 bootstraps values.
Expression of FEN-1 in the tissues and organs of Bombyx mori
Primers specific for the FEN-1 gene were used to amplify cDNA from all tissues and organs of Bombyx mori. The actin-3 gene was also amplified as an internal control. The electrophoresis results showed that the BmFEN-1 gene was expressed in all silkworm tissues and organs (Fig. 3). The highest expression was observed in the head, followed by the silk gland, and relatively low in the body wall and ovary (Fig. 3).
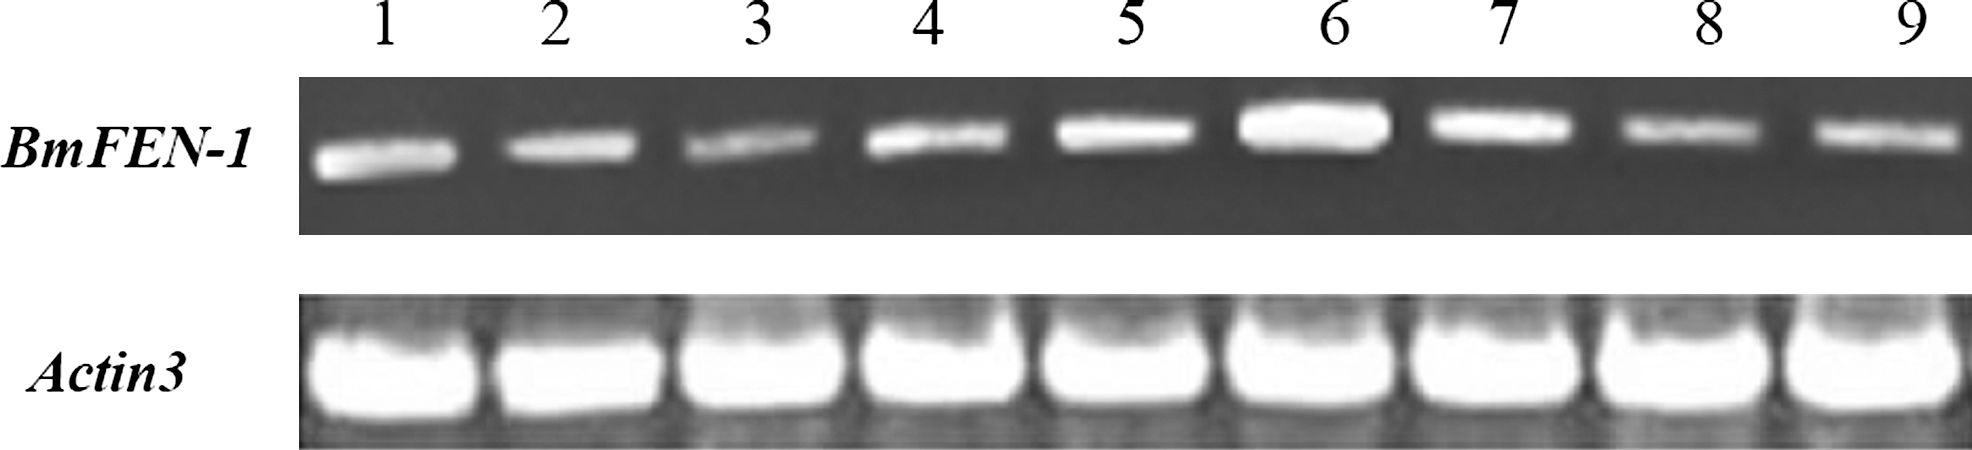
Tissue expression profile of the BmFEN-1 gene on the third day in the fifth-instar silkworm. 1. Hemocyte, 2. Malpighian tubule, 3. Epidermis, 4. Fat body, 5. Silk gland, 6. Head, 7. Testis, 8. Ovary, and 9. Midgut.
Induction of apoptosis by UV irradiation in BmE-SWU1 cells
BmE-SWU1 cells were exposed to midwave ultraviolet (UV) radiation and exhibited typical features of apoptosis. Apoptotic bodies were observed in 44% of cells that were stained with Hochest33258 under a fluorescence microscope (Fig. 4A, B). In addition, the DNA ladder analysis showed that the genomic DNA was fragmented in UV-treated cells (Fig. 4C). These results indicated that the BmE-SWU1 cells underwent apoptosis after UVB irradiation and showed that this method was sufficient for analyzing apoptosis mechanisms in these cells.
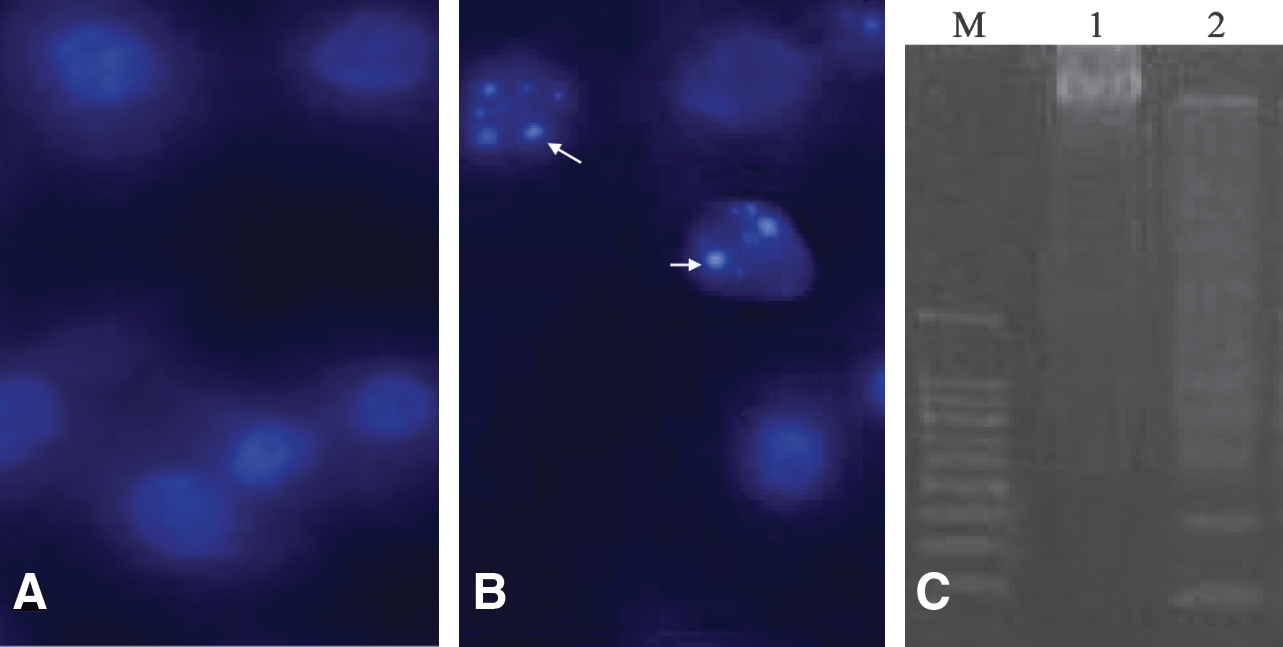
Apoptosis characteristics of BmE-SWU1 cells irradiated by UV.
RNA interference effectively reduces FEN-1 expression in BmE-SWU1 cells
The primers for quantitative PCR were designed according to the cDNA sequences obtained for the BmFEN-1 gene. The cDNA from the normal BmE-SWU1 control group and the dsRNA (BmFEN-1) transfected group of BmE-SWU1 cells were used as templates, respectively. The silkworm actin-3 gene was used as an internal control. PCR amplification was performed by fluorescence quantitative PCR. The results of the PCR showed that the gene transcription level of FEN-1 in the dsRNA (BmFEN-1) transfected group was only 5.34% of the control group (Fig. 5). These results indicated that RNA interference (RNAi) treatment effectively reduced BmFEN-1 expression in BmE-SWU1 cells.
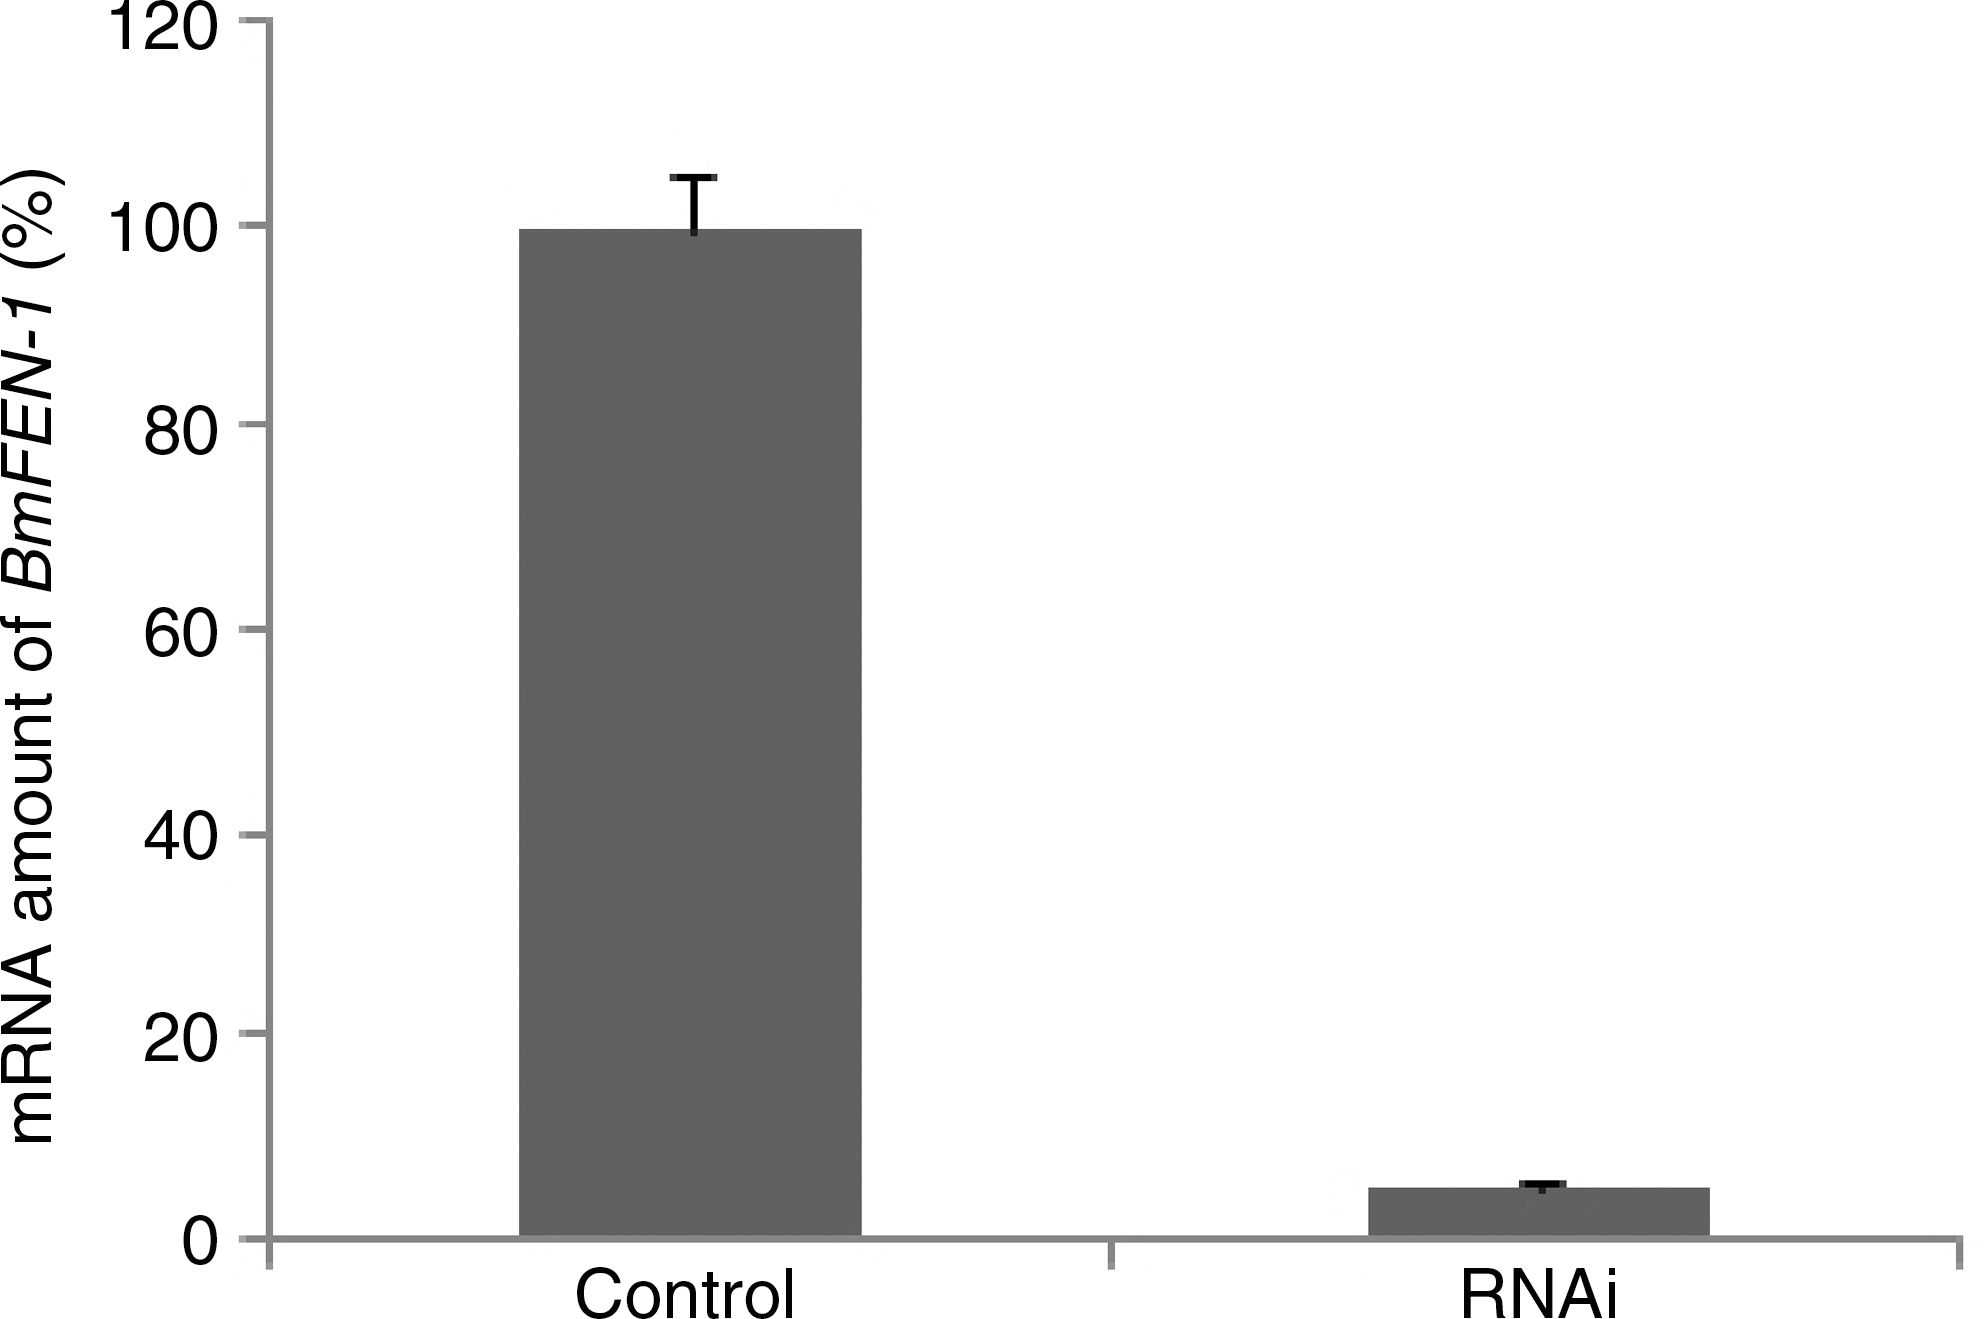
Transcription level changes of BmFEN-1 in BmE-SWUI cells treated with dsRNA. Control: Normal cells; RNAi: BmE-SWUI cells treated with BmFEN-1 dsRNA. RNAi, RNA interference.
The effect of RNAi-mediated reduction of FEN-1 expression on the cell cycle
Flow cytometry was used to analyze the cell cycle of normal cells (Control 1), transfection reagent-treated cells (Control 2), UV-treated cells (UV), and dsRNA-transfected cells (RNAi). As shown in Figure 6, no significant changes in the cell cycle were observed in the two control cell groups (Control 1 and Control 2). However, a significant increase in the number of cells in G0/G1 and decrease in the number of cells in S phase were observed in the UV-treated cells compared with the controls (Fig. 6; p < 0.01). There was no significant difference in the proportion of UV-treated cells in the G2/M phase compared with both controls. However, the proportion of BmFEN-1 RNAi-treated cells in G0/G1 and G2/M phase was significantly increased compared with the controls (Fig. 6; p < 0.01). In addition, the proportion of these cells in S phase was significantly reduced compared with the control cells (Fig. 6; p < 0.05). These results suggested that the reduction of BmFEN-1 gene expression by RNAi caused cell cycle arrest in the S phase.
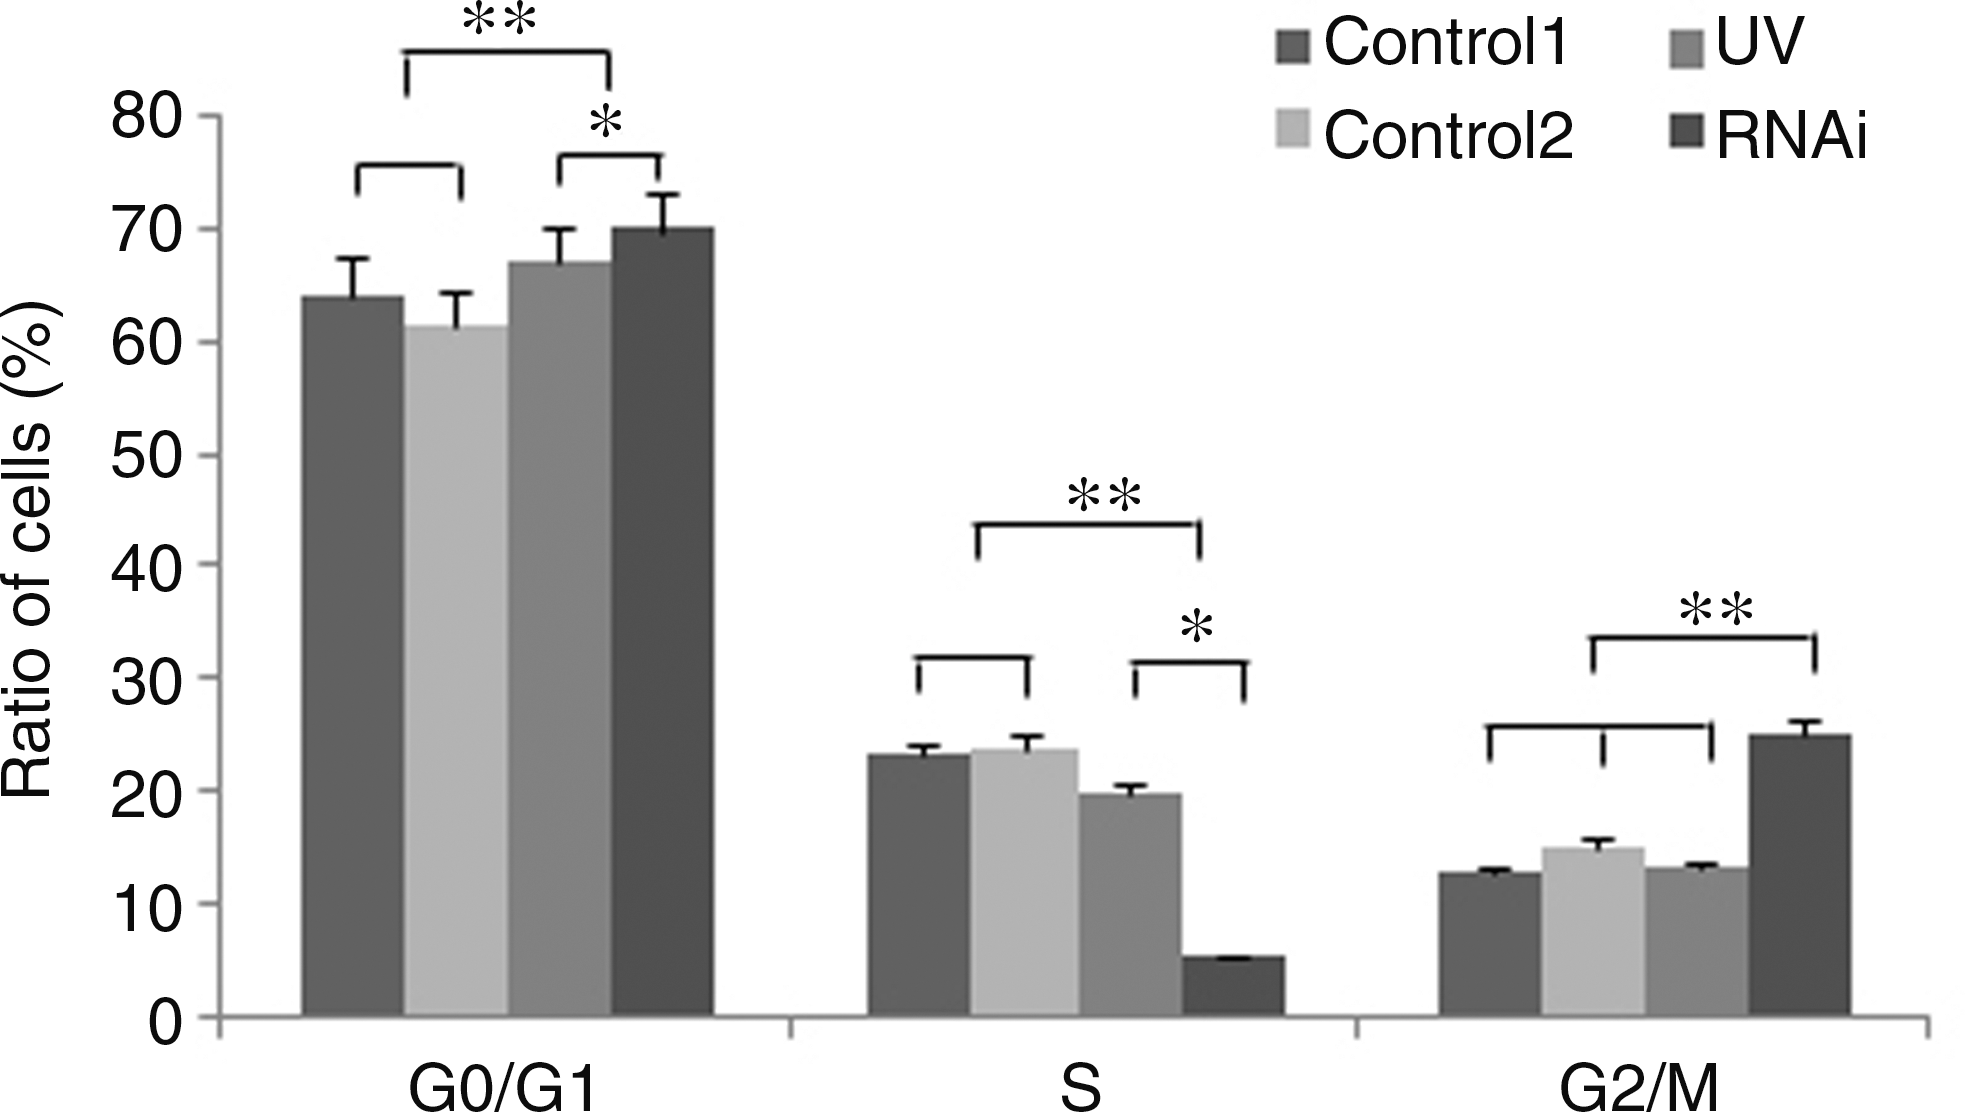
Proportion of BmE-SWU1 cells in the cell cycle phases after receiving UV or RNAi treatment. Control 1: normal cells; Control 2: cells treated with transfection reagent alone; UV: cells treated with UV alone; RNAi: cells treated with FEN-1 RNAi alone. *: significant difference with p < 0.05; **: significant difference with p < 0.01.
The effect of BmFEN-1 interference on apoptosis
The proportion of apoptotic cells in the normal cells, UV-treated cells, RNAi-treated cells, and UV-treated cells after 24 h BmFEN-1 RNAi treatment was 1.13%, 44.32%, 35.65%, and 74.91%, respectively (Fig. 7). There was a significant increase in the number of apoptotic cells in the UV-treated and RNAi-treated cells compared with the normal cells (p < 0.01). Moreover, the proportion of apoptotic cells in the UV treatment group was significantly higher than the RNAi treatment group (p < 0.05). Importantly, the proportion of apoptotic cells in the UV exposure plus FEN-1 RNAi treatment group was significantly higher than the other groups (p < 0.01). In addition, the proportion of apoptotic cells in the group receiving RNAi and UV exposure was higher than each treatment group alone, which suggested that the two treatments in combination had an additive effect.

The effect of different treatments on apoptosis of BmE-SWU1 cells. Control: normal cells; UV: cells treated with UV; RNAi: cells treated with FEN-1 RNAi alone; RNAi plus UV: cells treated with UV after incubation with FEN-1 RNAi for 24 h. *: significant difference with p < 0.05; **: significant difference with p < 0.01.
The effects of BmFEN-1 interference on cell proliferation
The percentage of total cells in the UV treatment, RNAi treatment, and UV exposure plus FEN-1 RNAi treatment groups was 78.37%, 83.03%, and 55.60%, respectively, compared with the normal cells(100%) (Fig. 8). There was a small but significant difference in the number of cells in the UV treatment group and RNAi treatment group compared with the normal cell group (Fig. 8; p < 0.05). The number of cells in the UV exposure plus FEN-1 RNAi treatment group was the lowest of all the groups, and the cell number was significantly lower than the UV and RNAi treatment groups alone (Fig. 8; p < 0.01).
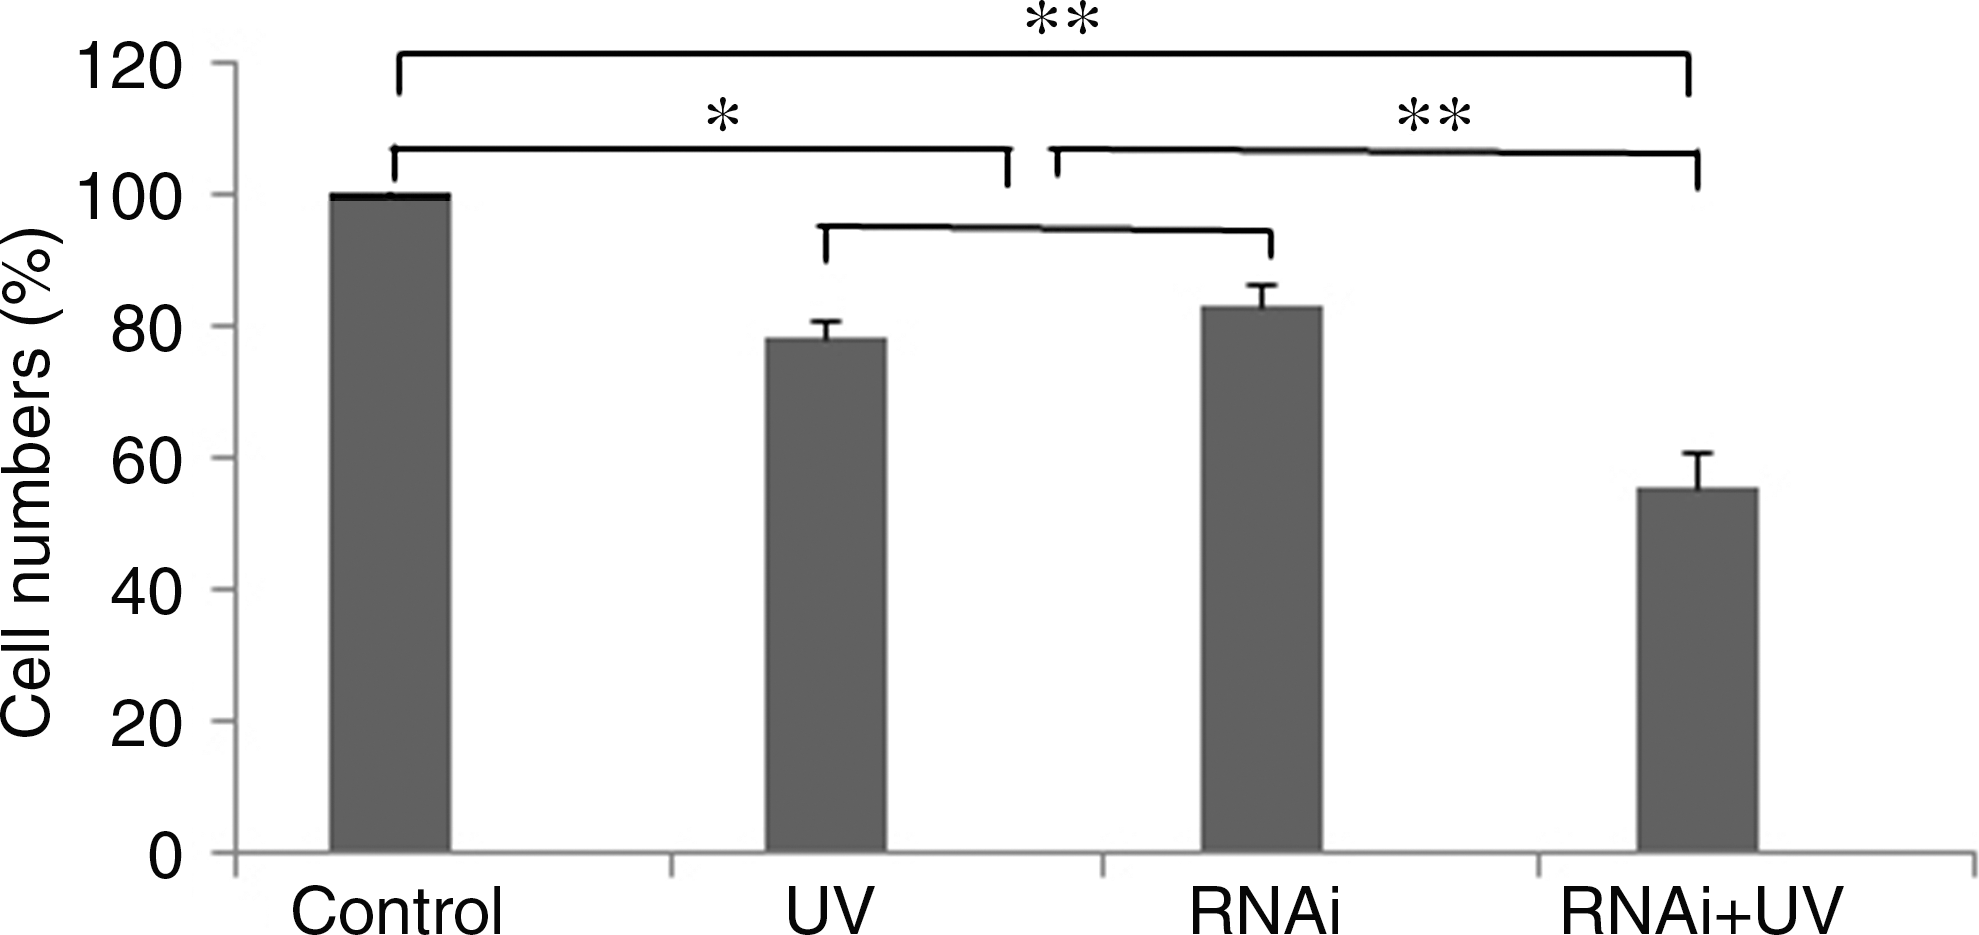
Effects on cell proliferation of BmE-SWU1 cells treated with different methods. Control: normal cells; UV: cells treated with UV; RNAi: cells treated with FEN-1 RNAi alone; RNAi plus UV: cells treated with UV after incubation with FEN-1 RNAi for 24 h. *: significant difference with p < 0.05; **: significant difference with p < 0.01.
Discussion
The expression level of the BmFEN-1 gene was only 5.24% of the control after RNAi-mediated knockdown of the gene in Bombyx mori embryonic cells (BmE-SWU1), which indicated that BmFEN-1 gene expression was dramatically suppressed. In addition, RNAi-mediated knockdown of the BmFEN-1 gene had a significant effect on the cell cycle. The S phase cells accounted for only 5.34% of the total cell number, which was significantly lower than the control and UV-treated groups, and suggested that reduction of RNAi-mediated BmFEN-1 expression in these cells induced cell cycle arrest in S phase. The S phase represents the period of DNA replication in the cell cycle; therefore, these data suggest that BmFEN-1 gene may have a similar function as FEN-1 in other species previously reported (Kim et al., 1998; Liu et al., 2004; Shen et al., 2005; Zheng et al., 2005). BmFEN-1 genes play a role in promoting cell proliferation.
The current view of FEN-1 function is that under normal conditions, FEN-1 participates in DNA replication and repair to maintain genome stability and the accuracy of DNA replication. However, FEN-1 also plays an important role in the formation of cancer and cell apoptosis (Shen et al., 2005; Zheng et al., 2007, 2011; Larsen et al., 2008). Parrish et al. (2003) hypothesized that FEN-1 may have two different functions, where it may act as a switch in DNA replication and repair and DNA fragmentation during apoptosis, and this model suggests that FEN-1 plays a role in promoting apoptosis. In 2006, Letter and Hengartner hypothesized that FEN-1 functioned in conjunction with other genes to promote apoptosis. The authors considered FEN-1 as an apoptosis-related gene involved in DNA degradation. In this study, we analyzed the function of BmFEN-1 in BmE-SWU1 through RNAi-mediated reduction of gene expression. Our data showed that 35.65% of the cells in the intervention group underwent apoptosis, which was significantly higher than the control groups. These results indicated that BmFEN-1 plays an important role in maintaining the normal growth of cells by acting as an inhibitor of apoptosis, which was opposite to other findings which have shown that FEN-1 can promote apoptosis. In addition, we treated BmE-SWU1 cells with UV irradiation after RNAi-mediated knockdown of BmFEN-1 and found that the proportion of apoptotic cells in that treatment group was more than the UV and RNAi treatment groups alone, suggesting that these two treatments had an additive effect on apoptosis of these cells. These results suggest that there was a combined effect with UV treatment and RNAi-mediated BmFEN-1 reduction, though they may trigger different apoptotic pathways.
Our results have shown that BmFEN-1 is involved in DNA replication and in the inhibition of apoptosis. However, the molecular mechanisms involved with the FEN-1-mediated effects on genomic stability and apoptosis remain unclear. Further studies are needed to explore these mechanisms and elucidate the functions of FEN-1 in various cell types.
Footnotes
Acknowledgments
This work is supported by grants from the National Natural Science Foundation of China (Grant No. 30972146) and the Program of Introducing Talents of Discipline to Universities (Grant No. B07045).
Disclosure Statement
No competing financial interests exist.