
Abstract
2-Acetylaminofluorene (2-AAF) is a carcinogenic and mutagenic derivative of fluorene. It is used as a biochemical tool in the study of carcinogenesis. Studies have shown that it induces tumors in a number of species in the liver, bladder, and kidney. It is thought that 2-AAF–DNA adduct formation leads to mutation, and eventually tumor formation. The aim of this study was to examine the interactions of AAF with calf-thymus DNA in aqueous solution at physiological conditions, using constant DNA concentration (12.5 mM) and various AAF/polynucleotide (phosphate) ratios of 1/120, 1/80, 1/40, 1/20, 1/10, 1/5, 1/2, and 1/1. Fourier transform infrared and UV–visible spectroscopic methods and molecular modeling were used to determine the ligand binding mode, the binding constant, and the stability of AAF–DNA complexes in aqueous solution. Spectroscopic evidence showed both intercalation and external binding of AAF to DNA with an overall binding constant of K AAF–DNA=2.33×10⁷ M−1. 2-AAF induced a partial B to A-DNA transition and DNA aggregation was observed at high AAF content.
Introduction
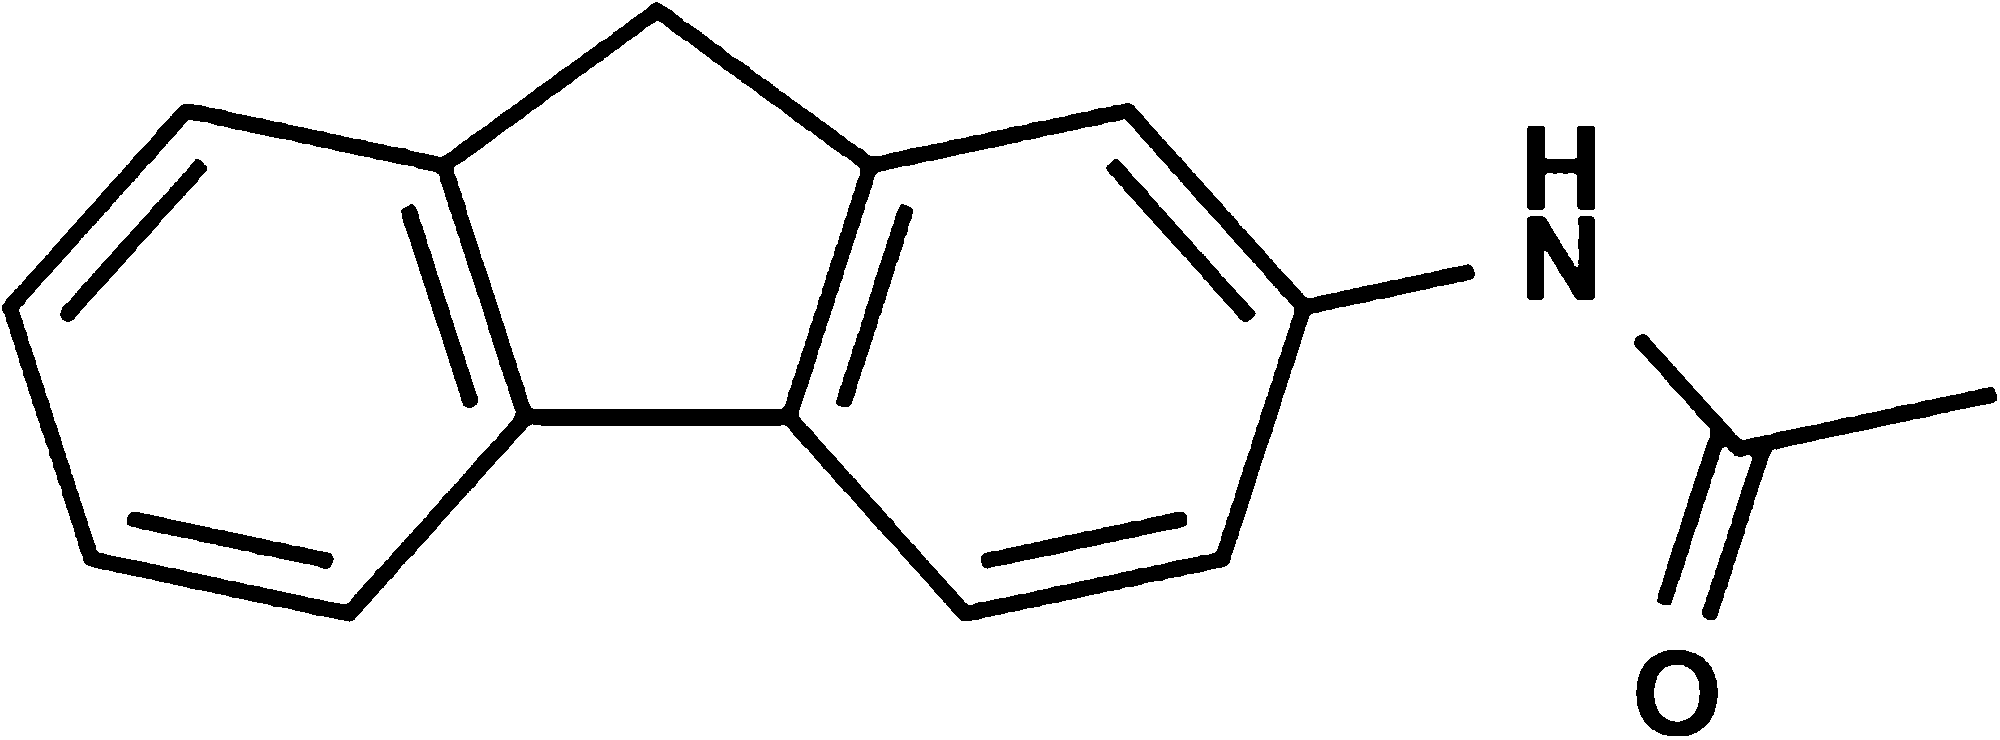
Chemical structure of acetylaminofluorene (AAF).
Although much is known about the AAF interaction with short oligonucleotide sequences (Levine et al., 1974; Santella et al., 1981; Hingerty and Broyde, 1983; Kuroda et al., 1984; King, 1985; Dutta et al., 2004), there is no study on the interaction of AAF with calf thymus DNA by Fourier transform infrared (FTIR) and UV spectroscopy. We studied the interaction of DNA adducts with 2-AAF in aqueous solution at pH 7 with AAF/DNA(P) molar ratios of 1/120 to 1/1 using FTIR and UV measurements as well as molecular modeling. Structural analyses regarding the AAF binding site, binding constant, and DNA secondary structure are provided. Our spectroscopic results provide structural analysis of AAF–DNA interaction, which helps elucidate the nature of this biologically important complexation in vitro.
Materials and Methods
Materials
DNA sodium salt and 2-AAF were purchased from Sigma Chemical (St. Louis, MO) and used without further purification. To check the protein content of DNA solutions, the absorbance bands at 260 and 280 nm were used. The A260/A280 ratio was 2.10 for DNA, showing that DNA samples were sufficiently free from protein (Marmur and Doty, 1961). Other chemicals were of reagent grade and used without further purification.
Preparation of stock solutions
DNA was dissolved to 0.5% w/w (0.0125 M) polynucleotide (phosphate) (pH 7) in phosphate buffer for 24 h with occasional stirring to ensure the formation of a homogeneous solution. The final concentration of the DNA solution was determined spectrophotometrically at 260 nm using molar extinction coefficient ε 260=9250 cm−1 M−1 (DNA) (expressed as molarity of phosphate groups) (Vijalakshmi et al., 2000).
Due to low stability of AAF in water, the appropriate amount of AAF (0.05–12.5 mM) used was dissolved in ethanol/water (50/50) and added dropwise to DNA solution (12.5 mM). The alcohol concentration was reduced to 25% (by mixing 2 solutions) to attain the desired AAF/DNA(P) molar ratios (r) of 1/120, 1/80, 1/40, 1/20, 1/10, 1/5, 1/2, and 1/1 with a final DNA(P) concentration of 12.5 mM. It is noteworthy that ethanol content 25% (final) in the mixtures of AAF–DNA solution does not affect the conformation of DNA. Ethanol induces DNA conformational changes only when the alcohol concentration exceeds 50% (Potaman et al., 1980; Nejedly et al., 2005). The pH values of solutions were adjusted at 7.0±0.2 using NaOH solution. All of the complex solutions were centrifuged to avoid excess AAF in solution. No precipitate was observed at lower concentrations (1/120 to 1/5); at higher concentrations (r=1/2, 1/1), the AAF precipitates were separated. The infrared spectra were recorded 2 h after mixing of the AAF with DNA solution. For UV measurements, AAF concentrations of 2.05×10⁻⁶–5×10⁻⁴ were used with constant DNA concentration of 5×10⁻⁴ M.
FTIR spectroscopy measurements
Infrared spectra were recorded on a Bruker ATR spectrometer (Ettlingen, Germany) equipped with an external water-cooled high-power Hg-arc source and was accessible with a room temperature operated deuterated triglycine sulfate (DTGS) detector and a ZnSe beam splitter. The spectra of AAF/DNA solutions were taken using a cell assembled with ZnSe windows. Spectra were collected using the Opus software supplied by the manufacturer of the spectrophotometer. The spectra of the solutions were recorded after 2 h incubation of AAF with DNA solution, using ZnSe windows. The bands were measured in triplicates (three individual samples of the same DNA, and AAF concentrations). For each spectrum, 100 scans were collected with resolution of 4 cm−1. The difference spectra [(polynucleotide solution+AAF solution)−(polynucleotide solution)] were obtained using a sharp DNA band at 968 cm−1 as internal reference (Kanakis et al., 2005, 2007). This band, which is due to sugar C-C and C-O stretching vibrations, exhibits no spectral change (shifting or intensity variation) upon AAF–DNA complexation, and cancelled out upon spectral subtraction.
The intensity ratios of the bands due to several DNA in-plane vibrations related to A-T, G-C base pairs and the PO2 stretching vibrations were measured with respect to the reference bands at 968 cm−1 (DNA) as a function of AAF concentrations with an error of±3%. Similar intensity variations have been used to determine the ligand binding to DNA bases and backbone phosphate groups (Arakawa et al., 2000).
The plots of the relative intensity (R) of several peaks of DNA in-plane vibrations related to A-T, G-C base pairs and the PO2 stretching vibrations such as 1707 (guanine), 1660 (thymine), 1608 (adenine), 1490 (cytosine), and 1226 cm−1 (PO2 groups), versus AAF concentrations were obtained after peak normalization using Ri=Ii/I968 , where Ii is the intensity of the absorption peak for pure DNA in the complex with i as the ligand concentration, and I968 is the intensity of the 968 cm−1 peak (DNA internal reference). The plot of intensity was drawn for r=1/120 to 1/5. At higher AAF concentrations, r=1/2, 1/1, due to the overlapping of the AAF absorption bands with DNA vibrations, monitoring the intensity changes of DNA bands was not possible. Therefore, the intensity changes shown are from r=1/120 to r=1/5.
Absorption spectroscopy
The absorption spectra were recorded on a Biomate 3S UV–visible spectrometer, quartz cuvettes of 1 cm were used and the absorption spectra recorded with AAF concentrations of 2.05×10⁻⁶–5.1×10⁻⁴ M and constant polynucleotide concentration of 5.1×10⁻⁴ M.
The binding constants of the AAF–DNA complexes were calculated as reported (Connors, 1987). It is assumed that the interaction between the ligand [L] and the substrate [S] is 1:1; for this reason a single complex SL (1:1) is formed. It was also assumed that the sites (and all the binding sites) are independent and the Beer's law is followed by all species. A wavelength is selected at which the molar absorptivities ε
S (molar absorptivity of the substrate) and ε
11 (molar absorptivity of the complex) are different. Then, at total concentration St of the substrate, in the absence of ligand and the light path length is b=1 cm, the solution absorbance is
In the presence of ligand at total concentration L
t, the absorbance of a solution containing the same total substrate concentration is
(where [S] is the concentration of the uncomplexed substrate; [L], the concentration of the uncomplexed ligand; and [SL], the concentration of the complex), which, combined with the mass balance on S and L, gives
where
Combining Equation 4 with the stability constant definition K
11=[SL]/[S][L] gives
where ΔA=A – Ao. From the mass balance expression S
t=[S]+[SL], we get [S]=S
t/(1+K
11[L]), which is Equation 5, giving Equation 6 at the relationship between the observed absorbance change per centimeter and the system variables and parameters.
Equation 6 is the binding isotherm, which shows the hyperbolic dependence on free ligand concentration.
The double-reciprocal form of plotting the rectangular hyperbola
Thus, the double reciprocal plot of 1/ΔA versus 1/[L] is linear and the binding constant can be estimated from the following equation
Molecular modeling and docking
The crystal structures of two DNA-ligand complexes were selected from Protein Data Bank (Web address:
Macromolecules were docked using Lamarckian genetics algorithm. For the local search, the so-called pseudo-Solis and Wets algorithm was applied using a maximum of 300 iterations per local search (Solis and Wets, 1981).In AutoDock, the overall docking energy of a given ligand molecule in its active site is expressed as follows:
In Equation 9, ΔG vdW, ΔG hbond, ΔG elec, ΔG tor, and ΔG sol are free energy coefficients of van der Waals, hydrogen bond, electrostatic interactions, torsional term, and desolvation energy of oligonucleotide–ligand complex, respectively. r ij, A ij, B ij, C ij, and D ij represent the interatomic distance, the depths of energy well, and the equilibrium separations between the two atoms, respectively. The first three terms are in vacuo force field energies for intermolecular interactions. The fourth term accounts for the internal steric energy of the ligand molecule.
The energies used and reported by AutoDock should be distinguished: there are docked energies, which include the intermolecular and intramolecular interaction energies, and which are used during dockings; and predict free energies, which include the intermolecular energy and the torsional free energy, and are only reported at the end of a docking (Morris et al., 1998; Ali et al., 2010).
We converted between the binding constant, K
binding, and the binding free energy change of binding, ΔG
binding, using the equation
where R is the gas constant, 1.987 calK−1 mol−1, and T is the absolute temperature, assumed to be room temperature, 298.15 K. To analyze and display docking results, we used AutoDock Tools1.5.4 (ADT) (Sanner, 1999) (
Results and Discussion
FTIR spectra of AAF–DNA adducts
AAF binds DNA via both external and intercalation modes. Evidence for external binding comes from the infrared spectroscopy, whereas UV results show some degree of intercalation at lower drug concentrations. To characterize the AAF–DNA bindings, the infrared spectra of AAF–DNA complexes were recorded using a constant amount of DNA with various concentrations of AAF and the results are presented in Figures 2 and 3. The DNA in-plane vibrations at 1750–1500 cm −1 related to the G–C, A–T base pairs and the backbone phosphate group at 1226–1000 cm −1 (Alex and Dupuis, 1986; Starikov et al., 1991; Taillandier and Liquier, 1992; Loprete and Hartman, 1993; Ahmad et al., 2003; Ouameur and Tajmir-Riahi, 2004) were perturbed upon AAF interaction. At r=1/120, the main guanine vibration at 1707 cm −1 of the free DNA gained intensity and shifted toward a lower frequency at 1696 cm−1. At higher concentrations (r=1/80 to 1/10), this band shifted to 1695 (r=1/80), 1694 (r=1/40), 1695 (r=1/20), 1696 (r=1/10), and 1698 (r=1/5) cm −1 upon AAF complexation (Figs. 2 and 3).
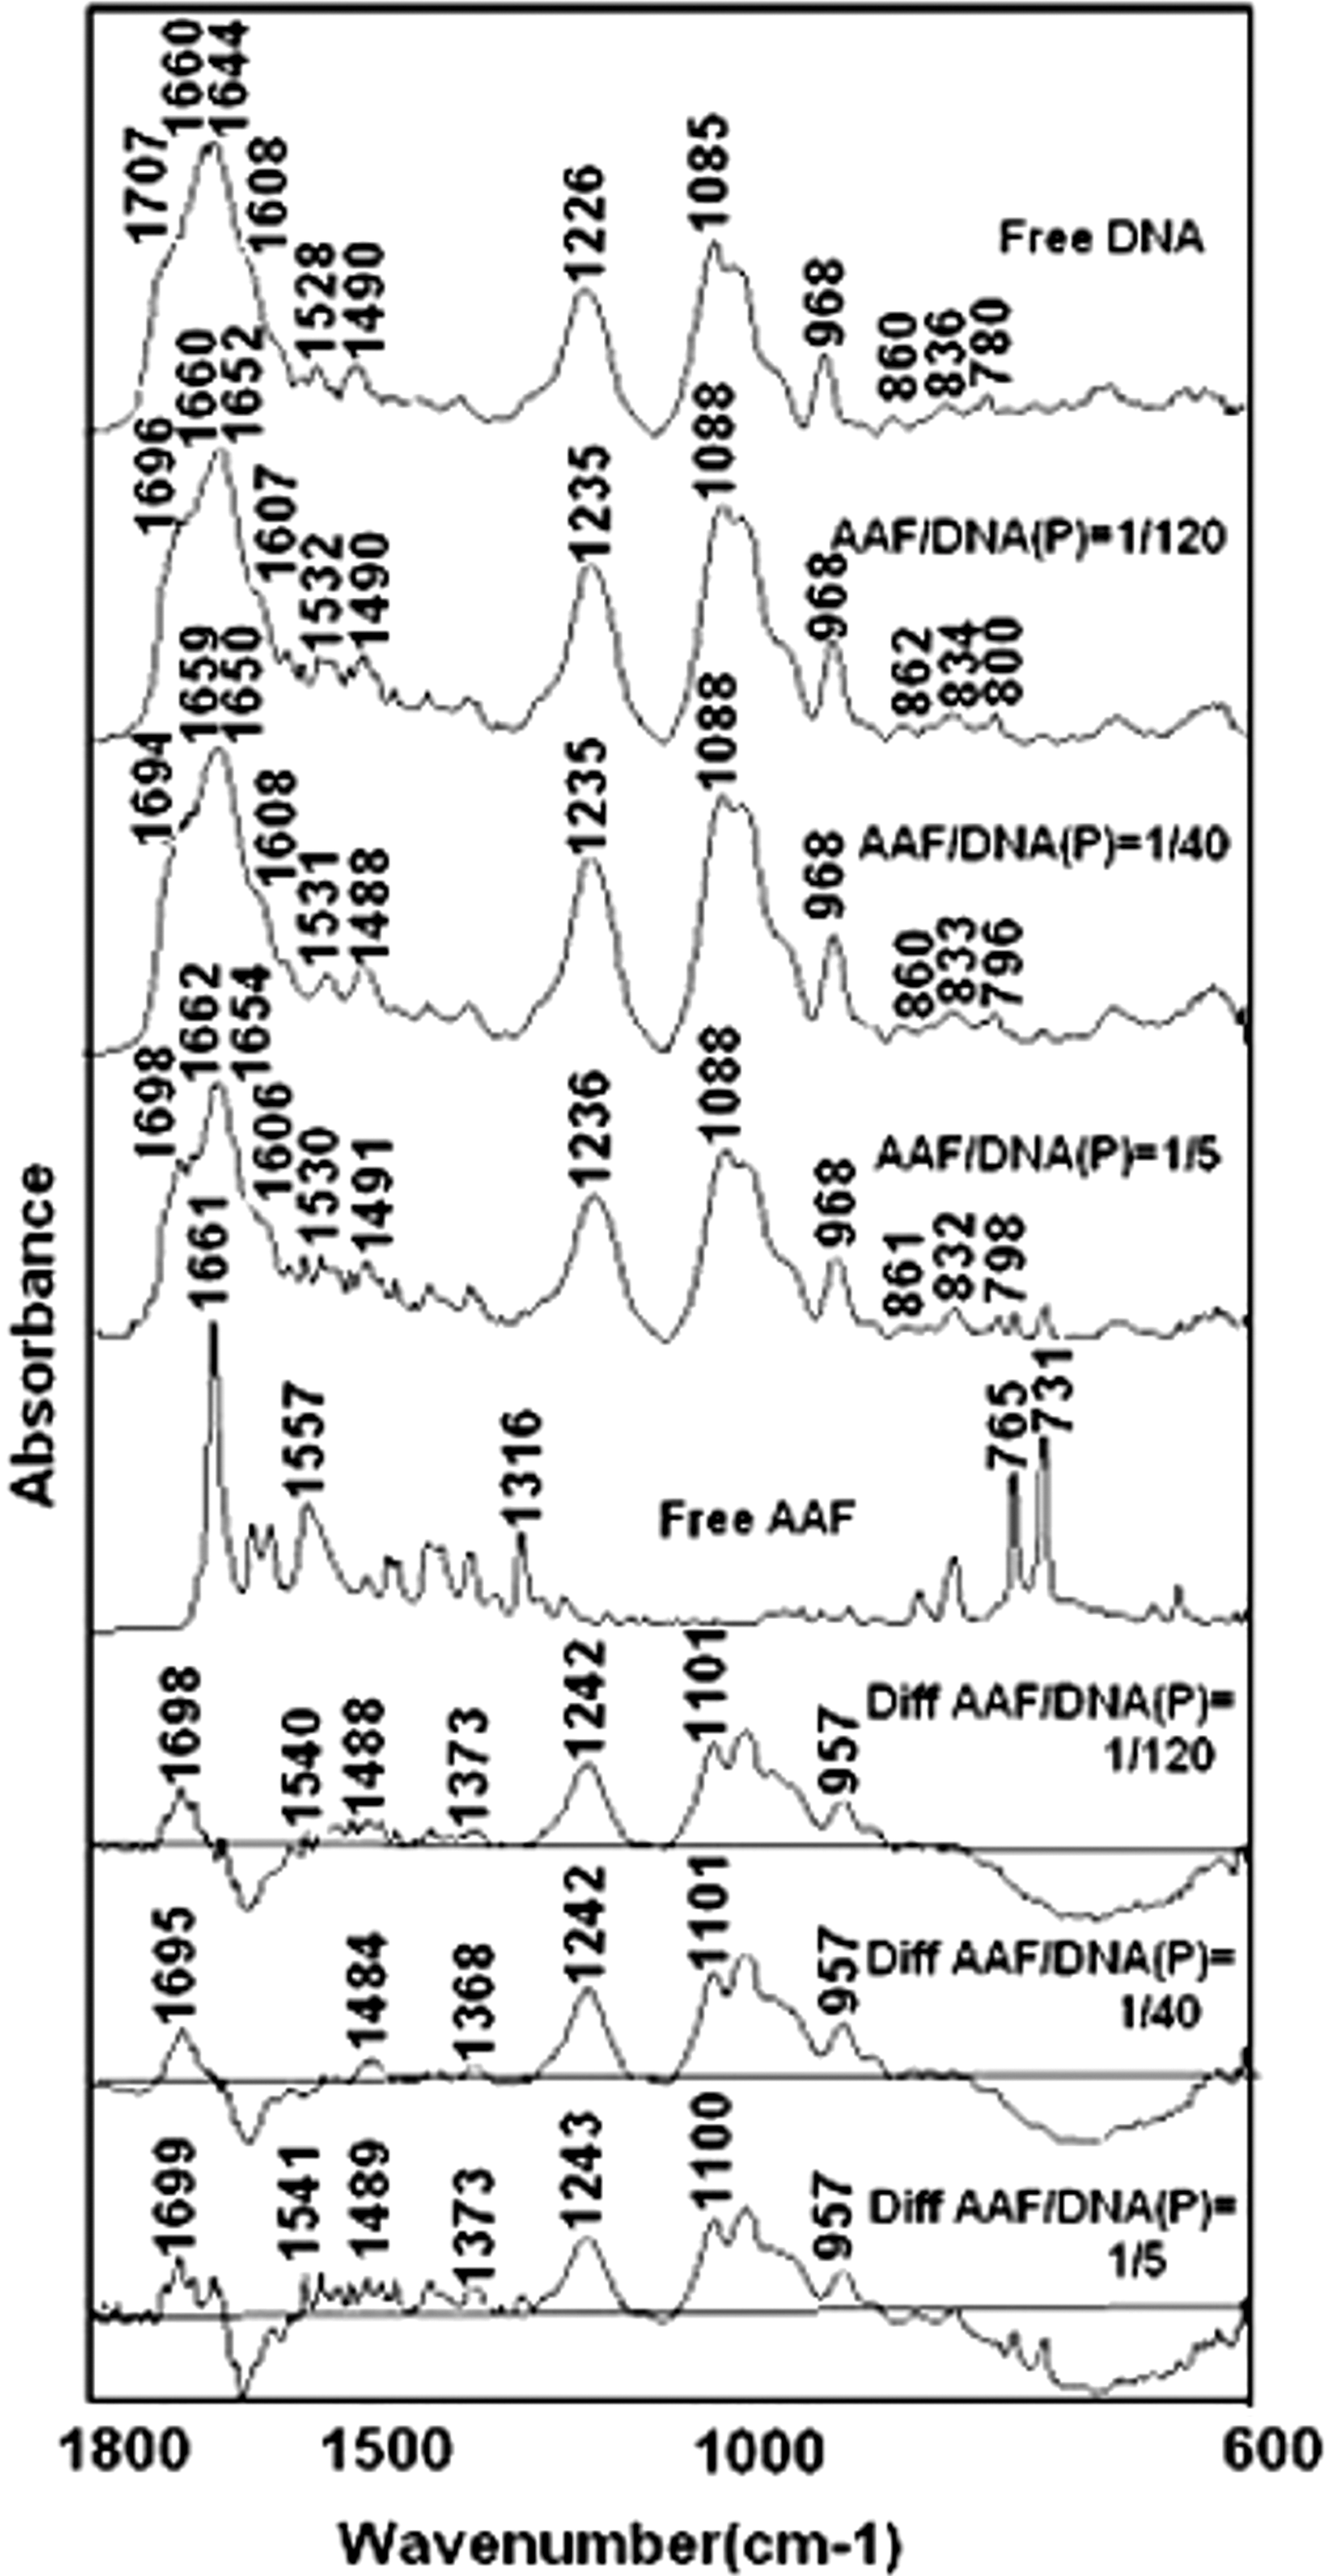
Fourier transform infrared spectra in the region of 1800–600 cm−1 for calf thymus DNA, and AAF adducts in aqueous solution at pH 7. DNA and three complex spectra obtained at various AAF–DNA (phosphate) molar ratios (top four spectra), ligand, and three difference spectra (bottom four spectra).

Intensity ratio variations for several DNA in-plane vibrations as a function of AAF concentration. Intensity ratios for the DNA bands at 1707 (G, T), 1660 (T, G, A, C), 1608 (A), 1490 (C, G), and 1226 (PO2 asymmetric) refer to the DNA band at 968 cm−1.
Similarly, an increase in the intensity of the backbone PO2 asymmetric stretching band at 1226 cm −1 (r=1/120) was observed, which shifted toward a higher frequency at 1235 (r=1/120, 1/80, 1/40), 1234 (r=1/20), and 1236 cm −1 (r=1/10, 1/5) upon AAF complexation in the spectra of AAF–DNA complexes (Figs. 2 and 3). The observed spectral changes are related to AAF external binding to guanine and phosphate backbone group PO2. No major intensity changes were observed for the guanine and phosphate bands at higher concentrations (r=1/80 to 1/10), which is indicative of no further interaction with guanine and phosphate at higher concentrations.
The positive features at 1699–1695 and 1243–1242 cm −1 in the difference spectra of AAF–DNA complexes are due to an increase in the intensity of the guanine band at 1710 and the PO2 band at 1225 cm −1, respectively (Fig. 2). The AAF bindings are mainly through G bases and the backbone phosphate groups in the AAF–DNA adducts. No major spectral changes (intensity and shifting) were observed for the bands of the other DNA bases: the thymine band at 1660, adenine band at 1608, and cytosine band at 1490 cm−1 (r=1/120 to 1/5), which is indicative of no major participation of these bases in AAF–DNA complexation. At higher concentrations (r=1/5), the intensity of bases bands decreased that can be related to DNA aggregation or condensation upon AAF interaction.
It should be noted that at r=1/2, 1/1, the strong absorption bands at 1660, 764, and 730 cm−1 are related to AAF carbonyl and benzene ring vibrational frequencies (figures not shown here).
The absorption bands with medium intensity at 1644 cm−1 in the IR spectrum of free DNA and 1654–1650 cm−1 in the spectra of the AAF–DNA adducts and in the difference spectra are due to water deformation; they are not due to DNA vibrations (Nafisi et al., 2007).
Compounds that bind nucleic acids via an intercalative mode cause minor intensity changes in the IR spectra of ligand-DNA complexes. Such intensity changes were observed in the infrared spectra of complexes of ethidium bromide, acridine orange, and methylene blue with DNA in which minor spectral changes were attributed to the intercalation of these compounds into the DNA duplex (Nafisi et al., 2007). Minor intensity changes (intensity and shifting) of the AAF–DNA complexes show weak or partial intercalation of AAF into the DNA duplex.
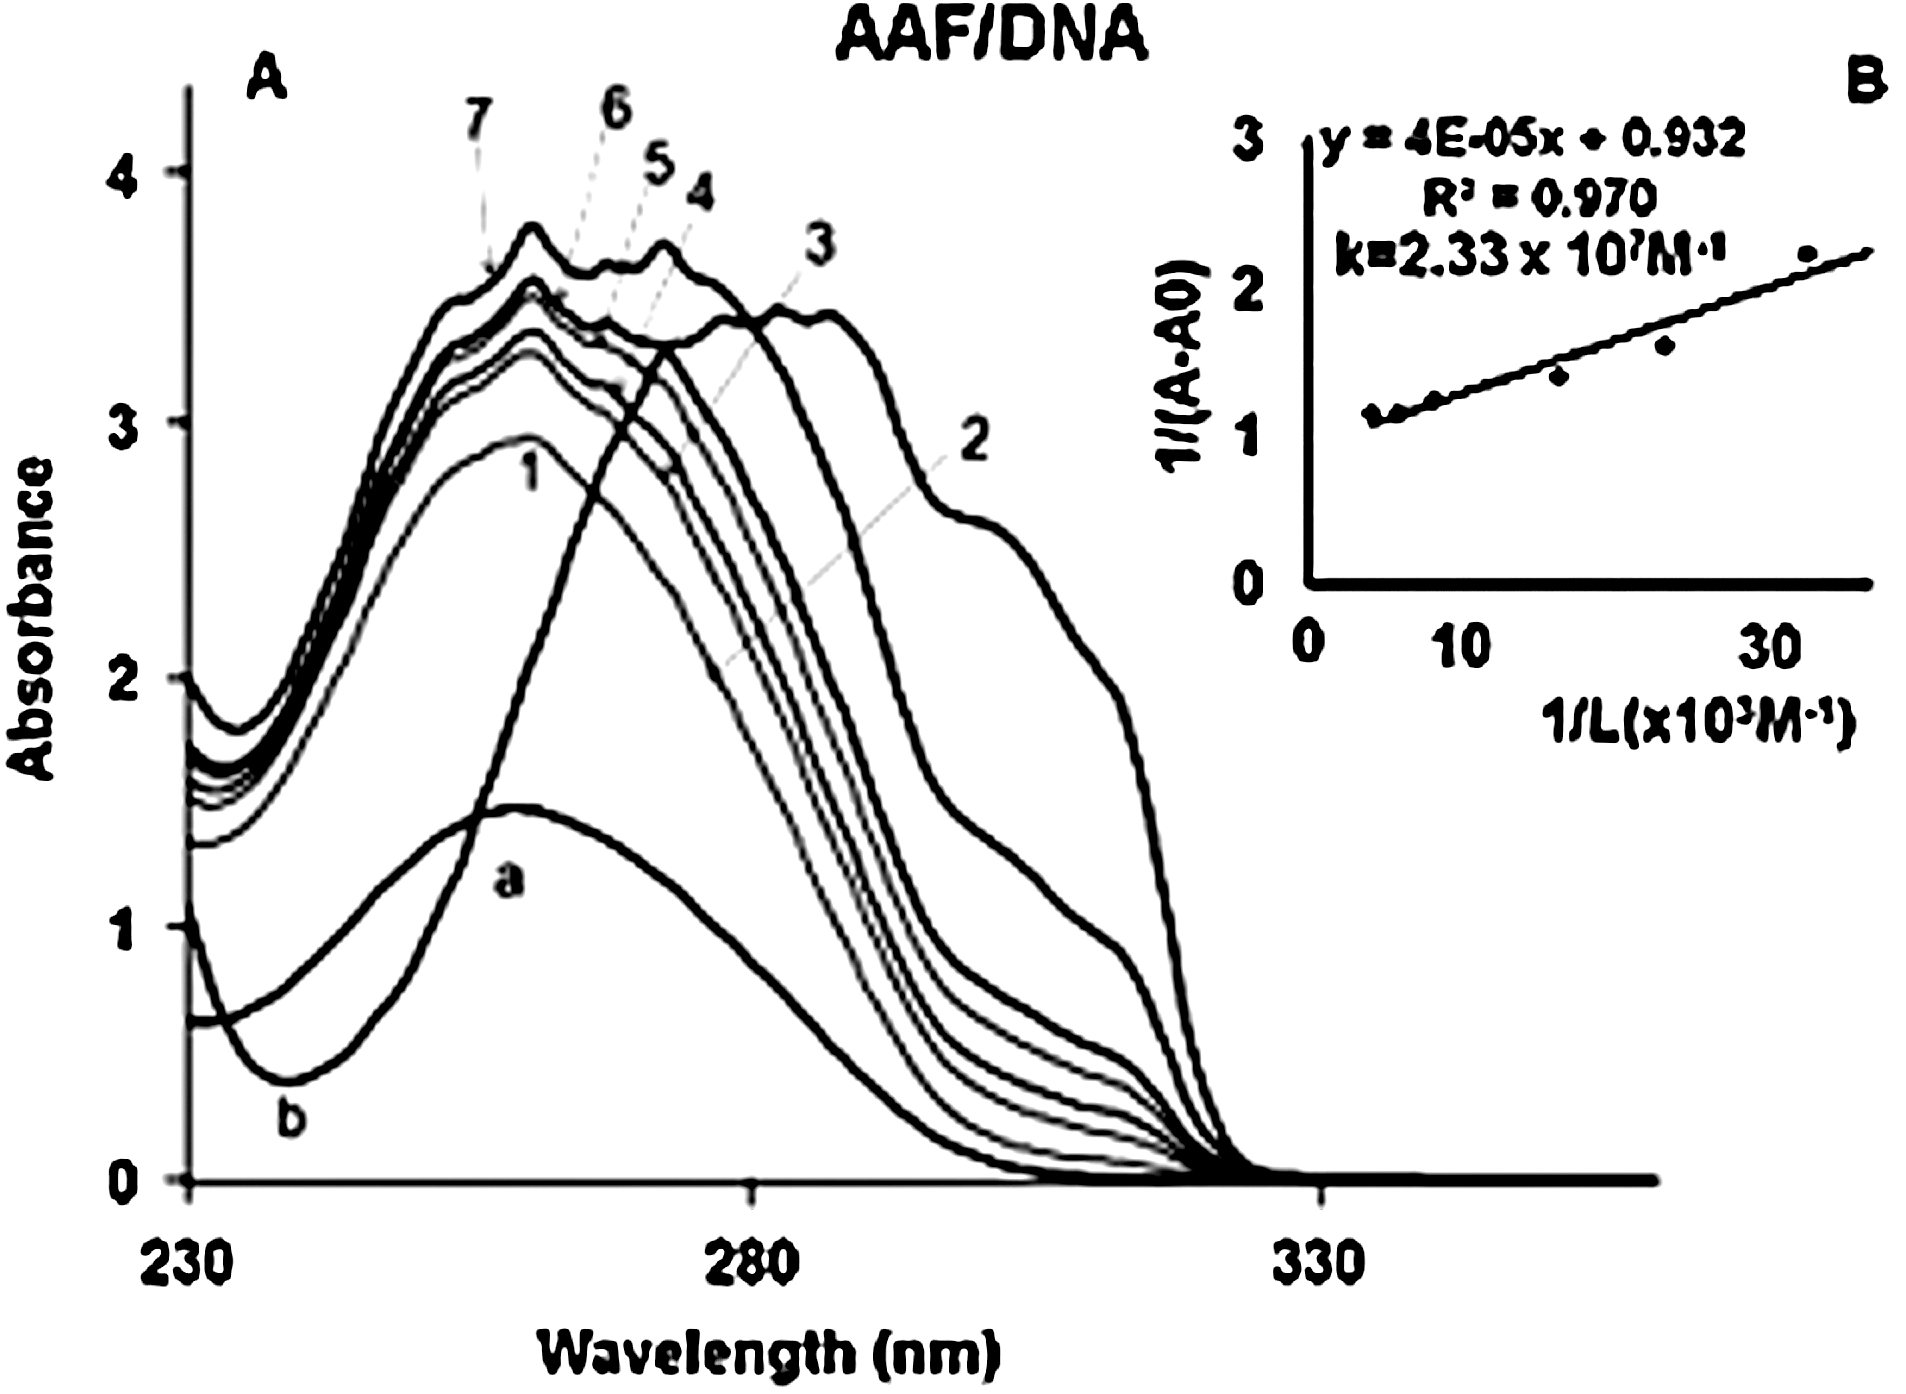
The UV results show that at low AAF concentrations, drug intercalation occurs with the DNA duplex, whereas at higher concentrations, interaction with DNA bases (external binding) is predominant (Fig. 4). Evidence for intercalation comes from a major reduction in the intensity of UV–visible bands characteristic of AAF upon DNA interaction at lower energy (between 300 and 320 nm). Intercalation of ligand into the DNA duplex causes major reduction in the intensity of the UV–visible absorption band characteristics of ligand (Lambert et al., 1998; Nafisi et al., 2007). With increasing concentration, the intensity of the characteristic AAF UV–visible band increased due to AAF interaction at DNA surface, which does not limit the mobility of ligand molecule (Fig. 4). The above results are consistent with the findings of the Augusta research group, who found covalent binding of AAF to nucleic acids, and extensive noncovalent binding to native DNA (Dean, 2003).
DNA conformation
Alterations of B–DNA structure were observed upon AAF complexation. Evidence for this comes from the spectral changes for B–DNA marker bands at 1226 cm −1 (PO2 stretch), 1707 cm −1 (mainly guanine), and 836 cm −1 (phosphodiester mode) upon AAF complexation (Taillandier and Liquier, 1992; Loprete and Hartman, 1993; Tajmir-Riahi et al., 1995) (Fig. 2).
In a B-to-A transition, the marker band at 836 cm −1 shifts toward a lower frequency at about 825–800 cm −1 and the guanine band at 1707 cm −1 appears at 1700–1695 cm −1, whereas the phosphate band at 1226 cm −1 shifts toward a higher frequency at 1240–1235 cm −1 (Tajmir-Riahi et al., 1995, 2009). In a B-to-Z conformational changes, the sugar–phosphate band at 836 cm −1 appears at 800–780 cm −1, and the guanine band displaces to 1690 cm −1, whereas the phosphate band shift to 1216 cm −1 (Tajmir-Riahi et al., 1995, 2009). The shifting of the bands at 1707 (G) to 1692–1696 and 1226 (PO2 stretch) to 1234–1236 cm −1 is due to DNA conformational changes upon AAF interaction. The changes are due to major perturbations of B–DNA structure toward A-conformation. However, it is not a complete A-DNA formation, whereas the band at 836 cm −1 appears at 834–832 cm −1 (in a complete A-DNA structure this band appeared at 825–800 cm −1) (Fig. 2).
Stability of AAF–DNA complexes
AAF binding constants were determined as described in Materials and Methods (UV–visible spectroscopy). The overall binding constants were calculated using UV spectroscopy as reported (Connors, 1987). Concentrations of the complexed ligand were determined by subtracting absorbance of the free DNA at 260 nm from those of the complexed. Concentration of the free ligand was determined by subtraction of the complex ligand from total ligand used in the experiment. Our data of 1/[ligand complex] almost proportionally increased as a function of 1/[free ligand] (Fig. 4). The double reciprocal plot of 1/(A−A 0) versus 1/(AAF concentration) is linear, and the binding constant (K) can be estimated from the ratio of the intercept to the slope (Fig. 4), where A 0 is the initial absorbance of the free DNA at 260 nm, and A is the recorded absorbance of DNA in the presence of different AAF concentrations. The overall binding constant is estimated to be K AAF–DNA=2.33×10⁷ M−1.
Docking study
To determine the preferred binding sites on DNA, AAF was docked to DNA. The dockings results are shown in Figures 5 and 6. The comparisons between experimental and calculated data are shown in Table 1. The models show that AAF is surrounded by C5.A, G6.A, C7.B, and C8.B (Fig. 5) and phosphate group of T7.A (Fig. 6) with a binding energy of−6.36 and−5.77 kcal/mol (Table 1).
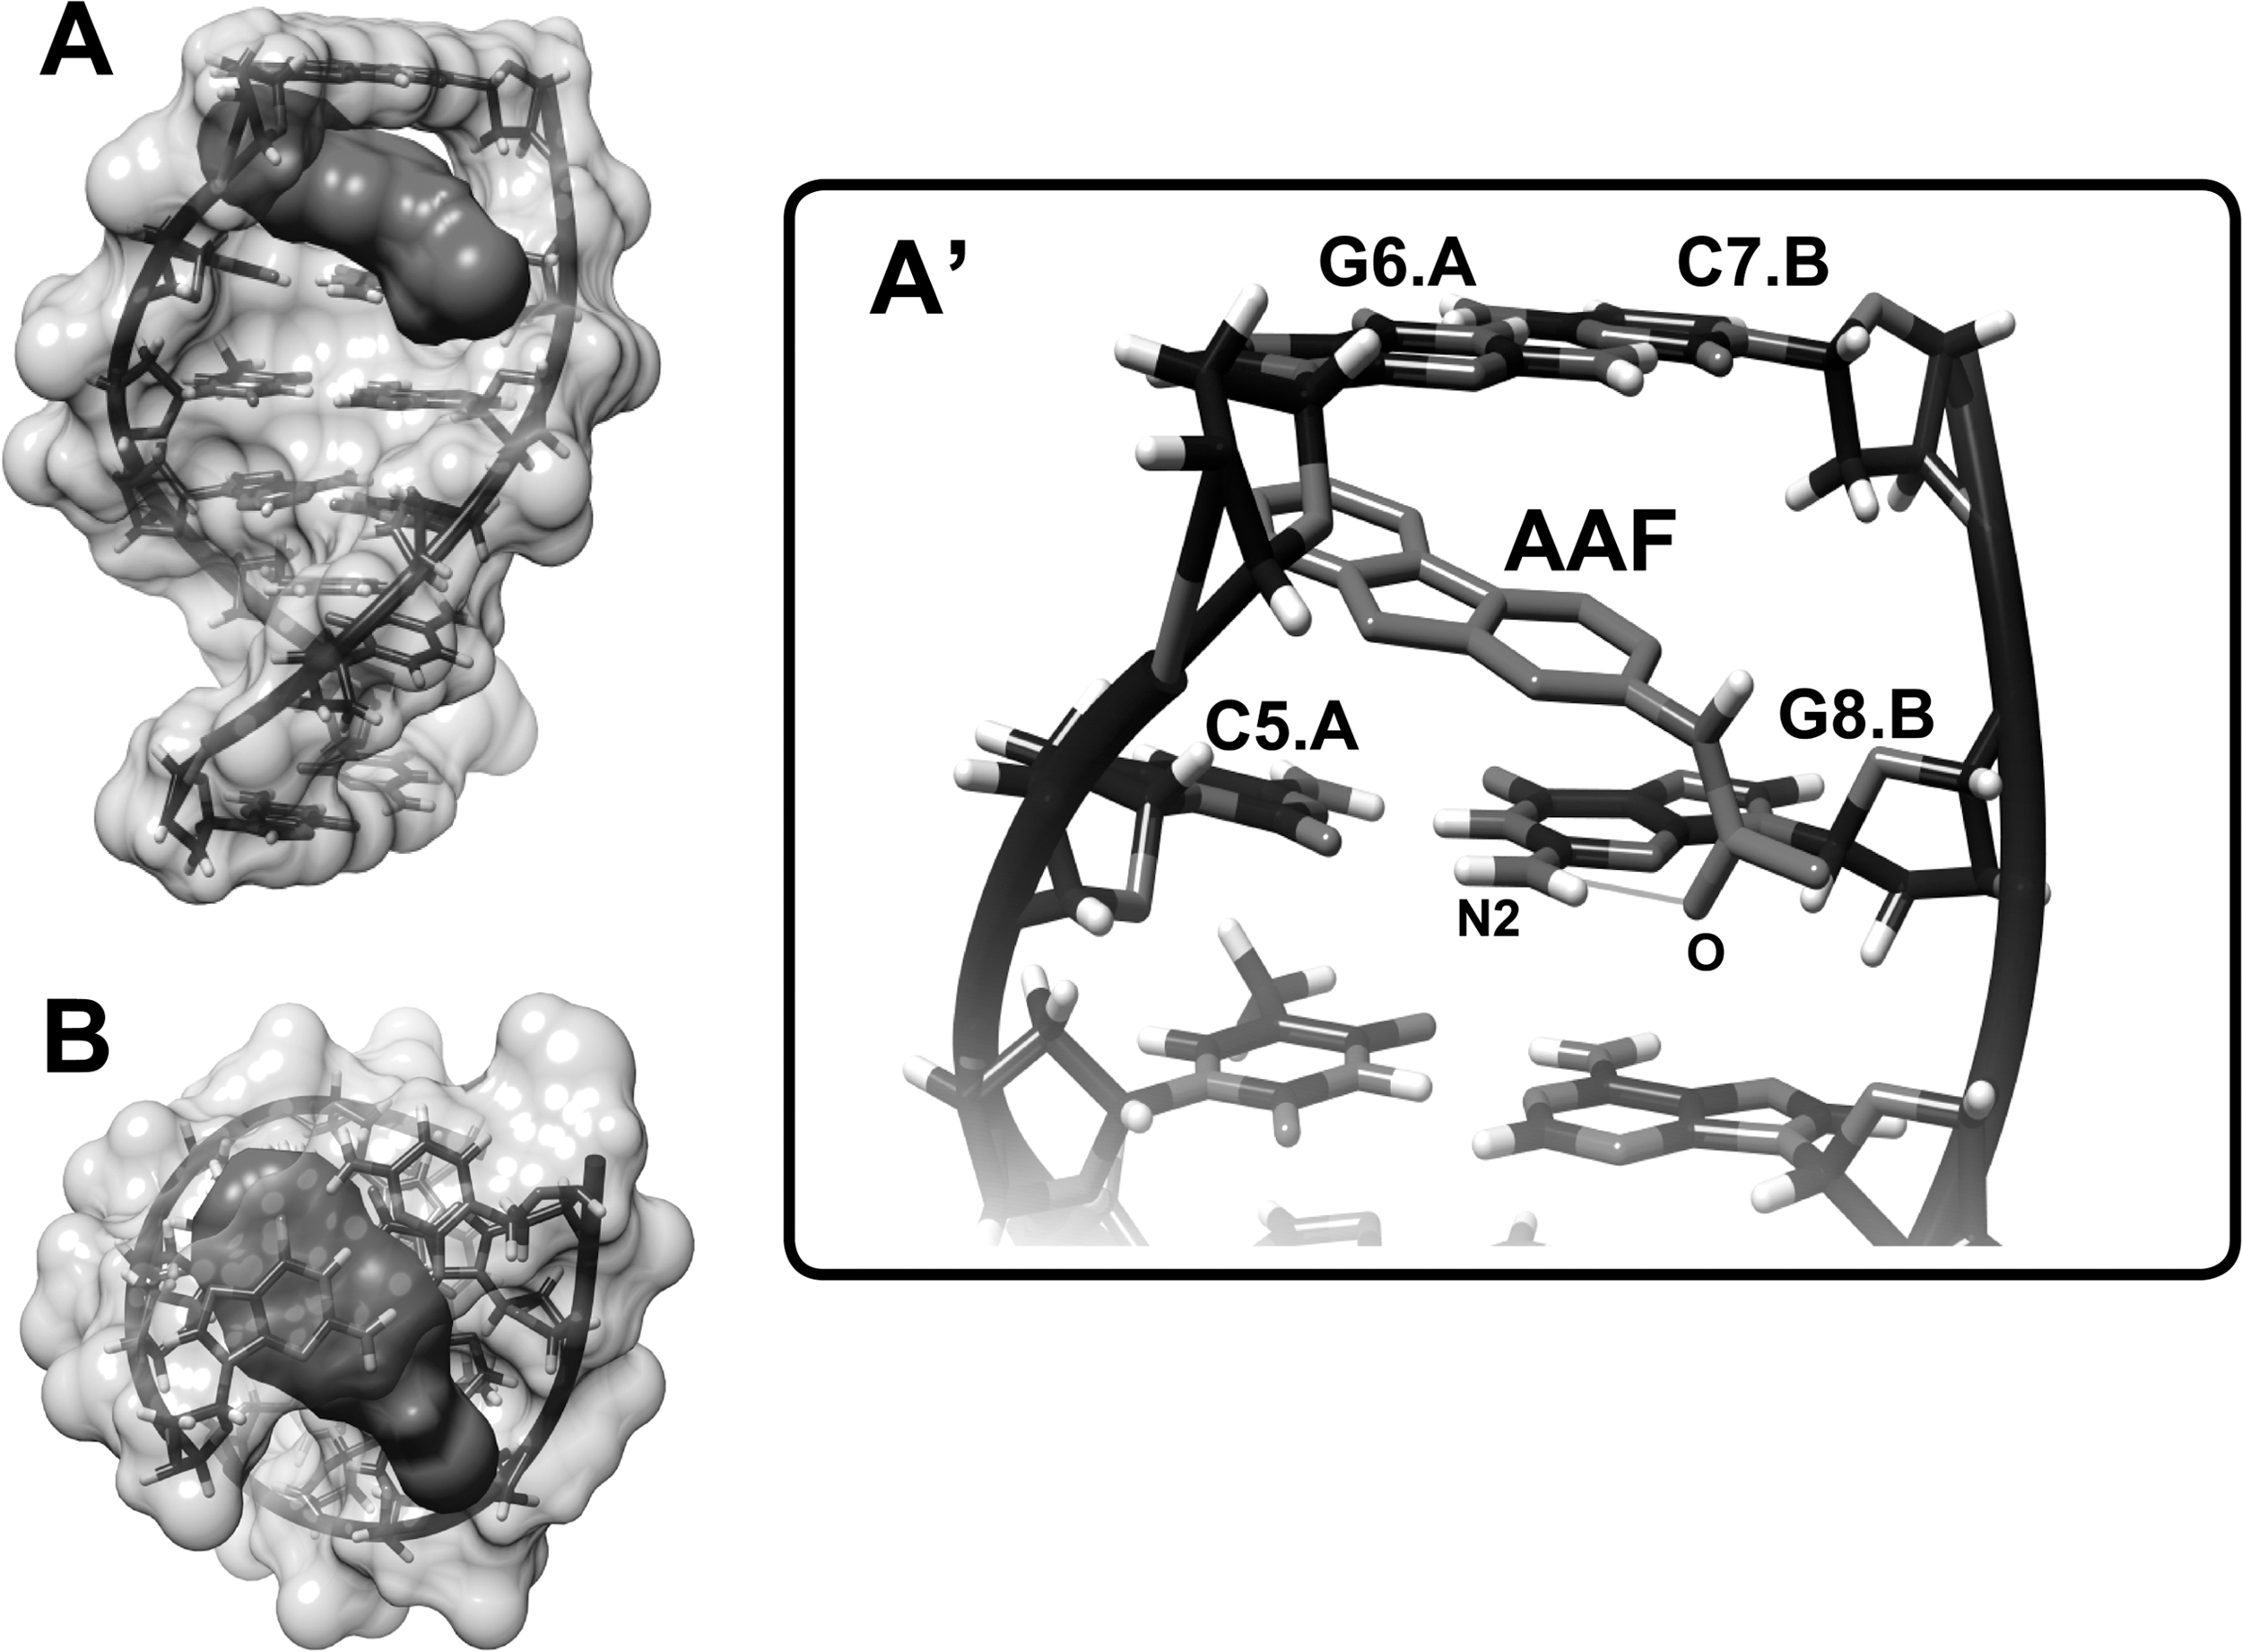
Docking structure between d(CGATCG)2 (PDB ID: 1NAB) and AAF.

Docking structure between d(CGCGAATTCGCG)2 (PDB ID: 1D30) and AAF.
ΔG binding is the sum of intermolecular energy and torsional free energy.
d(CGATCG)2.
d(CGCGAATTCGCG)2.
AAF, acetylaminofluorene; ctDNA, calf thymus DNA.
In data derived from AAF and 1NAB, the docking shows different mood energy intercalations; the structure selected was most compatible with the FTIR results. Spectroscopic evidence, FTIR, and UV results showed both intercalation and external binding of AAF to DNA (mainly with guanine). The selected docking data showed perpendicular intercalation into the oligonucleotide (1NAB) (Fig. 5). Similar perpendicular intercalations were observed in the daunomycin, adriamycin, and 2-methyl-9-hydroxyellipticinium-DNA adducts (Lerman, 1961; Frederick et al., 1990; Monnot et al., 1992; Adams, 2002; Liao et al., 2005). A hydrogen bond was formed between the carbonyl oxygen of AAF and N2 of G8 from the oligonucleotide B chain (Fig. 5). The AAF-1D30 docking results indicated the presence of a hydrogen bond between H amide of AAF and O3' of
Conclusions
Based on our spectroscopic results and docking studies, AAF strongly interacts with DNA via intercalation and external binding with overall binding constant of K AAF–DNA=2.33×10⁷. 2-AAF induced a partial B to A-DNA transition, and DNA aggregation and condensation was observed at high AAF content.
Footnotes
Acknowledgments
We thank the Northeastern University Chemistry and Chemical Biology Department and Alexandra M. Henriksen (Lab Technician) for allowing us to use their lab facilities.
Disclosure Statement
No competing financial interests exist.