
Abstract
To investigate the accumulation of intracellular advanced glycation end products (AGEs), a method was established for the simultaneous analysis of glycation products of cytosolic proteins, nuclear DNA, and mitochondrial DNA (mtDNA). Nuclear DNA, mtDNA, and cytosolic proteins were simultaneously isolated from one cell lysate by differential centrifugation and combined mechanical and chemical cell disruption methods. The major DNA-AGE N 2-carboxyethyl-2′-deoxyguanosine (CEdG) was quantified in nuclear DNA and mtDNA by ELISA, whereas the protein–AGEs N ɛ-(carboxymethyl)lysine (CML) and N ɛ-(carboxyethyl)lysine (CEL) were determined by western blot. The method was used to analyze NIH3T3 fibroblasts. In untreated cells, CEdG levels of mtDNA (14.84 ± 3.07 pg CEdG/μg mtDNA) were significantly higher compared with nuclear DNA (4.40 ± 0.64 pg CEdG/μg DNA; p < 0.001). Then, fibroblasts were analyzed after 7 days of senescence-like growth arrest. In senescent fibroblasts, the CEdG content of nuclear DNA significantly increased by 25%. However, the CEdG level of mtDNA significantly decreased to 52%; in parallel, an increase in mitochondrial mass and mtDNA was observed. Senescence did not lead to general accumulation of protein–AGEs, but two protein bands at 32 and 34 kDa showed a significant increase in the CML/CEL modification rate (208%, p < 0.001; 196%, p = 0.0016) in senescent fibroblasts compared with control cells.
Introduction
During glycation, reactive carbonyl species (RCS) react nonenzymatically with amino groups of biomolecules, leading to the formation of advanced glycation end products (AGEs). AGE-modified skin collagen has been established as a marker to predict longevity (Sell et al., 2000). RCS comprise, among others, sugars and dicarbonyl compounds such as methylglyoxal. A prominent example for glycation reactions in vivo is the modification of lysine residues in various proteins yielding N ɛ-(carboxymethyl)lysine (CML) (Dunn et al., 1989; Glomb and Monnier, 1995). In a similar way, the exocyclic amino group of 2′-deoxyguanosine can be glycated, and N 2-carboxyethyl-2′-deoxyguanosine (CEdG) was identified as a major DNA-bound AGE (Ochs and Severin, 1994). CEdG is generated from a range of RCS, such as sugars, glyceraldehyde, or methylglyoxal (Seidel and Pischetsrieder, 1998b; Frischmann et al., 2005). To date, CEdG has been detected in vitro in cultured smooth muscle cells and endothelial cells, in human urine, as well as in the human kidney and aorta (Schneider et al., 2004, 2006; Li et al., 2006). Quantitative studies of human tissues revealed CEdG levels that are comparable to those reported for 8-hydroxy-2′-deoxyguanosine (Collins et al., 2004; Synold et al., 2008). Thus, there is evidence that intracellular DNA glycation may be of similar importance as DNA oxidation and that CEdG adducts could impair the genomic structure and its functionality. CEdG modification of DNA is weakly mutagenic and leads to destabilization of the double helix, depurination, single-strand breaks, or point mutations and could block the replication process (Seidel and Pischetsrieder, 1998a; Pischetsrieder et al., 1999; Cao et al., 2007; Yuan et al., 2008). More recently, it was shown that transfection of glycated plasmids into HEK 293 T cells resulted in reduced protein expression compared with treatment by unmodified plasmid DNA (Breyer et al., 2008). Despite the growing evidence for the quantitative and functional importance of DNA glycation, hardly anything is known about factors that influence the cellular formation of CEdG.
To date, it has not been possible to differentiate between the glycation of nuclear DNA and mitochondrial DNA (mtDNA). However, it can be assumed that both types of DNA are affected differently by intracellular glycation, particularly during aging processes.
For a systematic study of cellular mechanisms that influence the intracellular glycation of DNA and proteins, the present work simultaneously analyzed glycation products of nuclear DNA, mtDNA, and cytosolic proteins. The newly developed method was then applied to study glycation processes during the long-term incubation of NIH 3T3 fibroblasts under growth arrest conditions.
Materials and Methods
Cell culture
Mouse embryo NIH 3T3 fibroblasts, obtained from the Deutsche Sammlung für Mikroorganismen und Zellkultur (GBF, Braunschweig, Germany), were cultivated in DMEM high glucose supplemented with 10% (v/v) fetal calf serum (FCS), 100 U/mL penicillin, and 100 μg/mL streptomycin at 37°C in humidified atmosphere containing 5% CO2. Cells were passaged after trypsination twice a week and seeded in a concentration of 1 × 10⁴ cells/cm2. All reagents for cell culture were purchased from Biochrom (Berlin, Germany).
Simultaneous isolation of nuclei, mitochondria, and cytosolic proteins from NIH 3T3 fibroblasts
For the isolation of nuclei and mitochondria, all steps were performed at 0°C–4°C. DMEM was discarded from confluent cells and cells were washed with 10 mL of ice-cold PBS. An aliquot of 5 mL PBS was then added and cells were harvested by scraping. Empty tissue flasks were rinsed with 5 mL PBS, which was combined with the cells. The harvested cells of five 150-cm2 flasks were combined in one 50-mL tube. Cells were counted with a Neubauer counting chamber. After centrifugation at 4°C and 1200 rpm for 10 min, the supernatant was removed and the yield of harvested cells was determined by weight. Three freeze–thaw cycles followed. For this purpose, pelleted cells were kept in liquid nitrogen for 45 s and then thawed for 2 min at 37°C in a water bath. Cells were resuspended in mitochondrial isolation buffer (buffer M), which was prepared according to Dani et al. (2003), at a concentration of 1 × 10⁷ cells/mL. Digitonin (15 μg/mL; Merck) was added to the cell suspension. Following incubation on ice for 5 min, cells were repeatedly passed through narrow-gauge needles. Nuclei, unbroken cells, and other cell debris were removed by centrifugation at 4°C and 2500 rpm for 10 min (Universal 32R centrifuge; Hettich, Tuttlingen, Germany). The supernatant was transferred to a new tube, and the pellet was resuspended in 500 μL buffer M. Both tubes underwent a second centrifugation step at 4°C and 2500 rpm for 10 min. The supernatant was removed and centrifuged a third time. The supernatant was then combined and centrifuged at 4°C and 14,000 rpm for 20 min to pellet the mitochondria. To ensure that all mitochondria were pelleted, the supernatants were centrifuged again. The radius of the rotor used for differential centrifugation was 66 mm. The yield of mitochondria was determined by weight. The final supernatant was collected as cytosolic protein fraction. Protease inhibitor cocktail tablets (Roche Applied Science, Mannheim, Germany) were immediately added in a concentration of 1 μg/mL. Protein content was determined using the DC Protein Assay (Bio-Rad, Munich, Germany). Protein fractions were stored at −80°C until further analysis.
Isolation of DNA from nuclei and mitochondria
The pelleted nuclei and the pelleted mitochondria were separately pooled and suspended in 600 μL extraction buffer (10 mM Tris and 5 mM EDTA [pH 8.0], supplemented with 0.5% Tween-20). An aliquot of 20 μL aminoguanidine (0.5 M in water; Sigma-Aldrich, Taufkirchen, Germany) was added directly after suspension to inhibit glycation reactions during the isolation procedure. After addition of 15 μL RNase (Fermentas, St. Leon-Rot, Germany), each tube was incubated in a thermomixer (550 rpm) at 37°C for 1 h. Nuclei and mitochondria were digested by adding 30 μL proteinase K (Fermentas) and incubated at 55°C for 3 h. For complete digestion, both fractions were then incubated at 37°C overnight (Dani et al., 2003). The next day, additional 30 μL of proteinase K was added to each tube and incubated at 55°C for 2 h. After cooling to room temperature (RT), 600 μL of a mixture of phenol/chloroform/isoamyl alcohol (25/24/1) was added, followed by incubation for 5 min at RT. Phase separation was achieved by centrifugation at 4°C and 15,000 rpm for 10 min. The supernatant was transferred to a fresh tube and an identical volume of 3 M sodium chloride was added. After the addition of 0.6 volumes of pure isopropanol, the tubes were stored at −20°C for 2 h to allow DNA precipitation. DNA was then pelleted by centrifugation at 4°C and 12,000 rpm for 1 h. The supernatant was discarded, 300 μL of ethanol (70%) was added, and the mixture was centrifuged at 4°C and 12,000 rpm for 1 h. The pellets were then air-dried, dissolved in PBS, and stored at −20°C until further analysis. DNA concentration was determined by UV measurement at 280 nm. The ratio A 260/280 was always greater than 1.8.
Assay for succinate dehydrogenase activity
The mitochondrial pellet was suspended in 1 mL of buffer M containing 15 μg/μL digitonin. The protein concentration in the mitochondrial fraction was determined using the DC Protein Assay. Three cuvettes were prepared, each containing 10% sodium azide (0.04 M), 10% sodium succinate (0.2 M), and 10% of 2,6-dichlorophenolindophenol (DCPIP; 500 μM) in succinate dehydrogenase (SDH) assay buffer (0.3 M
PCR analysis of the isolated mtDNA
The following primers were used: smt269 (5′ GCAACCCTACACGGAGGTAA 3′) and amt269 (5′ AAGTGGGCTTTTGCTCATGT 3′; Invitrogen, Karlsruhe, Germany). Cross reactivity of the selected primers was excluded by UCSC in silico PCR. Samples of 250 ng were amplified using 24 cycles of denaturation for 30 s at 94°C, annealing for 30 s at 60°C, and extension for 30 s at 72°C. PCR products were analyzed on 1.0% agarose gels.
Proliferation assay of senescent fibroblasts
To determine the appropriate serum concentration for the long-term incubation of fibroblasts under senescence-like conditions, confluent fibroblasts were cultured in 96-well plates (Biochrom) in DMEM with 10%, 3.6%, 2.4%, and 1.2% FCS for 7 days. Medium was changed every other day during the incubation period. The proliferation rate of senescent fibroblasts was measured using the cell proliferation reagent WST-1 according to the manufacturer's instructions (Roche Applied Science). Incubation with WST-1 was performed in DMEM without phenol red (Biochrom) for 60 min at 37°C. Spectrometric measurement was performed at 440 nm (reference wavelength: 650 nm).
Senescence-like growth arrest of NIH 3T3 fibroblasts
For serum starvation, ten 150-cm2 flasks of 80% confluent fibroblasts were cultured in DMEM containing 2.4% FCS for 7 days. The medium was changed every other day. After 7 days, fibroblasts deprived of serum were harvested, and nuclear DNA, mtDNA, and cytosolic proteins were isolated as described earlier. At the first day of serum reduction, 10 additional 150-cm2 flasks of fibroblasts (same passage as used for the long-term incubation) were harvested as control, and nuclear DNA, mtDNA, and cytosolic proteins were isolated as described earlier.
Competitive ELISA for CEdG
Prior to ELISA, the DNA was denatured to make CEdG adducts more accessible for the antibody, thus increasing sensitivity. To exclude artificial CEdG formation during the denaturing step, the influence of the denaturing time on the measured CEdG concentration was analyzed. Increasing incubation times from 5 to 10 or 20 min did not result in significantly higher CEdG concentration, indicating that DNA denaturation does not lead to artificial CEdG formation (data not shown). Therefore, denaturation was performed at 99°C for 5 min prior to each ELISA measurement. The formation of CEdG modifications of isolated nuclear and mtDNA was then monitored by ELISA as previously described (Breyer et al., 2008). The concentration of CEdG was calculated from a calibration curve using CEdGA,B as standard. The intra-assay precision within triplicates was 5.50% (n = 59) and the interassay precision was 3.50% (n = 4).
Coomassie staining of SDS-PAGE–separated proteins
SDS-PAGE of the cytosolic proteins was performed according to Laemmli (1970). Fifteen micrograms of proteins per lane was loaded onto a 12% acrylamide gel and separated at 150 V for 80 min. After electrophoresis was completed, the gels used for Coomassie staining were rinsed twice with water. Colloidal Coomassie staining solution was used according to Kang et al. (2002) with few modifications (0.02% Coomassie brilliant blue [G250; Bio-Rad] in 2% [w/v] phosphoric acid, 5% aluminum sulfate, and 10% ethanol). The gels were stained for 3 h, followed by protein fixation in 30% ethanol containing 2% phosphoric acid for 20 min. Linearity of staining was verified using different amounts of bovine serum albumin (BSA) per lane. Gels were analyzed using the Bio-Rad Imaging software. To determine the relative concentration of different proteins, their signal intensity was normalized to the intensity of the actin band.
Synthesis of CML- and CEL-modified BSA
CML-modified BSA was synthesized according to Kislinger et al. (1999). N ɛ-(carboxyethyl)-lysine (CEL)–modified BSA was synthesized as described by Koito et al. (2004).
Western blot analysis for AGE-modified proteins
Western blotting was performed using a polyclonal CML antibody (from rabbit, ab27684; Abcam, Cambridge, United Kingdom). Preliminary experiments showed that this CML antibody also detected CEL modifications, but to a much lower extent. Fifteen micrograms of the cytosolic protein fraction, which was prepared as described earlier, was loaded onto a 12% acrylamide gel followed by electroblotting (1 h at 150 mA) to PVDF membranes. Equal loading was confirmed by Ponceau red staining (2.6 mM Ponceau S and 180 mM trichloracetic acid). Blocking with commercially available proteins, such as BSA or skim milk powder, for example, led to relatively high background noise. SDS-PAGE followed by western blot for AGEs detected AGE modifications of the blocking proteins. Therefore, blocking was performed by the polymer-based blocking reagent Roti-Block (Roth, Karlsruhe, Germany) for 1 h at RT. Membranes were incubated overnight at 4°C with polyclonal CML antibody diluted 1:1500 in blocking solution. The membranes were washed four times for 10 min with TBS-T (20 mM Tris, 0.15 M sodium chloride, and 0.1% Tween-20). The secondary antibody (horseradish peroxidase-coupled rabbit IgG, 1:6000; Sigma-Aldrich) was added and incubation was continued for 60 min at RT. Membranes were washed four times for 10 min with TBS-T, followed by detection of immunoreactive proteins using the ECL western blot system (GE Healthcare, Freiburg, Germany) with exposure times from 10 s to 5 min. Films were analyzed using the Imaging software (Bio-Rad). Specificity of the CML antibody was ensured by preincubation of the antibody with synthesized CML-BSA, which completely abolished the signals. Preincubation with CEL-BSA resulted in diminished signal intensity, but did not completely abolish the signal. For normalization, an identically loaded acrylamide gel was simultaneously stained with Coomassie blue to each western blot. To investigate the AGE modification rate of each protein, the signal intensity on the AGE western blot was normalized to the relative protein concentration as determined by Coomassie blue staining. To record changes in AGE formation during cellular senescence, the AGE signal of senescent cells was divided by the AGE signal of control cells. The AGE modification rate of proteins for which no protein band could be detected in the control cells was not normalized to the relative protein concentration.
Peptide mass fingerprint
After Coomassie staining, the protein band of interest was cut into small pieces (1 mm × 1 mm) and washed twice with 100 μL of water and once with 100 μL of acetonitrile, followed by equilibration with 100 μL of 25 mM ammonium bicarbonate buffer (pH 8.0). For destaining, 100 μL of acetonitrile and 10 μL of 25 mM ammonium bicarbonate buffer (pH 8.0) were added, and the gel pieces were incubated for 30 min at RT under intensive shaking. After removal of the destaining solution, the gel pieces were incubated twice with acetonitrile and finally dried under the hood for 10 min. An aliquot of 2 μL trypsin solution (corresponding to 0.2 μg of enzyme; Roche Applied Science) was added. Following incubation for 10 min at 4°C, the gel pieces were covered with 25 mM ammonium bicarbonate buffer (pH 8.0) and incubated at 37°C for 18 h.
After enzymatic hydrolysis, 100 μL acetonitrile (60%) was added to the gel. The mixture was vortexed and incubated at RT for 15 min. The supernatant was transferred to a clean tube. The gel pieces were then incubated for 15 min with 100 μL of 80% acetonitrile/0.1% trifluoroacetic acid (TFA), and the supernatant was added to the first eluate. After incubation with 100 μL acetonitrile, the combined solutions were lyophilized and resolved in 10 μL of TFA (0.1%). To reduce the peptides, the solution was incubated for 30 min with 1 μL dithiothreitol (100 mM; Sigma-Aldrich).
The eluted and reduced peptides were purified by C18 Zip Tips (Millipore, Schwalbach, Germany). The Zip Tips were wetted twice with 10 μL of acetonitrile and equilibrated with 0.1% TFA. Peptides were bound to the material by aspirating the sample 10 times. Following two washing steps with 100 μL TFA (0.1%) and with 100 μL of 5% methanol/0.1% TFA, peptides were eluted by aspirating 10 μL of 50% acetonitrile/0.1% TFA 10 times. For measuring the peptides from in-gel hydrolysis, 2 μL of the reduced and purified digest was diluted with 2 μL of a matrix consisting of a 1:1 mixture of a saturated solution of R-cyano-4-hydroxycinnamic acid (Fluka, Taufkirchen, Germany) in 50% acetonitrile/0.1% TFA, and a solution of 10 mM ammonium dihydrogen phosphate in 50% acetonitrile/0.1% TFA. An aliquot of 1 μL of the dilution was spotted onto a stainless-steel target and was air-dried. The MALDI-TOF-MS analysis was carried out on a Bruker Autoflex (Bruker Daltonik, Bremen, Germany) equipped with a nitrogen laser (λ = 337 nm) by delayed extraction (140 ns). Laser-desorbed positive ions were analyzed after acceleration by 19 kV in the reflector mode. External calibration was performed with a mix of angiotensin I and II, substance P, bombesin, adrenocorticotropic hormone clips 1–7 and 18–39, and somatostatin 28. For each displayed mass spectrum, 150 individual spectra obtained from several positions on a spot were averaged. The MALDI spectra of the tryptic fragments were searched against the Swissprot protein databases using the MASCOT search engine (
Data analysis
Statistical analyses were performed using the unpaired Student's t-test. Significance level was p < 0.05.
Results
Isolation of nuclear DNA, mtDNA, and cytosolic proteins from NIH 3T3 fibroblasts
Nuclear DNA, mtDNA, and cytosolic proteins were isolated simultaneously from one cell lysate using differential centrifugation and a combination of mechanical and chemical cell disruption methods. As estimated by light microscopy, 80% of the cells were disrupted. After separation of nuclei and mitochondria by differential centrifugation, nuclear DNA and mtDNA were separately isolated. The supernatant was collected as the cytosolic protein fraction.
To ensure that the mitochondrial pellet indeed contained the mitochondria, the isolated fraction was analyzed for mitochondrial SDH activity. The mitochondrial fraction (protein concentration: 0.781 mg/mL) led to a color reduction of 60.31% (n = 3, p < 0.01) in 170 min, revealing strong SDH activity (Fig. 1A). The postmitochondrial supernatant (protein concentration: 1.112 mg/mL), in contrast, did not show SDH activity. Thus, mitochondria were present in the selected fraction. To further verify the presence of mtDNA, PCR analysis was performed with mitochondria-specific primers. The expected PCR product of 269 bp was generated using the isolated mtDNA as template (Fig. 1B).
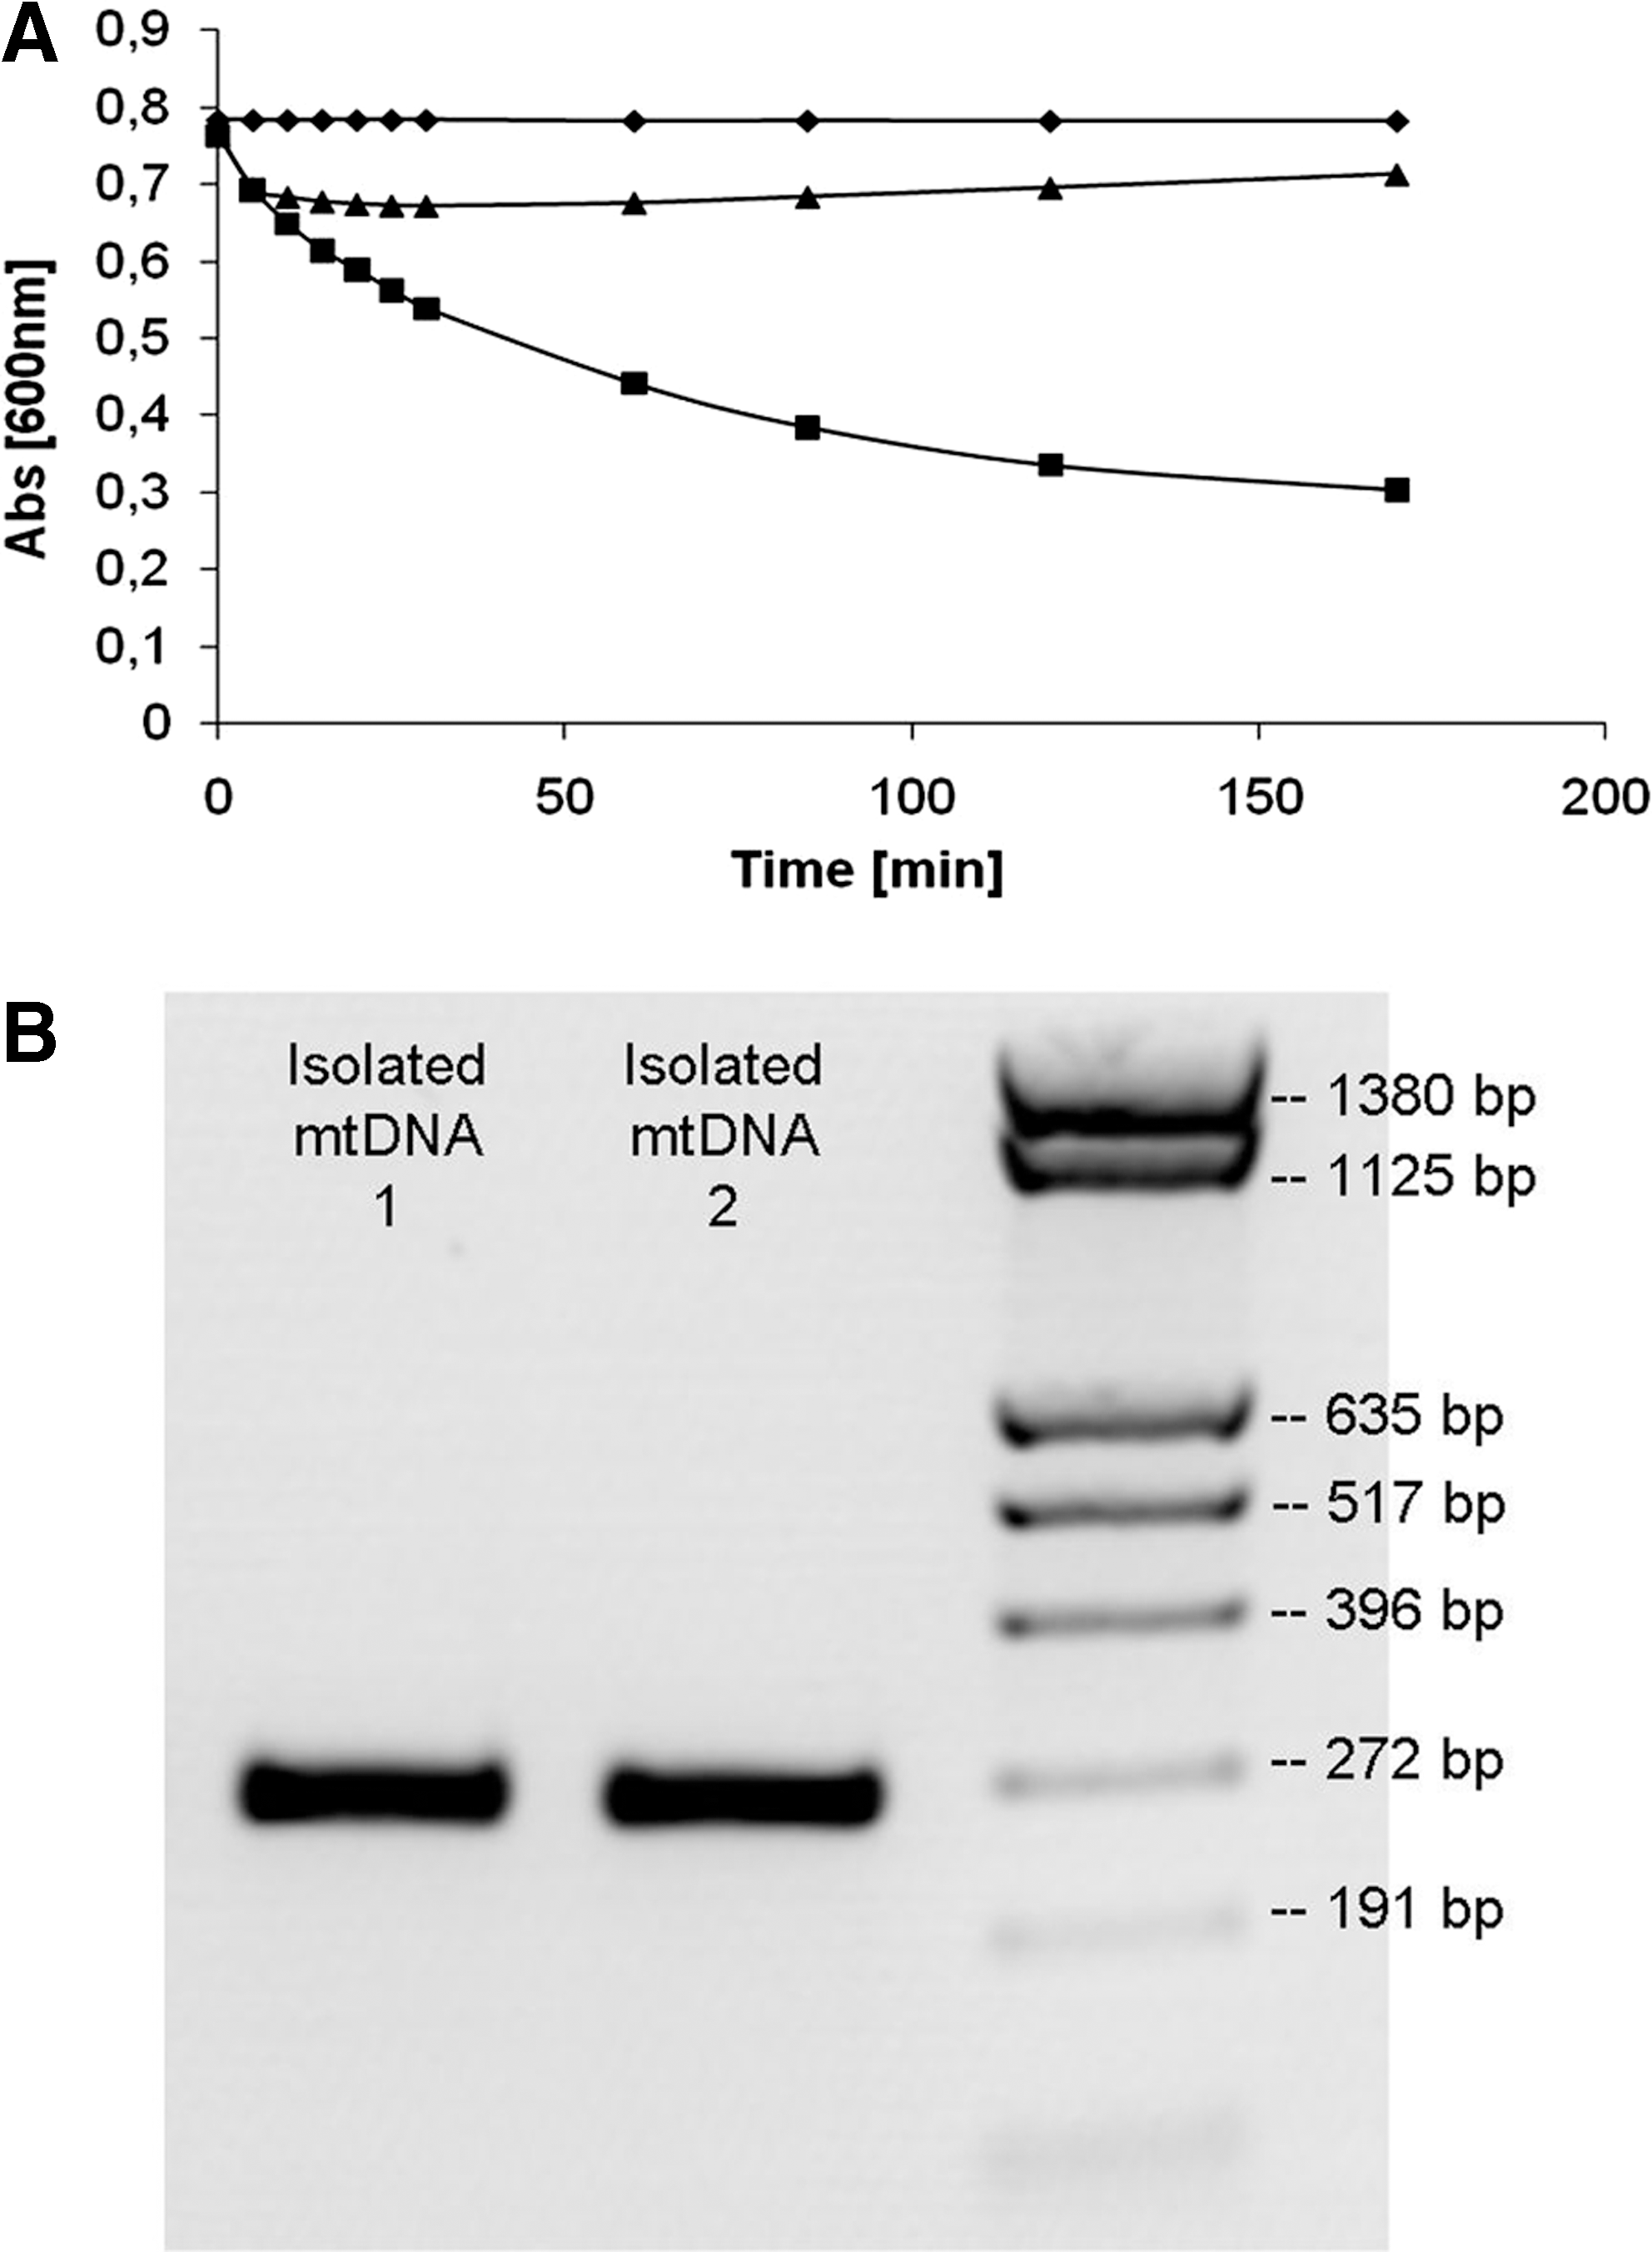
Identification of mitochondrial fraction and mitochondrial DNA (mtDNA).
To prevent artificial glycation reactions during workup, aminoguanidine, a well-established scavenger of RCS and ROS, was added prior to DNA isolation (Giardino et al., 1998; Saraiva et al., 2006). Table 1 shows the yield of nuclear DNA, mtDNA, and cytosolic proteins per cell. The results were consistent with Shay et al. (1990), who isolated 11.7 pg DNA of total DNA and 146 pg proteins per cell. However, the yield of mtDNA could not be compared, as Shay et al. quantified mtDNA by PCR out of the total DNA solution instead of separately isolating nuclear DNA and mtDNA. There was no significant difference in the yield of nuclear DNA or cytosolic proteins when control cells were compared with senescent fibroblasts. However, the amount of mtDNA increased during senescence-like growth arrest to 157% (n = 5, p < 0.05; ranges of standard deviation, however, overlapped) compared with control cells.
Protein yield was measured using the DC protein assay. DNA concentration was determined by UV measurement. Cells were counted using a Neubauer counting chamber after trypan blue staining. At least five isolation procedures were performed for one data point. Each data point represents the mean value ± standard deviation.
mtDNA, mitochondrial DNA.
Determination of optimal conditions for the long-term growth arrest of NIH 3T3 fibroblasts
Evaluation of the optimal serum concentration for the senescence-like growth arrest of NIH 3T3 fibroblasts was performed by incubating the cells for 7 days in culture medium supplemented with 10%, 3.6%, 2.4%, and 1.2% FCS. Cell viability was monitored in all samples with trypan blue staining. Reduction of the serum concentration had no effect on cell viability. During 7 days of incubation, the cell viability always exceeded 91% (data not shown). Each day, the cell proliferation was analyzed using the WST-1 cell proliferation assay (Fig. 2). When comparing control cells (10% FCS) and senescent fibroblasts, changes in cell proliferation became significant on the third day of cultivation. Cells in medium supplemented with 3.6% FCS showed growth arrest during the first 4 days of cultivation, but an increase in cell proliferation by 50% was observed during the following 3 days. The cell proliferation of cells cultured in medium containing 2.4% FCS remained constant with minor fluctuations of 20% during the whole incubation period. Cells grown in medium containing 1.2% FCS showed a decrease in cell proliferation, which became significant compared with the starting value on the third day of incubation. Therefore, medium containing 2.4% FCS was chosen for further experiments. To analyze the effect of senescence-like growth arrest on nuclear DNA, mtDNA, and cytosolic proteins of NIH 3T3 fibroblasts, long-term–incubated cells (7 days) were compared with control cells of the same passage that were immediately harvested without additional incubation.

Cells were incubated in DMEM with different amounts of fetal calf serum for 7 days: 10% (♦), 3.6% (□), 2.4% (▴), and 1.2% (×). Cell proliferation was analyzed using cell proliferation reagent WST-1.
Determination of CEdG content of nuclear DNA and mtDNA in control and senescent fibroblasts
To measure CEdG in nuclear DNA and mtDNA from cultured fibroblasts, an ELISA was developed using a monoclonal antibody against CEdG. Nuclear DNA isolated from untreated cells contained 4.40 ± 0.64 pg CEdG per μg DNA. In mtDNA, a significantly higher glycation rate was detected than in nuclear DNA (14.84 ± 3.07 pg CEdG per μg mtDNA; Fig. 3). After senescence-like growth arrest, the nuclear CEdG level increased to 125% ± 20% (n = 7, p < 0.01) relative to control cells. However, the glycation rate of mtDNA isolated from senescent fibroblasts decreased to about 52% ± 9% (n = 3, p < 0.001; Fig. 4).

N 2-Carboxyethyl-2′-deoxyguanosine (CEdG) modification of nuclear and mtDNA isolated in parallel from NIH 3T3 fibroblasts. Error bars indicate standard deviation (mtDNA: n = 5; genDNA: n = 8; ***p < 0.001).

Changes of CEdG content in nuclear and mtDNA isolated in parallel from control and senescent NIH 3T3 fibroblasts. Cells were kept in a medium containing 2.4% fetal calf serum for 7 days. Control cells of the same cell passage were harvested right before the start of the incubation period. CEdG levels of control cells were considered 100%. Error bars indicate standard deviation (mtDNA: n = 3; genDNA: n = 7; **p < 0.01, ***p < 0.001).
Analysis of protein AGE modifications in senescent fibroblasts
As the ELISA of the cellular protein fractions did not provide reliable results, the AGE modification of cellular proteins was assessed by western blot using an antibody that detects both CML and CEL. Specificity of the AGE antibody for CML and CEL was ensured by preincubation of the antibody with synthesized CML-BSA and CEL-BSA, respectively, which abolished the signals of the western blot (data not shown). Simultaneously with each western blot, an identically loaded acrylamide gel was stained with Coomassie blue, which served as a reference for AGE quantification. A similar staining pattern was also obtained by silver staining (data not shown). In the cytosolic protein fraction of the control fibroblasts, AGEs were detected over the whole range of proteins. To assess AGE accumulation during senescence-like growth arrest, all visible bands in the AGE western blot were quantified and signal intensities were compared between control and senescent cells. No general accumulation of protein AGEs during 7 days of senescence-like growth arrest was detected. However, four bands at 32, 34, 50, and 57 kDa showed stronger CML/CEL staining in the senescent fibroblasts than in the control cells. In parallel, the expression of three of these bands was upregulated during senescence-like growth arrest. Normalized to the corresponding protein band in the Coomassie gel, the CML/CEL signals of the bands at 32 kDa (208% ± 49%, n = 7, p < 0.001) and at 34 kDa (196% ± 70%, n = 8, p = 0.0016) approximately doubled during senescence-like growth arrest (Fig. 5B). The staining of the bands at 50 kDa (142% ± 29%, n = 10, p < 0.001) and at 57 kDa (125% ± 29%, n = 6, p = 0.058) on the AGE blot of the senescent cells showed a smaller increase and a nonsignificant increase, respectively, compared with the control cells. However, the AGE signals of the 50 and 57 kDa proteins were not normalized, as no signal could be detected for the control cells at the respective molecular weight on the Coomassie stain. The peptide mass fingerprint of the preferentially glycated proteins was recorded by in-gel hydrolysis with trypsin and MALDI-TOF-MS analysis. However, because of the low expression rate of these proteins (Fig. 5B, Coomassie-stained gel), the signal-to-noise ratio was too low for unambiguous protein assignment.
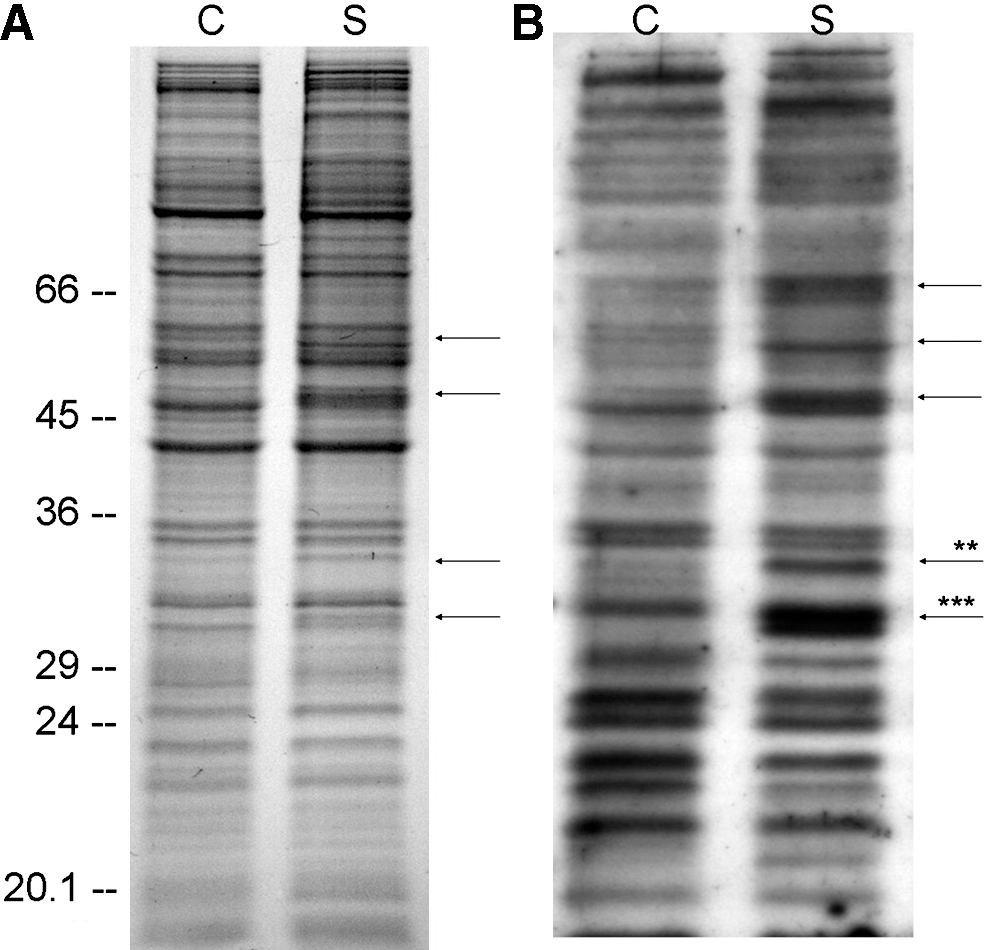
Changes of N
ɛ-(carboxymethyl)lysine (CML)/N
ɛ-(carboxyethyl)lysine (CEL) content of cytosolic proteins in NIH 3T3 fibroblasts during senescence.
Discussion
The present study developed a method for the simultaneous isolation of nuclear DNA, mtDNA, and cytosolic proteins from one cell lysate of NIH 3T3 fibroblasts that allows the consecutive analysis of glycation products in these fractions. The method can be applied to systematically determine cellular factors that influence the formation of DNA and protein glycation products using different cell models. As all three biomolecules are isolated from the same cell lysate, their modification rates can be optimally compared. The method produced nuclear DNA and mtDNA of high yield and high purity. AGEs were analyzed in all three isolated fractions of NIH 3T3 cells by CEdG ELISA or CML/CEL western blot. In untreated fibroblasts, CEdG levels were higher in mtDNA than in nuclear DNA. To our knowledge, glycation of mtDNA has not been studied so far. However, it can be assumed that there are fundamental differences between glycation processes of nuclear DNA and mtDNA. First, mtDNA is localized in close proximity to the sites of oxygen radical production. Second, mtDNA lacks protecting histones and possesses less-robust DNA repair mechanisms than nuclear DNA. It has been previously shown that other DNA lesions, mainly oxidative damage, affect mtDNA to a much higher extent than nuclear DNA (Yakes and Van Houten, 1997). There is also strong evidence that oxidative stress promotes the formation of AGEs (Baynes and Thorpe, 1999). ROS cause lipid or sugar oxidation, further leading to elevated levels of RCS, which can be precursors for CEdG formation. It can, therefore, be assumed that ROS generated by mitochondria may lead to an accumulation of CEdG in mtDNA. Cellular oxidative stress further leads to a depletion of glutathione, which is an essential cosubstrate of glyoxalase-I. Glyoxalase-I catalyzes the degradation of methylglyoxal, a potent intracellular precursor for CEdG (Thornalley, 2003; Frischmann et al., 2005). Thus, mitochondrial oxidative stress may promote methylglyoxal-derived DNA glycation during aging via reduced glyoxalase-I activity (Shinohara et al., 1998; Morcos et al., 2008). All these processes together may then be responsible for the elevated glycation rate of mtDNA compared with nuclear DNA as observed in the present study.
In addition to DNA-AGEs, the glycation of cytosolic proteins was investigated. AGE modification of the cytosolic proteins was analyzed by western blot using antibodies directed against CML and CEL. The results showed a wide distribution of CML/CEL modifications over the whole protein range, which can be explained by the easy accessibility of cytosolic proteins to RCS and ROS. The relevance of intracellular protein–AGE formation was also underlined by two other studies showing a wide distribution of CML modifications in liver mitochondrial proteins and an increase of AGE-modified cytosolic proteins under conditions of carbonyl stress (Giardino et al., 1994; Bakala et al., 2003).
Serum starvation has been reported to cause both cell cycle arrest and quiescence (Demidenko and Blagosklonny, 2008). Incubation of cells with reduced serum concentration is, therefore, often used as a model to analyze aging-like processes in cultured cells. It has been reported that, after serum starvation, NIH 3T3 cells are arrested in a nondividing state and are claimed to be “out of cycle” (Cooper, 2003). Thus, the serum concentration in the culture medium was reduced to 2.4% in order to force NIH 3T3 cells to rest in a quiescent, nondividing state to allow an accumulation of modifications induced by endogenous processes.
During 7 days of senescence-like growth arrest, the amount of CEdG in nuclear DNA increased by 25% compared with control fibroblasts. This result clearly demonstrates that CEdG accumulates in the DNA of nonproliferating cells, which has been postulated by preliminary experiments (Breyer et al., 2008). Thus, it can be assumed that in vivo, DNA-AGEs can accumulate in a similar way in postmitotic tissues, such as brain. As glycation is a permanent endogenous process, DNA glycation could contribute to the accumulation of DNA damage, which is a fundamental process in aging (Holmes et al., 1992; Lawless et al., 2010). Analogous mechanisms have been well established for DNA oxidation. In vivo, the accumulation of CEdG may be further enhanced by the decline of DNA repair in terminally differentiated cells (Nouspikel and Hanawalt, 2002).
On the other hand, the CEdG level of mtDNA decreased during senescence-like growth arrest. Under oxidative stress as well as during replicative cell senescence, the mitochondrial mass and also the mtDNA copy number increase (Wei et al., 2001; Lee et al., 2002) to compensate the decline in the respiratory function. An analogous effect was observed in the present study, as both the mitochondrial mass and the amount of mtDNA were elevated in senescent fibroblasts. In addition, serum starvation can induce autophagy, and serum deprivation-induced mitophagy has been reported (Kim et al., 2007). Autophagic delivery to lysosomes is the major degradative pathway in mitochondrial turnover, and the term mitophagy is used to refer to mitochondrial degradation by autophagy. It can be concluded that the observed decrease in CEdG content of mtDNA in senescent fibroblasts is, on the one hand, a result of the formation of newly synthesized, unmodified mtDNA and, on the other hand, has been caused by the degradation of defective mitochondria, resulting in an elimination of highly glycated mtDNA molecules.
Senescence-like growth arrest did not lead to a general accumulation of protein-bound CML/CEL. In the CML/CEL blot of senescent cells, however, stronger staining of protein bands at 32, 34, 50, and 57 kDa was observed compared with the control cells. Normalized to the protein expression, the CML/CEL content of still unidentified proteins with a molecular weight of 32 and 34 kDa significantly increased during the incubation under senescence-like conditions.
Conclusion
In the present study, a new method that allows the simultaneous analysis of AGEs of nuclear DNA, mtDNA, and cytosolic proteins in living cells was developed. Application of this method revealed that mtDNA is, in general, more susceptible to glycation than nuclear DNA in cultured fibroblasts. Senescent NIH 3T3 fibroblasts showed an enhanced glycation rate of nuclear DNA, but the glycation rate of mtDNA decreased during senescence-like growth arrest. Further, preferential targets of glycation were detected in the cytosolic protein fraction. The newly developed cell fractionation and analytical methods could be applied to systematically analyze cellular factors that influence glycation of nuclear DNA, mtDNA, and cytosolic proteins.
Footnotes
Disclosure Statement
No competing financial interests exist.