
Abstract
The interaction of native calf thymus DNA with ethylenediaminetetraaceticacid (EDTA) in Tris-HCl buffer at pH = 7.8 (at this pH EDTA forms a disodium salt) was investigated. EDTA is widely used in medicine, food technology, and the chemical industry. The DNA binding mode of EDTA was monitored by absorption spectrophotometry, circular dichrosim, viscometry, and gel electrophoresis. Ultraviolet spectra of DNA showed small hyperchromicity with increase in EDTA concentration. The circular dichrosim signals at 245 and 280 nm indicated structural changes in DNA structure, and no significant effect on DNA viscosity was observed in the presence of increasing amounts of EDTA. Results are indicative of an outside, nonintercalative binding mode of EDTA to DNA. Moreover, gel electrophoresis studies showed considerable oxidative cleavage of plasmid DNA by EDTA. Mechanistic aspects of the chemical nuclease reactions were investigated using the OH radical quencher dimethylsulfoxide. In the presence of selenium, DNA cleavage by EDTA was inhibited.
Introduction

The structures of EDTA
The susceptibility of lipids to oxidation is one of the major causes of quality deterioration in many types of natural and processed foods. Lipid oxidation leads to changes in the quality of food, such as taste, texture, shelf life, appearance, and nutritional value. Effects of lipid oxidation are also major causes of many pathological effects, such as cardiovascular disease, cancer, and brain dysfunction as well as the aging process, as lipid oxidation is a chain process; there are two mechanistically distinct classes of antioxidants that can be used to retard lipid oxidation. One group controls the radical chain-breaking mechanism, and the other group, which prevents introduction of chain-initiating radicals, includes propyl gallate, ascorbic acid, and EDTA (Jittrepotch et al., 2006). The omega-3 fatty acids found in fish oil have been found to be clinically beneficial to health, although they are extremely sensitive to lipid oxidation; EDTA has been shown to dramatically retard lipid oxidation in salmon oil-in-water emulsions by removing iron from the droplet surface. High concentrations of EDTA in relation to iron will inhibit lipid oxidation by surrounding the metal and preventing interaction with peroxides (Alamed et al., 2006).
EDTA affects DNA in primary cultures of mammalian cells; this may be due to impairment of enzymes involved in DNA replication. Some early studies have shown that EDTA leads to morphological changes of chromatin and chromosome structure in plant and animal cells; this alteration consists of dispersion or swelling of chromosomes or a loss of interphase chromatin structure; for several test systems, a low chromosome-breaking activity of EDTA has been reported, a weak activity in the induction of gene mutations has also been shown (Heindorff et al., 1983).
Small molecules can react with DNA via covalent or non-covalent interactions. There are several sites in the DNA molecule where such binding can occur: (i) between two base pairs (full intercalation), (ii) in the minor groove, (iii) in the major groove, (iv) on the outside of the helix, and (v) electrostatic binding (Kashanian and Ezzati Nazhad Dolatabadi, 2009).
In the present study, we investigated the interaction of native calf thymus DNA (CT DNA) with EDTA in 10 mM Tris–HCl aqueous solutions at pH 7.8 (EDTA altered to its disodium salt at this pH) in vitro using ultraviolet (UV)/Vis (visible) spectroscopic, viscometric, and circular dichrosim (CD) instrumental methods. Gel electrophoresis was also used to determine the mechanism of DNA cleavage by EDTA.
Material and Methods
Chemicals and materials
Highly polymerized CT DNA and Tris–HCl, EDTA, agarose, dimethylsulfoxide (DMSO), ethidium bromide were purchased from Sigma. All solutions were prepared using double distilled water. Tris–HCl buffer solution was prepared from (Tris–(hydroxymethyl)-amino-methane–hydrogen chloride), and pH was adjusted to 7.8. The stock solution of DNA was prepared by dissolving of DNA in double-distilled water. A solution of CT-DNA gave a ratio of UV absorbance at 260 and 280 nm more than 1.8, indicating that DNA was sufficiently free from protein (Kashanian and Ezzati Nazhad Dolatabadi, 2009). The concentration of the nucleotide was determined by UV absorption spectroscopy using the molar absorption coefficient (ɛ = 6600 M cm−1) at 260 nm. The stock solution was stored at 4°C. An EDTA stock solution (1 × 10⁻³M) was prepared by dissolving an appropriate amount of the compound in Tris–HCl buffer.
Physical measurements and instrumentation
The UV-Vis spectra for DNA–EDTA interactions were obtained using a Cary (UV 100 Bio) spectrophotometer. Solutions of DNA and EDTA were scanned in a 0.5 cm (1 mL) quartz cuvette. The spectra were generated by progressive addition of EDTA to the DNA solution.
For viscosity measurements, a viscosimeter (SCHOT AVS 450) was used, which was kept at 25°C by a constant temperature bath. Flow time was measured with a digital stopwatch; the mean values of three replicated measurements were used to evaluate the viscosity (η) of the samples. The data were reported as η/η 0 versus the [EDTA]/[DNA] ratio, where η 0 is the viscosity of the DNA solution alone (Kashanian and Ezzati Nazhad Dolatabadi, 2009).
Circular dichroism measurements were recorded on a JASCO (J-810). Solutions of DNA and EDTA were scanned in a 0.5-cm (1 mL) quartz cuvette. The spectra were recorded following progressive addition of EDTA to pure DNA solution.
Gel electrophoresis studies
For cleavage studies, plasmid DNA was isolated as follows: a culture of Escherichia coli containing plasmid was incubated at 37° C for 12 h in nutrient broth containing penicillin. The bacteria were harvested after 12 h by centrifugation at 4000 rpm for 5 min. The pellet was resuspended in 1 mL of SET (Sucrose, EDTA, and Tris-HCl) buffer by vortexing. NaOH and SDS buffer were added to a final concentration of 10% (v/v), mixed well (without vortexing), and incubated on ice for 5 min. Then, 1.5 mL of potassium acetate solution (5 M) was added and mixed immediately. After a 5 min incubation on ice, 4.5 mL chloroform:isoamylalchol (24:1) was added to the extraction mixture, and the resulting solution was centrifuged for 10 min at 8000 rpm at 4°C. The supernatant was collected; 10 mL EtOH 100% was added, centrifuged for 5 min at 10,000 rpm. The pellet was washed with 5 mL 70% EtOH, centrifuged 5 min at 5000 rpm, and dried. The pellet was dissolved in TE (Tris-HCl, EDTA) buffer (nearly 200 μL); and 50 μL RNase A (1 mg/mL in TE) was added, then incubated at 37°C for 1–2 h. The homogeneity of plasmid DNA was confirmed by gel electrophoresis (Kashanian et al., 2010b). DNA was stored at −20°C until use. The cleavage of plasmid DNA was monitored using agarose gel electrophoresis. Supercoiled (SC) pUC18 DNA in TE buffer (pH 7.4) was treated with different concentrations of EDTA. The samples were incubated for 5 h at 37°C. In the inhibition reactions, DMSO and selenium (Se) were added to the SC DNA, and the incubation was carried out for 5 h, at 37°C before the addition of EDTA; then, the electrophoresis of the DNA cleavage products was performed on 1% agarose gels. The gels were run at 50 V for 1 h in Tric base-Boric acid-EDTA (TBE) buffer, stained with ethidium bromide, and photographed using UV illumination.
Results
Effect of the EDTA on UV spectra of DNA
Electronic absorption spectra were initially employed to study the binding mode of complexes to DNA. Hyperchromic and hypochromic effects are the spectra features of DNA related to its double helical structure. The binding of intercalative drugs to the DNA helix has been characterized classically through absorption spectral titrations, by following the changes in absorbance; hypochromism and red shift in wavelength are characteristic effects of intercalation (Kashanian and Ezzati Nazhad Dolatabadi, 2009). The UV band of DNA at about 260 nm was monitored in the absence and presence of different amounts of EDTA. Small hyperchromic effects were observed for EDTA (Fig. 2).
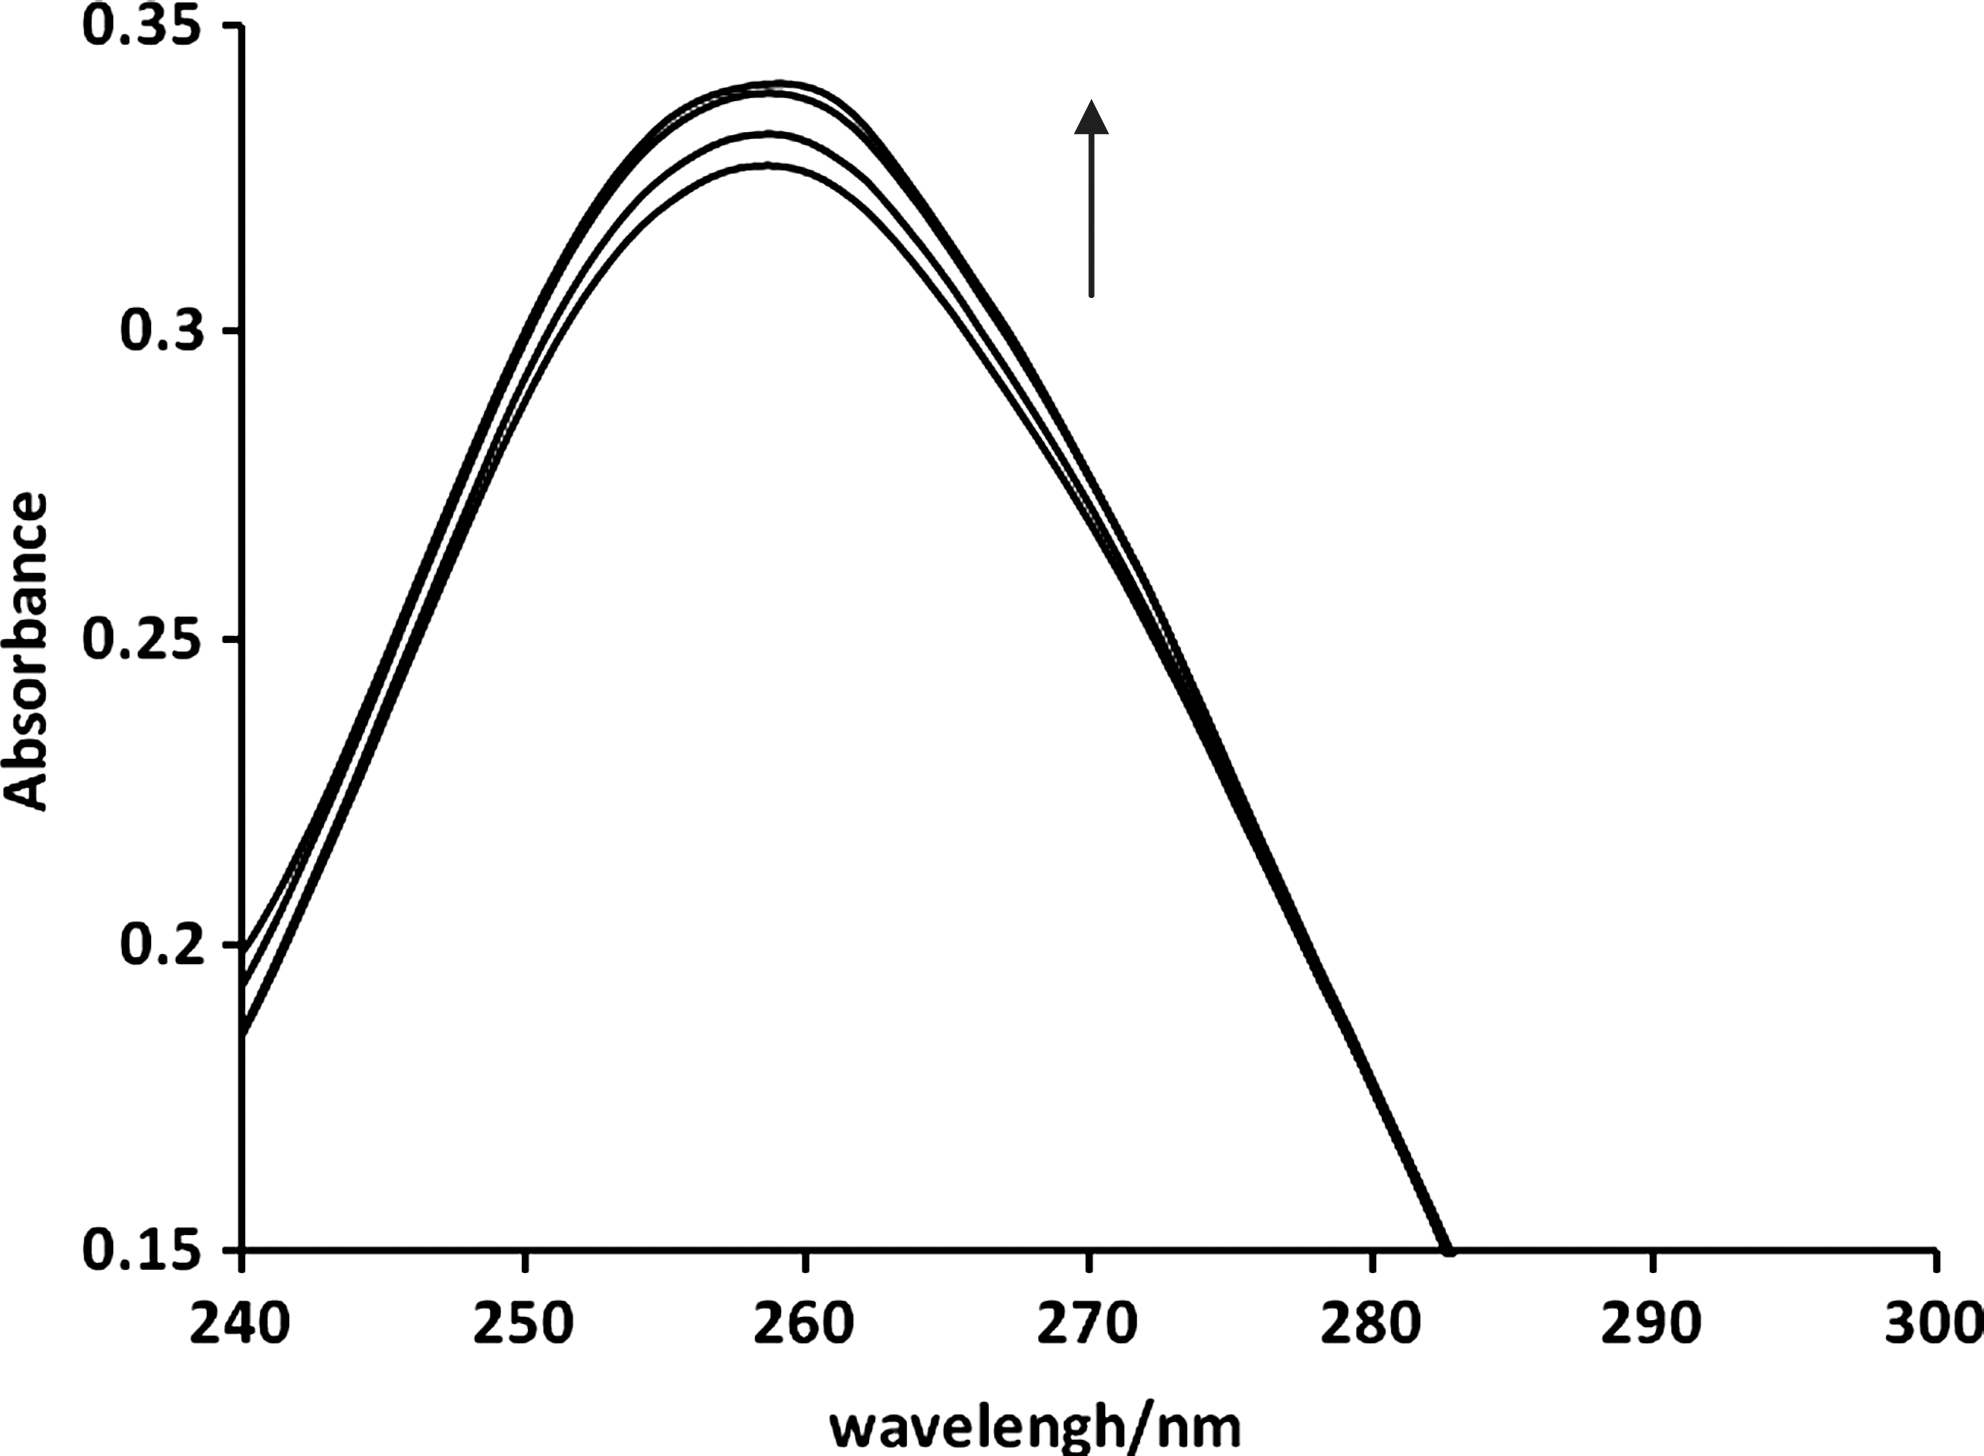
Ultraviolet/VIS (visible) spectra of DNA (5.0 × 10⁻⁵M) with EDTA in 0.01 M Tris–HCl buffer (pH 7.8) with ri = [EDTA]/[DNA] = 0.0, 0.5, 1, 1.5.
CD spectral studies
CD spectroscopic technique is applied to monitor the conformational variations of DNA in solution (Patra et al., 2007) and is a useful technique to analyze interactions between small molecules and DNA. Free helix DNA shows the well-known features of a so-called right-handed B form CD spectrum: a positive band at 277 nm due to base stacking and a negative band at 245 nm due to helicity. Simple groove binding and electrostatic interaction of small molecules with DNA show little or no perturbation of the two bands (Kong et al., 2008). Incubation of DNA with EDTA leads to a decrease in the intensity of negative bands (shifting to zero levels), whereas the positive bands increased without any changes in their wavelengths (Fig. 3).
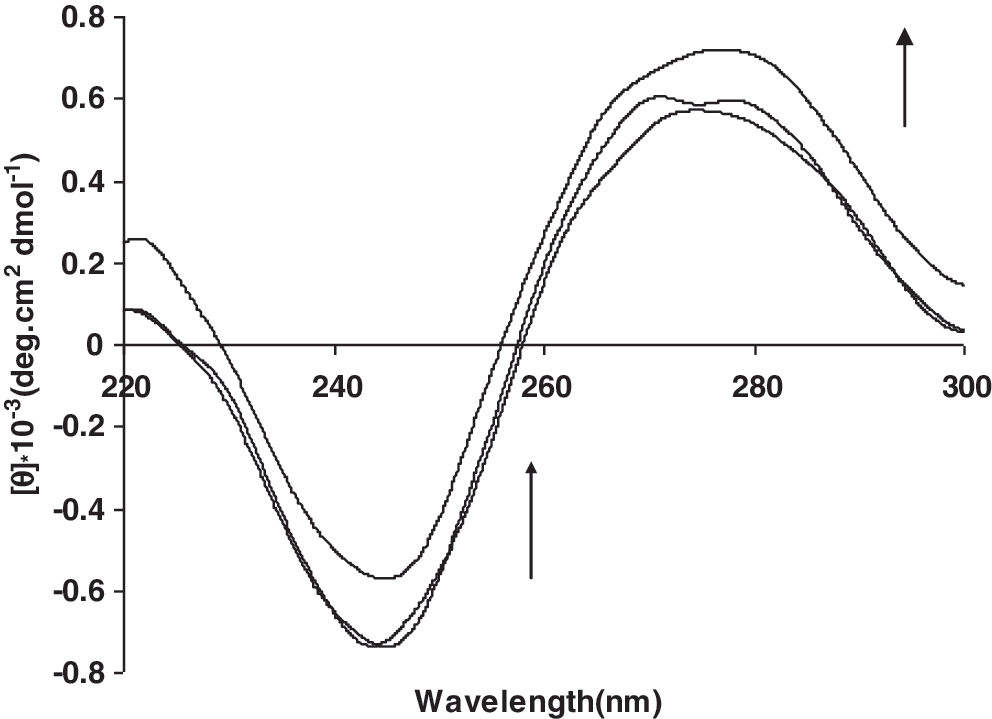
Circular dichroism spectra of DNA (8.0 × 10⁻⁵ M) in 0.01M Tris HCl buffer, in the presence of increasing amounts of EDTA (ri = [EDTA]/[DNA] = (0.0, 0.2, 0.4).
Viscosity studies
Figure 4 shows the relative viscosity of DNA in the presence of varying amounts of EDTA. EDTA induces relatively very slow changes in the DNA viscosity.
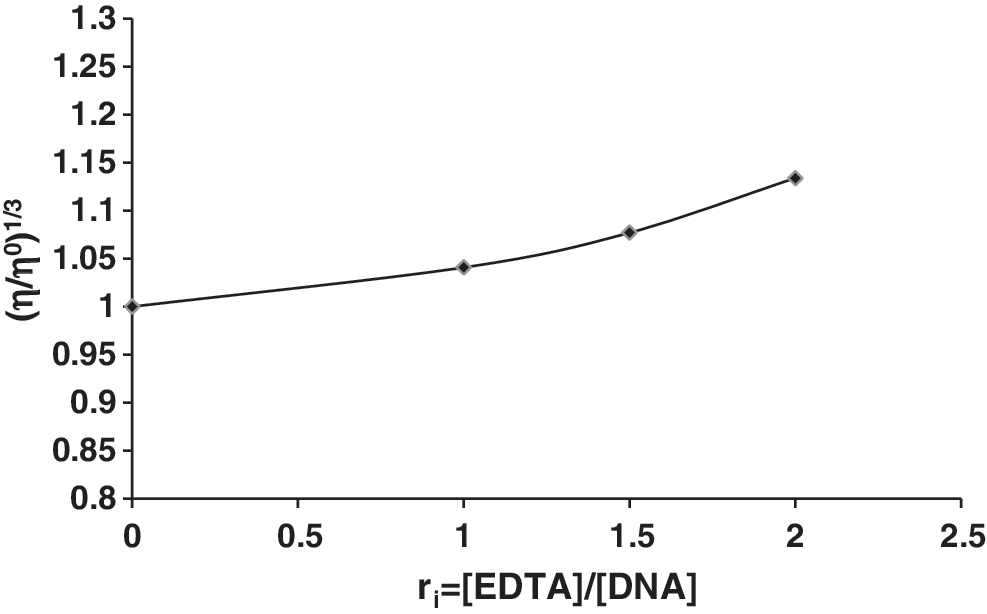
Effect of increasing amounts of EDTA on the viscosity of CT-DNA (5 × 10⁻⁵M) in 0.01 M Tris–HCl buffer (pH 7.8), (ri = 0.0, 1, 1.5, and 2).
DNA cleavage studies
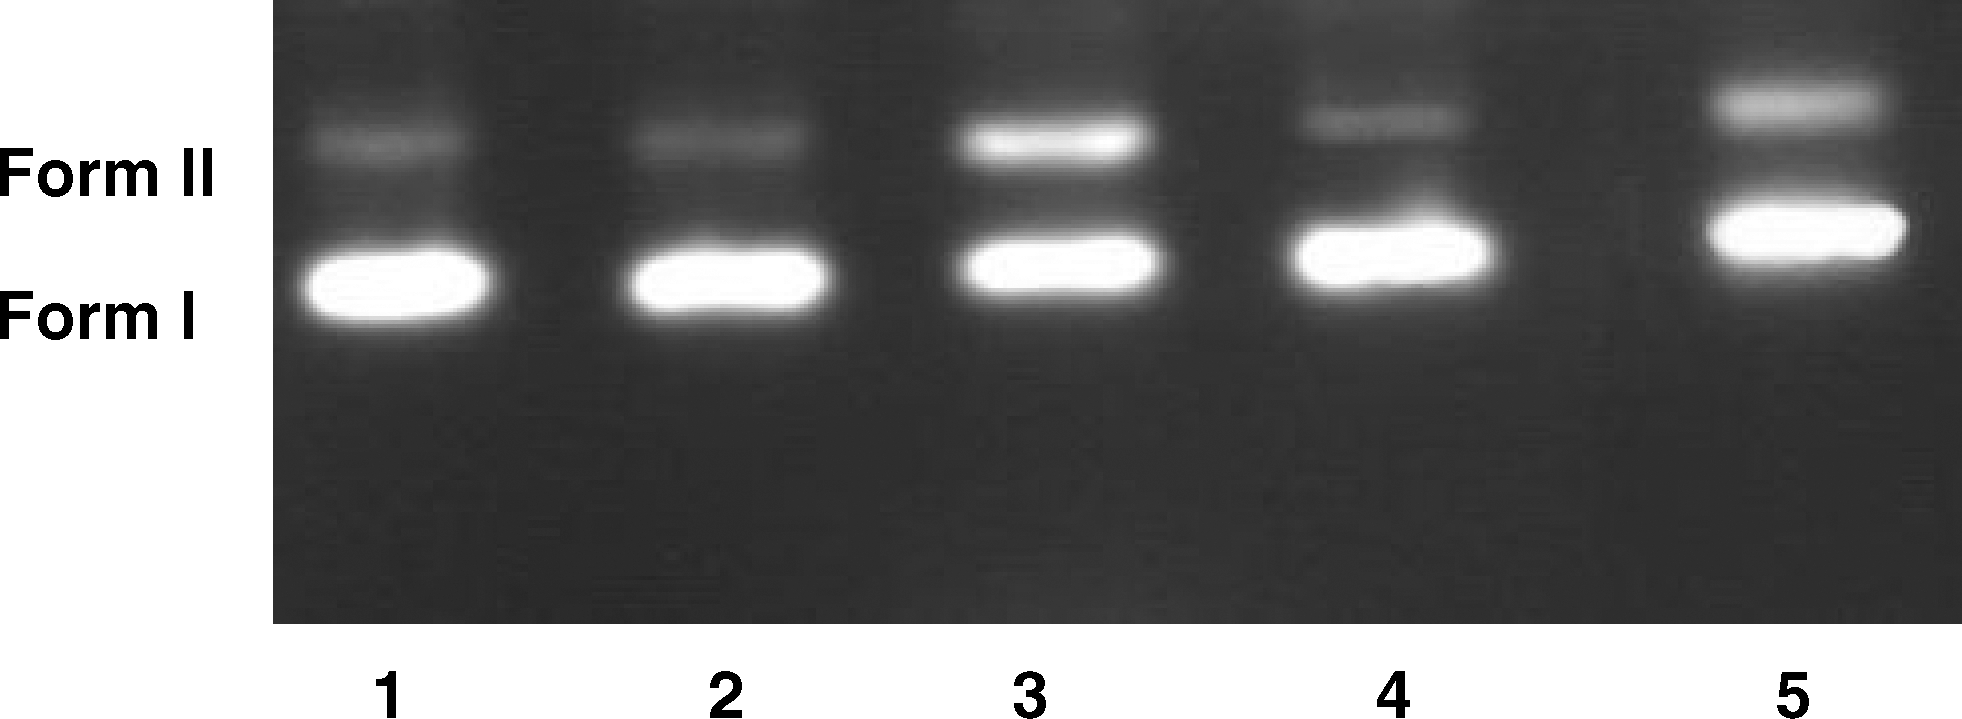
DNA cleavage activity of EDTA was studied by agarose gel electrophoresis using SC plasmid pUC18 DNA in TE buffer. When circular plasmid DNA is subjected to electrophoresis, relatively fast migration is observed for the intact SC form (Form I); if scission occurs on one strand (nicking), the supercoil will relax to generate a slower moving open circular form (Form II); if both strands are cleaved, a linear form (Form III) that migrates between Forms I and II will be generated (Leelavathy et al., 2009). Figure 5 shows the results of gel electrophoretic separations of plasmid pUC18 DNA treated with increasing amounts of EDTA. Lane 1 in the figure shows the control DNA without any additives. Lanes 2 and 3 indicate incubation of DNA with increasing amounts of EDTA. As shown, EDTA is able to cleave plasmid DNA. As seen in Figure 6, addition of DMSO inhibits the DNA cleavage activity of EDTA (Rao et al., 2008).

Cleavage of DNA (5 × 10⁻³ M) in the presence of increasing amounts of EDTA (ri = [EDTA]/[DNA] = (0, 0.1, 0.25), lane 1 is DNA alone, lane 2 DNA in the presence of EDTA (0.5 × 10⁻³ M), lane 3 DNA in the presence of EDTA (1.25 × 10⁻³ M).
Inhibition of DNA cleavage in the presence of DMSO (0.1 M), lanes 1 and 2 are DNA (5 × 10⁻³ M) alone, lane 3 DNA in the presence of EDTA (1.25 × 10⁻³ M), lane 4 DNA in the presence of DMSO, lane 5 DNA in the presence of DMSO and EDTA. DMSO, dimethylsulfoxide.
Protective action of Se against DNA damage
Se is an important micronutrient for both humans and animals and is obtained through the diet from several sources including cereals, grains, nuts, vegetables, meat, and seafood (Ramoutar and Brumaghim, 2010). Se additives to animal feed, 16.8 tons annually for sheep and cows alone, improve animal performance and increase Se dietary intake for people consuming meat products (Ramoutar and Brumaghim, 2007). In this work, we investigated the ability of inorganic Se to modulate the DNA damage of EDTA (Fig. 7). The electrophoresis study of EDTA-DNA interaction was carried out by incubation of DNA with Se in the presence of EDTA followed by the detection directly in solution. In these experiments, 5 × 10⁻³ M of DNA was incubated with Se (0.1 M) before addition of EDTA (1.25 × 10⁻³ M). The results revealed that addition of Se to DNA solution inhibits EDTA cleavage of plasmid DNA.

Inhibition of DNA cleavage in the presence of Se. Lanes 1 and 2 are DNA (5 × 10⁻³M) alone, lane 3 DNA in the presence of Se (0.1 M), lane 4 DNA in the presence of Se (0.1 M) and EDTA (1.25 × 10⁻³ M). Se, selenium.
Discussion
Numerous food additives, such as antioxidants, colors, preservatives, and sweeteners, are consumed in a typical diet. In the present study, EDTA, which is widely used as an antioxidant in the food industry, showed adverse effects on DNA structure. According to the results from UV spectroscopy, viscosity, and circular dichroism, EDTA binds to CT-DNA via an outside, nonintercalative binding mode. Moreover, gel electrophoresis results indicate that EDTA is able to cleave plasmid DNA. This effect can be inhibited by DMSO and/or Se. In UV absorption, hyperchromic and hypochromic effects are the spectra features of DNA related to its double helical structure. Hypochromism results from the contraction of DNA in the helix axis and from the conformational changes of DNA; in contrast, hyperchromism derives from damage of the DNA double-helix structure (Kashanian and Ezzati Nazhad Dolatabadi, 2009). As shown in Figure 2, the absorption spectra of DNA increase with increasing the EDTA concentration. This is a typical small hyperchromic effect, which suggests that DNA double-helix structure has been slightly damaged after EDTA binding to it, suggesting EDTA is an efficient DNA binder. The DNA double helix possesses many hydrogen bonding sites positioned on the edges of the DNA bases, it is quite probable that the hanging −OH groups of EDTA could form hydrogen bonds with the DNA base pairs, contributing to the overall hyperchromism (Kumar and Arunachalam, 2006; Arjmand et al., 2008; Kumar et al., 2009). The small increase at 260 nm maximum in dsDNA without the hypsochromic effect can be attributed to changes in the dsDNA due to the intercalating reactions and the opening of the dsDNA helix (Plaper et al., 2003), but EDTA does not contain any aromatic rings to facilitate intercalating; thus, the classical intercalative interaction is precluded (Chowdhury et al., 2005). Groove binding compounds are thought to contain donor or acceptor hydrogen groups that could selectively react with DNA bases via hydrogen bonding (Berman et al., 1979). EDTA might form hydrogen bonds to oxygen and/or nitrogen atoms that are exposed in the grooves of DNA.
The viscosity measurement of DNA is regarded as the least ambiguous and the most critical test of a DNA binding model in solution in the absence of crystallographic structural data (Tan and Chao, 2007). A classical intercalation model demands that the DNA helix should lengthen, as base pairs are separated to accommodate the binding ligand, leading to an increase in the DNA viscosity. In contrast, a partial and/or nonclassical intercalation ligand could bend (or kink) the DNA helix, reduce its effective length and concomitantly its viscosity, whereas outside binders or ligands that bind exclusively in the DNA grooves (e.g., netropsin, distamycin), under the same conditions, typically cause less pronounced changes (positive or negative) or no changes in DNA solution viscosity (Wang et al., 2004; Xi et al., 2008; Kashanian et al., 2008b). Small changes in relative viscosity of DNA in the presence of varying amounts of the EDTA indicate that it can bind to DNA via groove and/or surface binding mode (outside binding nature) (Jiang, 2004; Sasmal et al., 2008; Kashanian et al., 2010a).
In circular dichroism, simple groove binding and electrostatic interaction of small molecules show less or no perturbation on the base stacking and helicity bands, whereas intercalation enhances the intensities of both the bands stabilizing the right-handed B conformation of CT DNA as observed for the classical intercalator methylene blue (Kong et al., 2008). Incubation of DNA with EDTA leads to a decrease in the intensity of negative bands (shifting to zero), whereas the positive bands increased without any changes in their wavelength (Fig. 3). Similar changes in CD spectra have been reported with various interpretations. Some investigators believe that these types of changes in the CD spectra may be reflective of a shift from a B-like DNA structure toward one with a more A-like conformation (Li et al., 2006). Patra et al. (2007) stated that this phenomenon could be due to stabilizing the right-handed B form of DNA. According to Kasparkova et al. (2004), an enhancement of the CD band of DNA at 275 nm is due to distortions induced in the DNA structure. We think that these changes in CD spectra are due to distortions induced in the DNA structure and shifting the B-DNA to a more A-like form.
DNA cleavage activity of EDTA was studied by agarose gel electrophoresis; the addition of hydroxyl radical scavengers, such as DMSO, showed significant inhibition of the DNA cleavage activity of EDTA, indicating the possibility of the involvement of the hydroxyl radicals as the reactive species (Rao et al., 2008). This can be inferred by monitoring the quenching of DNA cleavage in the presence of DMSO, suggesting the possibility of the formation of OH radicals (
Se is an essential dietary trace element that is incorporated as selenocysteine into the antioxidant enzyme glutathione peroxidase. Se may also be incorporated in the form of selenomethionine into tissue proteins such as hemoglobin, plasma proteins, or keratin. Previous studies showed that Se containing compounds could protect DNA from single-strand break or damage by organo phosphorus (OP) pesticides (Roussyn et al., 1996; Hartwig et al., 2002; Keck and Finley, 2006; Kashanian et al., 2008a). Also, Se shows genotoxic effects as well as antimutagenic and/or anticarcinogenic properties, depending on its concentration and oxidation state. SeO2 acts as a pro-oxidant and an antioxidant depending on concentration (Ramoutar and Brumaghim, 2007, 2010). The pro-oxidant effect of SeO2 at lower concentrations (1–5 μM) may be due to its ability to generate radical species. Se at higher concentrations (500–5000 μM) has been widely studied for its antioxidant and anticancer effects. With selenium dioxide, inhibition of oxidative DNA damage by hydroxyl radical is dependent on the concentration of Se (Ramoutar and Brumaghim, 2007). SeO2, with an Se oxidation state of +4, inhibits DNA damage at high concentrations, due to its ability to react with and neutralize generated
Addition of Se, with the appropriate oxidation state, to DNA solution inhibits the effect of plasmid DNA cleavage of EDTA. Se reacts with the
Conclusion
According to the results from UV spectroscopy, CD, viscosity, and gel electrophoresis, we conclude that EDTA binds to DNA in an outside, nonintercalative, binding mode. EDTA also shows nuclease activity effect on DNA via hydroxyl radical formation mechanism, which can be quenched in the presence of DMSO. Moreover, Se is able to protect DNA from the cleavage effects of EDTA. Our results also coincide with data reported by other researchers (Ramoutar and Brumaghim, 2010).
It should be noted that the EDTA concentration which was used in this study (1 × 10⁻⁵ M) is much less than what is currently used as a food additive; thus, it is worthwhile to make a thorough analysis on its widespread usage in the food industry.
Footnotes
Acknowledgment
Financial support from Razi University Research Center is gratefully acknowledged.
Disclosure Statement
No competing financial interests exist.