




Abstract
The anticancer drugs Adriamycin (ADR) and Daunomycin (DNM) of the anthracycline family are effective in treating a variety of cancers. Although their interactions with other cellular targets may play a role in the selective cytotoxicity of these drugs, it is generally believed that intercalation with DNA is essential for their activity. However, a relationship has not yet been established between intercalation and cellular processes leading to cytotoxicity. The present study was designed to investigate the relationship, if any, between intercalation and DNA strand breaks. ADR and DNM were observed to be strong intercalators of human genomic DNA by absorption and fluorimetric methods that were further substantiated by rise in thermal melting temperature. DNM is the better intercalator of the two, which is also evident from circular dichroic spectral changes. DNA strand breaks, considered to be an index of genotoxicity, was assayed by single cell gel electrophoresis (SCGE; comet assay). ADR and DNM induced equivalent genotoxicity in normal human lymphocytes at a clinically used dose, which was observed to be independent of intercalation efficiency though positively correlated to yield of reactive oxygen species.
Introduction
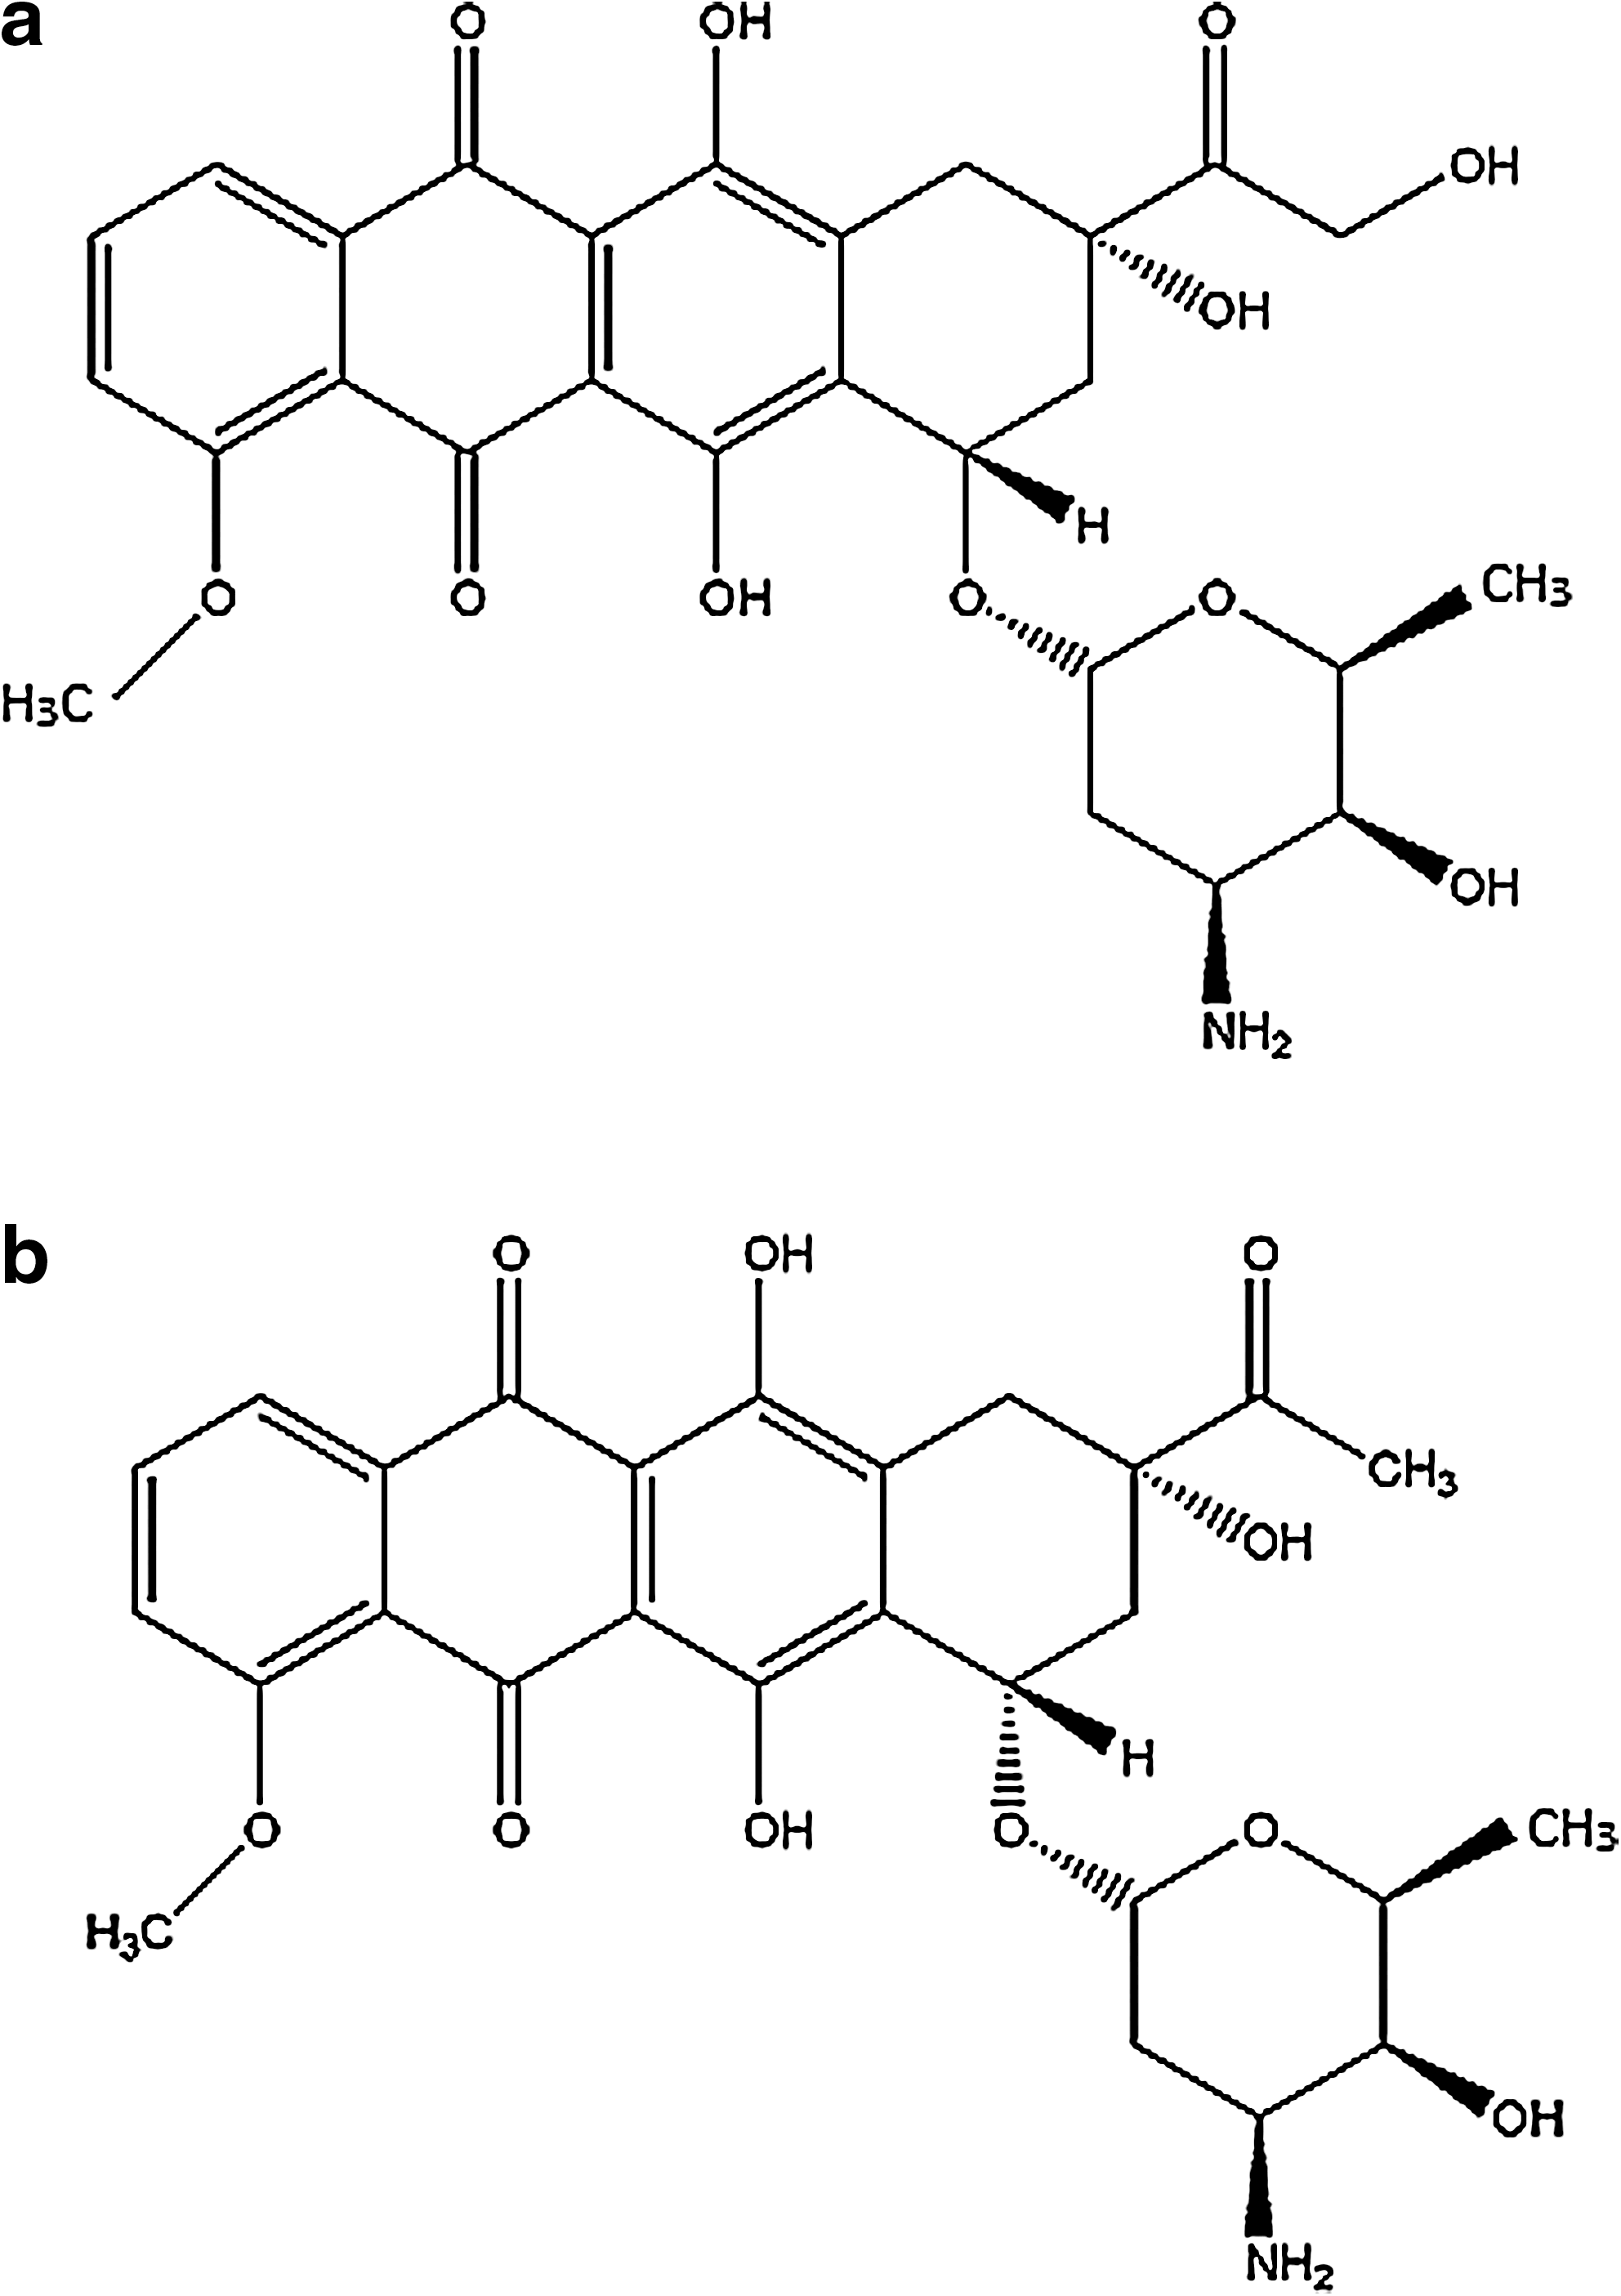
Chemical structure of
Although antitumor anthracycline drugs could function by noncovalent binding to DNA (Waring, 1981), it is now widely accepted that radical-mediated DNA strand breaks are important in accounting for cell death (O'Brien, 1985). The auto-oxidizable semiquinone radicals may be formed by microsomal or nuclear cytochrome P-450 reductase (Berlin and Haseltine, 1981). Some DNA adduct formation with semiquinine radicals have been reported, which was suggested to correlate with the ability of ADR to induce sister chromatid exchange (Sinha and Gregory, 1981). ADR and DNM intercalation with DNA is evident from the increased DNA melting temperatures (Robbie and Wilkins, 1984). Such stabilization of the DNA double helix due to intercalation could inhibit the formation of the single-stranded templates required by the DNA and RNA polymerase leading to inhibition of DNA replication and RNA transcription.
Early investigations of ADR-DNA interaction characterized the ability of the planar anthracycline ring to intercalate with DNA with more recent studies demonstrating a special affinity of the drug for GC-rich regions flanked by AT base pairs (Chaires et al., 1987). Unfortunately, little evidence has been developed to demonstrate that intercalation of DNA by ADR could explain the varied biochemical alterations produced by the drug (Sen and Crothers, 1986).
Treatment with several drugs that bind to DNA without intercalation, or that inhibit DNA synthesis without binding to DNA, did not cause DNA strand breaks (Ross et al., 1979). It is our interest to find if there is any positive correlation between the extent of intercalation of these drugs with genomic DNA isolated from human lymphocytes and the DNA strand breaks in the lymphocytes induced by these drugs. Binding constants for the drug-DNA interactions were determined by following the progressive changes in the absorption and fluorescence spectra of the drugs on titration with DNA as a function of increased DNA concentration. The findings from the spectral studies were further substantiated by changes in optical melting temperatures and circular dichroic spectra. DNA strand breaks are considered as biomarkers for cellular genotoxicity leading to cell death. Yield of DNA strand breaks induced by the drugs at clinically accepted concentration was determined by alkaline comet assay (SCGE) at the cellular level. The reactive oxygen species (ROS) is attributed to formation of strand breaks and it was measured by fluorimetric method using 2′,7′-dichlorofluorescin diacetate (DCFDA).
Materials and Methods
Materials
Genomic DNA was isolated from normal human blood collected from healthy voluntary donors by using QIAmp Blood Midi Kit purchased from Qiagen. Isolated DNA was further purified by phenol chloroform method and lyophilized. Lyophilized DNA was dissolved in phosphate buffer pH 6.5 when required and the purity was ascertained by the ratio of A 260/A 280; samples with a ratio between 1.8 and 2.0 were considered pure. Concentration of DNA was determined by the absorption at 260 nm and the molarity was calculated based on ɛ 260=13,200 M−1 cm−1. ADR and DNM were purchased from Sigma-Aldrich Chemicals Company. The stock solutions of the drugs were prepared in phosphate buffer (pH 6.5) and 5% dimethyl sulfoxide was used when required. Stock solutions were further diluted by the same to the experimentally required concentrations were stored at 4°C. Methyl methanesulphonate (MMS) was obtained from Sigma-Aldrich Chemicals Company and used as positive control for measurement of DNA strand breaks. DCFDA was also obtained from Sigma-Aldrich Chemicals Company and used for ROS estimation. All other reagents used were of analytical reagent grade. All the experimental solutions were prepared in MilliQ water.
Spectrophotometric measurements
All absorption spectra were recorded at room temperature (20°C±2°C) using matched quartz cells of 1 cm path length with a Varian UV-Visible Spectrophotometer (CARY 100 Bio). Absorption spectra were recorded between 350 and 600 nm and absorption maxima of both ADR and DNM were observed at 480 nm. Titrations were performed by keeping the concentration of the drug (4.5 μM of ADR/3.6 μM of DNM) constant and progressively increasing the concentration of genomic DNA from 0.5 to 7.5 μM. In each case samples were allowed to stand for 10 min before each reading was recorded.
Fluorimetric measurements
Steady-state fluorescence measurements were made on a Perkin-Elmer fluorescence spectrophotometer (LS-55) equipped with 150 W Xenon flash lamp using fluorescence-free quartz cells of 1 cm path length at 20°C±2°C. The fluorimetric titrations were similar to spectrophotometric titrations where a constant concentration of the drug (8.7 μM of ADR/81 μM of DNM) was titrated with progressively increasing concentrations of the genomic DNA from 0.37 to 7.5 μM. The drug samples were excited at 480 nm and the emission spectra were recorded from 490 to 650 nm. Samples were incubated for 10 min before the spectra were recorded as followed during spectrophotometric measurements.
UV optical melting study
Melting curves of the genomic DNA were recorded on the Shimadzu PharmaSpec 1700 unit equipped with the peltier-controlled TMSPC-8 model accessory (Shimadzu Corporation). In this experiment, the DNA concentration was kept constant (8.2 μM) and that of the drug was varied and degassed buffer was used for dilution. Micro-optical cuvettes of 1 cm path length were used and the temperature was raised at a heating rate of 0.5°C min−1 from 25°C to 100°C. The absorption change at 260 nm, which is the λ max of DNA, was continuously monitored as described elsewhere (Giri and Kumar, 2008; Islam and Kumar, 2009).
Circular dichroism spectroscopy
Circular dichroism (CD) measurements were carried out on a PC-controlled JASCO J815 spectropolarimeter (Jasco International Co.) at 20°C±2°C. A rectangular strain-free quartz cell of 1 cm path length was used for CD measurements. Each spectrum was averaged from five successive accumulations at a scan rate of 100 nm min−1 keeping a bandwidth of 1.0 nm at a sensitivity of 100 milli degree and base line was corrected and smoothed within permissible limits using the built-in software. Molar ellipticity values [θ] against wavelength of absorption of DNA between 200 and 600 nm were recorded as described in detail elsewhere (Giri and Kumar, 2008; Islam and Kumar, 2009).
Comet assay or SCGE
Lymphocytes were obtained from heparinized blood collected from healthy voluntary donors and were separated using HP 1077 according to the method of Boyum (1974). Lymphocytes were washed and resuspended in RPMI-1640 and tested for viability using trypan blue 0.05% exclusion test. About 5 mL cell suspension of 105 cells/mL was treated with 300 nM ADR and DNM separately for 2 h. The same amount of untreated cell suspension was kept for negative control and for the positive control the same amount of cells was treated with 50 μM MMS for 2 h. The comet assay was performed under alkaline conditions according to the procedure of Singh et al. (1988). A suspension of 104 cells in 0.5% low melting point agarose dissolved in phosphate-buffered saline (PBS) was spread onto microscope slides precoated with 1% normal-melting agarose. The cells were then lysed for 1 h at 4°C in a buffer consisting of 2.5 M NaCl, 100 mM ethylenediaminetetraacetic acid (EDTA), 1% Triton X-100, and 10 mM Tris (pH 10). After lysis, the slides were placed in an electrophoresis unit, and the DNA was allowed to unwind for 40 min in the electrophoresis buffer consisting of 300 mM NaOH and 1 mM EDTA (pH >13). Electrophoresis was conducted at 4°C at the electric field strength of 24 V and 300 mA for 30 min. The slides were then neutralized with 0.4 M Tris (pH 7.5) and stained with 2 μg/mL ethidium bromide and covered with cover slips. To prevent additional DNA damage, all the steps described above were conducted under dimmed light or in the dark. The objects were observed at 40× magnification in an Carl Zeiss fluorescence microscope (Axioskop 40) equipped with UV-1 filter block (an excitation filter of 359 nm and a barrier filter of 461 nm) and images were analyzed by CASP software.
Measurement of ROS
About 5 mL cell suspension with 105 cells/mL (lymphocytes isolated from voluntary donors using the same method described earlier) was initially treated with 300 nM drug ADR/DNM for 2 h and then washed with PBS and incubated in the dark with the dye DCFDA (10 μM) at 37°C for 30 min before the measurement of ROS concentrations (Liu et al., 2010). DCFDA is a nonpolar compound that readily diffuses into cells, where it is hydrolyzed to the nonfluorescent polar derivative, 2′-7′ dichlorofluorescein (DCFH) and thereby trapped within the cells (Brown and Wouters, 1999). In the presence of ROS, DCFH is oxidized to the highly fluorescent 2′,7′-dichlorofluorescein (DCF). The level of DCF fluorescence, reflecting the concentration of ROS, was monitored using a fluorescence spectrophotometer (Perkin-Elmer LS-55) at 534 nm emission with an excitation wavelength of 488 nm. For positive control, the same number of cells was treated with 25 μM H2O2 for 2 h and untreated cells were used as a negative control.
Results
ADR and DNM are well-known intercalating drugs. In an effort to further understand and compare their binding characteristics with genomic DNA, which is the main target of the drug, this study investigates and analyses the mode of binding of these drugs with genomic DNA.
Spectrophotometric studies
The binding of the drugs to the genomic DNA was studied by spectrophotometric titration, where the absorption spectra of 4.5 μM ADR or 3.6 μM DNM in phosphate buffer (pH 6.5) were recorded and the change in such spectra on titration with (0.5 μM to 7.5 μM) DNA was followed as shown in Figure 2. Absorbance spectra of both the drugs, ADR and DNM, in the presence of increasing concentration of genomic DNA showed pronounced hypochromic effects suggesting intercalation (Fig. 2). This hypochromic effect is thought to be due to the overlap of the π electron cloud of the anthraquinone chromophore of the drugs with genomic DNA; a typical characteristic of intercalation. Isobestic point was not observed for the ADR-genomic DNA spectral changes; however, it was observed in case of DNM. This indicates that equilibrium could not be attained in ADR-genomic DNA titration, but was achieved for DNM.
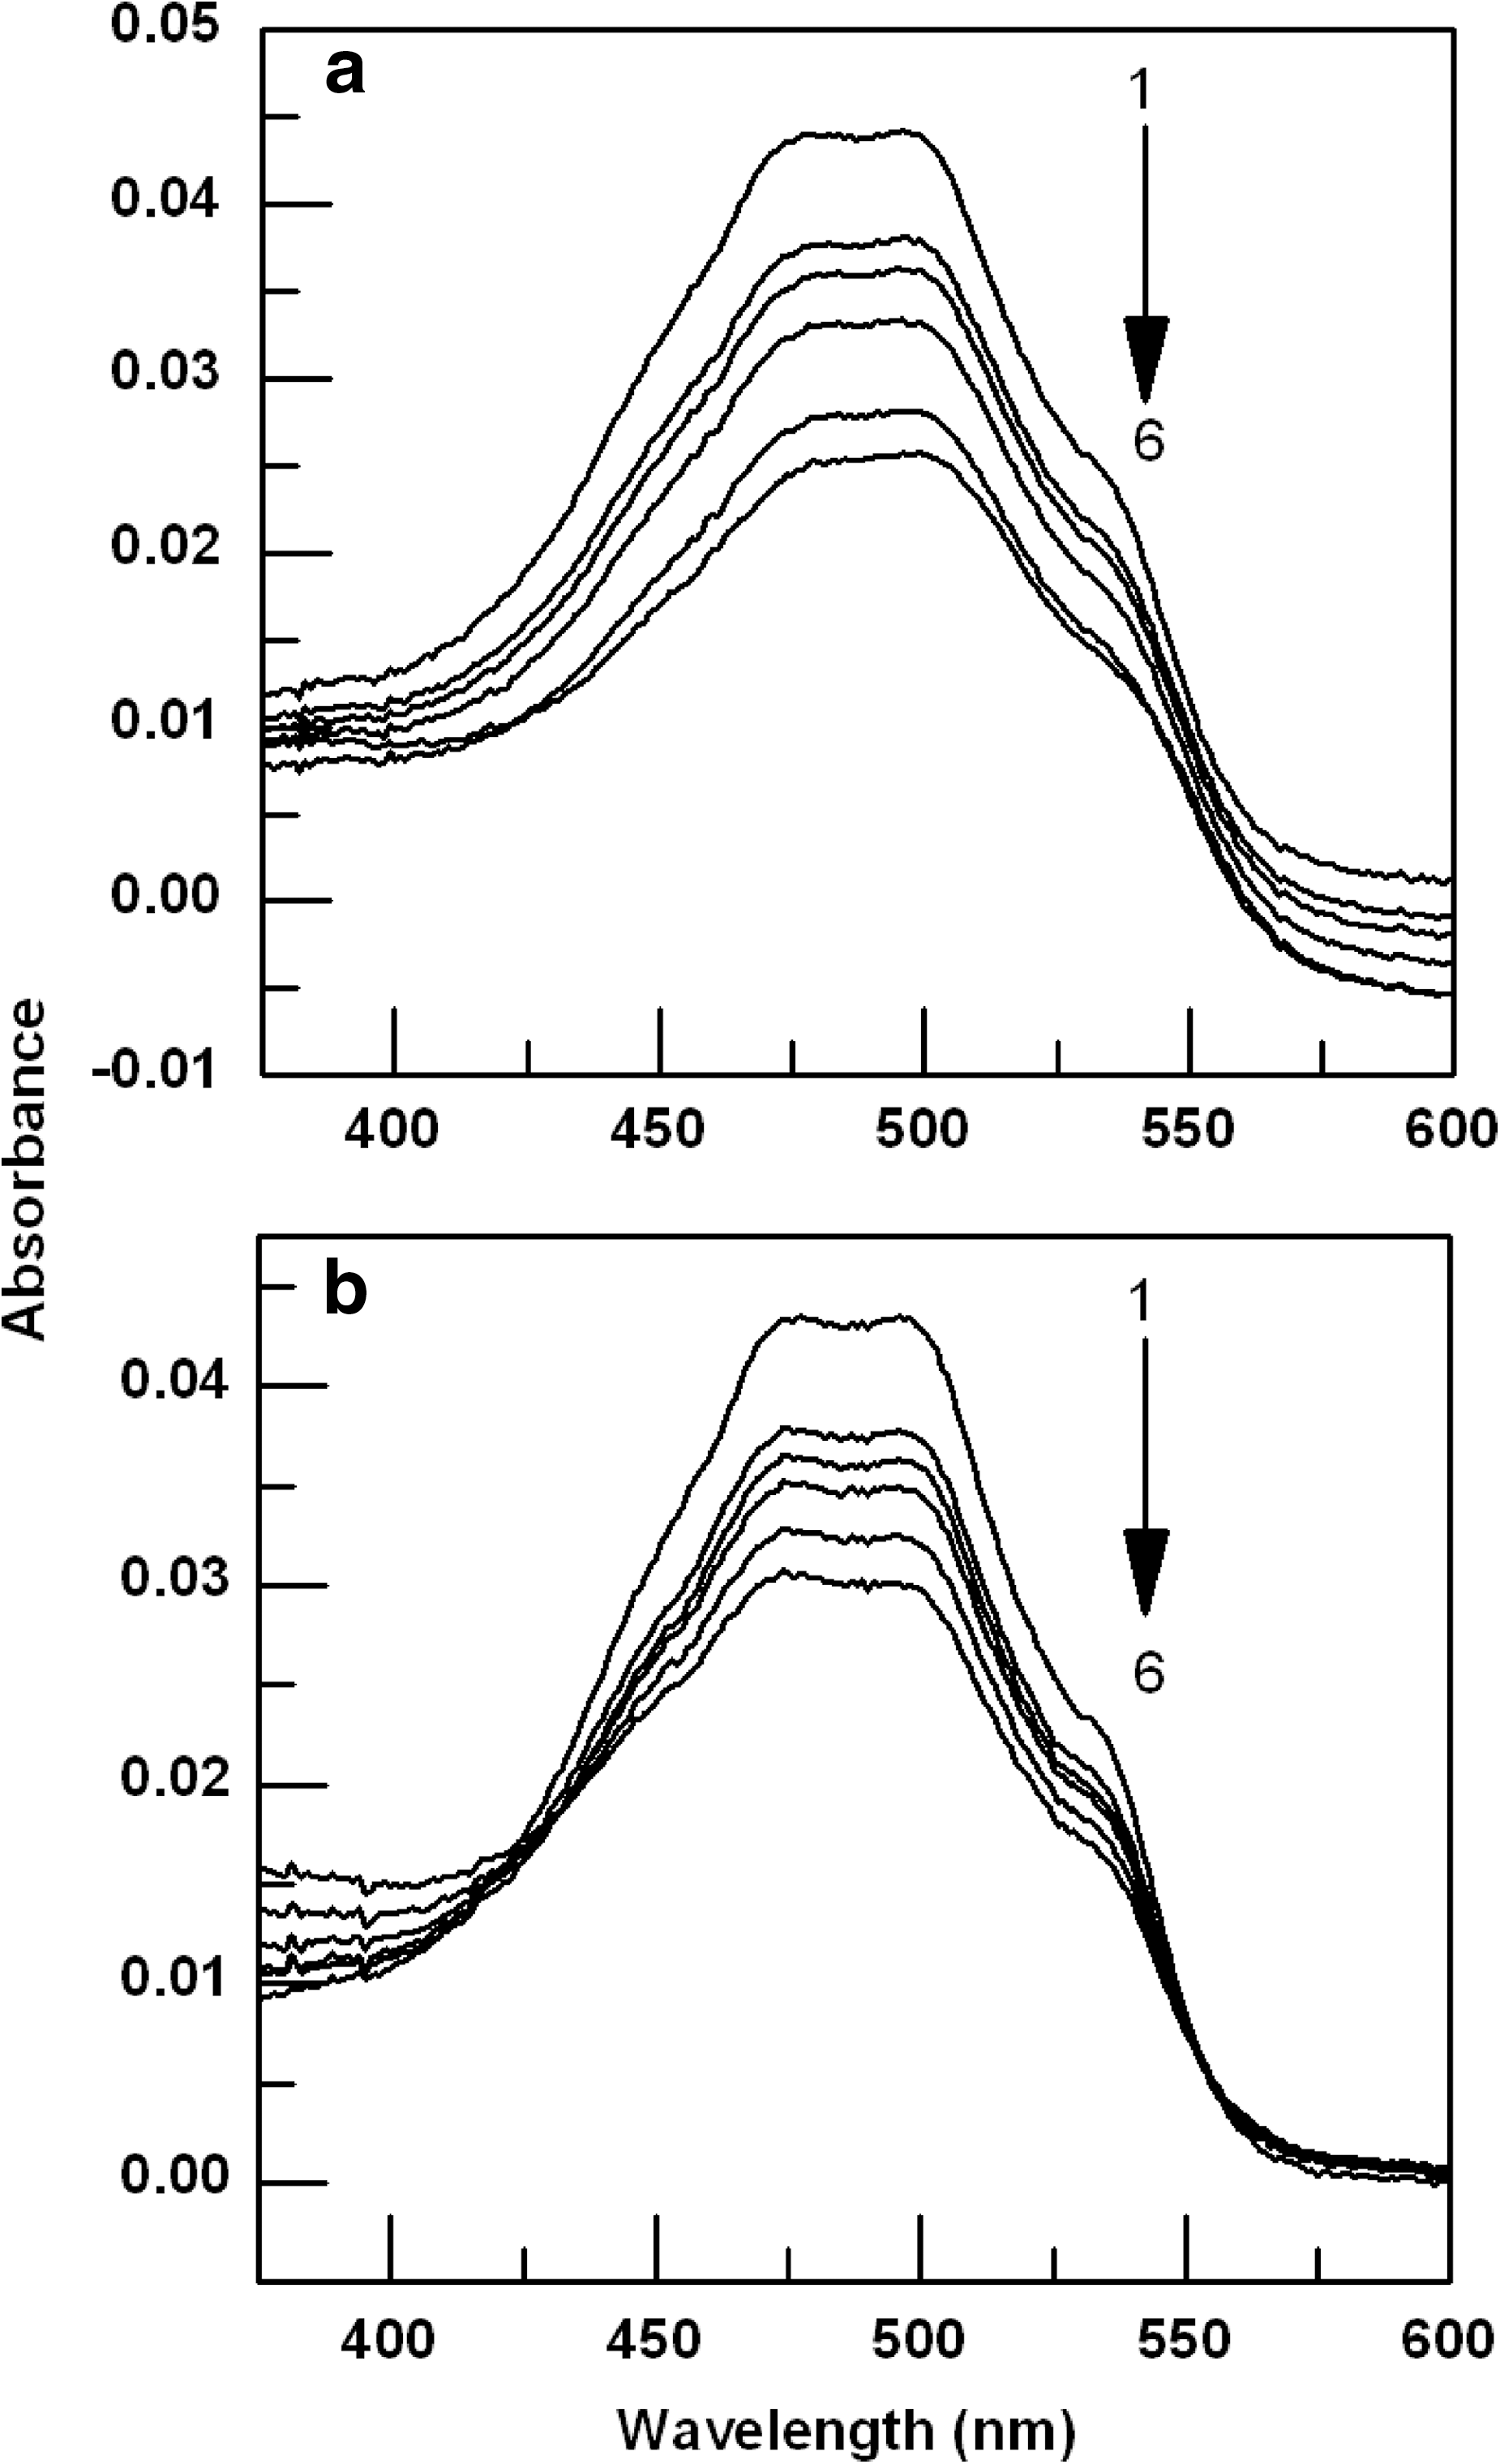
Absorption spectra of
From the variation in the absorbance spectra of the drugs upon binding to DNA, binding constants of both the drugs were calculated. A plot of A 0/(A−A 0) versus 1/[DNA] was constructed using the data from the absorbance titration as shown in Figure 3. The binding constant in each case was calculated from the ratio of the intercept to the slope of the linear fitting of the curve as described by Lu et al. (2010). The calculated binding constants of ADR and DNM are 3.64×10⁵ and 2.27×10⁶ M−1, respectively. These results imply that both the drugs have strong affinity for genomic DNA; DNM, however, shows relatively high affinity to genomic DNA compared to ADR.
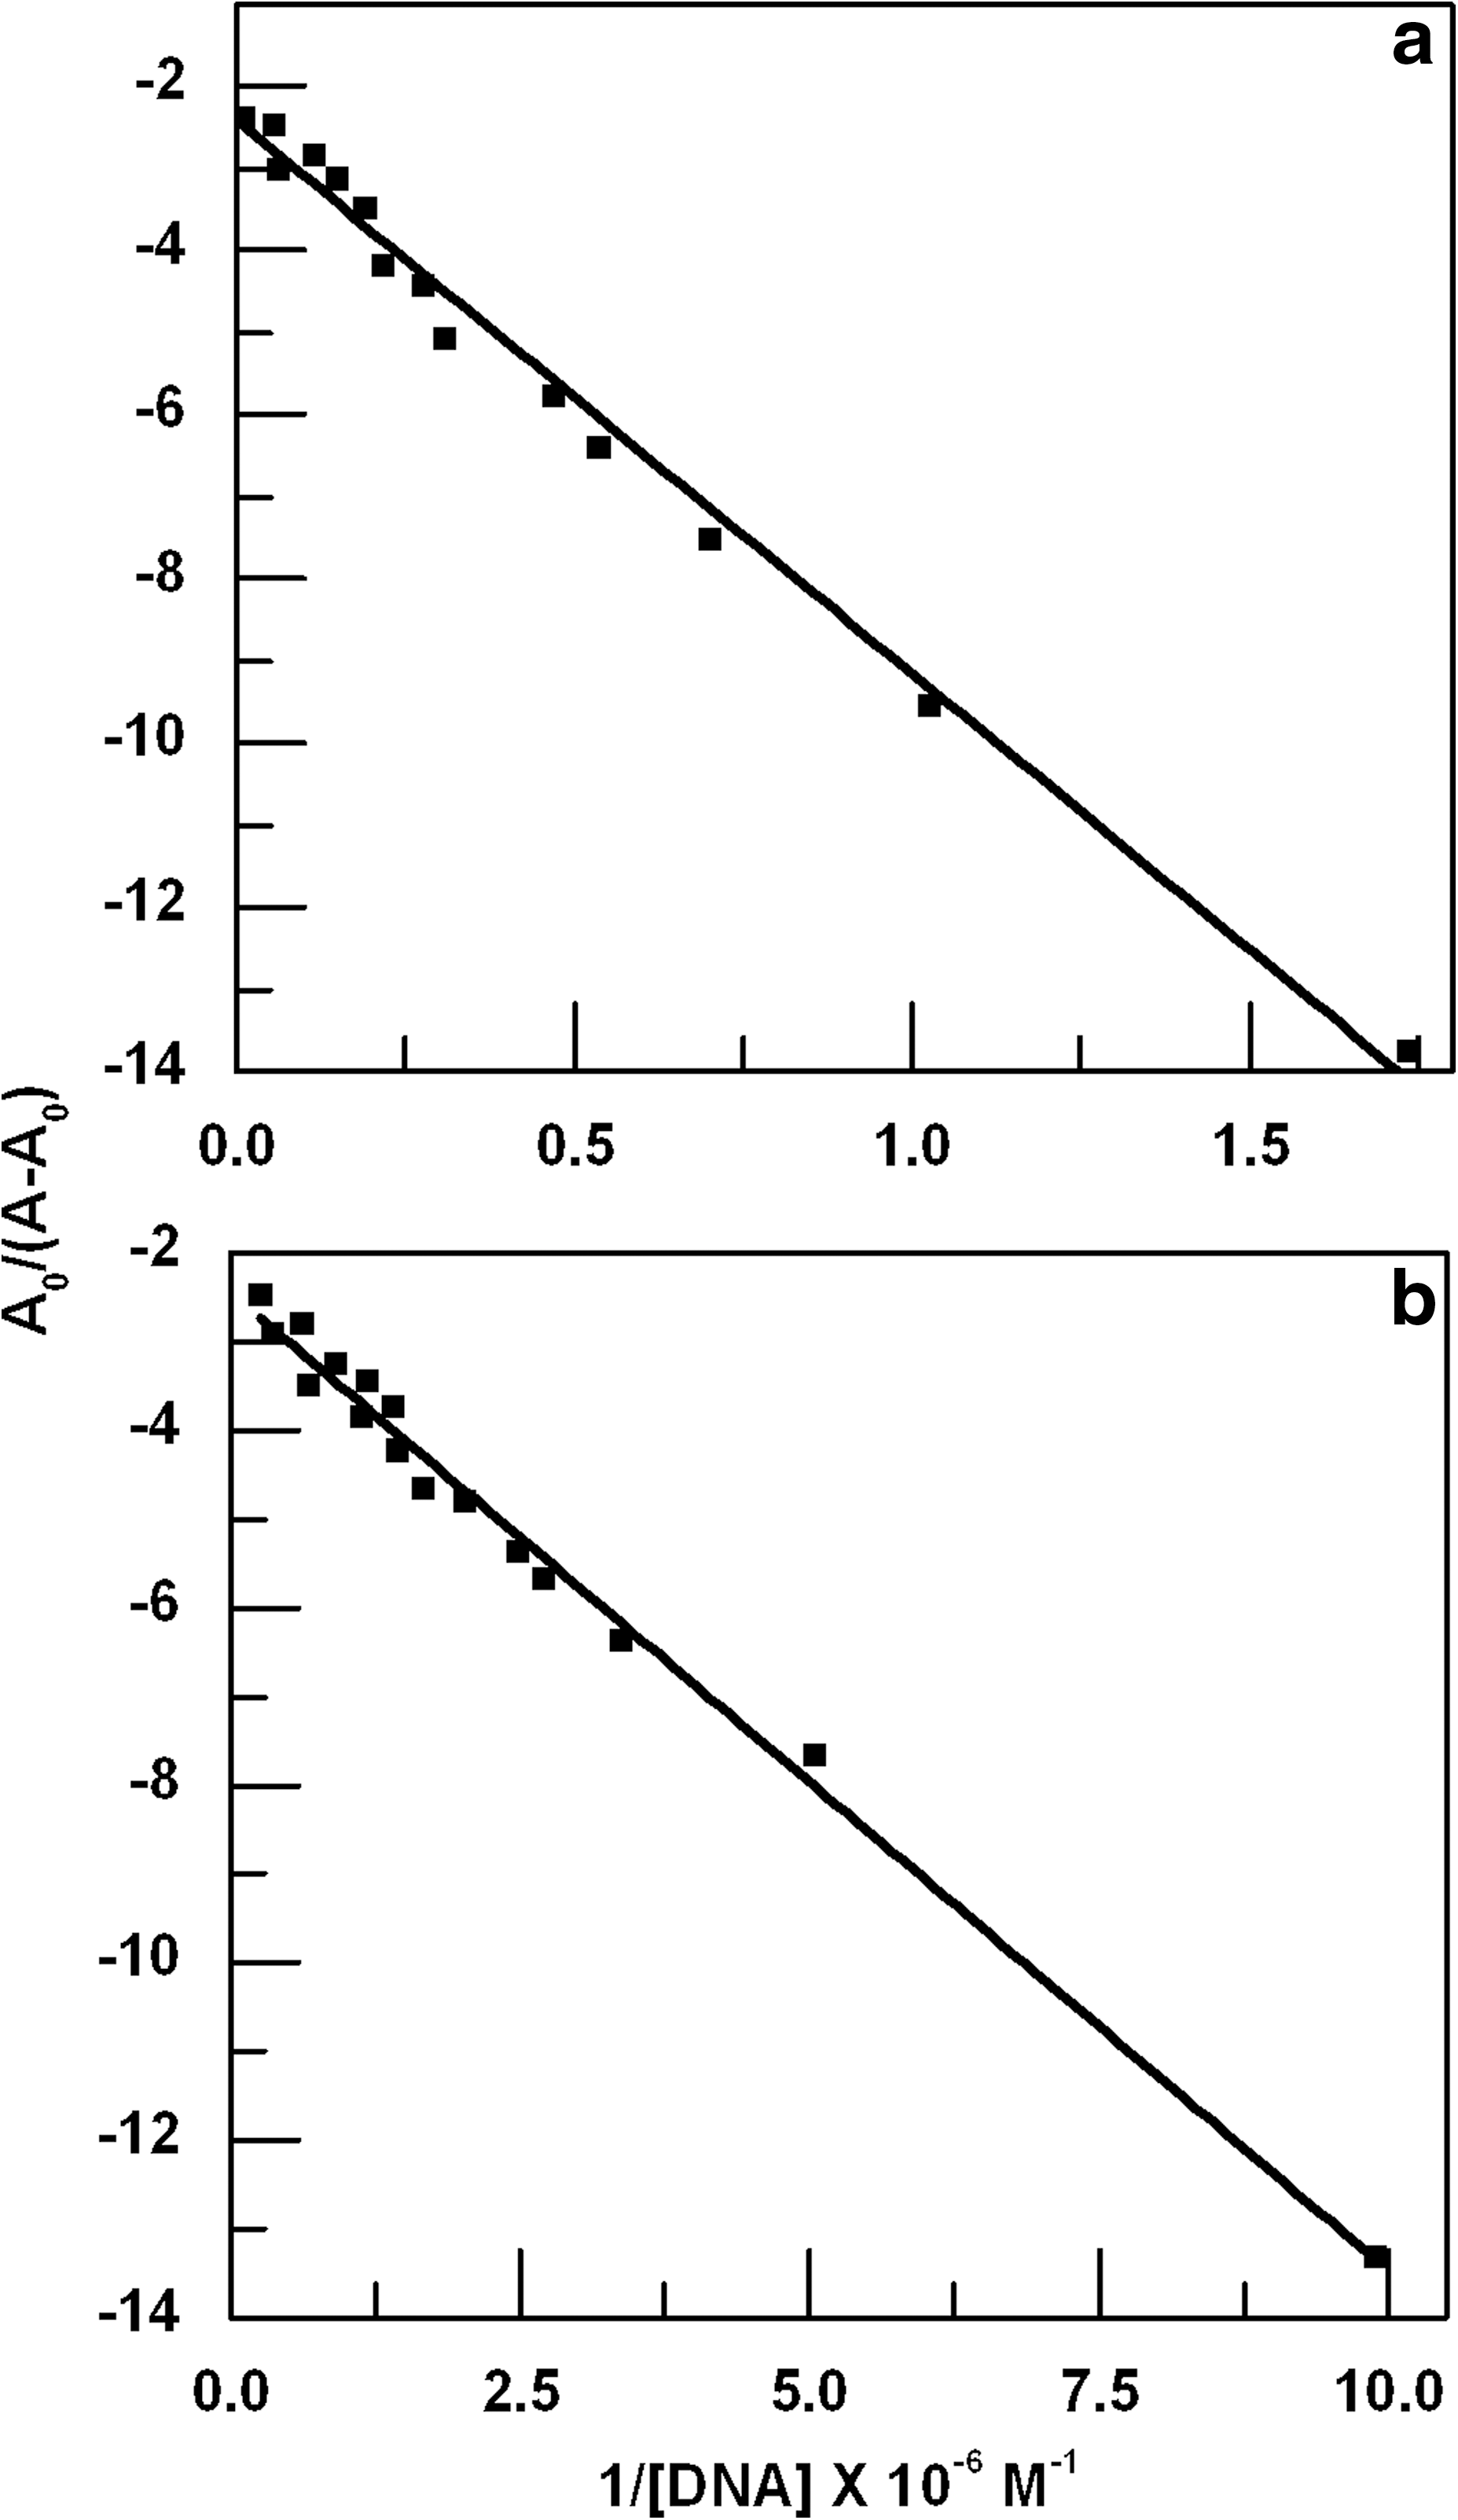
Change in A
0/(A−A
0) of
Spectrofluorimetric studies
The binding of the drugs to genomic DNA was also examined by fluorescence titration measurements. ADR and DNM are fluorescent molecules and show fluorescence emission in the range of 490–650 nm when excited at 480 nm. In our present study 8.7 μM ADR or 81 μM DNM solution was titrated with genomic DNA of concentrations between 0.37 and 7.5 μM. Significant decrease in fluorescence intensity on gradual addition of DNA is indicative of strong association of these drugs to the genomic DNA (Fig. 4).
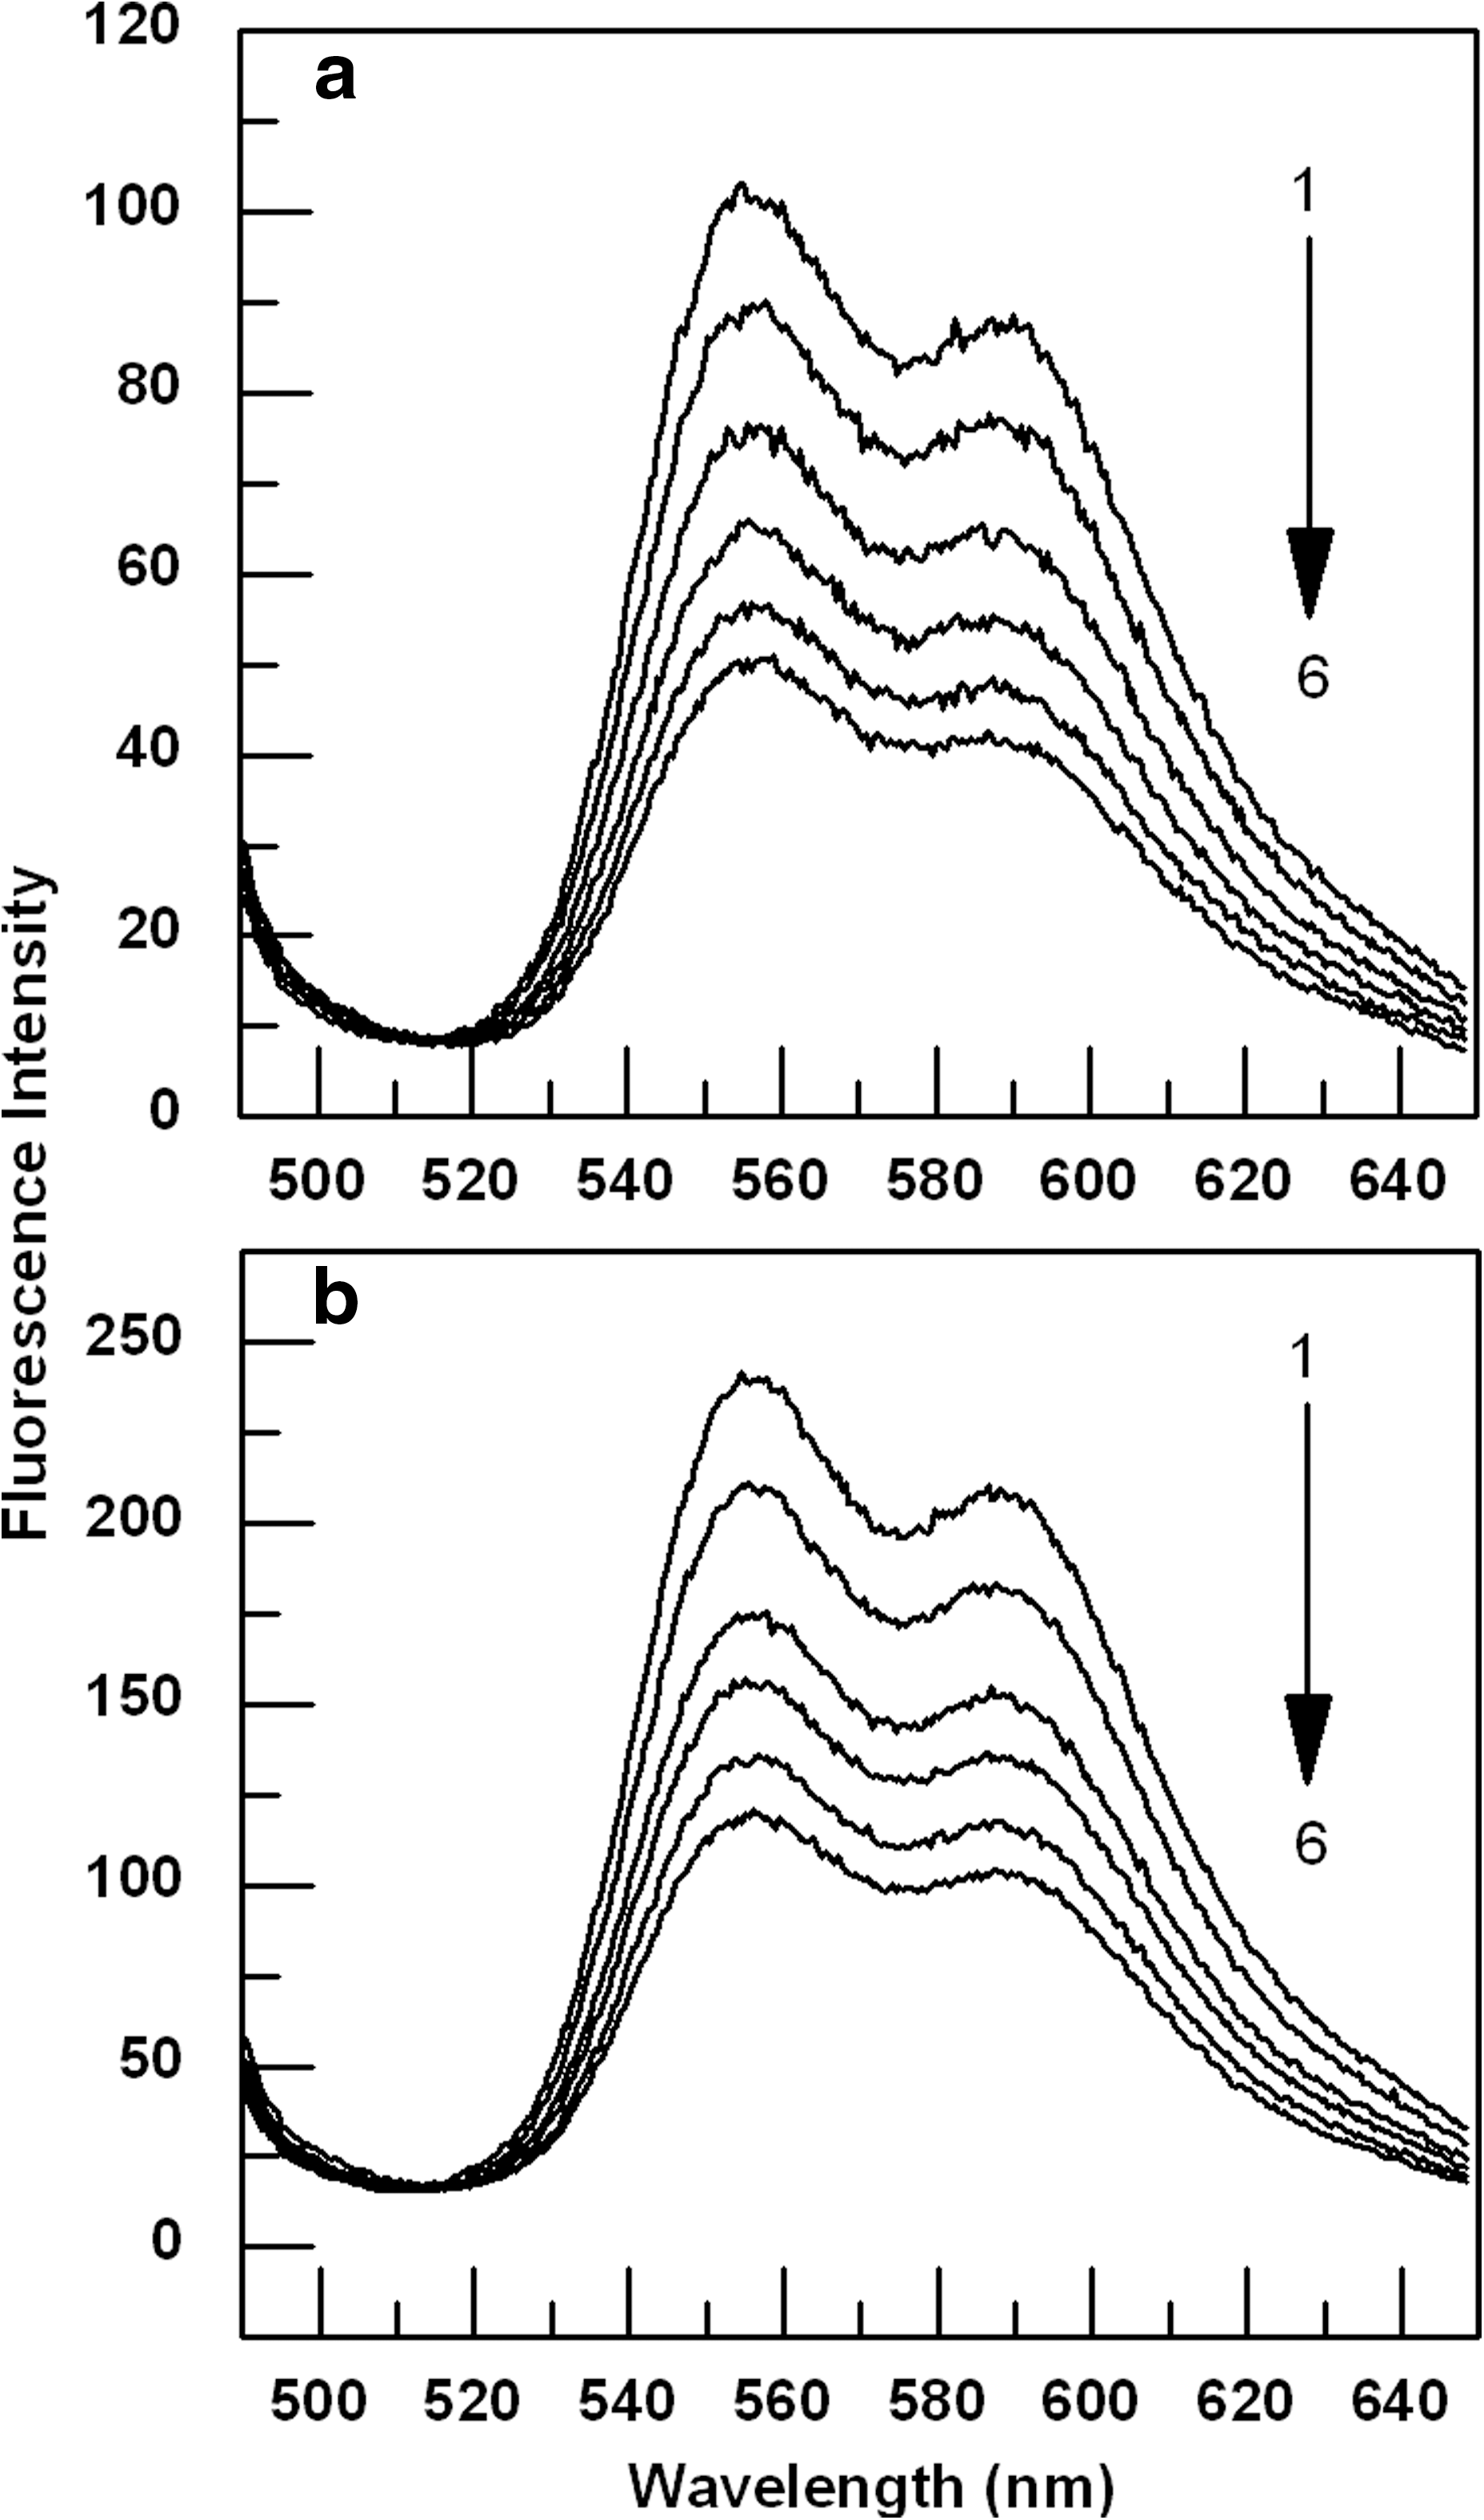
Changes in fluorescence emission spectra of
The binding constant and the number of binding sites of ADR and DNM with genomic DNA were calculated by the following equation using the data from fluorescence titration:
Here K b is the binding constant and n is the number of the binding sites that can be determined from the intercept and slope of the double logarithm regression curve of log (F 0 − F)/F plotted against log [DNA] (Fig. 5) as described by Lu et al. (2010). The calculated binding constant of ADR and DNM are 4.5×10⁷ and 5.2×10⁸ M−1, respectively. DNM has higher affinity for the DNA with respect to ADR. Higher affinity for DNM is in agreement with spectrophotometrically obtained results as tabulated in Table 1; however, there is a difference of an order of magnitude in the results obtained by the two techniques, which is attributed to the higher efficiency of the fluorimetric technique. For both drugs, the number of the binding sites, n=2 was obtained from the plot.
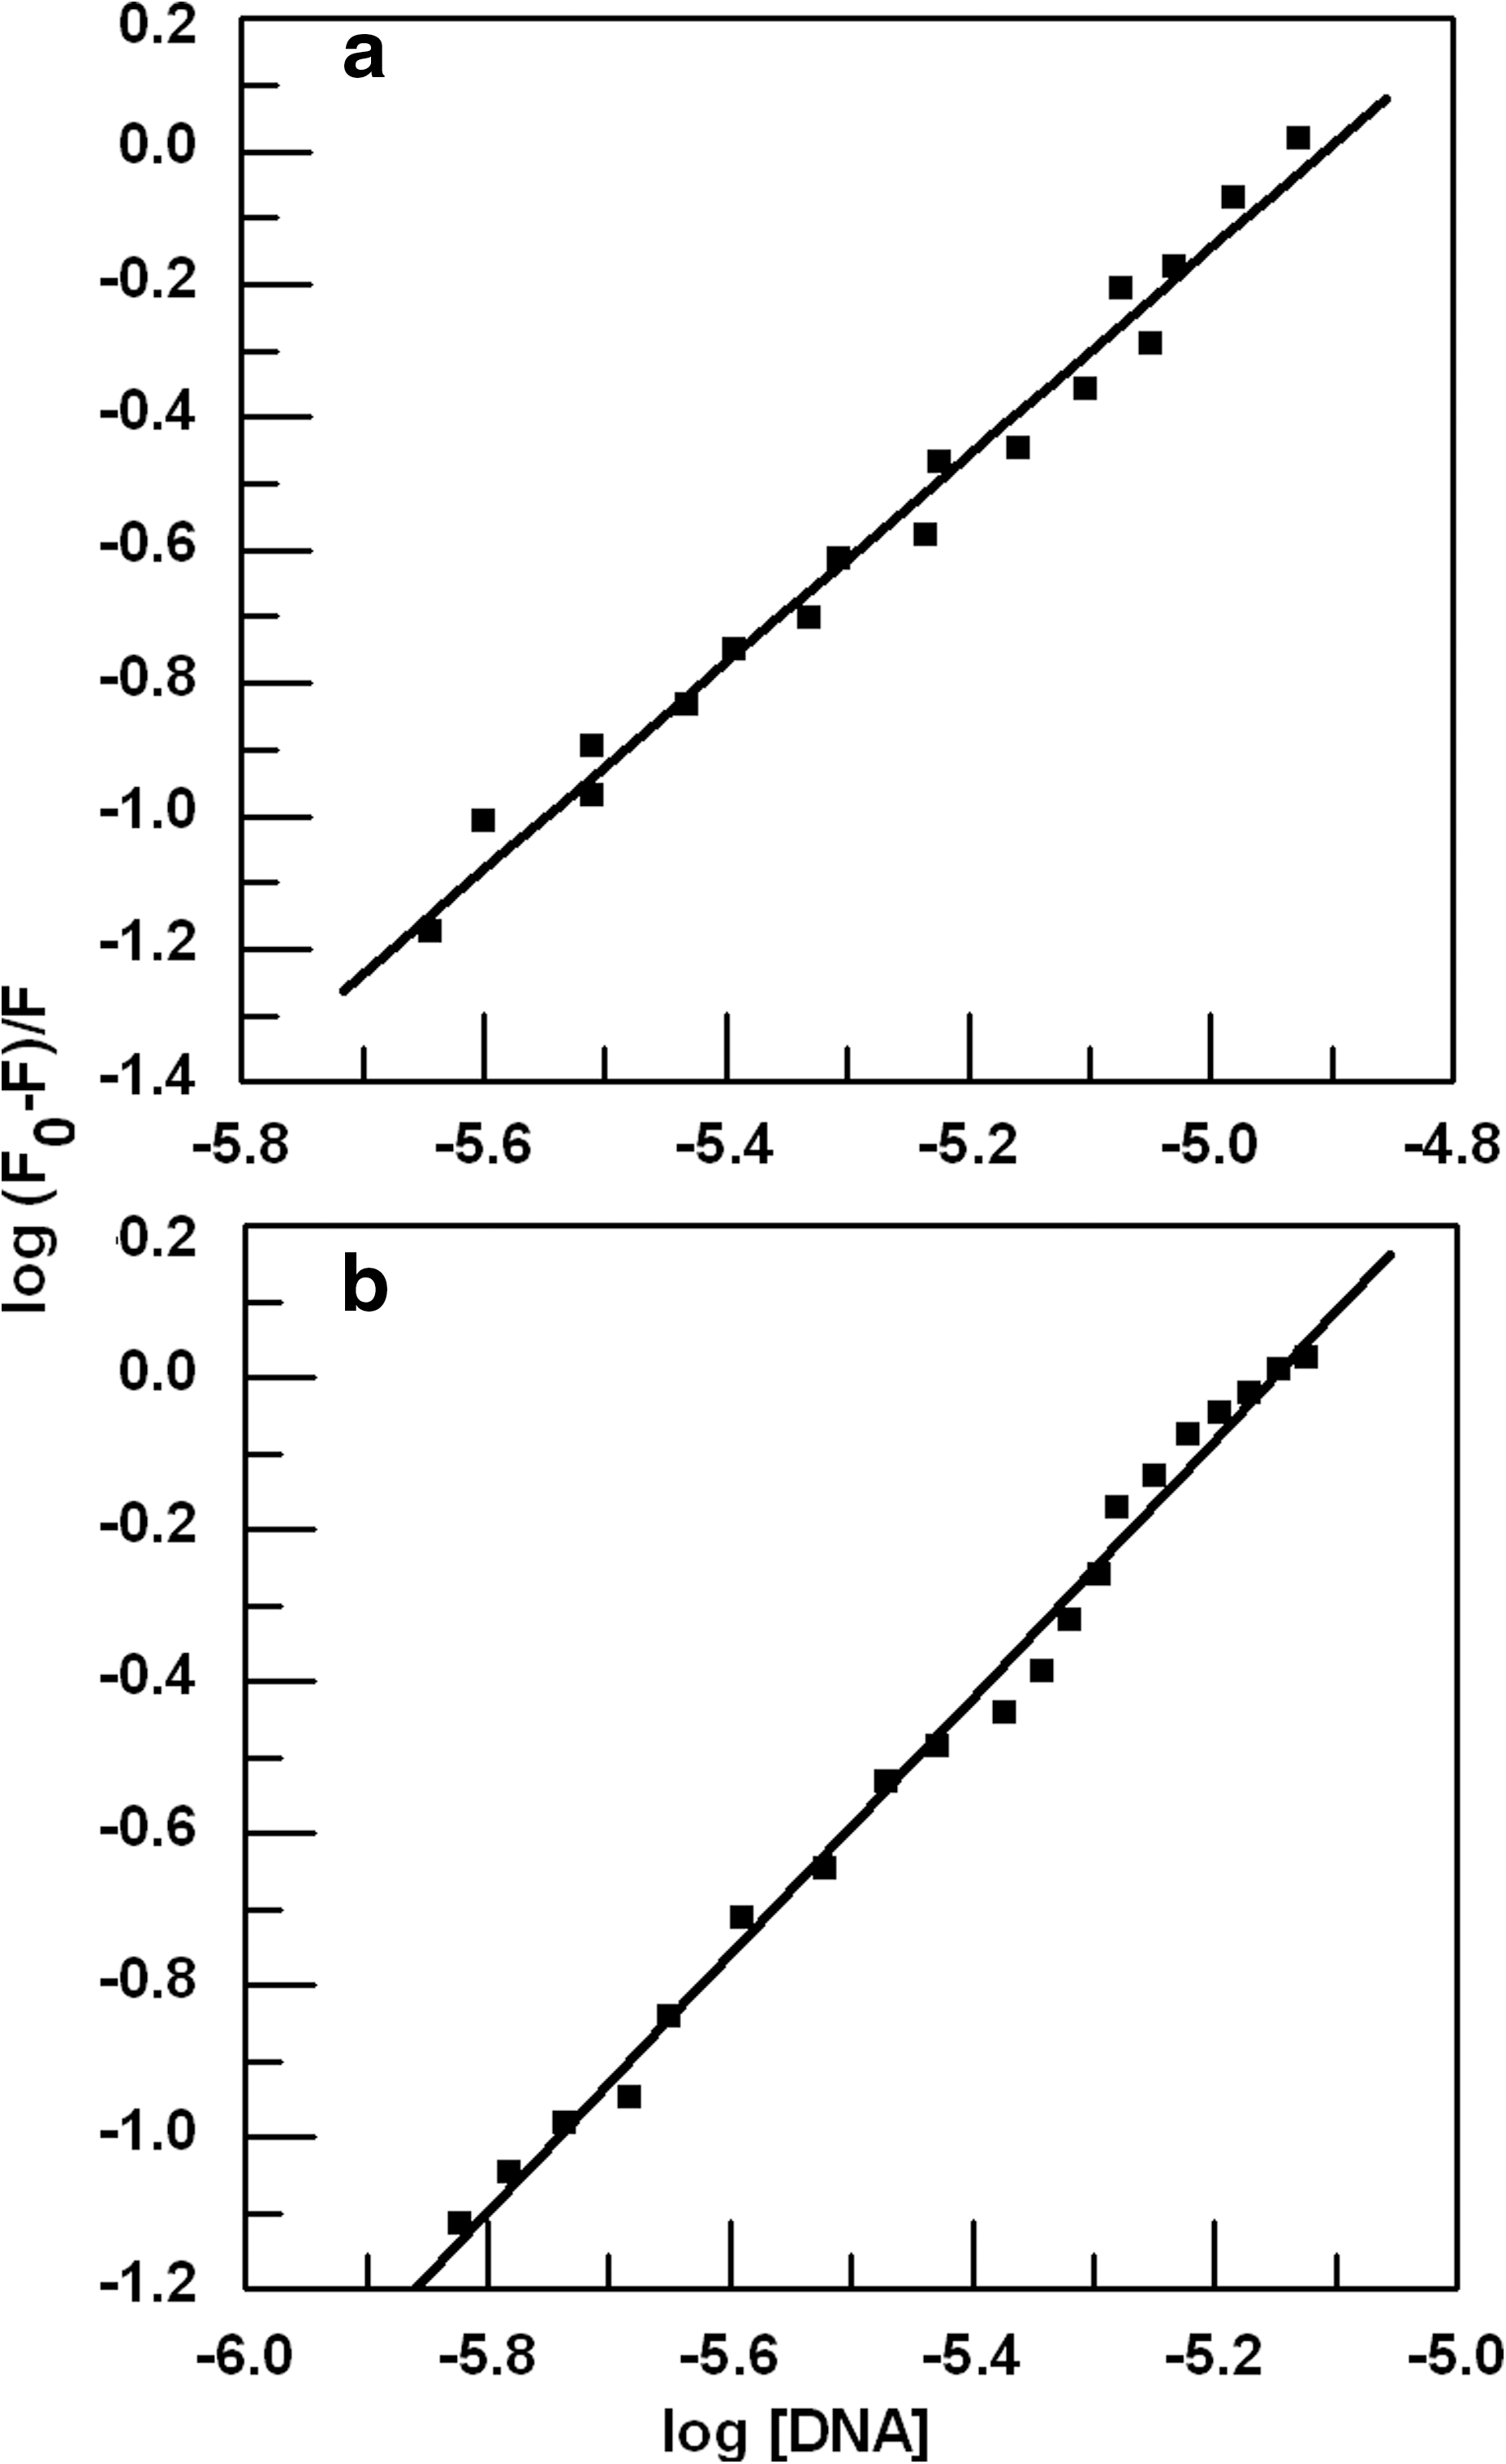
Double logarithm regression curve of
ADR, Adriamycin; DNM, Daunomycin.
Fluorescence quenching studies
ADR and DNM fluorescence intensities were efficiently quenched upon binding to genomic DNA. According to the Stern-Volmer equation, F
0/F was plotted against the concentration of the quencher (DNA) concentration (figure not shown).
Here F 0 and F are the fluorescence intensities of the ADR or DNM measured in the absence and in the presence of the quencher, respectively. KSV is the Stern-Volmer quenching constant, which is a measure of the efficiency of quenching by the quencher. KSV was almost same for both the drugs, 1.2×10⁵ and 1.4×10⁵ M−1 for ADR and DNM, respectively.
Thermal melting studies
Stability of the DNA when heated is frequently used to measure intercalation, which is based on the difference in melting temperature between DNA alone and its intercalator complex. In our present study stability enhancement of the DNA helix on complex formation with ADR or DNM (Fig. 6) was measured by recording the melting curves. In the absence of the drugs, genomic DNA had a melting temperature of 79°C under our experimental conditions. With increasing concentration of ADR or DNM, the Tm of the genomic DNA showed enhancement. At saturating drug concentrations (when the ratio of concentration of drug and concentration of the DNA, [D]/[P]=1.0), the Tm of ADR-DNA and DNM-DNA complexes was found to be 92.5°C and 92.6°C, respectively. In both the cases, ΔTm is ∼13°C, which suggests remarkably strong affinity of the drugs for genomic DNA.
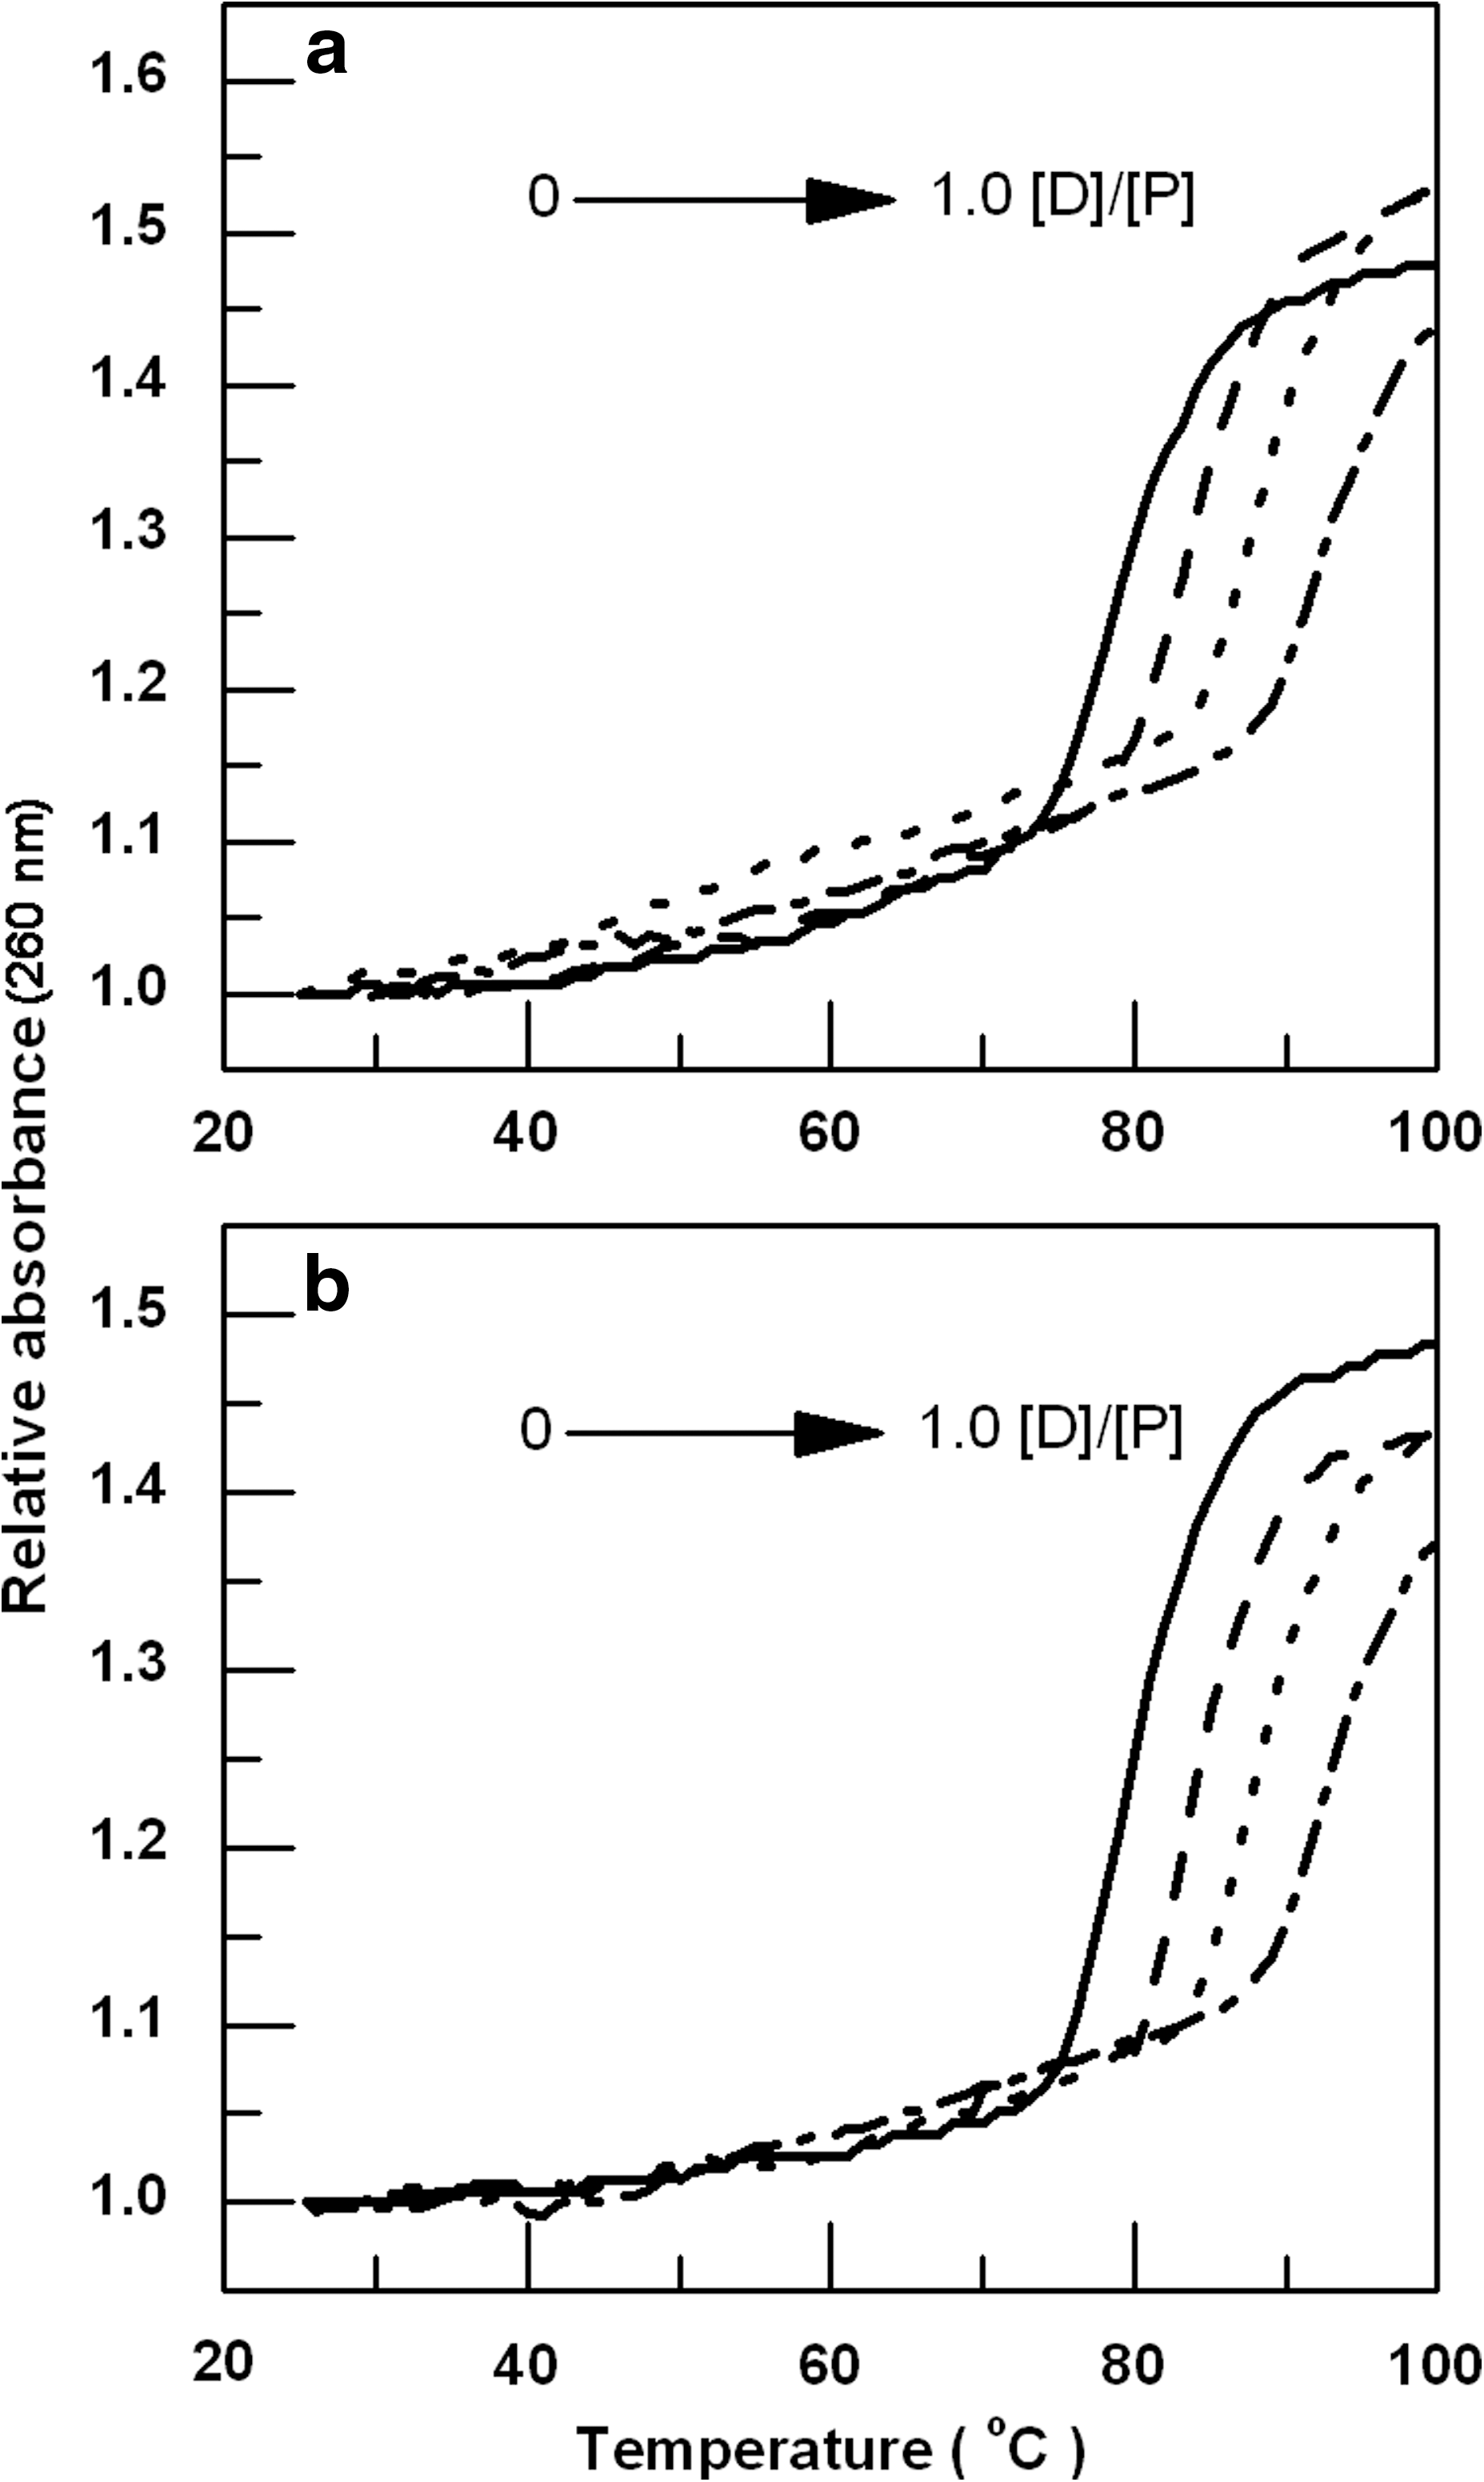
Thermal melting profiles of 8.2 μM genomic DNA treated with 3.28, 6.56, and 8.2 μM of
Circular dichroic spectral studies
CD is a frequently used method for measurement of DNA conformational changes on intercalation; thus, the CD spectra of genomic DNA-ADR and DNA-DNM complexes were examined. The CD spectra showed a positive band with maximum around 270 nm that decreased in ellipticity with progressive increase in drug concentration as shown in Figure 7a for DNA-ADR complex. The binding of DNM also produced a similar decrease in ellipticity that reached saturation at a [D]/[P] (drug/nucleotide phosphate molar ratio) of about 0.6 as shown in Figure 7b. In addition to the peak at 270 nm the DNA-DNM complex also generated a strong induced CD around 350 nm with positive ellipticity which increased with increase in [D]/[P], this band was not so significant for DNA-ADR complex. Induced CD is defined as the CD of the ligand in its absorption region where the DNA does not have any contribution and is generated due to the asymmetric arrangement of the bound drug molecules on the helix. For both drugs, a CD band with a remarkably large change in negative ellipticity for the 250 nm peak was observed that increased as the [D]/[P] increased. This negative ellipticity was also more pronounced for DNM-DNA complex. In the light of these observations it was concluded that DNM intercalates more efficiently than ADR to genomic DNA.
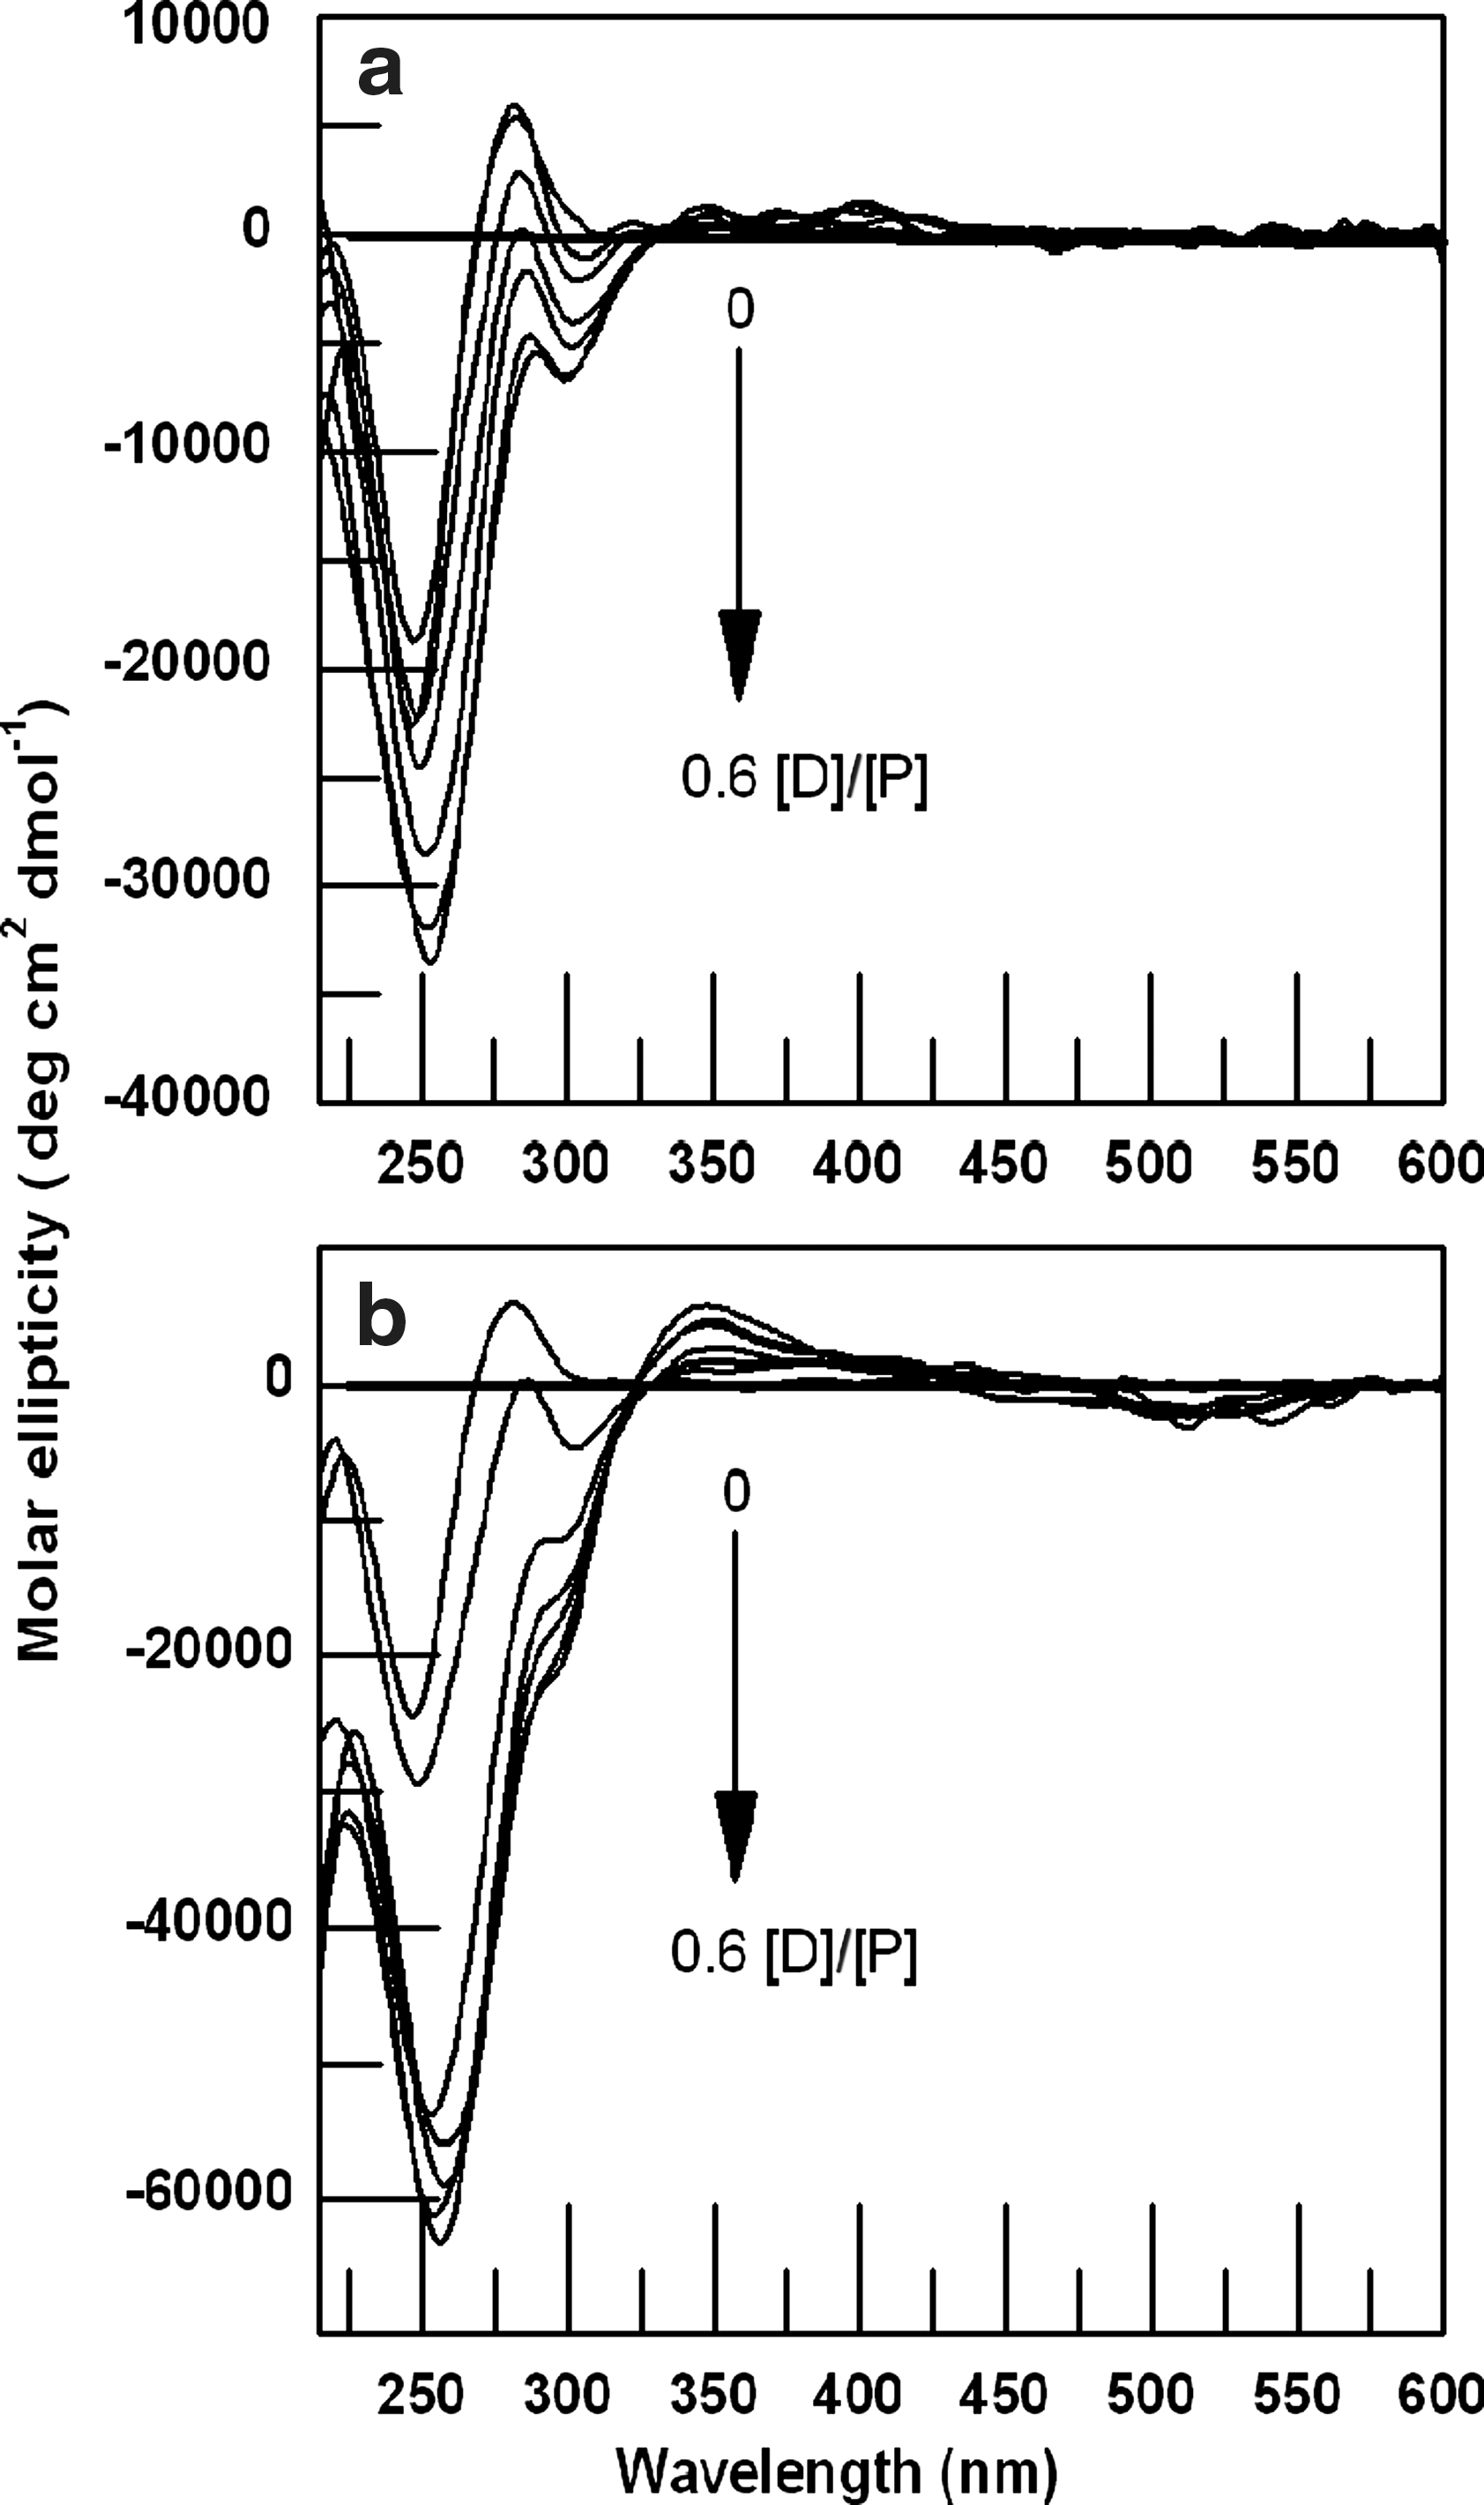
Circular dichroic spectra of
DNA damage using comet assay
The alkaline comet assay is increasingly used in industrial genotoxicity testing in vitro and is also becoming an important tool for evaluating the genotoxic potential of compounds in vivo (Hartmann et al., 2003). In our present study we use this assay to compare genotoxic potential of ADR and DNM independently on normal lymphocytes. One hundred “comets” were randomly selected for each test sample (Fig. 8). The comet tail moment (a measure of tail length×percentage of DNA in the tail) was analyzed. The comet tail moment is positively correlated with the level of DNA breakage and/or alkali labile sites in the cell and is negatively correlated with the level of DNA crosslinks. The mean value of the tail moment for a particular sample was taken as an index of DNA damage in the sample.
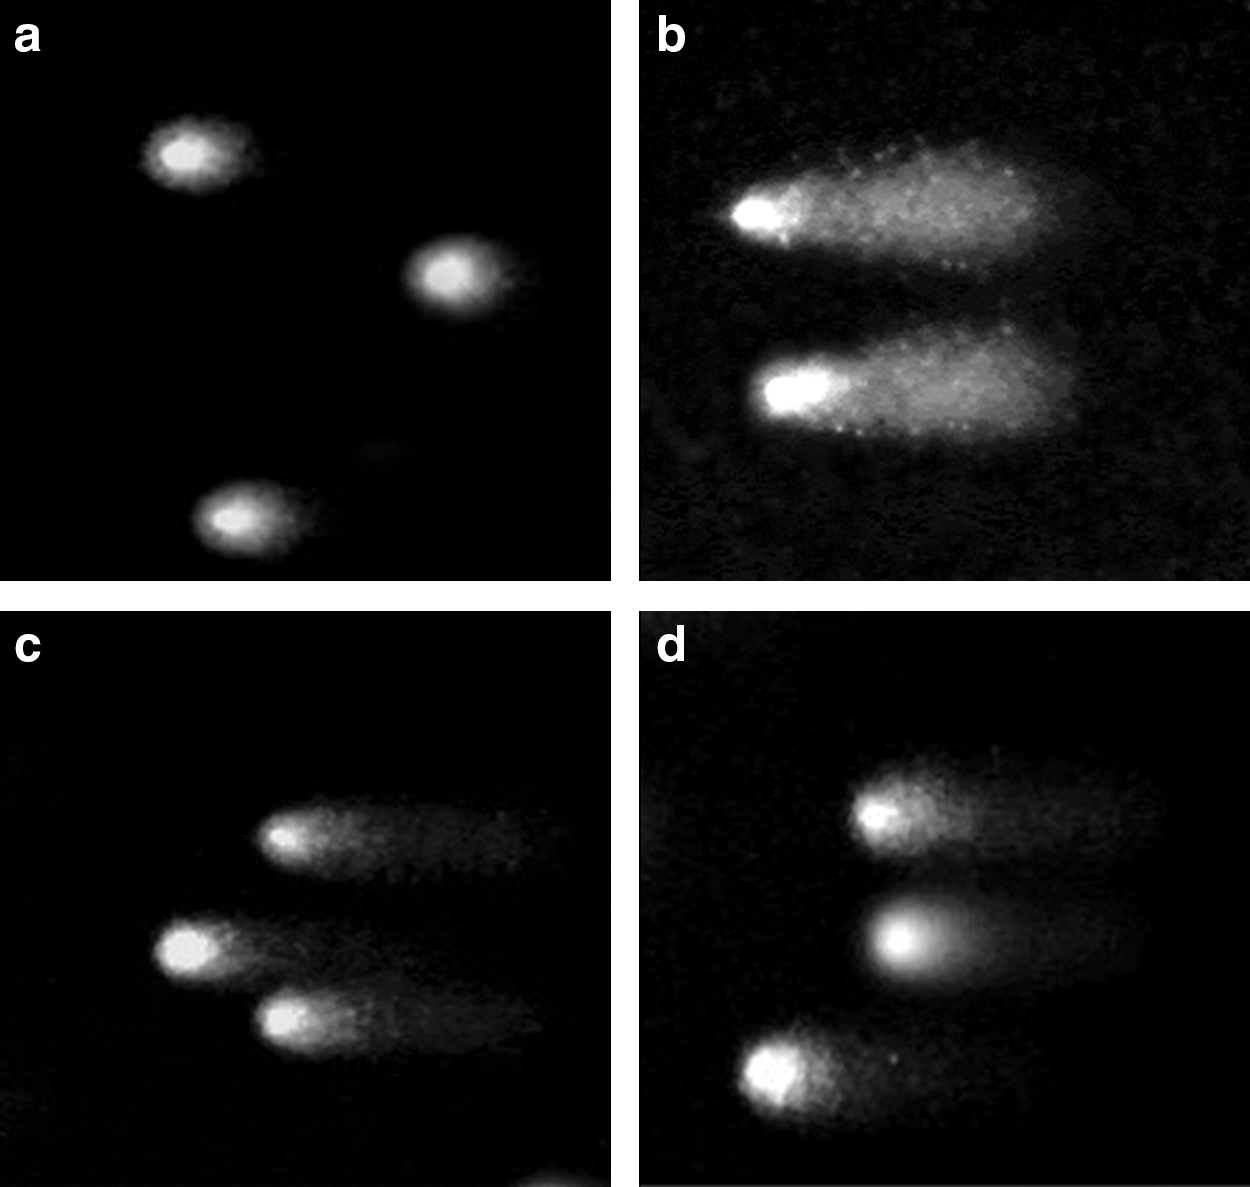
Images of comet cells of normal human lymphocytes
The degree of DNA damage was estimated in arbitrary units by calculating the tail moment in each comet. In healthy negative controls, TM was 2.31303±0.4344; in contrast, TM of ADR/DNM treated lymphocytes were 19.60521±1.37323 and 19.9666±1.0765, respectively. As positive control, MMS-treated cells showed TM of 60.52925±4.7222 as illustrated in Figure 9.
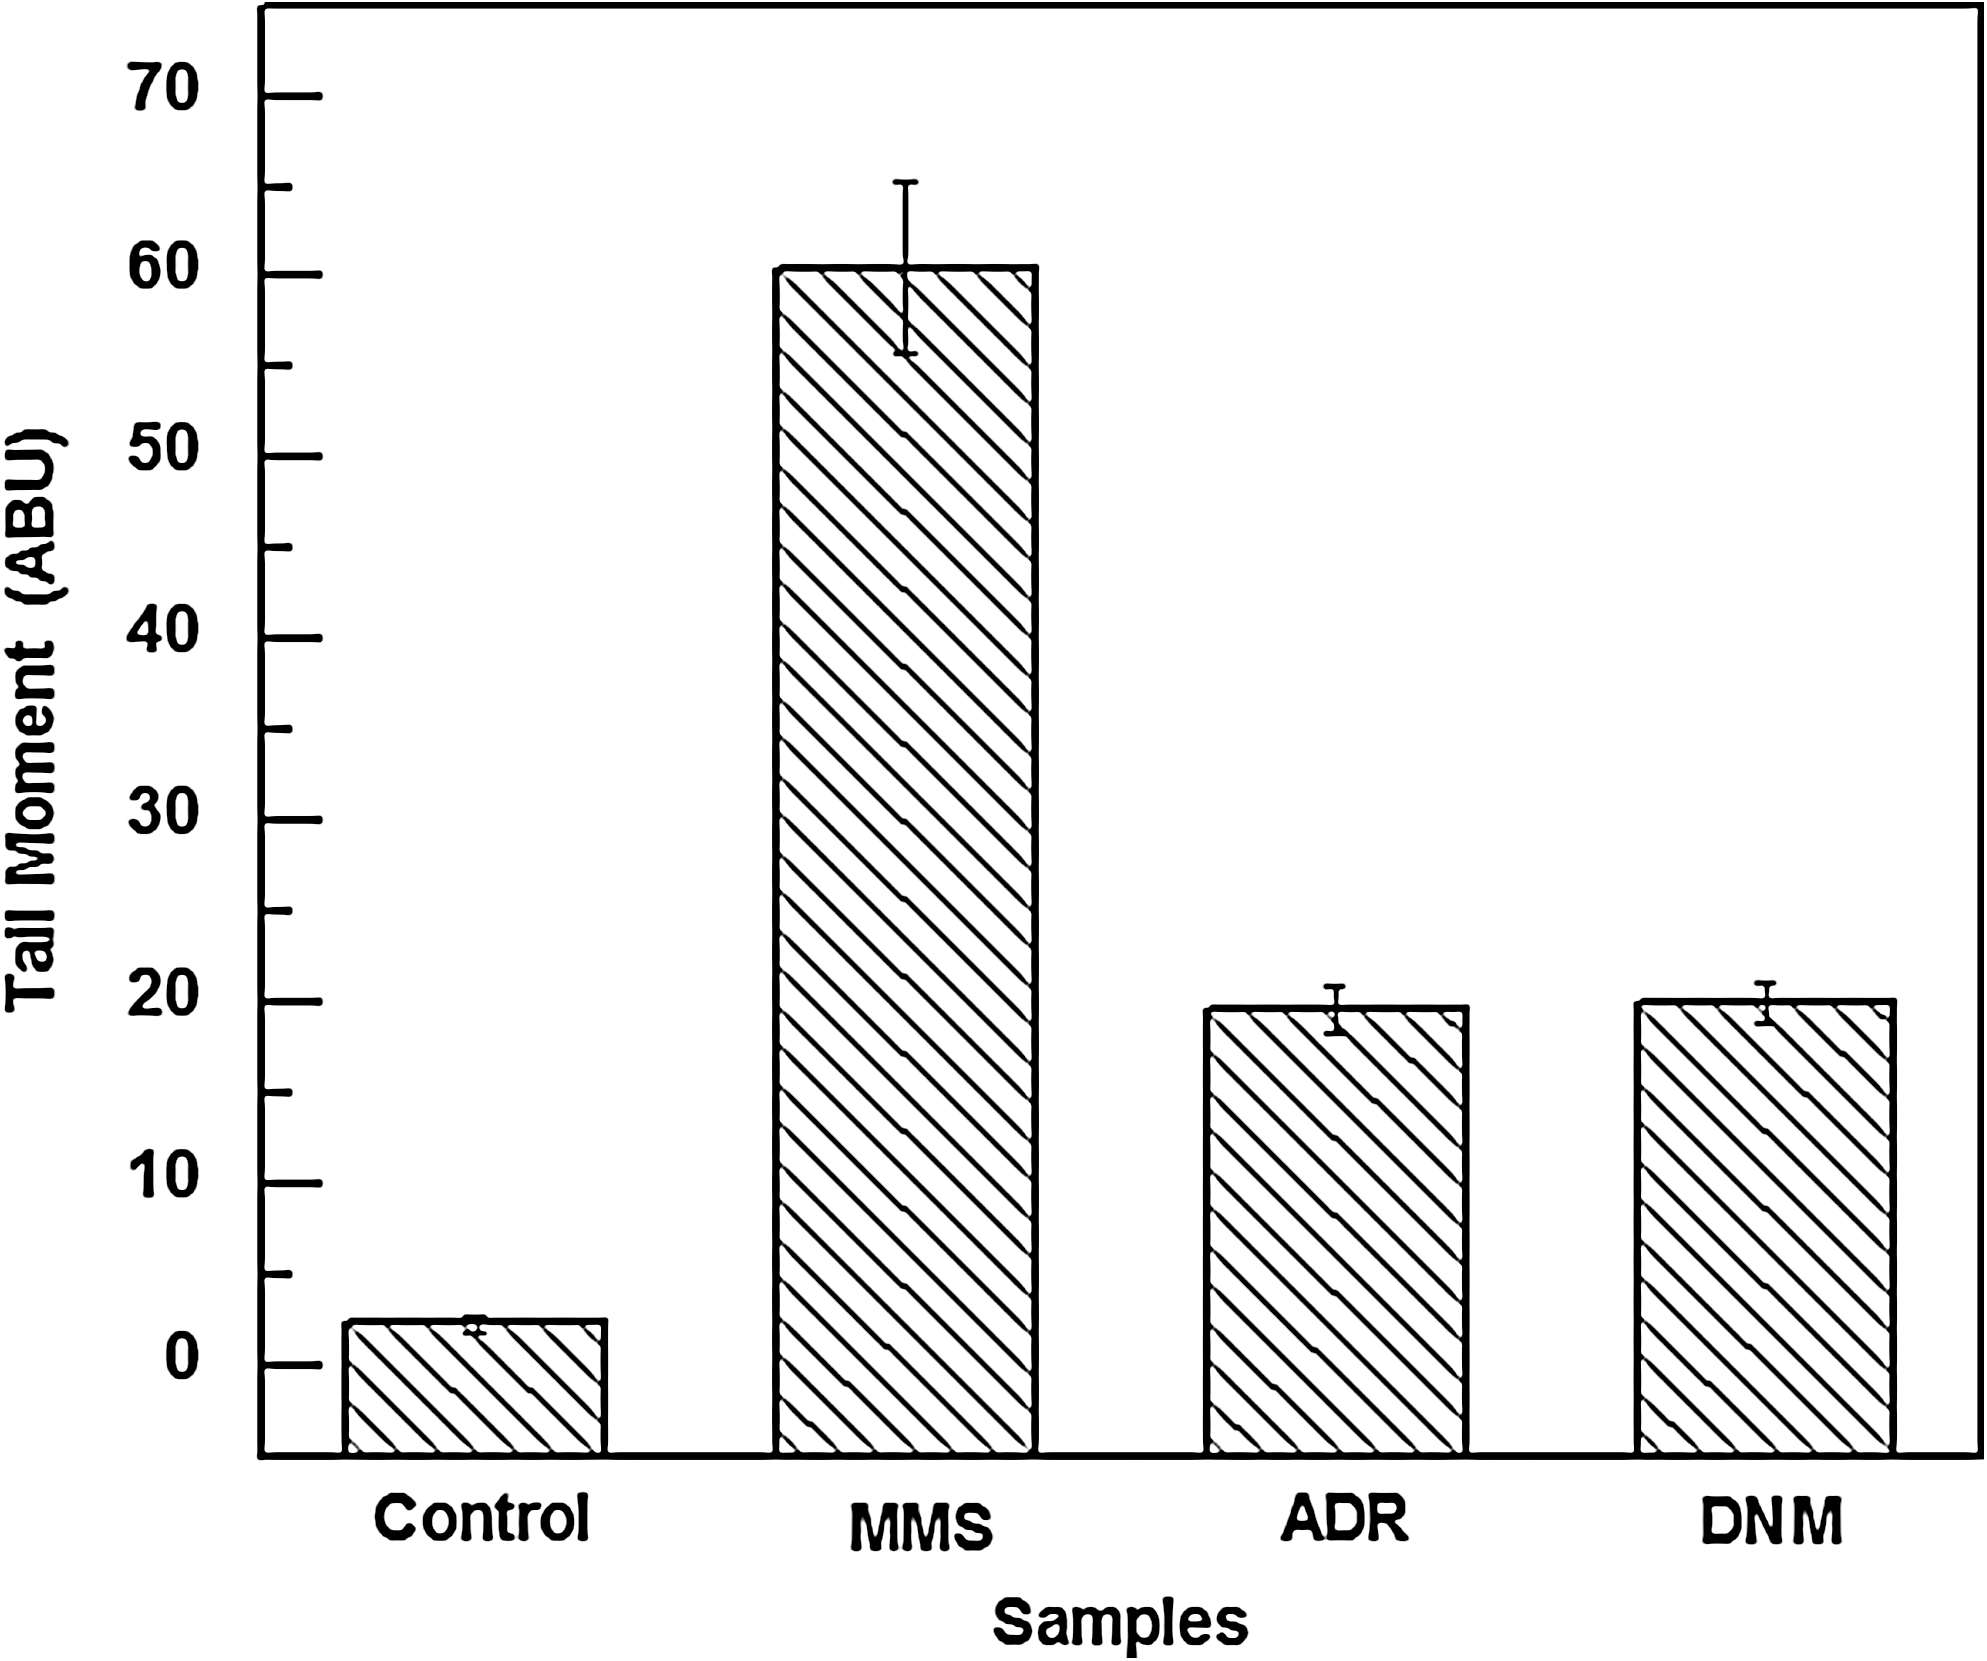
Histograms of comet tail moments obtained from alkaline comet assay of lymphocytes incubated for 2 h at 37°C with 50 μM of MMS, 300 nM of ADR, and 300 nM of DNM as compared to untreated cells. The figure shows mean results±SD from three independent experiments. SD, standard deviation.
Yield of ROS by ADR and DNM
Significant oxidative damage occurs in vivo as a result of endogenous free radical attack, which could contribute to the etiology of cancer (Ames, 1983), which is further stimulated by antineoplastic drugs leading to highly oxidative damage. In the present study normal lymphocytes when treated with ADR and DNM at the clinically used dose of 300 nM yielded almost equivalent ROS as measured fluorimetrically using DCFDA. For a positive control H2O2 treatment was carried out for 2 h and it is evident from Figure 10 that ADR and DNM showed similar efficacy in inducing ROS with respect to H2O2.
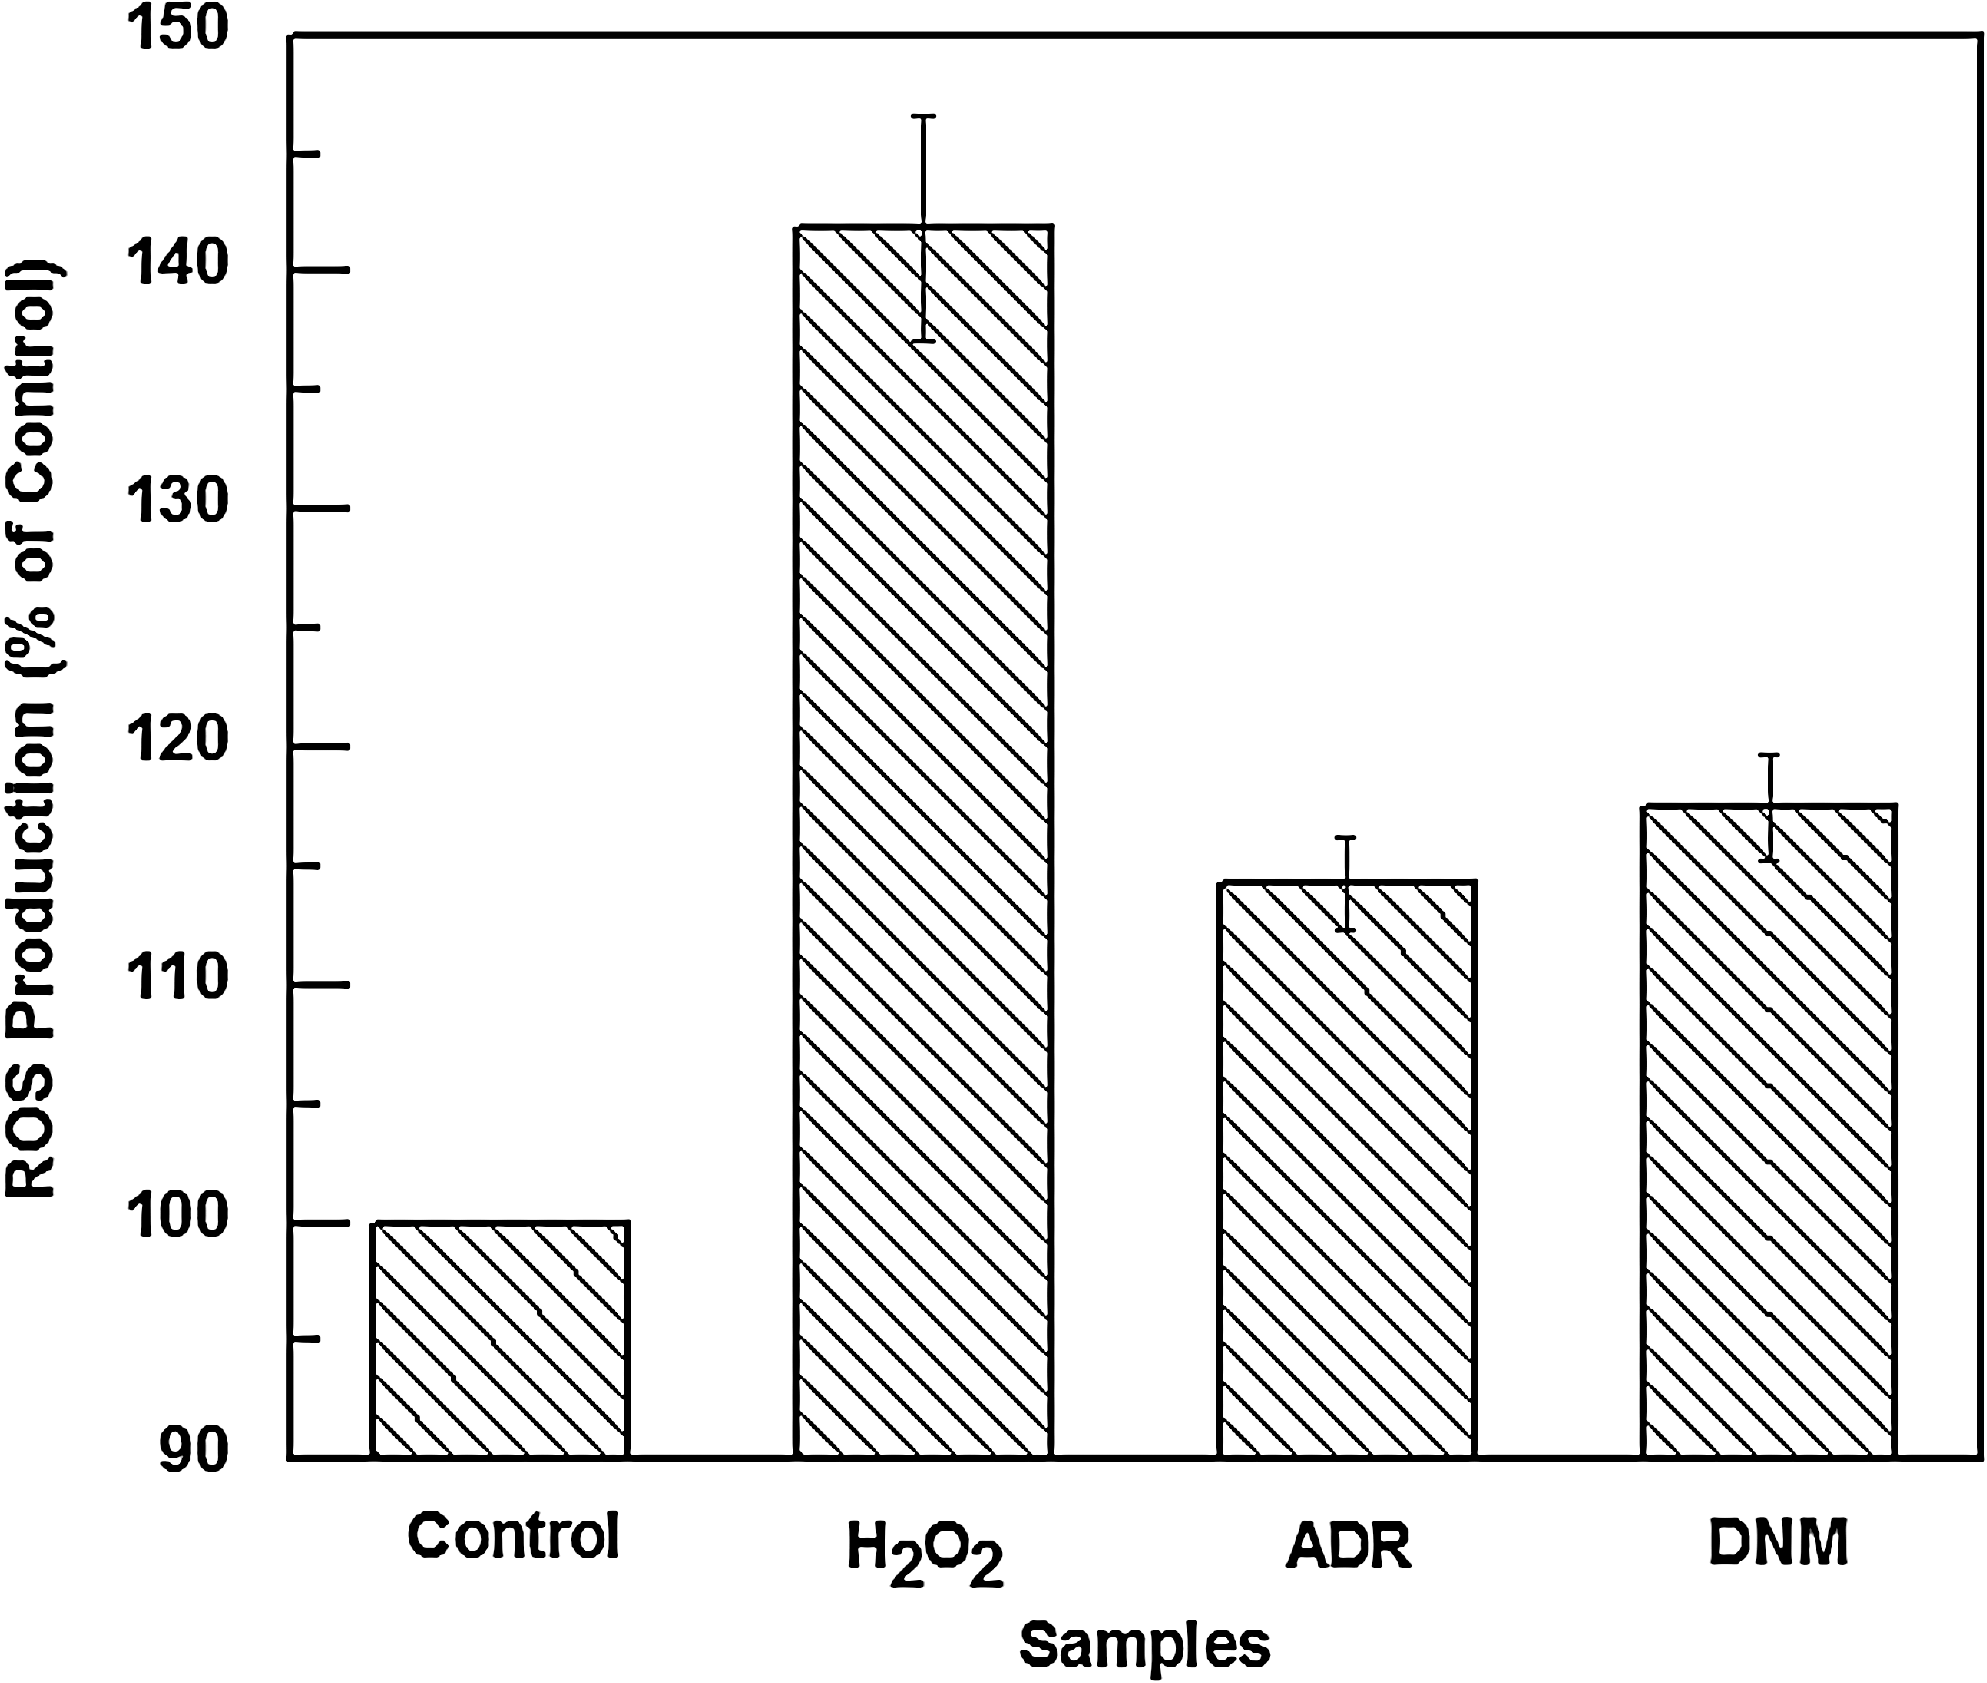
Histograms of reactive oxygen species production (% of control) from fluorimetric assay of lymphocytes incubated for 2 h at 37°C with 25 μM of H2O2, 300 nM of ADR, and 300 nM of DNM as compared to untreated cells. The figure shows mean results±SD from three independent experiments.
Discussion
Agents that are effective in killing neoplastic cells usually also have detrimental effects on normal cells, especially the rapid proliferating cells of gastrointestinal tract and bone marrow. ADR has been shown to have a higher therapeutic index (the ratio of the normal tissue tolerance dose to the tumor lethal dose) than DNM (DiMarco et al., 1969). In vivo comparative study of ADR and DNM shows that ADR is less toxic than DNM to normal hematopoietic colony forming cells in mice, although the lethal effect on leukemic cells was more pronounced with ADR, and DNM was more effective on HeLa cells (Razek, 1971; Kim and Kim, 1972). In the light of these observations it can be reasoned that the clinical effectiveness of these drugs on various cell lines is not clear and more investigations need to be focused in this direction. It is known that intercalation is the primary mode of interaction of these drugs with DNA, which could be prerequisite condition for various biochemical alterations in the cell resulting in to its clinical effectiveness. Reported measurement of binding constant and biological activity of DNA-intercalator complex leads to the conclusion that there should exist a relationship between cytotoxic activity and binding force (Fink et al., 1980; Denny et al., 1982; Martinez and Chacon-Garcia, 2005). Our present study is aimed to find such a relationship between the binding force in terms of binding constant and genotoxicity, which is precursor of cytotoxicity.
In absorption spectrophotometric and fluorimetric studies ADR and DNM demonstrate strong binding affinities for genomic DNA (Table 1). Thermal stabilization of the DNA double helix as inferred from Figure 6 also confirms the spectroscopic findings that both the drugs are efficient genomic DNA intercalators. Intercalation with the genomic DNA leads to inhibition of polymerase action and thus restricted DNA replication and RNA transcription in vivo. The CD spectra as shown in Figure 7b also exhibited better intercalation properties of DNM by a larger induced CD with positive ellipticity at 350 nm with increase in drug concentration. The results do not reflect that the hydroxyl group of ADR at C-14 helps in enhancement of intercalation due to solvent interaction. The present findings demonstrated that DNM is a more efficient intercalator; this cannot be explained from the differences in chemical structure of the two drugs.
Other than structural difference, the sequence specificity of the ADR and DNM could result in different intercalation and clinical responses. Sequence specificity studies of DNM by DNA footprinting assay show that the 5′ CA sequence is the highest affinity binding site. Modest affinity sites (5′ GC, CG, CT, TC, AC) and poor affinity sites (5′ AA, AT, TA) were also observed (Skorobogaty et al., 1988; Frederick et al., 1990). The consensus for the highest affinity ADR site is 5′ TCA, with some evidence for preference of AT base pairs flanking both ends of this trinucleotide (Robie and Wilkins, 1984; Trist and Phillips, 1989). Sequence-specific binding of ADR and DNM exists and could contribute to the differential binding efficiencies of the drugs.
Intercalation of DNA by anthracyclines is not required for inhibition of topoisomerase II (Pommier, 1993). In certain cell lines, the formation and disappearance of ADR-related DNA breaks has not been correlated with the tumor cell killing; in others, DNA strand cleavage is modest and double strand breaks are undetectable at supralethal drug concentrations (Zwelling et al., 1982; Fornari et al., 1994). In the present study, we observed DNA double-strand breaks in human lymphocytes at the clinically used concentration of 300 nM ADR or DNM. The measurement of these strand breaks by comet assay using CASP software as shown in Figure 9 highlights that the yield of DNA strand breaks is the same for both drugs under identical conditions irrespective of their binding force. ADR is known to form adducts in vivo which are stable and can be isolated and detected at clinically relevant concentrations (Coldwell et al., 2008, 2010). It can be argued that in case of ADR, DNA adduct formation would have a inverse effect on the comet formation in neutral conditions, but in an alkaline comet assay, DNA adducts would render alkali-labile strand breaks (Gewirtz, 1999). Interstrand crosslinks (ICLs) constitute a very small portion of the adducts where the mono adducts form crosslinks as a result of second alkylation and such crosslinks have been identified for nitrogen mustards and melphalan (Sunters et al., 1992; Hartley, 2002; Spanswick et al., 2002). However, in case of ADR such ICLs have not been reported and virtual crosslinks are predominant. Other cellular processes, such ROS production in combination with intercalation and strand breaks, could be responsible for the overall cytotoxicity induced by these drugs.
Antineoplastic drugs stimulate substantial production of oxygen-free radicals and a major class of DNA damage is caused by ROS leading to oxidized bases and to strand breaks (Collins et al., 1993, 1996). Our results demonstrate that ROS production induced by ADR and DMN is almost equivalent under similar experimental conditions; hence, it can be envisaged that the yield of strands breaks, an index of genotoxicity, will be equal for both drugs under similar experimental conditions independent of intercalation efficacy. Here it should be noted that ADR is known to render more cytotoxicity than expected per DNA strand break (Zwelling et al., 1993); it could be likely that other mechanisms of DNA damage other than those related to topoisomerase II also operate in parallel with the formation of ADR–topoisomerase II ternary complexes. Flavin dehydrogenase-mediated, ADR-induced oxidative modifications in DNA might also play an important role in either therapeutic or carcinogenic properties of this agent (Bachur et al., 1982; Doroshow, 1986). The relationship between the different modes of action of these drugs still remains an enigma at the molecular level and our future studies will be directed to unravel the major mechanism involved.
Conclusion
Difference in intercalation of ADR and DNM with genomic DNA isolated from human lymphocytes was observed and attributed to the difference in sequence specificity of the two drugs and not to structural differences. ADR and DNM could bind to short but crucial motifs rich in 5′ TCA and 5′ GC, respectively, of important genes, which in turn could be downregulated, leading to decreased expression of function leading to differential cytotoxicity. However, the genotoxicity was same for both the drugs at 300 nM concentrations, which do not correlate to differential intercalation though showed positive correlation with ROS production. It is our interest to see if this relationship is valid for immortal leukemic cells in the future.
Footnotes
Acknowledgments
Dr. Chabita Saha is thankful to Department of Science and Technology, India, for the financial support. Debjani Ghosh, junior research fellow, is financially supported by National Tea Research Foundation (NTRF), India, and is thankful to the same. Dr. Maidul Hossain is grateful to the Council of Scientific and Industrial Research (CSIR) for the award of Research Associateship. The authors are thankful to Mr. Sandip Pal, junior research fellow of the School of Biotechnology and Biological Science, WBUT, for his unconditional support throughout the work. Last but not least, the authors extend their gratitude to Mr. Bubai Pal, SBBS, WBUT, for his technical support throughout the work.
Disclosure Statement
No competing financial interests exist.