
Abstract
The Chevrier's field mouse (Apodemus chevrieri) is an endemic species to China and is an important pest in agriculture and human diseases. In this study, the complete mitochondrial genome of this species was sequenced and its size was 16,298 bases (accession no.: HQ896683). The mitogenome structure was similar compared with other reported rodent mitochondrial genomes and includes 13 protein-coding genes, 2 rRNA genes (12S rRNA and 16S rRNA), 22 tRNA genes, and 1 control region. This was the first complete mitogenome sequenced in genus Apodemus. The phylogenetic analyses based on the sequences of 12 heavy-strand protein-coding genes demonstrated that A. chevrieri clustered together with genus Mus. Additionally, extremely high haplotype and nucleotide diversities (h=0.978, π=2.6%) were observed based on 44 mitochondrial cytochrome b (cyt b) gene sequences. This suggests adaptive divergence of this species to a variety of living habitats and potential refuges in the eastern margin of the Hengduan Mountains during the Quaternary ice ages. No population expansions or genetic bottlenecks were observed in demographic analyses. The phylogenetic analysis of cyt b sequences and haplotypes revealed a genetic differentiation between north and south populations. The divergence between north clade and south clade occurred probably in the middle Pleistocene 1.1815 million years ago (Mya) (95% highest posterior density 2.3189–0.2737 Mya), which was congruent with the periods of the most tense uplift events in the Tibetan Plateau.
Introduction
Apodemus chevrieri was first identified as Apodemus agrarius (Allen, 1940) and then listed as an independent species (Ellerman and Morrison-Scott, 1951). However, it was listed as a subspecies of A. agrarius for a long time and this was supported by phallic morphological studies (Corbet, 1978; Liu et al., 2002). Most morphological studies suggested that A. cheverieri was a valid species (Wang, 2003; Musser and Carleton, 2005). Also, Liu et al. (2004) further supported the validation of the species based on the phylogenetic analysis of cytochrome b (cyt b) gene sequence.
The wood mice of the genus Apodemus were the most common small rodents in agricultural fields and broad-leaf forests in the temperate zone and they have been widely studied on morphology, biogeography, phylogeny, and disease controls (Ledesma et al., 2009; Hauffe et al., 2010; Tomozawa et al., 2010; Plyusnina et al., 2011). However, molecular characteristic studies of these species are not well documented (Gu et al., 2009; Ishiniwa et al., 2010; Sakka et al., 2010). The mitochondrial genome has been widely and successfully used in evolutionary and molecular phylogenetic studies because of its small size, high substitution, maternal inheritance, and relative lack of recombination (Feldmeyer et al., 2010; Mwinyi et al., 2010; Xu et al., 2010; Jiang et al., 2011; Li et al., 2011). In this study, the complete mitochondrial genome of A. chevrieri was sequenced and the sequence variations of cyt b gene were evaluated.
Materials and Methods
Samples and DNA extraction
A total of 39 A. chevrieri mice were collected from 11 localities in Sichuan Province, China (Table 1, Fig. 1), and 1 mouse from Mianning (MN) was used to determine the complete mitochondrial genome sequence. Tissue samples were stored in 95% ethanol and all voucher specimens were held in the Museum of the Sichuan Academy of Forestry. Total genomic DNA was extracted from tissue samples using standard phenol/chloroform methods (Sambrook and Russell, 2001). In addition, five cyt b sequences of A. chevrieri from Kunming (accession nos.: AB096818–AB096821) and Beichuan (BC) (AY389015) were obtained from GenBank for analyses. The sampling collections and study had no conflict with ethical guidelines, religious belief, or the legal requirements of our country. All animal experiments conformed to the Guideline for Care and Use of Laboratory Animals and were approved by the Committee of Laboratory Animal Experimentation at Sichuan University.
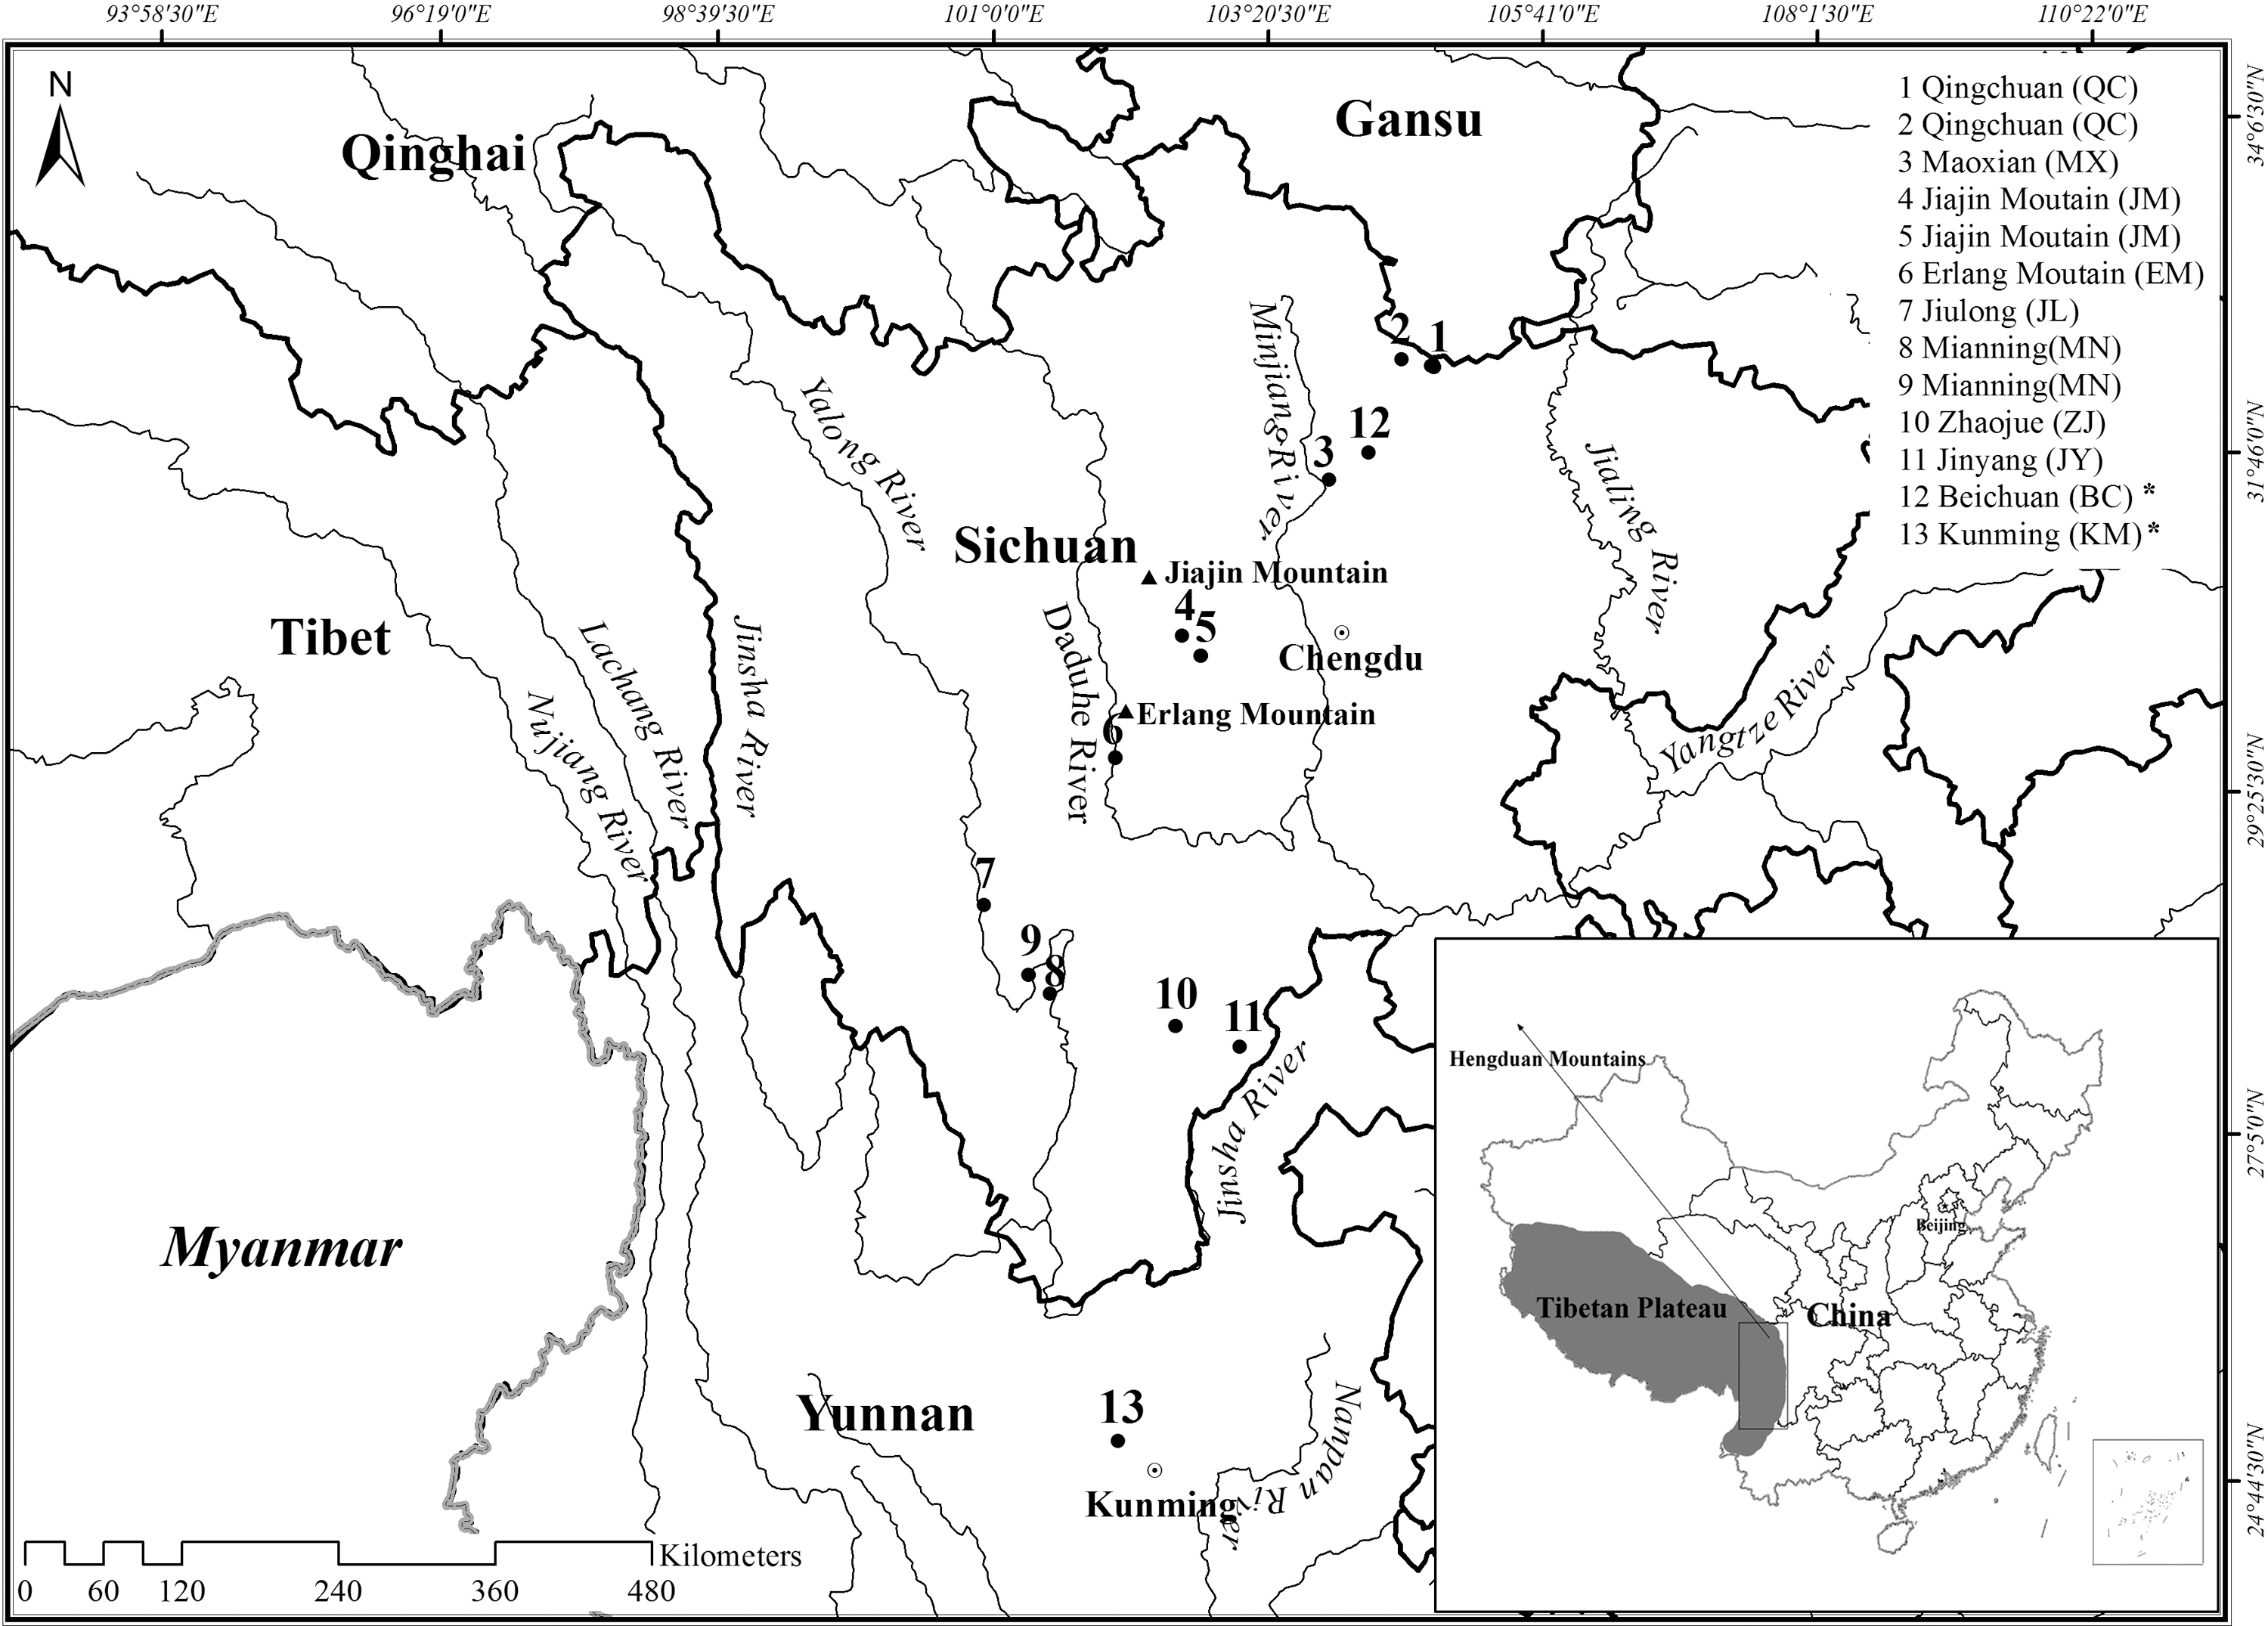
Study area and sampling sites for the Chevrier's field mouse (Apodemus chevrieri) in this study. * indicates that sequences of individuals from sampling sites 12 and 13 were downloaded from GenBank. Sample sizes can be found in Table 1.
These sequences were downloaded from GenBank, and their accession numbers are in the Materials and Methods section.
Polymerase chain reaction amplification and sequencing
A total of 16 primer sets (Table 2) were used to amplify contiguous, overlapping segments of the complete mitochondrial genome of A. chevrieri. The primers were designed based on the conserved regions of the mitochondrial genomes of Mus terricolor (NC_010650), Rattus rattus (NC_012374), Eothenomys chinensi (NC_013571), and Microtus kikuchii (NC_003041). The cyt b sequences were amplified using universal primers L14724/H15915 (Irwin et al., 1991). The amplification was performed in 25 μL reaction volumes with 2.5 μL of 10X EXTaq buffer (Mg2+ Free; TaKaRa), 1.5 μL dNTP (2.5 mM each), 2.0 μL MgCl2 (25 mM), 1 μL of each primer (10 μM), 0.2 μL EXTaq polymerase (5 U/μL; TaKaRa), and approximately 200 ng total genomic DNA as the template. The polymerase chain reaction (PCR) protocol was an initial predenaturation for 5 min at 95°C, followed by 35 cycles of 40 s denaturation at 94°C, 50 s annealing at 50°C–58°C, 90 s extension at 72°C, and a final extension at 72°C for 10 min. The PCR products were purified with gel extraction kits (Omega) and then directly sequenced with PCR primers in both directions using an ABI PRISM 3730 DNA sequencer (Applied Biosystems, Inc.).
Modified from the study by Chen et al. (2010).
Designed in this study.
Modified from the study by Irwin et al. (1991).
Mitogenome sequence analysis
The mitogenomic nucleotide sequences and base compositions of protein-coding genes were analyzed using the software MEGA 4.0 (Tamura et al., 2007). The locations of protein-coding and rRNA genes were identified by comparison with known sequences from M. terricolor (NC_010650), R. rattus (NC_012374), and E. chinensis (NC_013571). The tRNA genes were identified with tRNAscan-SE 1.21 (Lowe and Eddy, 1997).
Phylogenetic analysis based on mitochondrial genomes
The nucleotide sequences of 12 heavy-strand protein-coding genes from A. chevrieri and 20 other rodent species were used for phylogenetic analysis (Table 3). Three pikas, Ochotona collaris (AF348080), Ochotona curzoniae (EF535828), and Ochotona princeps (NC_005358), were used as outgroups. The ND6 gene was not used in phylogenetic analysis, because it was encoded by the opposite strand and had a considerably different base composition and codon bias (Zardoya and Meyer, 1996; Miya and Nishida, 2000). Multiple alignments of the 12 concatenated protein-coding gene sequences were conducted using ClustalX 1.83 (Thompson et al., 1997), and Bayesian inference (BI) was used to reconstruct the phylogenetic relationships. The best fit model of DNA substitution was obtained using MrModeltest2.2 (Nylander, 2004). BI analysis was performed with MrBayes 3.1.2 (Ronquist and Huelsenbeck, 2003). Posterior distributions were obtained by the Markov Chain Monte Carlo (MCMC) method with one cold chain and three heated chains for 1,000,000 generations and sampled every 100 generations. The first 25% were discarded as a conservative burn-in and the remaining samples were used to generate a 50% majority rule consensus tree.
Genetic variability and population demography analyses
All nucleotide sequences of the cyt b were aligned using ClustalX 1.83 (Thompson et al., 1997). Haplotype diversity (h) and nucleotide diversity (π) were estimated using DnaSP Ver. 4.10.7 (Rozas et al., 2003). BI and median-joining network (MJN) were used to reconstruct phylogenetic relationships among cyt b haplotypes. Apodemus draco (AY389004), Neodon juldaschi (AY513808), and Microtus arvalis (AY22076) were applied as outgroups. The best fit model of DNA substitution was obtained using MrModeltest2.2 (Nylander, 2004). BI analysis was performed with MrBayes 3.1.2 (Ronquist and Huelsenbeck, 2003) using the same method as that in phylogenetic analysis based on mitochondrial genomes. MJN approach was also conducted to depict relationships among the cyt b haplotypes of A. chevrieri using Network 4.5.1.6 (Bandelt et al., 1999).
The demographic history was tested by mismatch distributions and neutrality tests based on the cyt b sequences. Fu's (1997) Fs statistic and Tajima's D statistic (Tajima, 1989) were used to test selective neutrality, which were calculated in Arlequin 3.1 (Excoffier et al., 2005). The raggedness indices (r) (Harpending, 1994) and the sum of squared deviations (SSD) were also estimated in Arlequin 3.1 to determine whether the sequences deviated significantly from the population expansion model. The mismatch analyses (Slatkin and Hudson, 1991) were carried out using DnaSP Ver. 4.10.7 (Rozas et al., 2003).
Molecular dating estimations
Divergence times among the observed main mitochondrial clades were estimated by BEAST v1.6.1 (Drummond and Rambaut, 2007) using a Bayesian coalescence approach. We only used the haplotypes to perform this analysis, because we were interested in divergence time between major phylogenetic lineages. The relaxed molecular clock was carried out using the uncorrelated lognormal algorithm. The substitution model parameters were GTR+I+G. All analyses were performed using a Coalescent (Constant Size) process of diversification. The prior for mean mutation rate was specified as a lognormal distribution, with a mean of 0.02, log (standard deviation) of 0.56, and offset of 0.0172. This lognormal distribution covered the range from 2% to 8% substitutions per site per million years (Myr) and the 95% highest posterior density (HPD) range was 2.4% to 6.01%. We used this set, because the standard divergence rate for the mammalian cyt b gene was 2% per Myr (Avise, 1998) and the evolutionary rate of cyt b in Apodemus was estimated to be 2.4% per Myr (Suzuki et al., 2003, 2008). However, multiple studies (e.g., Jaarola and Searle, 2002; Brunhoff et al., 2003; Galbreath and Cook, 2004; Oshida et al., 2005) suggested that the cyt b gene of rodents in general evolved several times faster than the standard rate in mammals. Moreover, Fan et al. (2011) used 2.4%–8% per Myr for another field mouce, Apodemus latronum, in their study. Therefore, we applied the lognormal distribution for the mean mutation rate in this study. The MCMC chain was run for 50 million generations, sampling every 1000 generations, and runs were initiated on random starting trees. The first convergence of the chains to the stationary distribution was checked by eye using Tracer 1.5 (Rambaut and Drummond, 2007) and the first 25% were discarded as burn-in. The final molecular clock tree was produced in TreeAnnotator 1.6.1 (Drummond and Rambaut, 2008) using mean as node heights. Finally, Figtree v1.3.1 (Rambaut, 2008) was used to visualize the results including the confidence intervals. Divergence times were calculated as 95% HPD intervals, because it represents the shortest interval that contains 95% of the sampled values from the posterior (Drummond et al., 2007).
Results
Mitochondrial genome organization and structure
The complete mitochondrial genome sequence of A. chevrieri was 16,298 bases in length and it was deposited in GenBank (accession no.: HQ896683). The gene structure was similar to other rodent mitogenomes and included 13 protein-coding genes, 2 rRNA genes (12S rRNA and 16S rRNA), 22 tRNA genes, and 1 control region (CR; Table 4). The lengths of 12S rRNA and 16S rRNA were 954 and 1573 bp, respectively. The 22 tRNA genes were interspersed between the rRNA and protein-coding genes. The origin of light-strand replication was predicted in the positions between 5149 and 5179 (Table 4). ATP8 and ATP6, ATP6 and COIII, ND4L and ND4, and ND5 and ND6 overlapped in the reading frames, but ND5 and ND6 were encoded on opposite strands. Most protein-coding genes used ATG as the initiation codon; however, ATA was used in the ND1, ND2, and ND5 genes. Three types of stop codons were used, including TAG for ND1 and ND2, TAA for COI, COII, ATP8, ATP6, ND3, ND4L, ND5, and ND6, and an incomplete stop codon T for COIII, ND4, and cyt b.
The base composition of 12 protein-coding genes on the H-strand was biased against G, and a heavy bias against G was observed at the third codon position. The nucleotides T and A were most frequently used at the second and third codon positions, respectively. However, more T was observed in the ND6 gene both in total base composition and at the third codon position (Table 5).
The major noncoding sequence (CR) was 895 bp in length and was located between the tRNA-Pro and tRNA-Phe genes.
Phylogenetic analyses
The GTR+I+G model was chosen based on Akaike Information Criterion (AIC) tests. After alignment, a 10,589-bp nucleotide sequence set was used, including 5256 parsimony informative sites. The construction of the BI tree showed that all the species in family Muridae formed a solid monophyletic group, and the monophyly of the family Cricetidae was also supported with high posterior probability. A. chevrieri clustered together with the species in genus Mus, indicating their close phylogenetic relationship (Fig. 2).
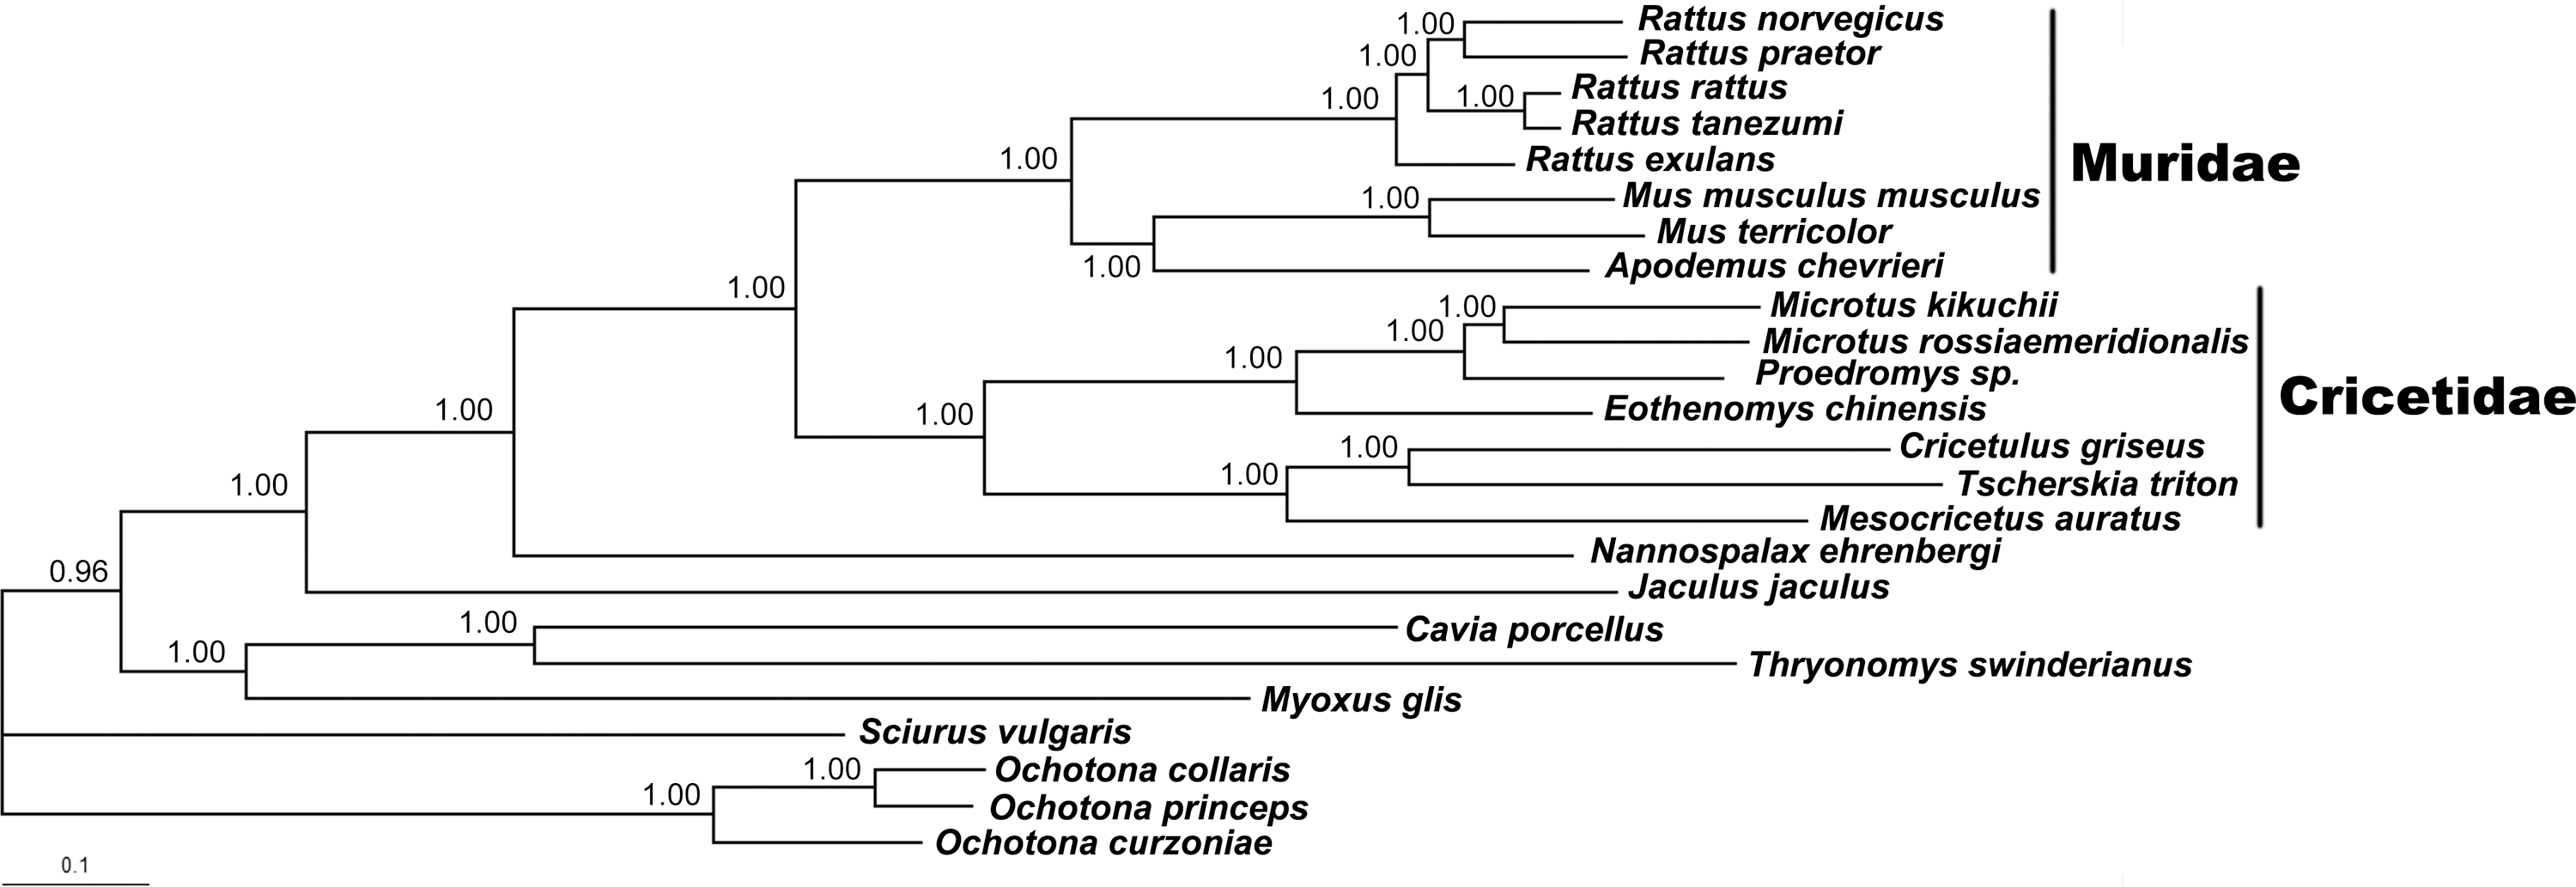
Fifty percent majority rule consensus tree of order Rodentia from Bayesian analysis. The concatenated nucleotide sequences of 12 protein-coding genes on the heavy strand from 21 rodents and three pikas were used. Numbers represent node supports inferred from Bayesian posterior probability.
Genetic variation, demography, phylogenetic structure, and molecular dating estimation
The cyt b genes from 39 A. chevrieri mice were sequenced and they were 1113 bp in length. A total of 26 haplotypes were found and their GenBank Accession numbers are HQ896684–HQ896709. These haplotypes were frequently restricted to individuals from a single sampling locality except the haplotype ZJ2, which was shared by individuals from Zhaojue (ZJ) and Jinyang (JY). The haplotype diversity (h) and nucleotide diversity (π) were 0.978 and 0.026, respectively. The r and SSD tests indicated no significant differences from the population expansion model (SSD=0.01758, p= 0.106; r= 0.00625, p= 0.0556). The mismatch distribution analysis indicated ragged and multimodal distributions (Fig. 3), suggesting relatively constant population size, and this result was also supported by nonsignificant values of Tajima's D test and Fu's Fs test (D= 0.976, p= 0.861; Fs=− 1.947, p= 0.273).
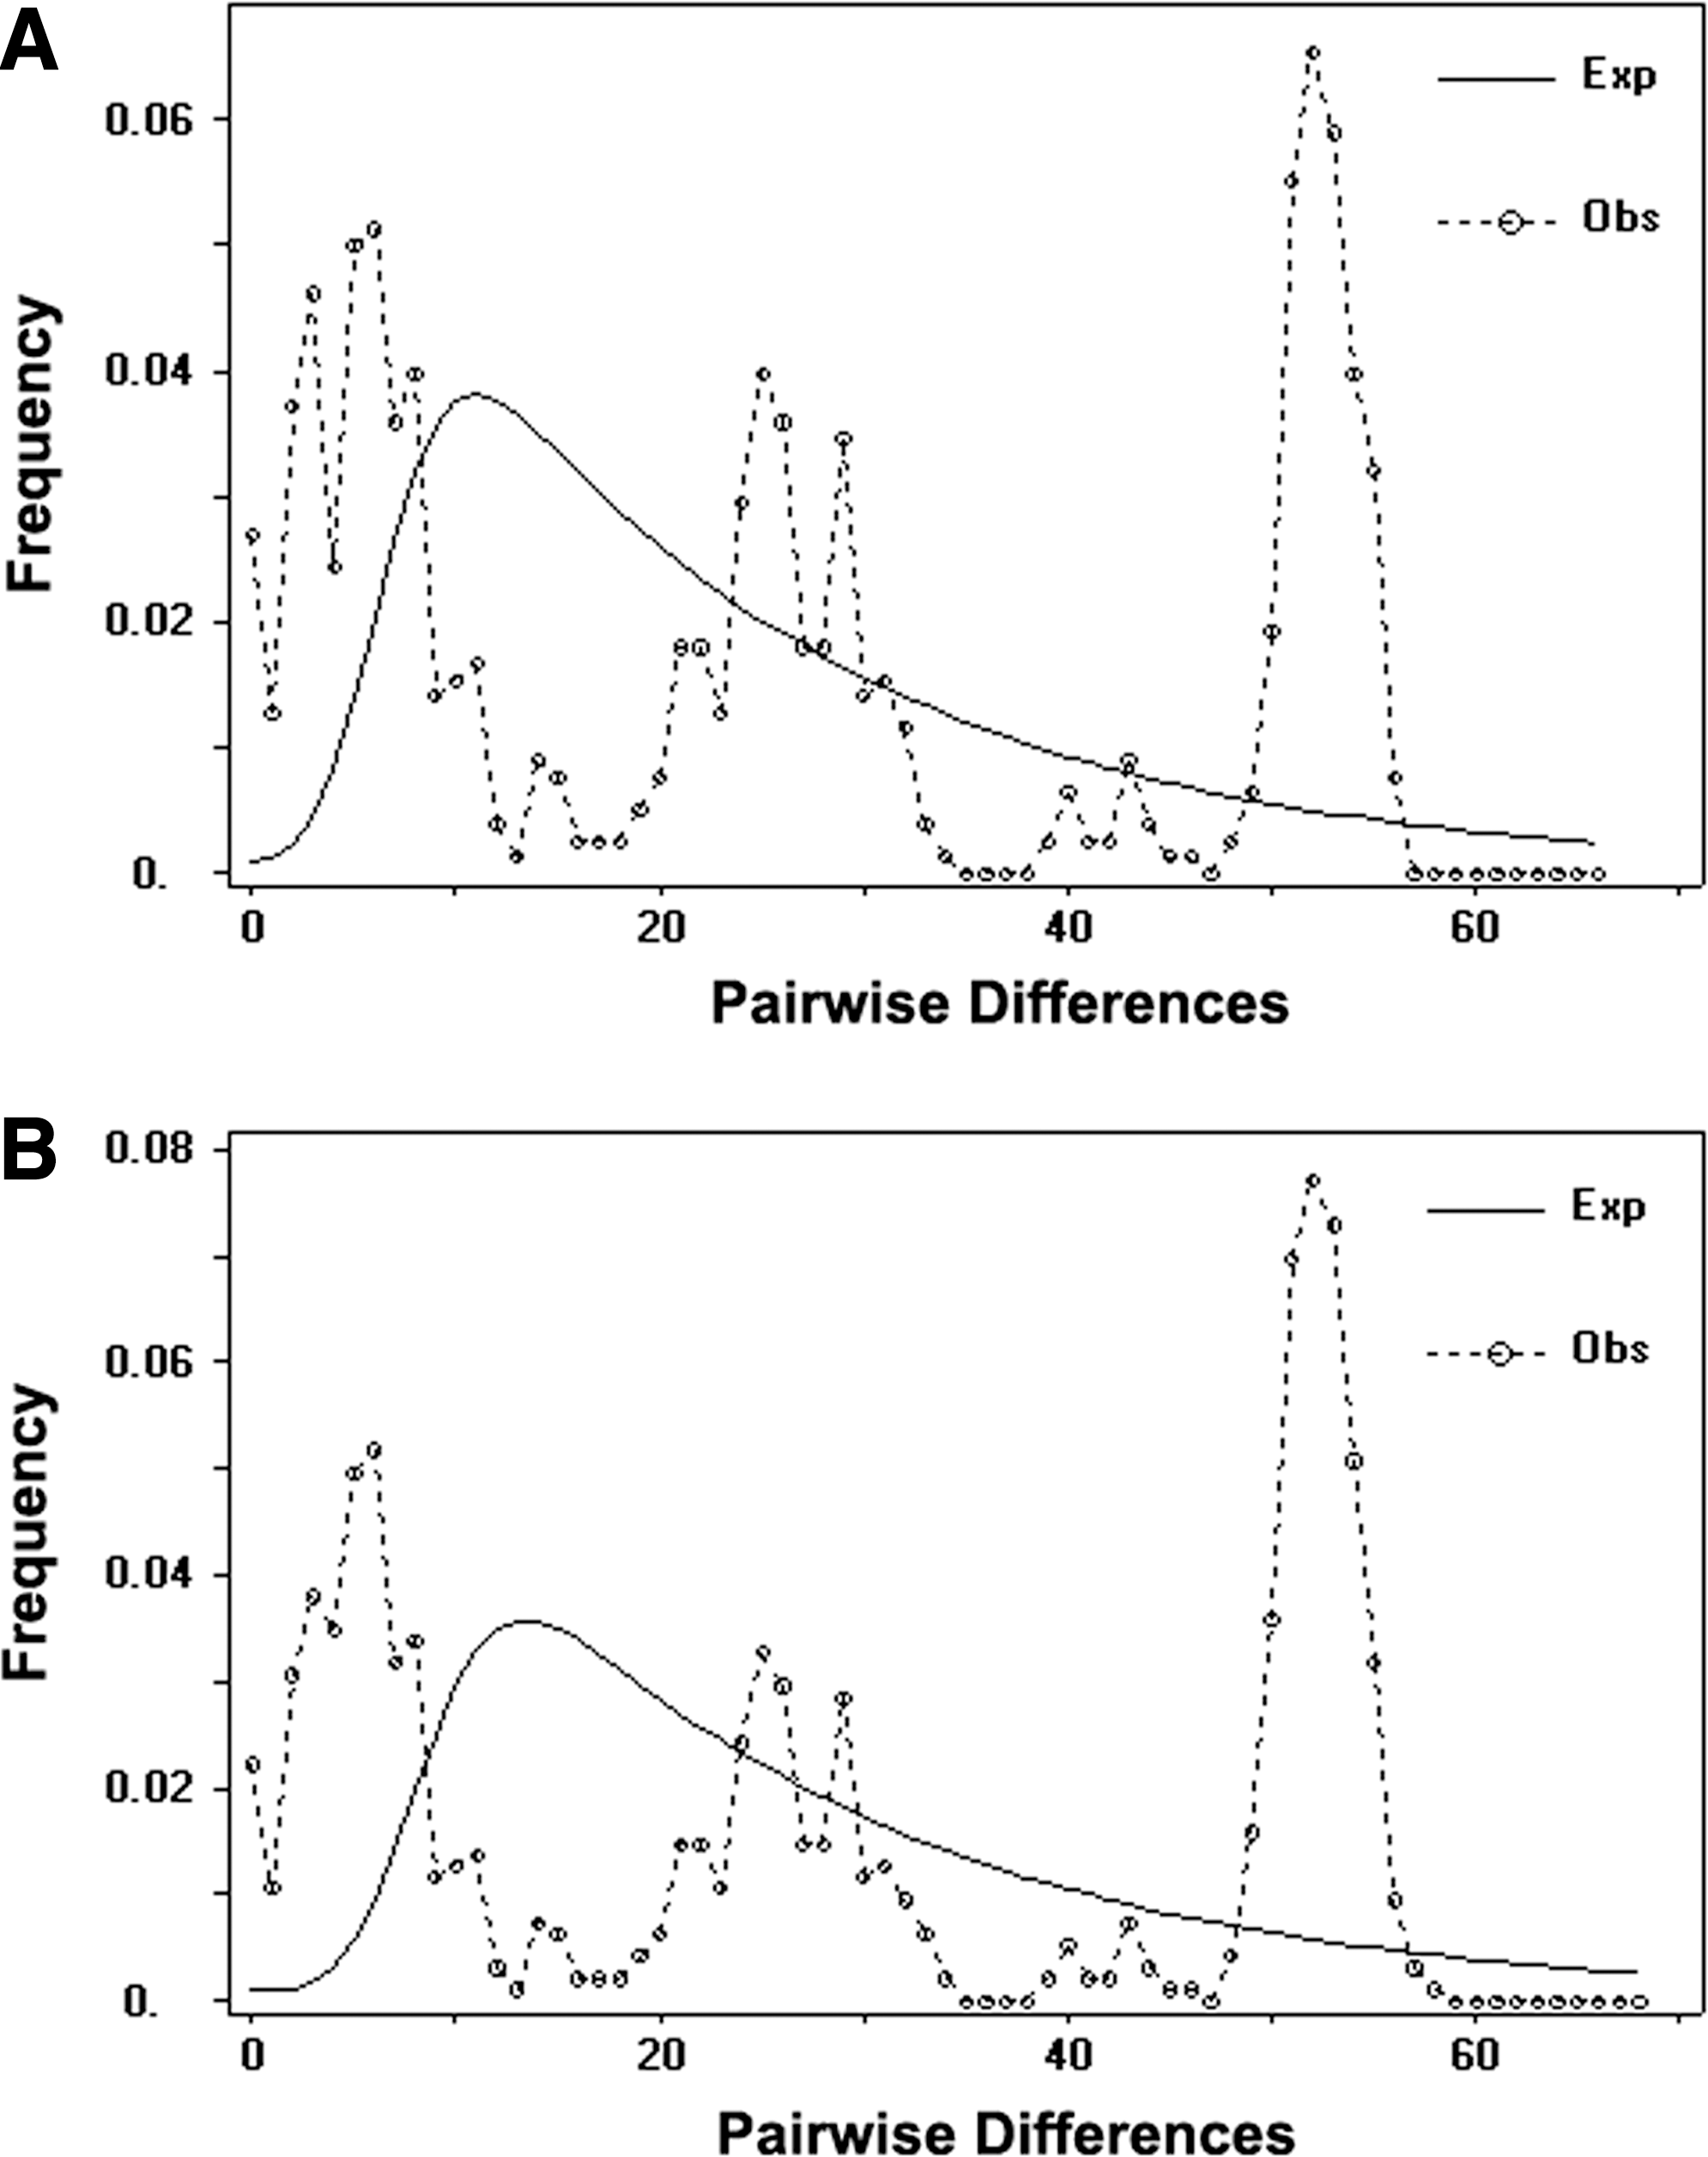
Mismatch distribution of A. chevrieri based on cytochrome b (cyt b). The x-axis represents the numbers of pairwise differences among sequences and the y-axis represents the relative frequencies of pairwise comparisons.
The structure of the BI tree indicated that the haplotypes were clustered into north clade (Qingchuan [QC], Maoxian [MX], Beichuan (BC), and Jiajin Moutain [JM]) and south clade (MN, Jiulong [JL], ZJ, Erlang Moutain [EM], JY, and Kunming [KM]; Fig. 4). This result was also supported by the topology of cyt b haplotype network (Fig. 5). The divergence times of split events were estimated by a relaxed molecular clock approach based on cyt b sequences data. The divergence between north clade and south clade occurred probably in the middle Pleistocene 1.1815 million years ago (Mya), although the range of the 95% HPD interval spanned the period from the early Pleistocene through the middle Pleistocene, between 2.3189 and 0.2737 Mya.
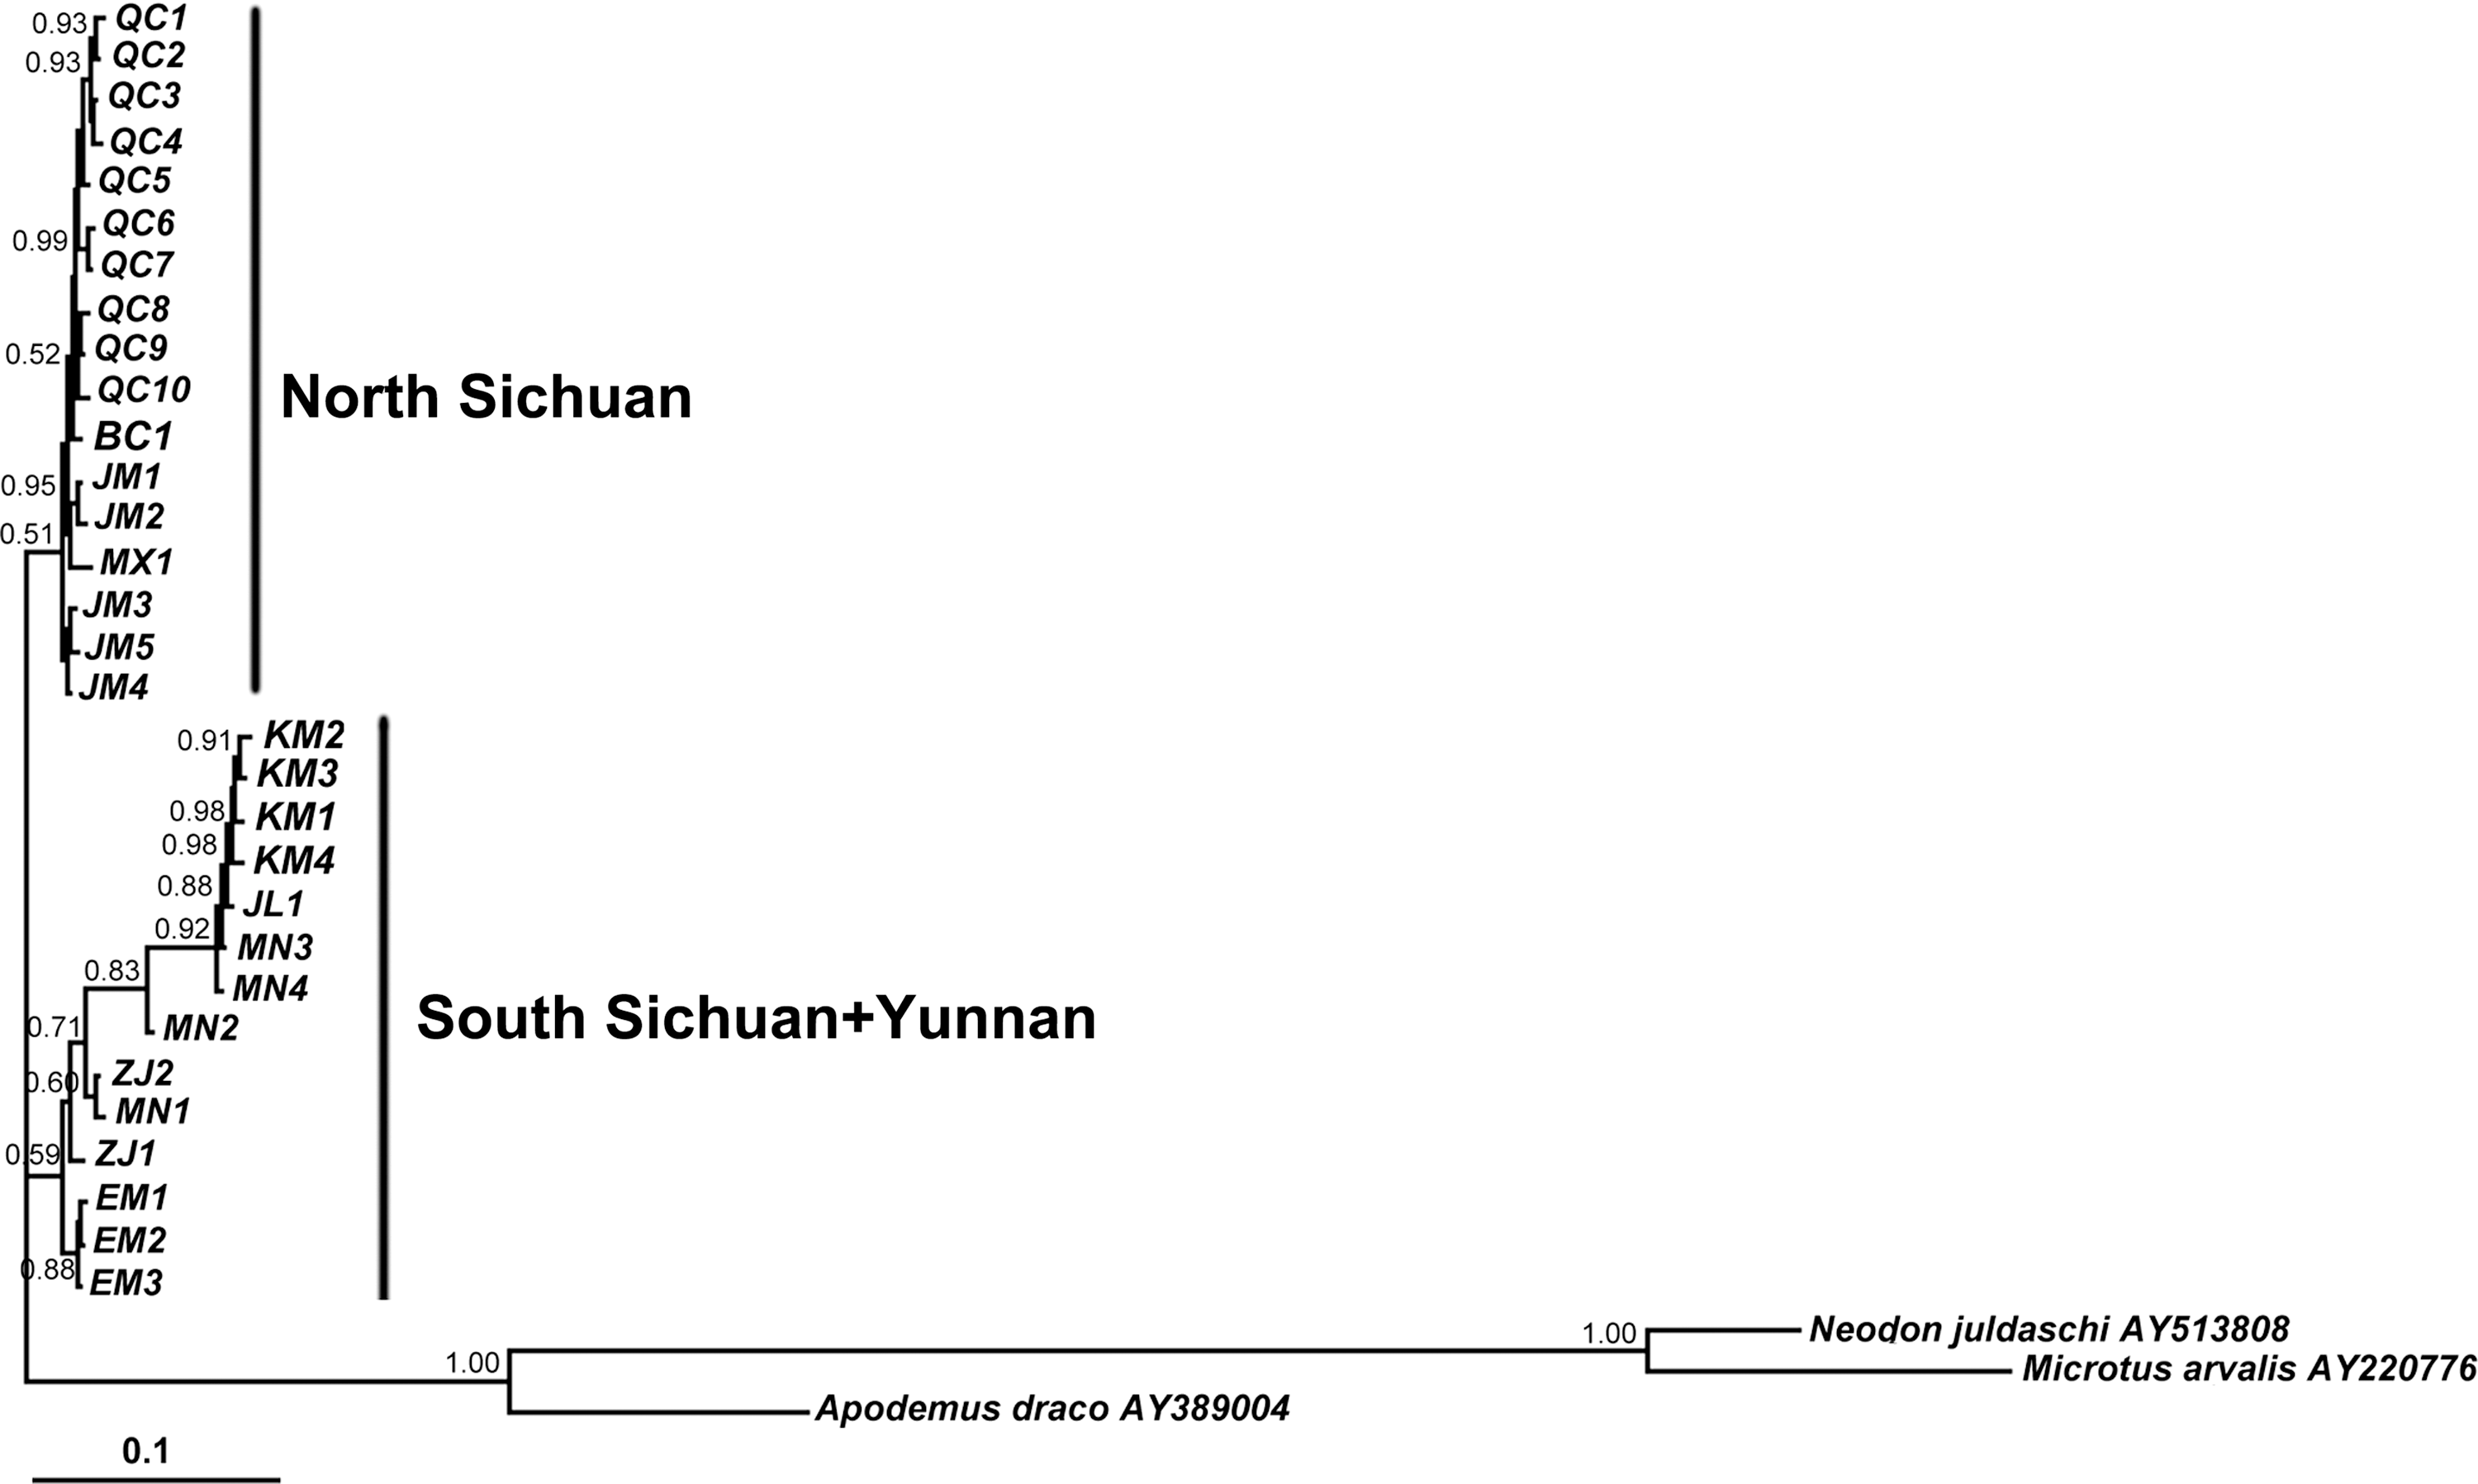
Fifty percent majority rule consensus tree from Bayesian analysis of A. chevrieri based on cyt b haplotypes. Numbers represent node supports inferred from Bayesian posterior probability. Haplotype designations can be found in Table 1.
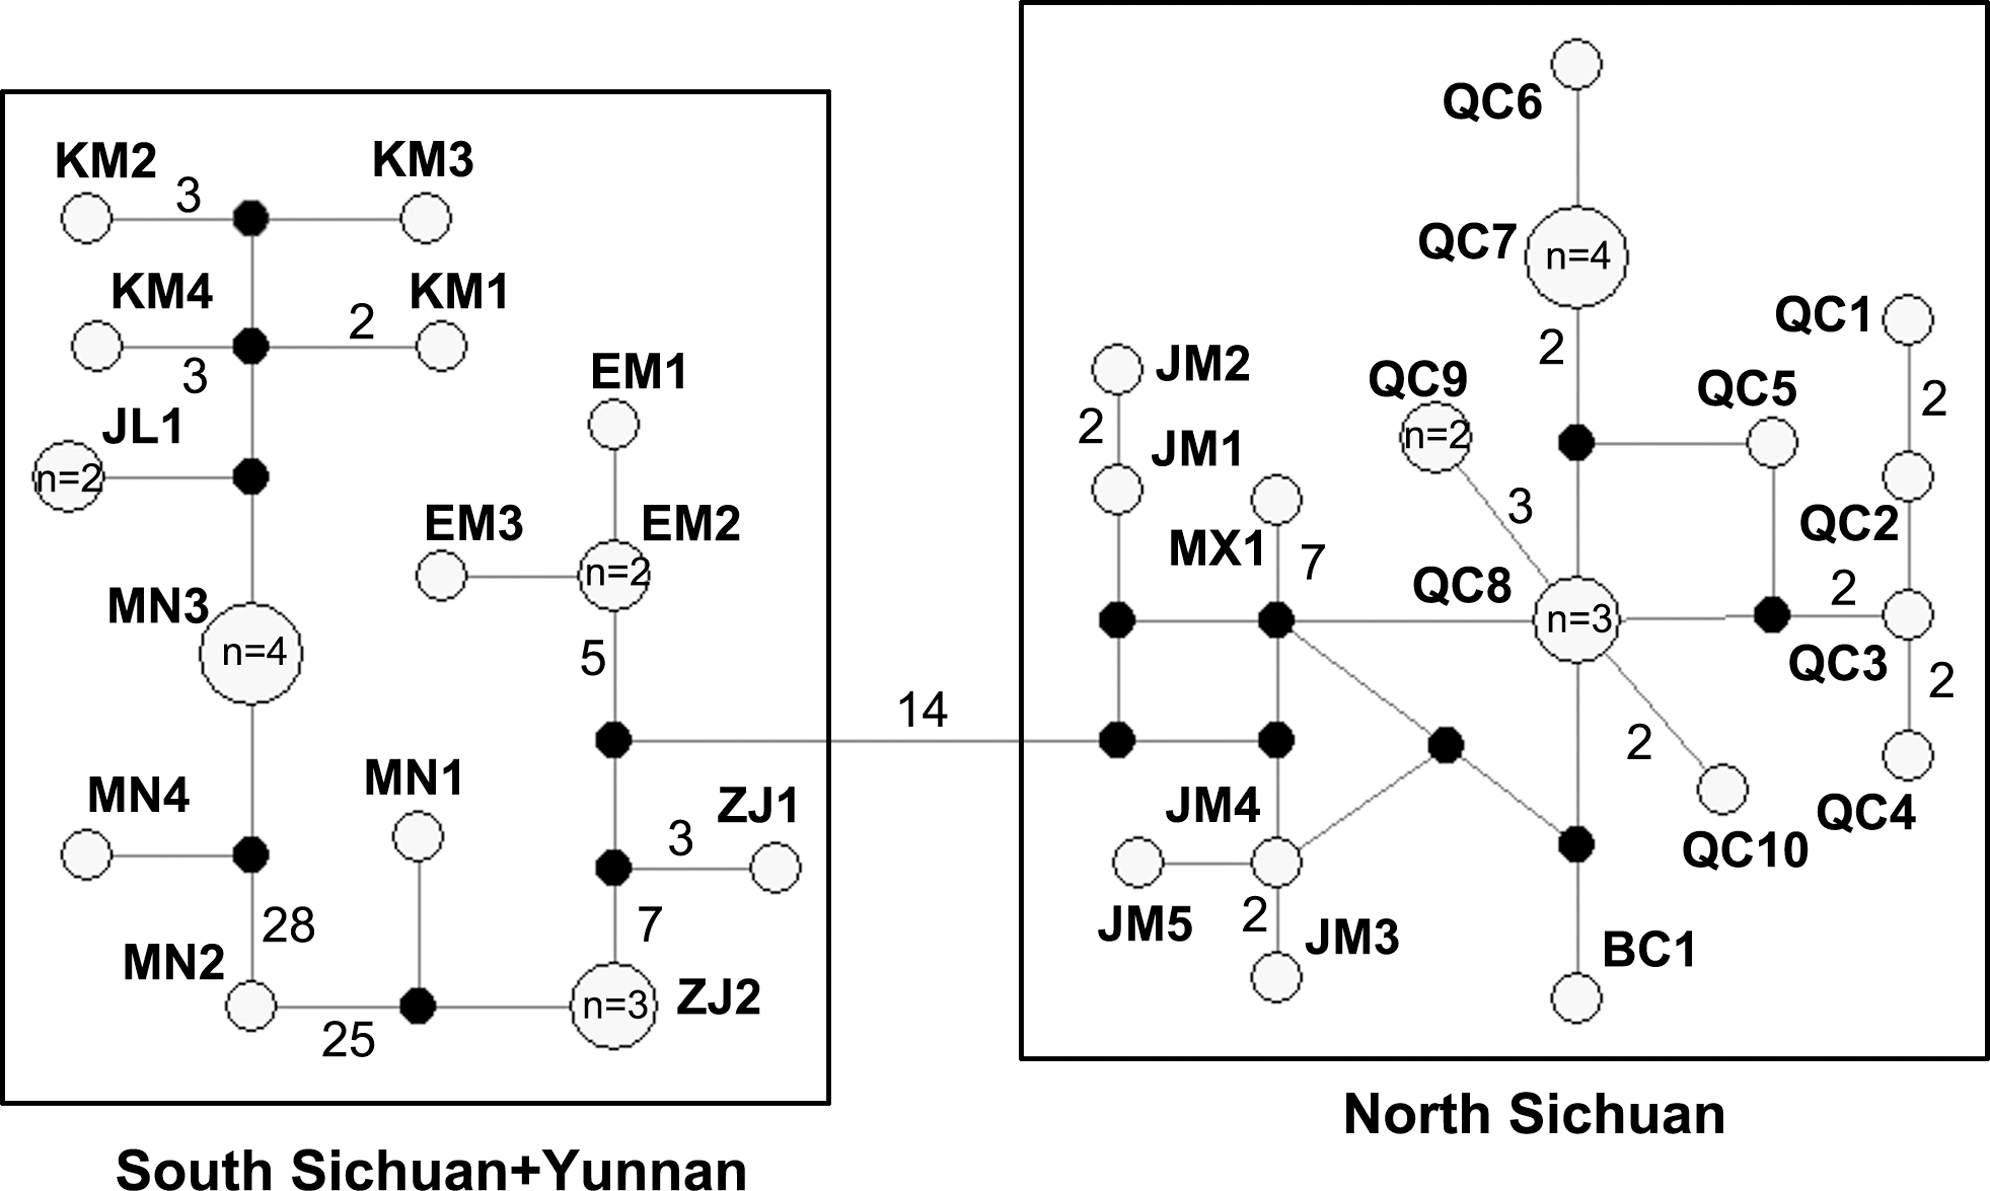
Median-joining network of all cyt b haplotypes found in A. chevrieri. The missing haplotypes in the network are represented by black dots. Circle sizes are proportional to the number of individuals (n) sharing the same haplotypes, and the circles without number indicate only one individual belonging to the haplotype. Each mutation step is shown as a short line connecting neighboring haplotypes, and numbers of mutations between haplotypes are indicated near branches if it is greater than 1. Haplotype designations can be found in Table 1.
Discussion
The Apodemus species are most commonly found in the Temperate Zone of the Palaearctic region and taxonomic studies are varied (Liu et al., 2002; Yang et al., 2002; Liu et al., 2004). According to morphological studies, Apodemus were generally classified into three or four subgenus, but only two for most Chinese researchers (Nowak, 1999; Liu et al., 2002). As to the number of species in Apodemus, there was disagreement (Nowak, 1999; Wilson and Cole, 2000; Musser and Carleton, 2005), which was partially resolved by molecular data (Serizawa et al., 2000; Liu et al., 2004; Sakka et al., 2010). Now, the taxonomic status of A. chevrieri as a valid species is widely accepted (Xia, 1984; Wang, 2003; Liu et al., 2004; Musser and Carleton, 2005). However, the phylogenetic position of Apodemus remains unresolved. Michaux et al. (2005) revealed that Apodemus had the closest relationship to Tokudaia based on the analysis of a nuclear gene (IRBP) and two mitochondrial genes (cyt b and 12S rRNA) sequences. Suzuki et al. (2000) proposed that Mus (cyt b) and Micromys (IRBP) were closer to Tokudaia than Apodemus. The possible sister genus relationships among three murine genera, Apodemus, Mus, and Tokudaia, were not resolved by Liu et al. (2004) using cyt b. Our phylogenetic analysis based on 12 heavy-strand protein-coding genes of mitochondrion indicated that Apodemus had close phylogenetic relationship to Mus and this was consistent with previous two studies by Martin et al. (2000), using cyt b gene sequence, and Steppan et al. (2005), using three nuclear (GHR, RAG1, and AP5) and one mitochondrial (COII and parts of COI and ATPase 8) fragments. Although the concatenated mitochondrion gene sequence might be more potent in phylogenetic inferences of deeper branches (Miya et al., 2003), there were only seven complete murine mitochondrial genomes available in GenBank. We reported the first complete mitochondrial sequence in genus Apodemus, although there were about 20 mitogenomes sequenced for small rodents. Thus, the complete mitogenome information of A. chevrieri is valuable for murine phylogenetic study in the future.
The mountains of Southwest China is one of the 34 biodiversity hotspots in the world, characterized by extremely complex topography, dramatic variations in climate, and vegetation types and these resulted in a wide array of habitats for animals and plants (Myers et al., 2000). A lot of rodent species were recorded in this area and it was recognized as the radiation center of the genus Apodemus (Xia, 1984; Liu et al., 2004). Our sampling locations were situated in the eastern margin of the Hengduan Mountains. During the Quaternary period, although the ice sheet might have been permanent in higher altitudes and central regions of the Tibetan Plateau, the Hengduan Mountain region was not completely covered by ice (Zeng et al., 1994; Zheng et al., 2002). Many ice-free areas in mountain valleys, rift basins, and lower altitudes formed a network of refugia. Species in the refugia had no loss of allelic diversity and thus maintained high level of genetic diversity and stable population sizes (Chen et al., 2010; Sakka et al., 2010; Fan et al., 2011). Thus, stable population sizes and extremely high genetic diversities of A. chevrieri (h= 0.978, π=2.6%) were detected and similar results were also obtained in other rodent species collected in this hotspot area: Niviventer excelsior (Chen et al., 2010), Neodon irene, A. latronum (Fan et al., 2011), and four Apodemus speices (Sakka et al., 2010). Our result, together with previous studies, suggested a common genetic feature (high genetic diversities and stable population sizes) for rodent species in this unique area. Additionally, A. chevrieri was found in a variety of habitats including paddy fields, shrub lands, forest, and meadow. Therefore, the high genetic diversity may reflect a rapidly adaptive divergence to its variation of living habitats (Hu et al., 1984; Luo et al., 2000; Fan et al., 2009). It is possible that the complex land conditions of this area played a substantial role in initiating differentiation, maintenance, and enhancement of preexisting genetic structures (Song et al., 2009; Huang et al., 2010; Fan et al., 2011).
Deep phylogenetic splits were detected in A. chevrieri, although having slightly low posterior probabilities in some clades. All 31 haplotypes fell into two evolutionary clades, north and south clades (Figs. 4, 5). Our sampling mainly focused on the eastern margin of the Hengduan Mountains, which are situated in the southeastern Tibetan Plateau. The extremely complex topography produced not only habitat diversity but also some geographic barriers. The altitude of A. chevrieri habitat is about 1000–2400 m (Yang et al., 2010). Thus, mountains might have played an important role in genetic differentiation of A. chevrieri in this region. Consequently, in the present study, two evolutionary clades, one comprised haplotypes from Erlang Mountain and its south areas and the other one contained haplotypes from Jiajin Mountain (JM) and its north areas, were observed (Fig. 4). JM stretches approximately from west to east and numerous high mountains and ravines are in the area. Our sampling locations in JM were on the southern side (Fig. 1). All the east, west, and north of the sampling locations are high mountains above 4000 m, and only the south is a valley, but bewilderingly, haplotypes from the southern side of JM were clustered together with haplotypes from north areas of JM, MX, and QC (Fig. 4). It seemed that EM was the demarcation line in the south-north genetic differentiation of A. chevrieri. This was in accordance with the results of fauna investigation for rodents in JM (Tu, 2010) and EM (Sun, 2007). The proportion of Palearctic rodents on the north side of JM (45%) was apparently higher than that on the south side of JM (15.15%), and the latter was also higher than that on the north side of EM (11.76%), whereas the Palearctic rodents were not found on the south side of EM (Sun, 2007; Tu, 2010). In our study, the divergence of south clade and north clade of A. chevrieri probably occurred in the middle Pleistocene (1.1815 Mya). The Tibetan Plateau and its adjacent regions had experienced intensive uplift events due to the Qingzang Movement (3.6–1.7 Mya) and Kun-Huang Movement during the Pleistocene (1.2–0.6 Mya) (Shi et al., 1998; Zhang et al., 2000; An et al., 2001). Enhanced uplift events also took place in Hengduan Mountains regions, such as Shaluli Shan (after 0.571 Mya) (Xu et al., 2005) and Gongga Mountain Region (0.277 Mya) (Su et al., 2002). Thus, the elevation and geological configuration of JM in the middle Pleistocene might be different from that of the present, which resulted in the clustering pattern of the north clade, but experienced great changes during the late Pleistocene. However, more biologic and geological data are needed to confirm this speculation. In the south clade, haplotypes from JL, MN, ZJ, and KM did not form monophyletic groups according to their geographical origins. If considering the geographic distance, JL, MN, and ZJ are more adjacent. Interestingly, four haplotypes from KM clustered with one haplotype from JL and two haplotypes from MN, which are more remote to KM than to ZJ (Fig. 4). This implied that the postglacial recolonization in these south regions might have been multidirectional. Another interesting phenomenon was that rivers played a weak role in shaping the genetic structure of A. chevrieri. There are four major rivers, Mingjiang River, Dadu River, Yalong River, and Jinsha River, in our study areas, separating sampling locations, but haplotypes did not fall into independent monophyletic groups according to the major river (Figs. 4 and 5). Similar results for N. excelsior, N. irene, and A. latronum were obtained by Chen et al. (2010) and Fan et al. (2011). Frequent cutting of rivers resulting from geological events during the Pleistocene might have contributed to this. If it is a common feature of rodents in Hengduan Mountains region, more studies are needed in the future to determine this. In addition, the distribution of A. chevrieri is more extensive, and our results only demonstrated the genetic features of A. chevrieri in the eastern margin of the Hengduan Mountains. To completely understand the genetic structure of this species, an extensive specimen collection is needed.
Footnotes
Acknowledgment
This research was funded by the National Basic Research Program of China (973 Project: 2007 CB109106 and 2007 CB411605).