
Abstract
In this work, multispectroscopic atomic force microscopy and molecular modeling [ONIOM 2(B3LYP/6-31++G(d,p): Universal Force Field (UFF)) level] techniques were used to study the interaction between Calf-Thymus-DNA (CT-DNA) and pyriproxyfen (PYR) insecticide. The binding constant of PYR with double-strand deoxyribonucleic acid (ds-DNA) was obtained by ultraviolet–visible absorbance spectroscopy as 2.8×10⁴ at 20°C. Thermodynamic parameters, that is, ΔH, ΔS°, and ΔG, were −53.82 kJ mol−1, 96.11 J mol−1, and −82.46 KJ mol−1, respectively. Thermal denaturation study of DNA with PYR revealed the ΔT m of 3.0 and 6.0°C at r i=0.5 and 1.0, respectively. The Fourier transform infrared study showed a major interaction of PYR with G-C and A-T base pairs and a minor perturbation of the backbone PO2 group. Further, PYR induces detectable changes in the circular dichroism spectrum of CT-DNA. In fluorimetric studies, the dynamic enhancement constants (k D) and bimolecular enhancement constant (k B) were calculated, which showed that the fluorescence enhancement was initiated by a static process in the ground state. The hybrid of quantum mechanical/molecular mechanics theoretical calculations revealed that the interaction is base sequence dependent, and PYR interacts more with DNA via the AT base sequence. From the data we concluded that PYR may interact with ds-DNA via two modes: intercalating and outside groove binding.
Introduction
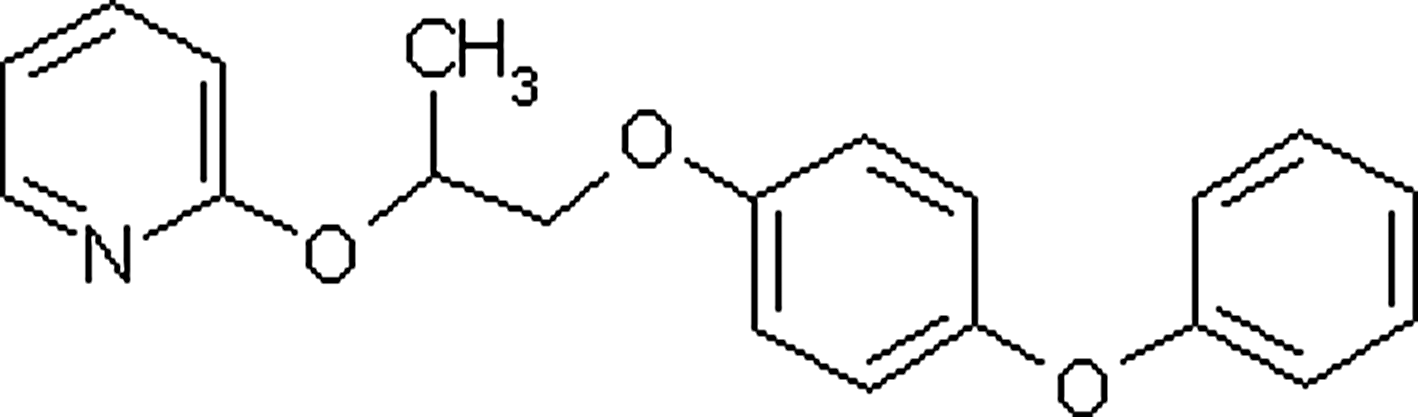
The structure of PYR. PYR, pyriproxyfen.
Materials and Methods
Highly polymerized calf-thymus double-strand deoxyribonucleic acid (ds-DNA) and PYR with high purity were purchased from Supelco (Sigma-Aldrich, Bellefonte, PA) and used as received. All other reagents were of the highest commercial grade and were used without further purification. Deionized double-distilled water was used throughout the experiments. The ds-DNA was dissolved in Tris-HCl buffer and was dialyzed against the same buffer overnight (Kashanian et al., 2007). Solutions of ds-DNA gave ratios of UV absorbance at 260 and 280 nm above 1.8, indicating that ds-DNA is sufficiently free of protein. ds-DNA concentration per nucleotide was determined by UV–vis spectrophotometry using the molar absorption coefficient of 6600 M−1 at 258 nm (Kashanian et al., 2007). The UV–vis spectra were recorded by means of a Shimadzu (UV 2450) spectrophotometer equipped with a temperature controller CPS 240A (±0.2°C). All fluorescence measurements were carried out with a Beckman spectrofluorometer (LS 45). Maximum excitation wavelength used was 450 nm. CD measurements were recorded on a JASCO (J-810) spectropolarimeter. The spectra were recorded by progressive addition of PYR to the pure DNA solution. The FTIR measurement was carried out using Shimadzu (IR Prestige-21) on a solid AgCl window. The pH values of the solutions were adjusted by employing a Metrohm model 827 pH meter using a combined glass electrode. The AFM imaging of DNA and DNA-PYR complex was performed in phase contrast and dynamic force operating mode and noncontact Mounted cantilever (Nanosurf mobile S. Switzerland) using high frequency (170 kHz) by silicon cantilevers with thickness 7 μm, length 225 μm, and width 38 μm. Images were treated using the software Installation Instructions for Nanosurf Mobile S version 1.8.
Mechanical quantum calculations
All calculations were performed with Gaussian 2003 program (Frisch et al., 2003). The sequence of two base pairs of the chosen oligonucleotides, ATAT and GCGC, was constructed in the double-helix B-DNA conformation by the NUCLEIC routine of the TINKER molecular design program package. The corresponding relative energies were calculated by two-layer Our N-layered Integrated molecular Orbital+molecular Mechanics (ONIOM) methods using Density Functional Theory (DFT) and B3LYP as high level and Universal Force Field (UFF) as low level. The geometry for PYR was fully optimized by DFT and B3LYP levels using the 6-31++G(d,p) basis set. In the ONIOM calculations, the complex geometries were divided into two layers. The target level (AT and/or GC base pairs) as well as method used for the high-level layer was DFT/6-31++G(d,p) and the low-level layer (the other structure of DNA) was treated with UFF.
Results and Discussions
UV–vis spectroscopic studies and thermodynamic measurements
UV–vis spectra of DNA and their mixtures with PYR (r
i=[PYR]/[DNA]=0.0, 0.1, 0.2, 0.3, 0.4, 0.5, 0.6, 0.7, 0.8, 0.9, 1.0) at 25°C were measured and are presented in Figure 2. The minimum absorbance of PYR at 260 nm has been automatically removed in a double-beam UV–vis instrument. DNA has an absorption peak at 260 nm. However, after DNA and PYR were mixed, a clear hyperchromic and blue shift (∼4 nm) in the DNA peak at 260 nm was observed. The increase of absorbance is due to the changes in DNA structure when PYR was added to DNA solution (Mukherjea et al., 2005). The same hyperchromic shifts have been already reported for DNA interaction with 2,4-D or fenitrothion (Ahmadi and Bakhshandeh, 2009; Ahmadi and Jafari, 2011). We believe that this weak increase of absorption of ds-DNA without any isobestic point may be due to the weak intercalation of PYR in the dsDNA or changes of DNA double helixes (Ahmadi and Bakhshandeh, 2009; Ahmadi and Jafari, 2011). The peak position of DNA moved toward shorter wavelengths (hypsochromic effect) with increasing PYR concentration (Figure 2). Based on these variations, we also concluded that PYR may induce a change in the helical conformation of DNA structure and may interact with base pairs via weak intercalation. The binding constant of PYR-DNA was calculated with UV–vis spectroscopy as follows: the absorbance measurement was performed at pH 7.3 by keeping the concentration of DNA constant (5.0×10⁻⁵ M), while varying the concentration of PYR (0.0–5.0×10⁻⁵ M). To calculate the PYR-DNA binding constant, the data are treated according to the following equations:
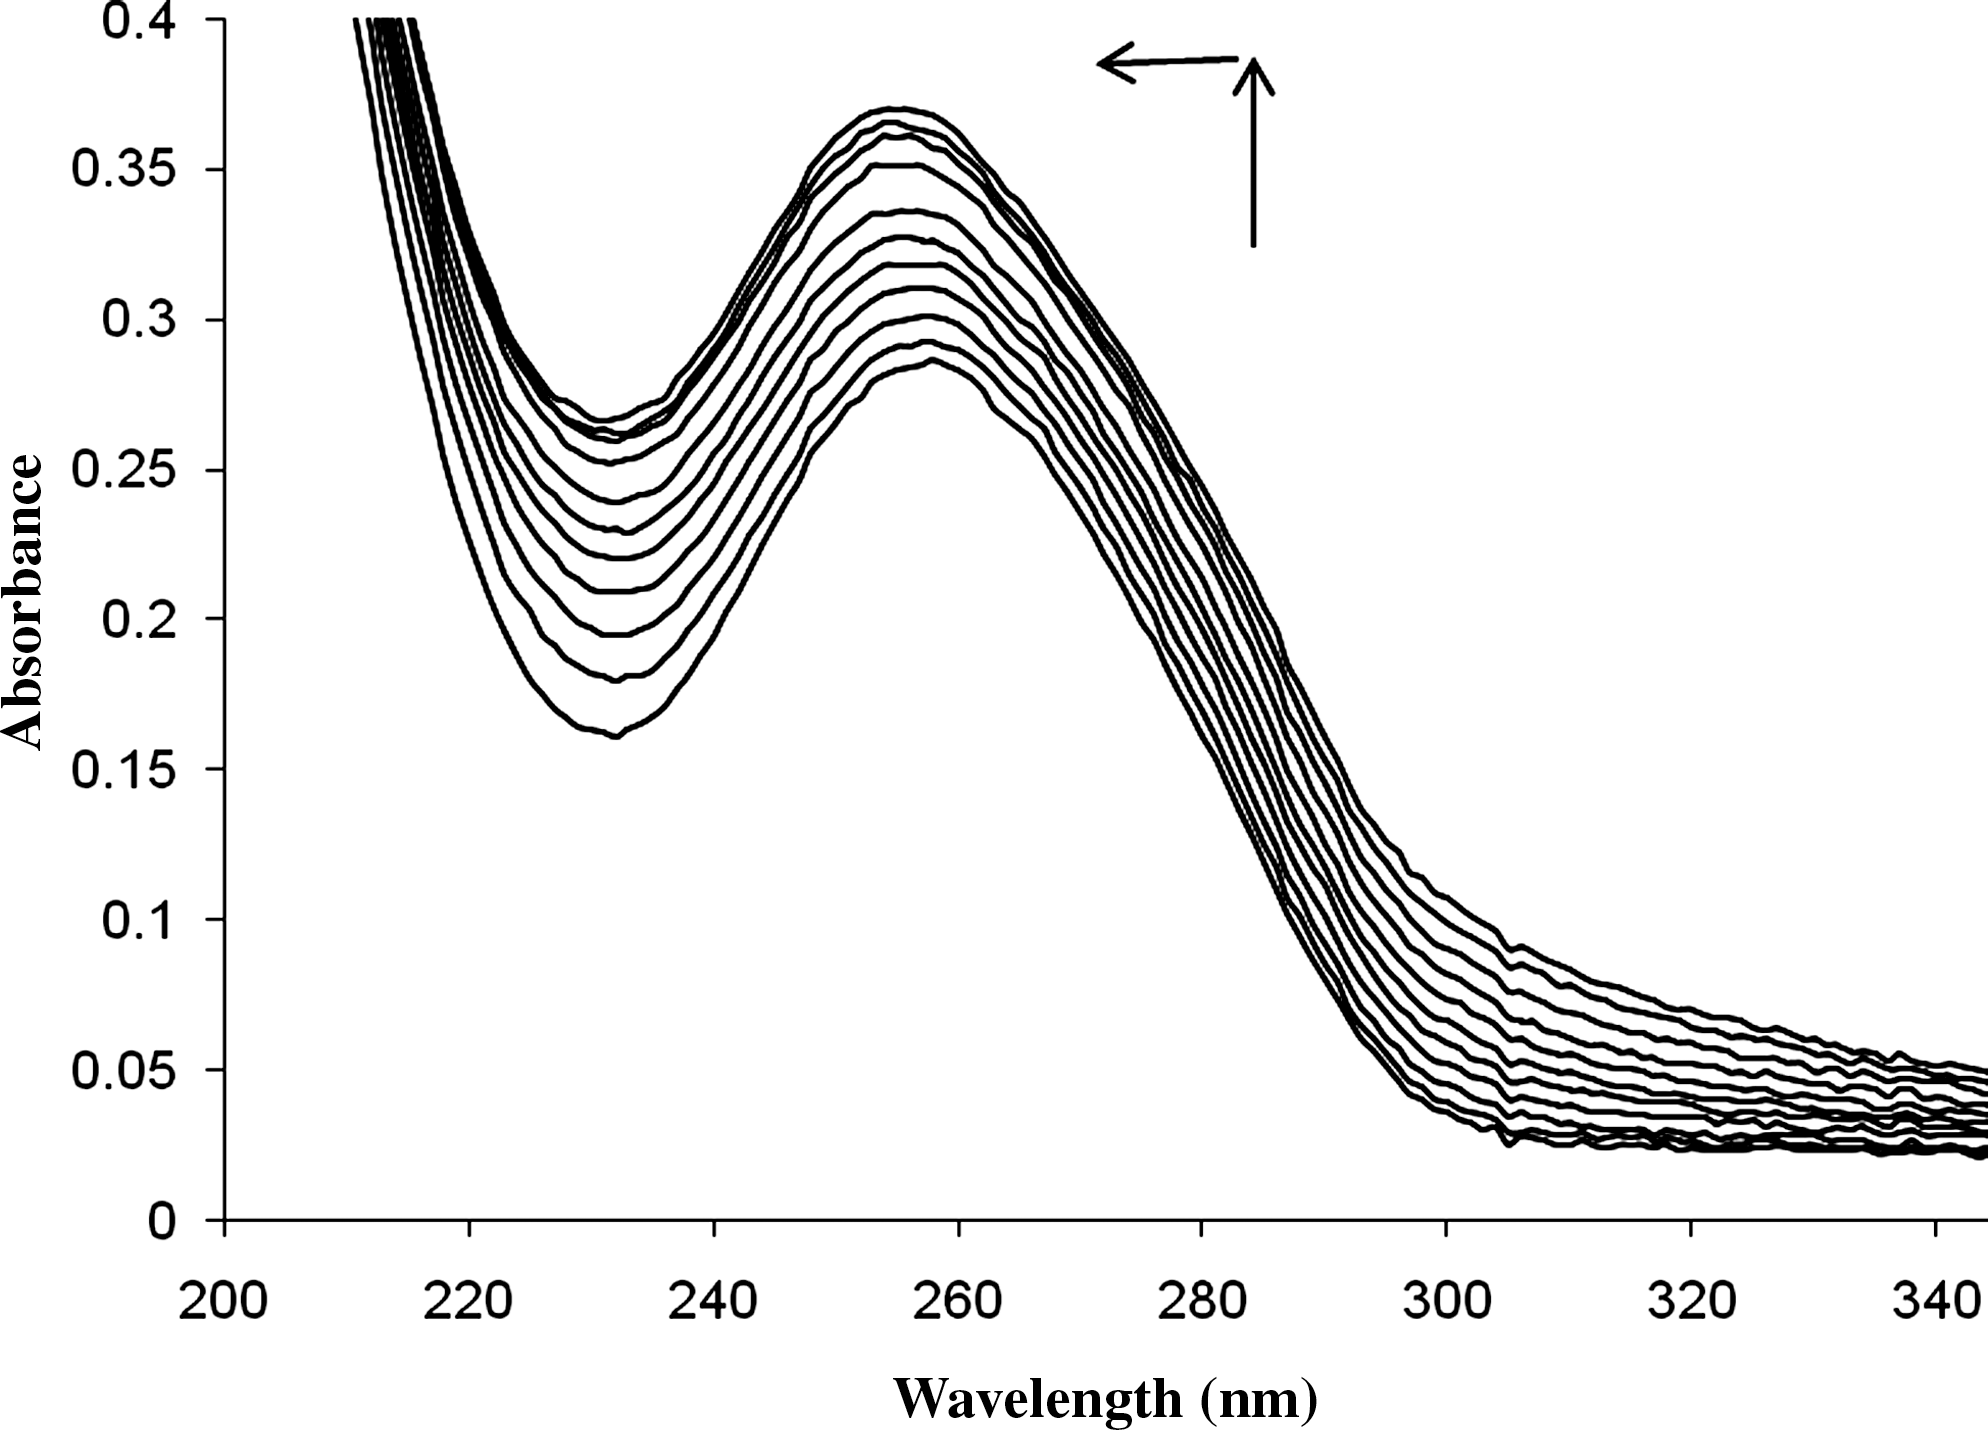
Absorption spectrum of 5.0×10⁻⁵ M of ds-DNA in absence and presence of PYR with r i=[PYR]/[DNA]=0.0, 0.1, 0.2, 0.3, 0.4, 0.5, 0.6, 0.7, 0.8, 0.9, and 1.0 at 25°C. ds-DNA, double-strand deoxyribonucleic acid.
For weak binding affinities, the data were treated using linear reciprocal plots based on equation (3) (Ahmadi and Jafari, 2011):
where A 0 is the absorbance of DNA at 260 nm in the absence of PYR, A ∞ is the final absorbance of the PYR-DNA, and A is the recorded absorbance at different PYR concentrations. The double reciprocal plot of 1/(A – A 0) versus 1/[PYR] is linear and the binding constant (K b) can be calculated from the ratio of the intercept to the slope (Ahmadi and Jafari, 2011). The binding constants for the PYR-DNA complex at different temperatures of 283, 288, 293, 298, and 310°K were measured (Fig. 3). The obtained K b value at 25°C is lower than that observed for a typical classical intercalator, EB-DNA (1.4×10⁶ in 40 mM NaCl+25 mM Tris–HCl) (Waring, 1965; Lepecq and Paoletti, 1967), whereas that value is more than that of nonintercalators. This indicates that DNA-PYR has an affinity less than the classical intercalator EB (Kashanian et al., 2007) but more than nonintercalators. In previous works, the K b of DNA with several pesticides at 25°C, such as fenitrithion (1.9×10⁴) (Ahmadi and Jafari, 2011), 2-imidazolidinethione (1.4×10³) (Ahmadi et al., 2010), 2,4-D (3.5×10³ and 5.0×10³) (Ahmadi and Bakhshandeh, 2009), clodinafop-propargyl (5.6×10³) (Askari et al., 2008), diazinon (1.6×10⁴) (Gholivand et al., 2008), and aminocarb (7.2×10³) (Zhang et al., 2010), have been reported. These carcinogenic compounds have a significant binding affinity to DNA in the range of 3.5×10³ to 1.6×10⁴. As the interaction of PYR with DNA leads to changes in the thermodynamic stability and structural properties of DNA, the thermodynamic parameters of interaction, that is, ΔH, ΔS, and ΔG, were measured to elicit the mode of interaction. The thermodynamic parameters were calculated using the van't Hoff equation by plotting log K b versus 1000/T. The positive slope in the van't Hoff plot (Fig. 4) indicates that the complexation process is exothermic. The ΔH, ΔS, and ΔG values of the PYR-DNA complex were −53.99 kJ mol−1, 106.7 J mol−1, and −5.79 KJ mol−1, respectively. Based on thermodynamic data, the complex formation was enthalpy and entropy favored. The positive ΔS° may be due to the release of water from the shell of DNA and PYR (Grunwald and Steel 1995). Hans and Becker (1997) demonstrated that when a small molecule transferred from a polar to a nonpolar environment, hydrophobic interactions caused ΔH>0 and ΔS>0 accompanied by a negative ΔG. For large molecules, however, ΔH for transfer is negative because of the disruption of hydrogen bonds in the formation of the cavity for the solute. ΔS should be positive (Hans and Becker, 1997). If we consider PYR a “large” molecule, the negative enthalpy may be due to the intercalation to the DNA. Positive entropy change is frequently regarded as evidence for a hydrophobic interaction, because water molecules that are arranged in an orderly fashion around the PYR and DNA were released and the negative ΔH value observed may be due to the intercalation. These thermodynamic data are similar to previous reports for intercalators and may confirm the intercalating mode.
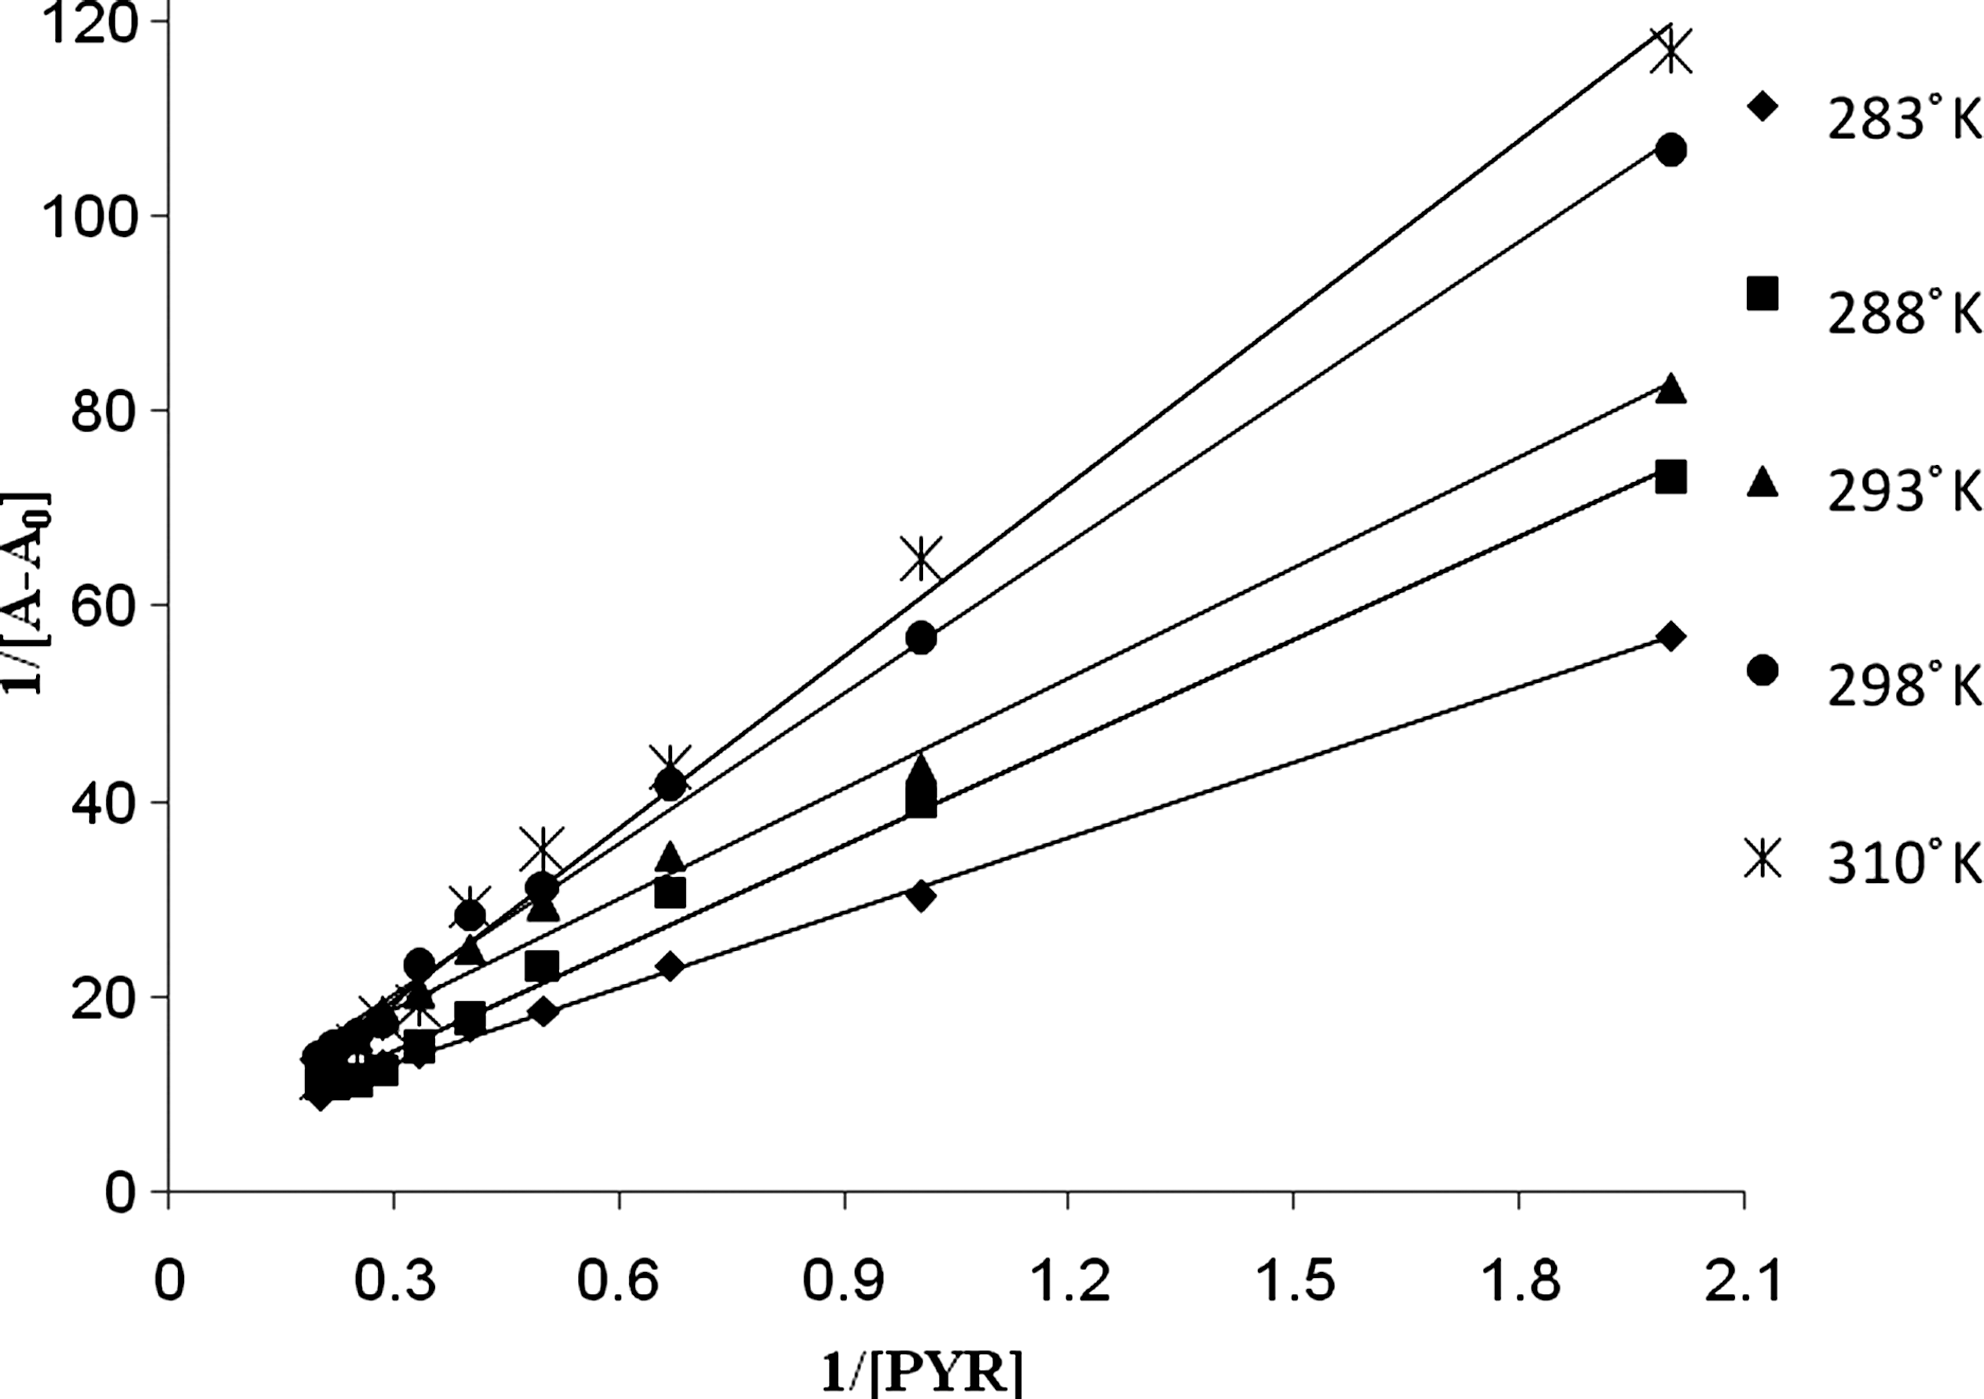
Plot of 1/(A−A 0) versus 1/[PYR] for PYR and ds-DNA complex at different temperatures (283, 288, 293, 298, and 310°K), where A 0 is the initial absorbance of ds-DNA (260 nm) and A is the recorded absorbance (260 nm) at different PYR concentrations (0.0–5×10⁻⁵ M), with constant ds-DNA concentration of 5.0×10⁻⁵ M at pH 7.3.

van't Hoff plot for the PYR-DNA complex.
DNA thermal denaturation
To further characterize the PYR-DNA complex, thermal denaturation of calf thymus DNA in the absence and presence of PYR was investigated (Fig. 5). PYR-DNA stoichiometries investigated were r i=0.0, 0.5, and 1.0. When the solution temperature increases, the double strand of DNA gradually dissociates into single strands; T m is defined as the temperature at which half of the total base pairs are unpaired. The DNA melting temperature (T m) is strictly related to the stability of the double helix, and interaction of PYR with DNA may alter T m, by stabilizing or destabilizing the final complex. Moreover, it is possible to obtain information of interaction strength. The intercalation of natural or synthesized compounds results in the stabilization of the DNA double helix, because of the stabilizing stacking interactions, followed by a considerable increase in T m of DNA. The T m of DNA (5.0×10⁻⁵ M) in Tris-HCl buffer (72±0.5°C) increases to about 3.0 and 6.0°C, at r i=0.5 and 1.0, respectively. These results indicated that PYR stabilizes the native DNA conformation.
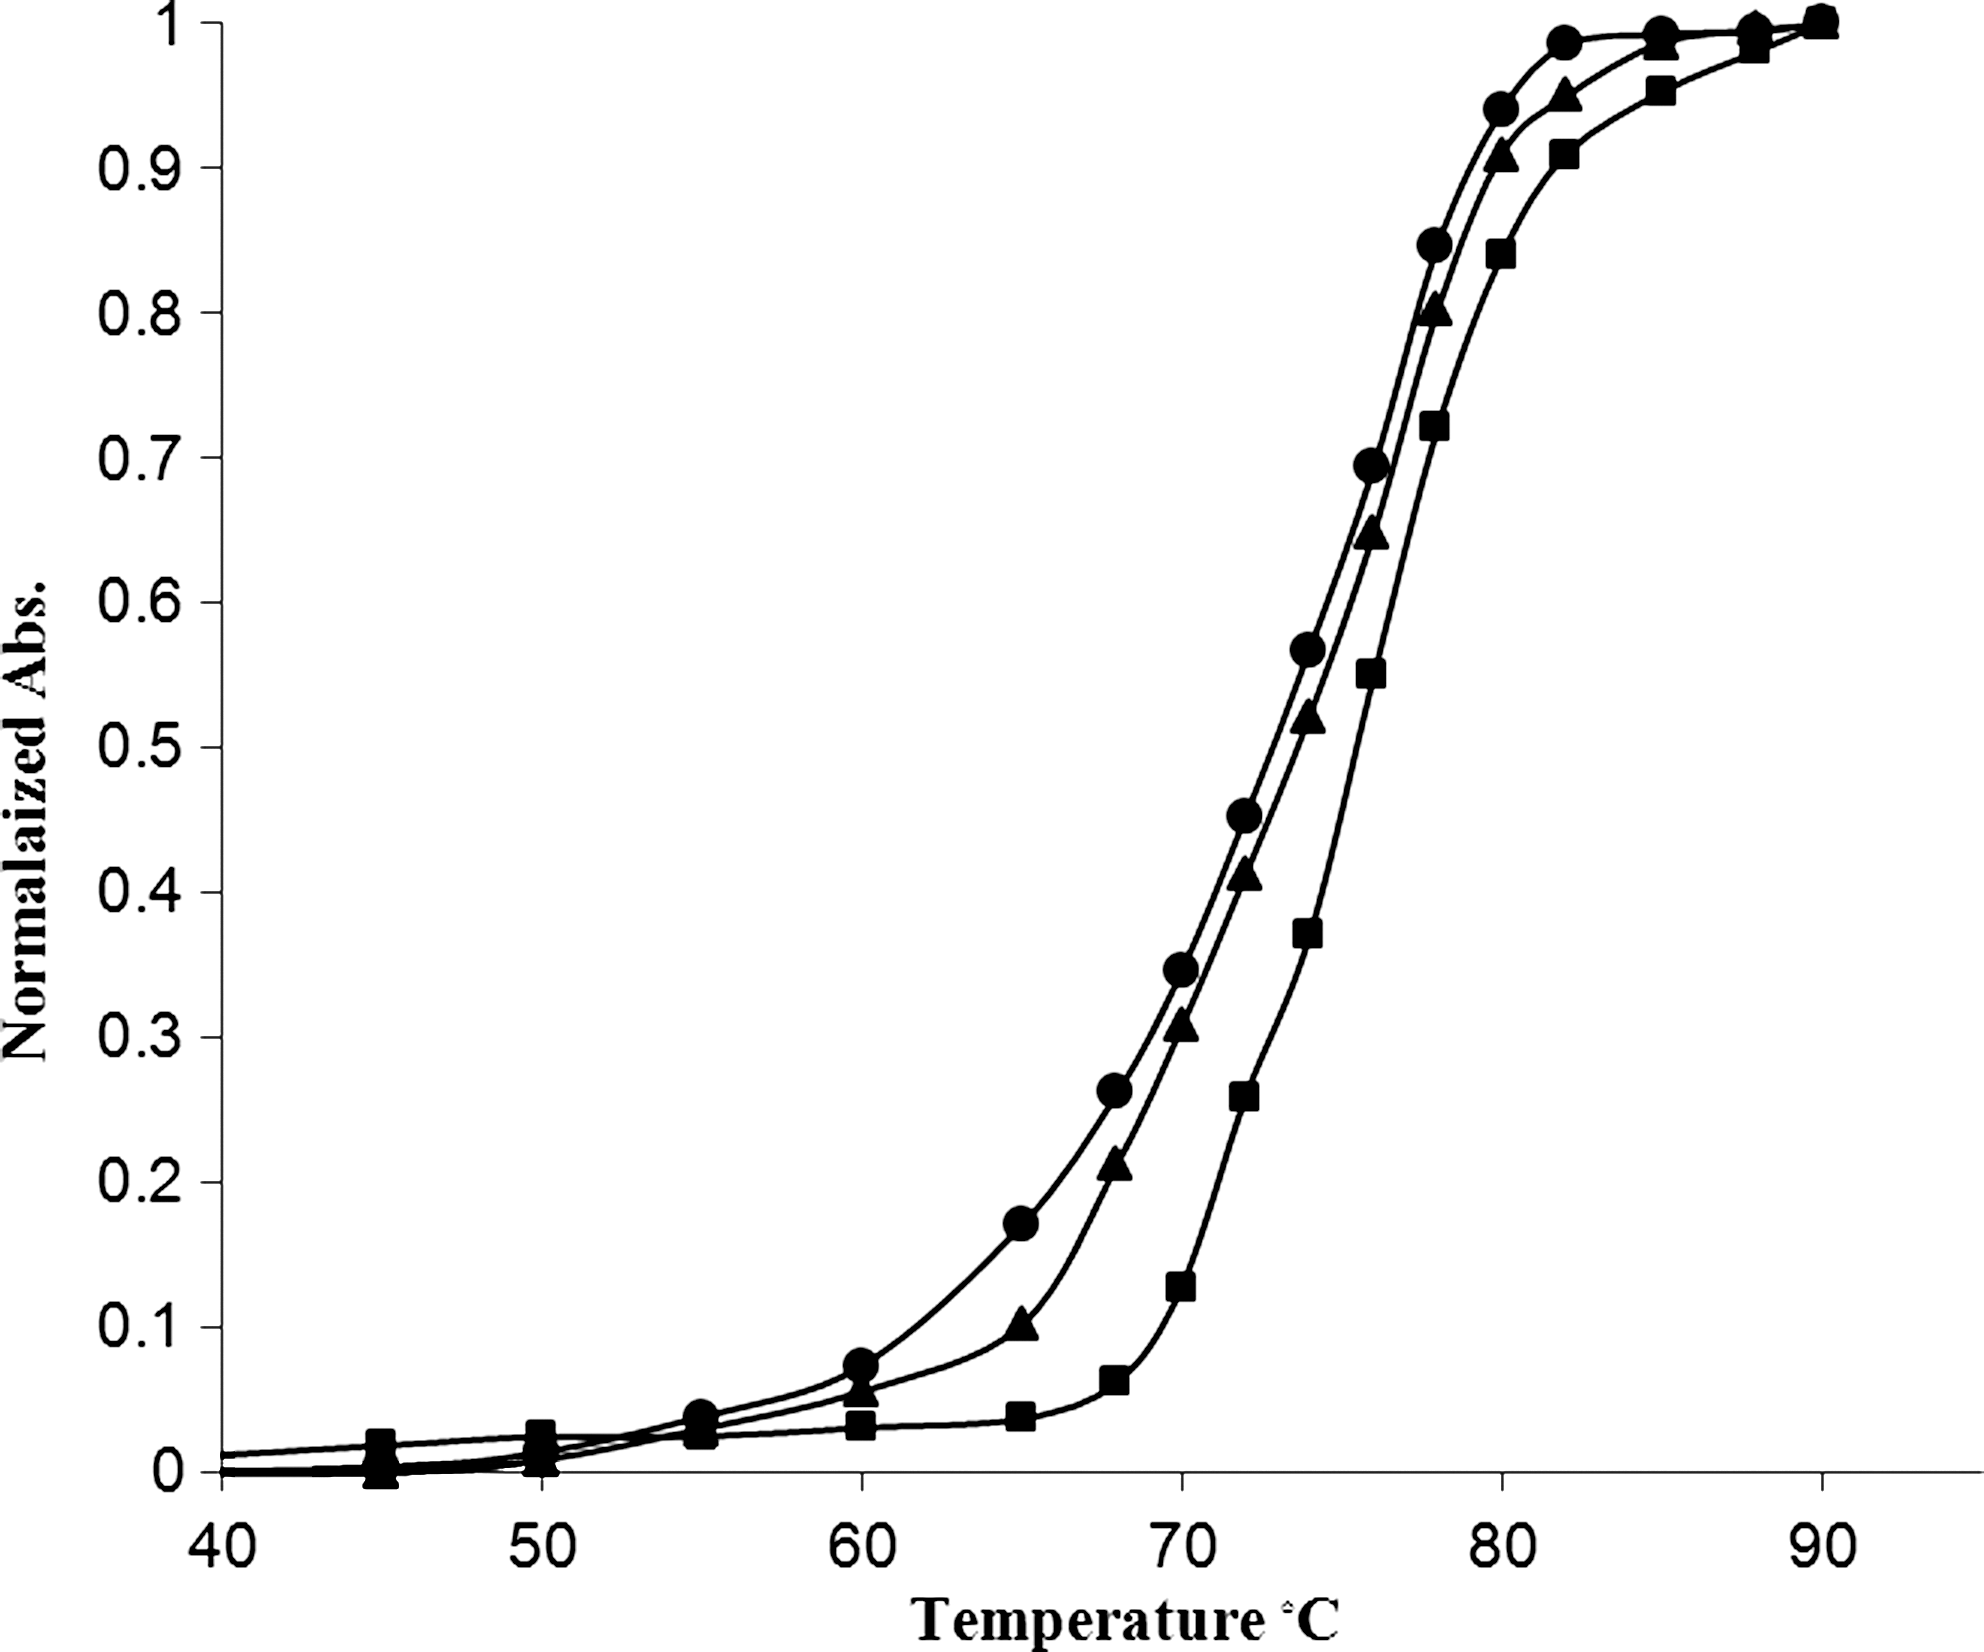
Melting plots, by ultraviolet–visible absorbance spectrophotometry, of calf thymus DNA 5×10⁻⁵ M in Tris-HCl in the presence of PYR, at r i=[PYR]/[DNA]=0.0 (•), 0.5 (▴), and 1.0 (▪).
The fluorescence spectroscopy study
The interaction of PYR with DNA was also examined by fluorescence titration. The fluorescent emission spectra of PYR as well as the effect of DNA concentrations on the fluorescence emission spectra of PYR are presented in Figure 6. Under our experimental conditions, aqueous solution of PYR exhibits fluorescence between 575 and 600 nm with the maximum at around 588 nm when excited at 450 nm (dotted line). The fluorescence spectrum of complex is markedly affected by addition of DNA. In the presence of DNA, the emission intensity of PYR is increased and the emission peak centered at 588 nm is blue shifted and narrowed. This enhancement of fluorescence is due to both rigidity of the PYR molecule when bound to DNA and binding of PYR to a relatively nonpolar environment; the PYR environment is protected from solvent molecules. The observed blue shift in the emission spectra is due to the binding of the phenyl rings of PYR with base pairs of DNA. Like the quenching process, the enhancement constant can be obtained by equation (4) (Shahabadi and Fatahi, 2010):
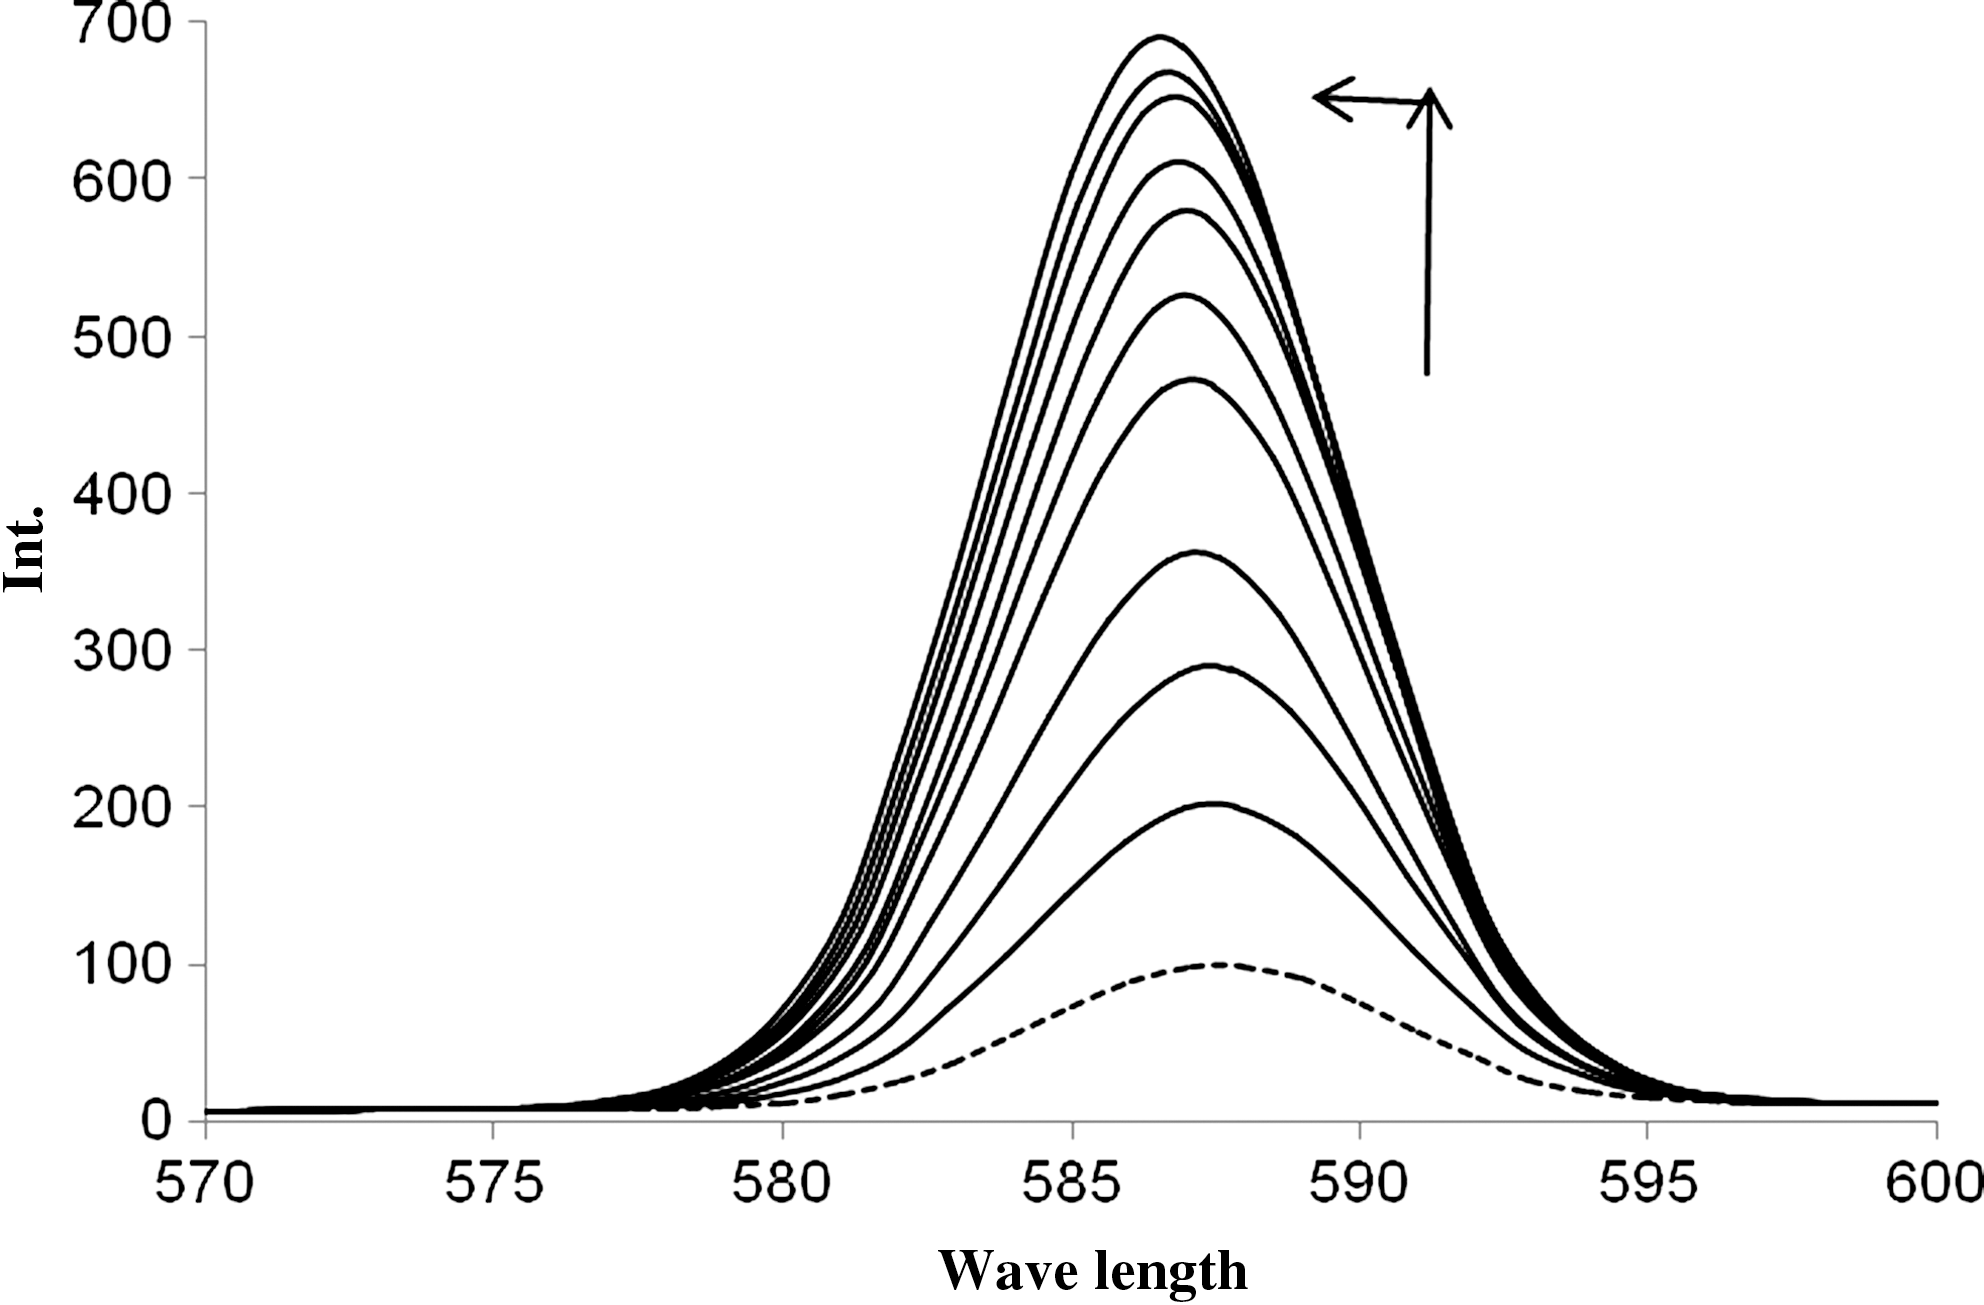
Changes in fluorescence emission spectra of PYR (5.0×10⁻⁵ M) in Tris-HCl buffer, pH 7.3, with increasing concentration of CT-DNA. The DNA concentrations were from bottom to top (0–1.0×10⁻⁴ M). The excitation wavelength, λ exc, was 450 nm.
If a dynamic process is a part of the enhancing mechanism, the above equation can be written as follows:
where K D is the dynamic enhancement constant (like a dynamic quenching constant), K B is the bimolecular enhancement constant (like a bimolecular quenching constant), and τ 0 is the lifetime of the fluorophore in the absence of enhancer. The dynamic enhancement constant of PYR was calculated using equation (5) as 3.0×10³. As the fluorescence lifetime is typically near 10−8 s, the bimolecular enhancement constant (K B) was calculated from K D=K B τ 0 as 3.0×10¹¹. By considering the equivalency of the bimolecular quenching and enhancement constants, it can be seen that the latter is greater than the largest possible value (1.0×10¹⁰ M−1 s−1) in aqueous medium. Thus, the fluorescence enhancement is not initiated by a dynamic process, suggesting that a static process involves complex formation in the ground state.
Evaluation of stereoselectivity interaction by CD
The effect of PYR on DNA structure was evaluated by CD spectroscopy and the results are shown in Figure 7. The CD spectrum of free CT-DNA (bold line) consists of a negative Cotton effect at 248 nm and a positive Cotton effect at 276 nm. The negative spectrum corresponds to the helical structure of DNA (helicity) and the positive spectrum corresponds to stacking of the base pairs that is characteristic of DNA in the right-handed B-form. The PYR molecules do not exhibit any CD signal in the region of 220–320. PYR causes an intensity increase of both positive and negative bands without shift in the peak positions (Figure 7). These changes suggested that the PYR stabilized and condensed the right-handed B form of DNA and interacted via intercalation, because the intercalators enhance the intensities of both bands (Maheswari and Palaniandavar, 2004; Sun et al., 2010). This result suggests that the binding pocket of DNA is large enough to permit the pyridine ring of PYR to enter into the double strand. On the other hand, PYR may display specific recognition and binding ability to DNA base pairs by shifting the base pairs distortion away from the original location. Our experiments followed an induced fit mechanism in the recognition event of PYR altering the conformation of DNA. This highly cooperative induced fit binding behavior appeared to enhance both hydrogen binding and van der Waal's interactions between PYR and base pairs in the double strand, which were generally energetically favorable and maximized through the structural accommodations providing the PYR-DNA complex with a source of enhanced stability. We concluded that PYR may be able to achieve proper phasing of its pyridine ring with the edges of the base pairs in the double strands by altering its own inherent twist, this being an intermediate to altering the conformations of the host base pair DNA specifically. However, the thermal denaturation, fluorescence studies, and UV–vis data suggest that the interaction may follow an intercalation mode.
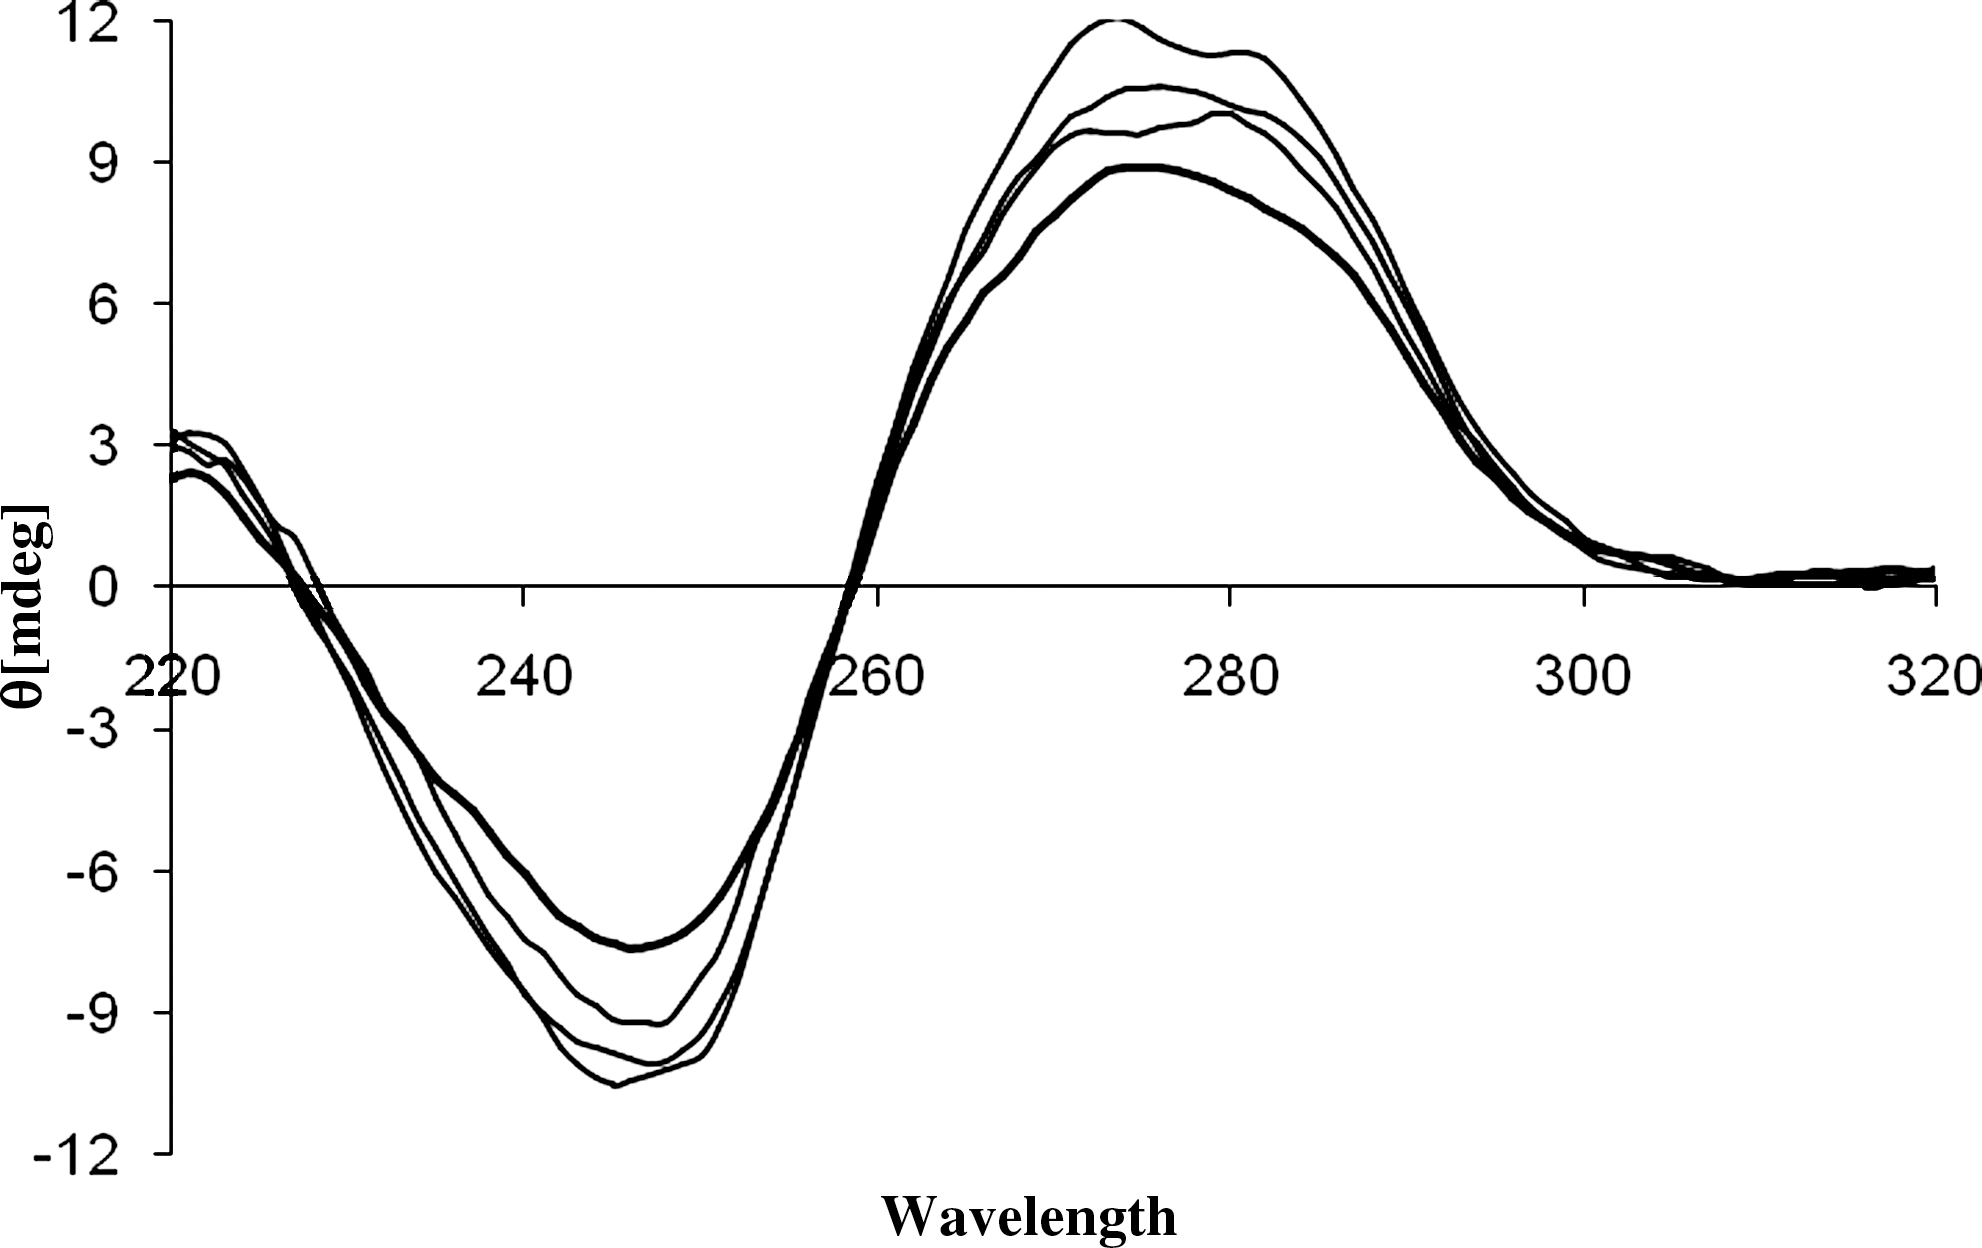
The circular dichroism spectrum of CT-DNA (5.0×10⁻⁵ M) (bold line) and in presence of 1.5×10⁻⁵, 3.5×10⁻⁵, and 5.0×10⁻⁵ M of PYR.
FTIR measurements
Fourier transform infrared (FTIR) spectroscopy is often used to characterize the nature of drug–DNA interactions and to monitor the effects of various drugs on DNA structure (Zhou and Li, 2004a, 2004b; Nafisi et al., 2007). We used FTIR to determine PYR binding sites, sequence preference, and the structural variations of PYR-DNA complexes in aqueous solution. The IR spectral features for PYR-DNA complexes are presented in Figure 8a, b. Ring vibrations of nitrogenous bases (C=O, C=N stretching), –PO2 stretching vibrations (symmetric and asymmetric), and deoxyribose stretching of DNA backbone are confined in the spectral region 1800–600 cm−1. The vibrational bands of DNA at 1712, 1662, 1610, and 1491 cm−1 are assigned to guanine (G), thymine (T), adenine (A), and cytosine (C) nitrogenous bases, respectively. Bands at 1229 and 1084 cm−1 denote phosphate asymmetric and symmetric vibrations, respectively. The band at 1055 cm−1 is assigned to the sugar vibration (Kanakis et al., 2005; Nafisi et al., 2007; N'soukpoé-Kossi et al., 2008). The PYR–PO2 interaction can be evaluated from the change of intensity and shifting of the –PO2 band at 1228 cm−1 and symmetric band at 1084 cm−1 in the spectra of the PYR-DNA complexes. In the presence of PYR at r=1/40, shifting for the bands at 1712 (guanine) to 1709, 1662 (thymine) to 1656.9, 1608 (adenine) to 1608.7, 1491 (cytosine) to 1489, and 1229 (asymmetric stretching phosphate) to 1228.8 cm−1 were observed and accompanied by a decrease in intensities of guanine band (8%), thymine band (11%), adenine band (9%), and cytosine band (12%). A minor loss of intensity of the DNA in plane vibrations can be attributed to partial helix stabilization as a result of PYR-DNA complexation. Similar spectral changes were observed in the spectrum of quercetin–DNA (Kanakis et al., 2005) and Zanamivir (Nafisi et al., 2007), in which minor loss of intensity of DNA in plane vibrations is attributed to partial helix stabilization. In addition, the intensity of asymmetric and symmetric bands of –PO2 and sugar slowly decreased without any shift in symmetric –PO2 vibration. This decrease in intensity of −PO2 vibrations can be attributed to some degree of helix stabilization (Tajmir-Riuahi et al., 1996). As PYR concentration increased (r=1/4), shifting for the bands at 1712 (guanine) to 1709, 1662 (thymine) to 1643.5, 1609 (adenine) to 1610.7, 1491 (cytosine) to 1491.1, 1228 (–PO2 asymmetric) to 1224.9, and 1084 (–PO2 symmetric) to 1086 was observed in the spectra of PYR-DNA complex. Also, a major decrease in the intensities of guanine (G), thymine (T), adenine (A), and cytosine bands were observed. These changes in intensities can be attributed to direct PYR binding to guanine (N7), cytosine, thymine (O2), and adenine (N7) of DNA bases in the double strand of DNA (N'soukpoe-Kossi et al., 2008; Marty et al., 2009). The decrease of phosphate bands at 1225 (asym–PO2) and 1084 cm−1 (sym–PO2) showed a remarkable intensity change upon PYR interaction. However, these results indicate a major interaction of PYR with all base pairs. According to the FTIR spectra, two modes of interaction may be predominant, a weak interaction of PYR with outside of DNA and an interaction with base pairs via intercalation.
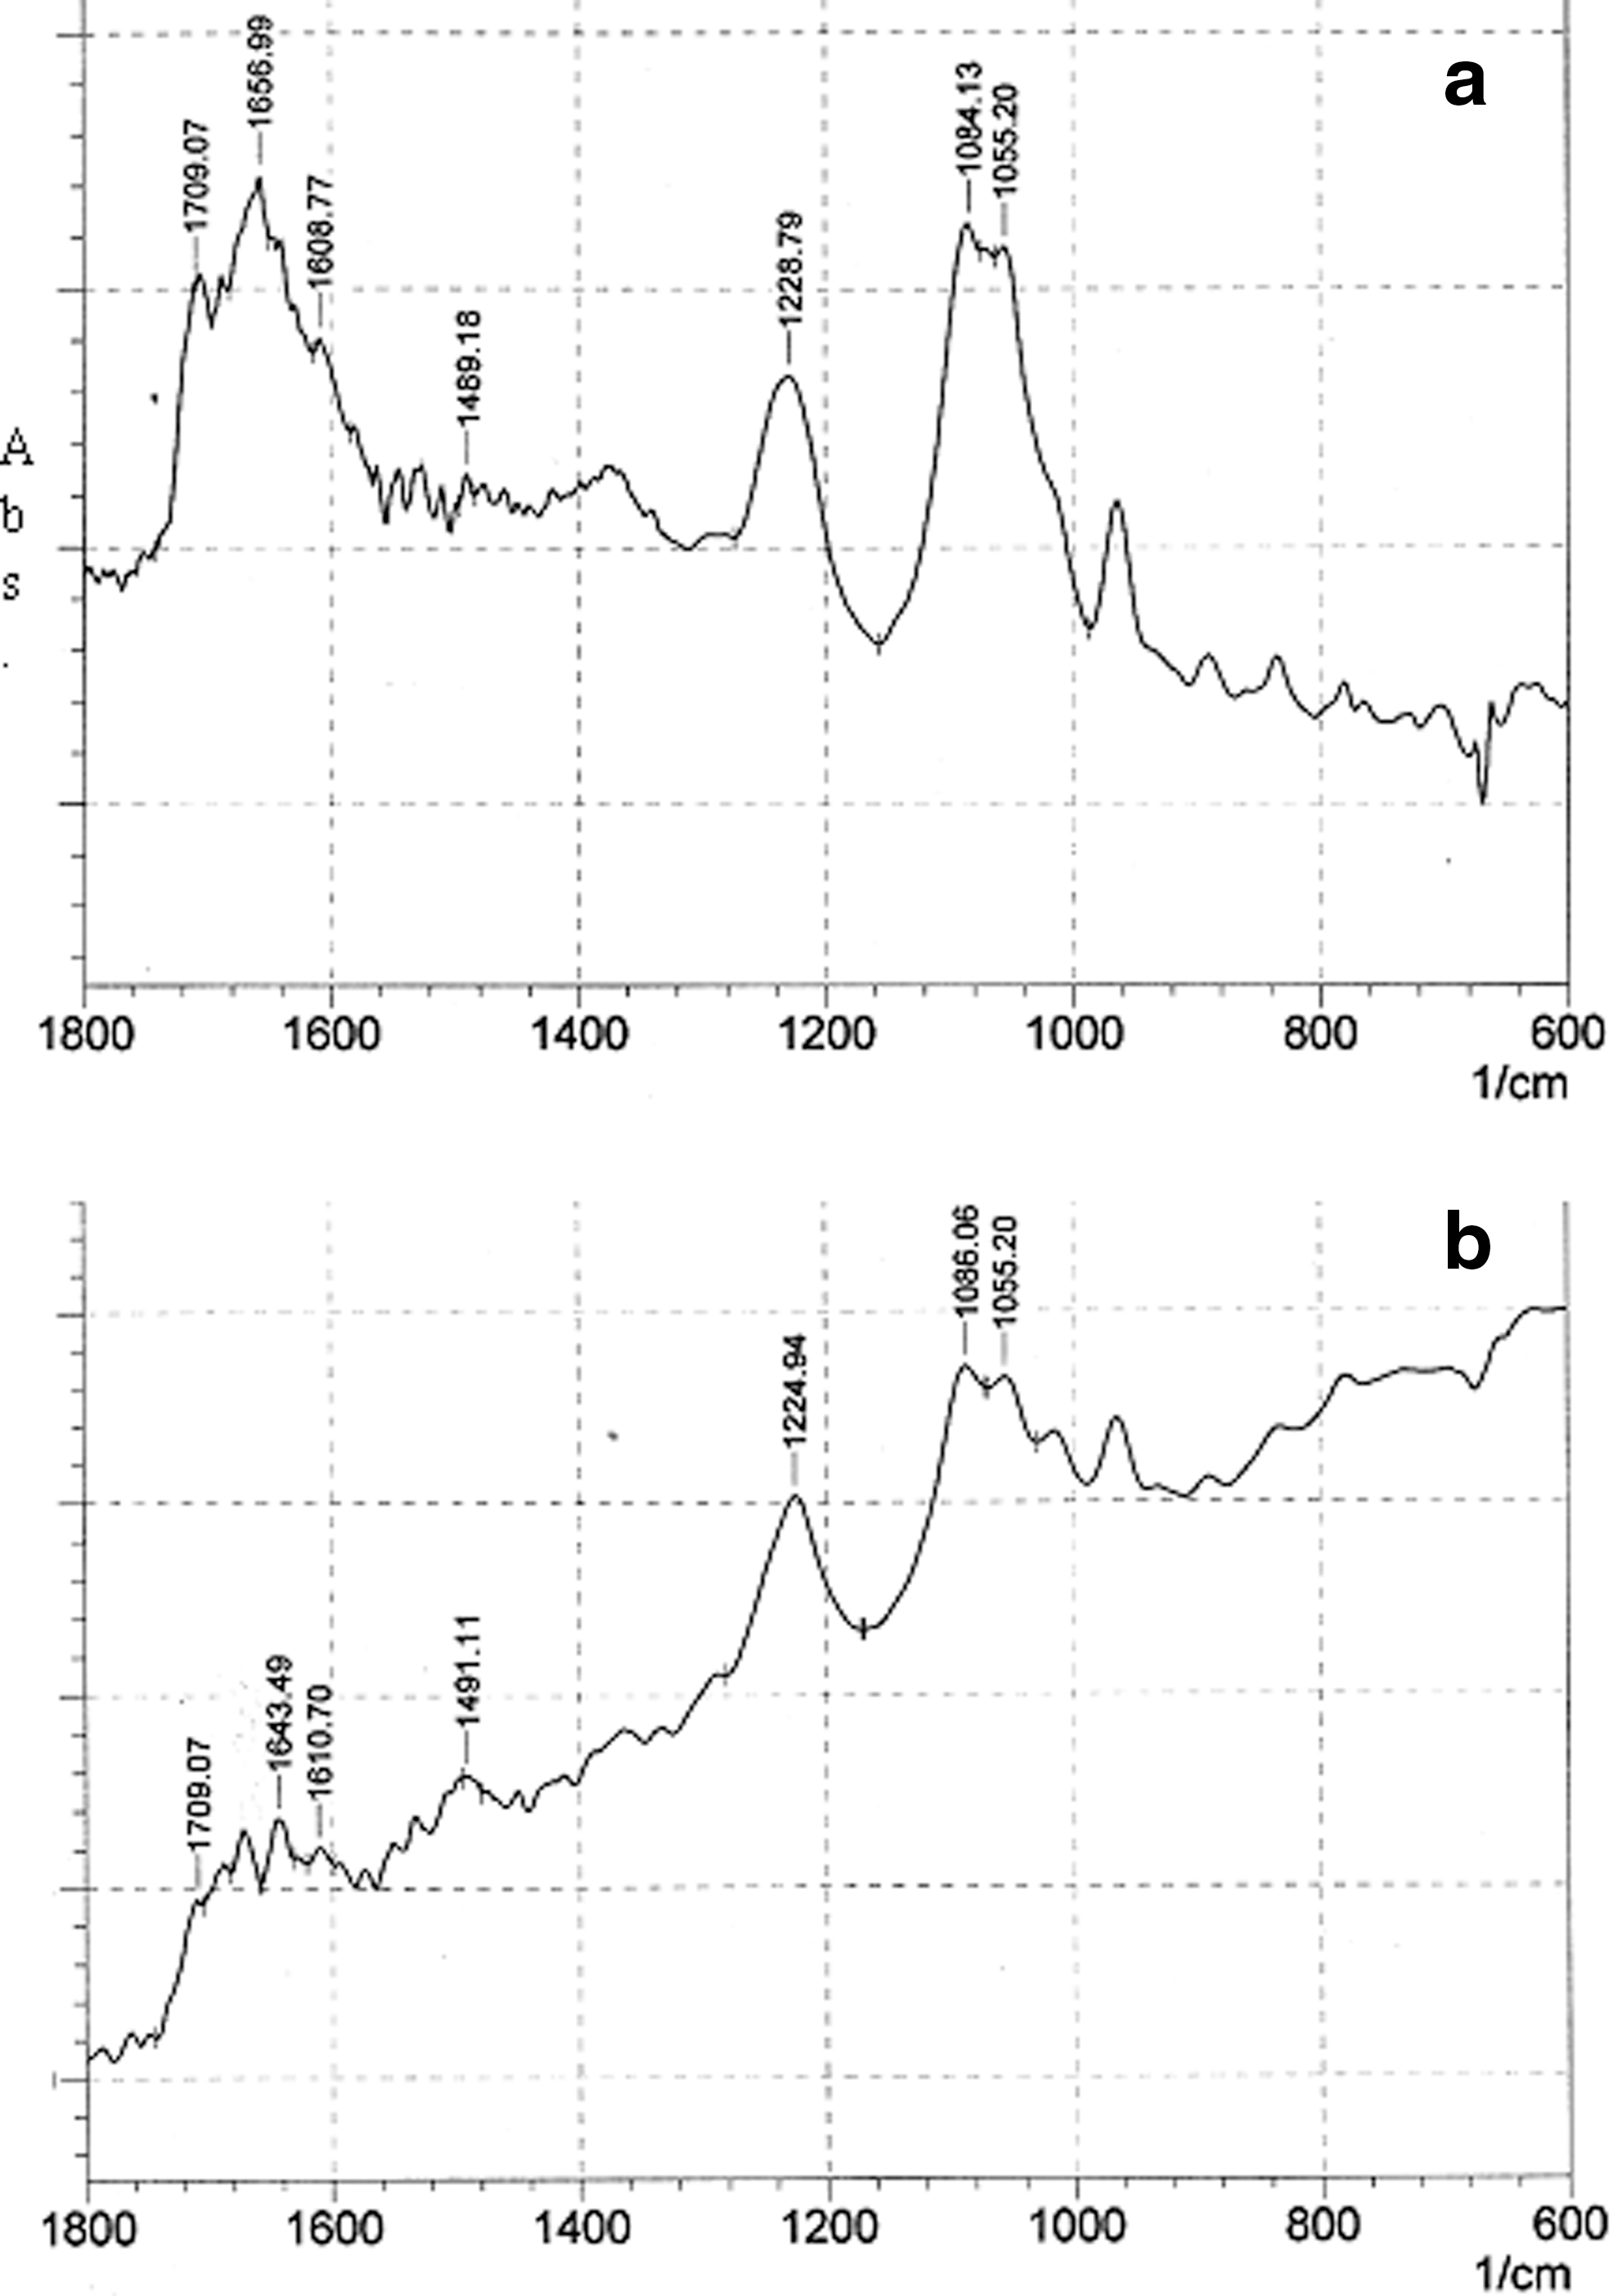
Fourier transform infrared spectra in the region of 1800–600 cm−1 for
Atomic force microscopy
AFM was used to image the free DNA and the complex of PYR-DNA in the solution. AFM is capable of imaging nonconducting as well as conducting surfaces. However, the most practical limitation to the application of AFM to structural and conformational studies of DNA and its complexes with target macromolecules is the sample preparation. The basic method is based on functionalization of the mica surface by aminopropyltriethoxy silane (APTES) and/or 3-aminopropylsilatrane (APS) to obtain a weak cationic surface (AP-mica) (Shlyakhtenko et al., 2000, 2003; Kato et al., 2003; Lyubchenko, 2004). The free DNA and PYR-DNA complexes at ratios of 1:1 and 1:2 at a final DNA concentration of 0.1 mM were prepared in 5.0 mL Tris-HCl (pH 7.3). The sample was prepared on muscovite mica according to previous work (Marty et al., 2009). Figure 9a–f shows the ultrastructures of free DNA and PYR-DNA complexes with r i=[PYR]/[DNA]=1.0 and 2.0 and their phase transitions, respectively. AFM imaging of both PYR-DNA complexes did not reveal any presence of free DNA or PYR molecules. This is may be due to two reasons: free DNA or PYR did not exist in solution or did not attach well to the mica and were washed away. Large complexes were observed for PYR-DNA (Fig. 9b, c). The core of the complexes at ratios of 1:1 and 1:2, which should contain the DNA chains, has an average size of 571.75 and 328.67 nm, respectively. We found that the DNA is smaller than the PYR-DNA complexes with a size of 87 nm (Figure 9a–c. In addition, the DNA structure formed a global shape, whereas the 1:1 PYR-DNA complex formed a bulky and the 1:2 PYR-DNA complex formed a grid shape. The same shapes were reported by Marty et al. (2009) for complexes of DNA with cathionic lipids. Also, the AFM image in phase mode showed a distinct phase transition after interaction between DNA and PYR. The phase images of free DNA and complexes are shown in Figure 9d–f. Figure 9d represents the phase transition image of free DNA with a uniform shape, and the complexes of PYR-DNA show a remarkable variation in DNA structure and confirmed the complex formation (Fig. 9e, f).
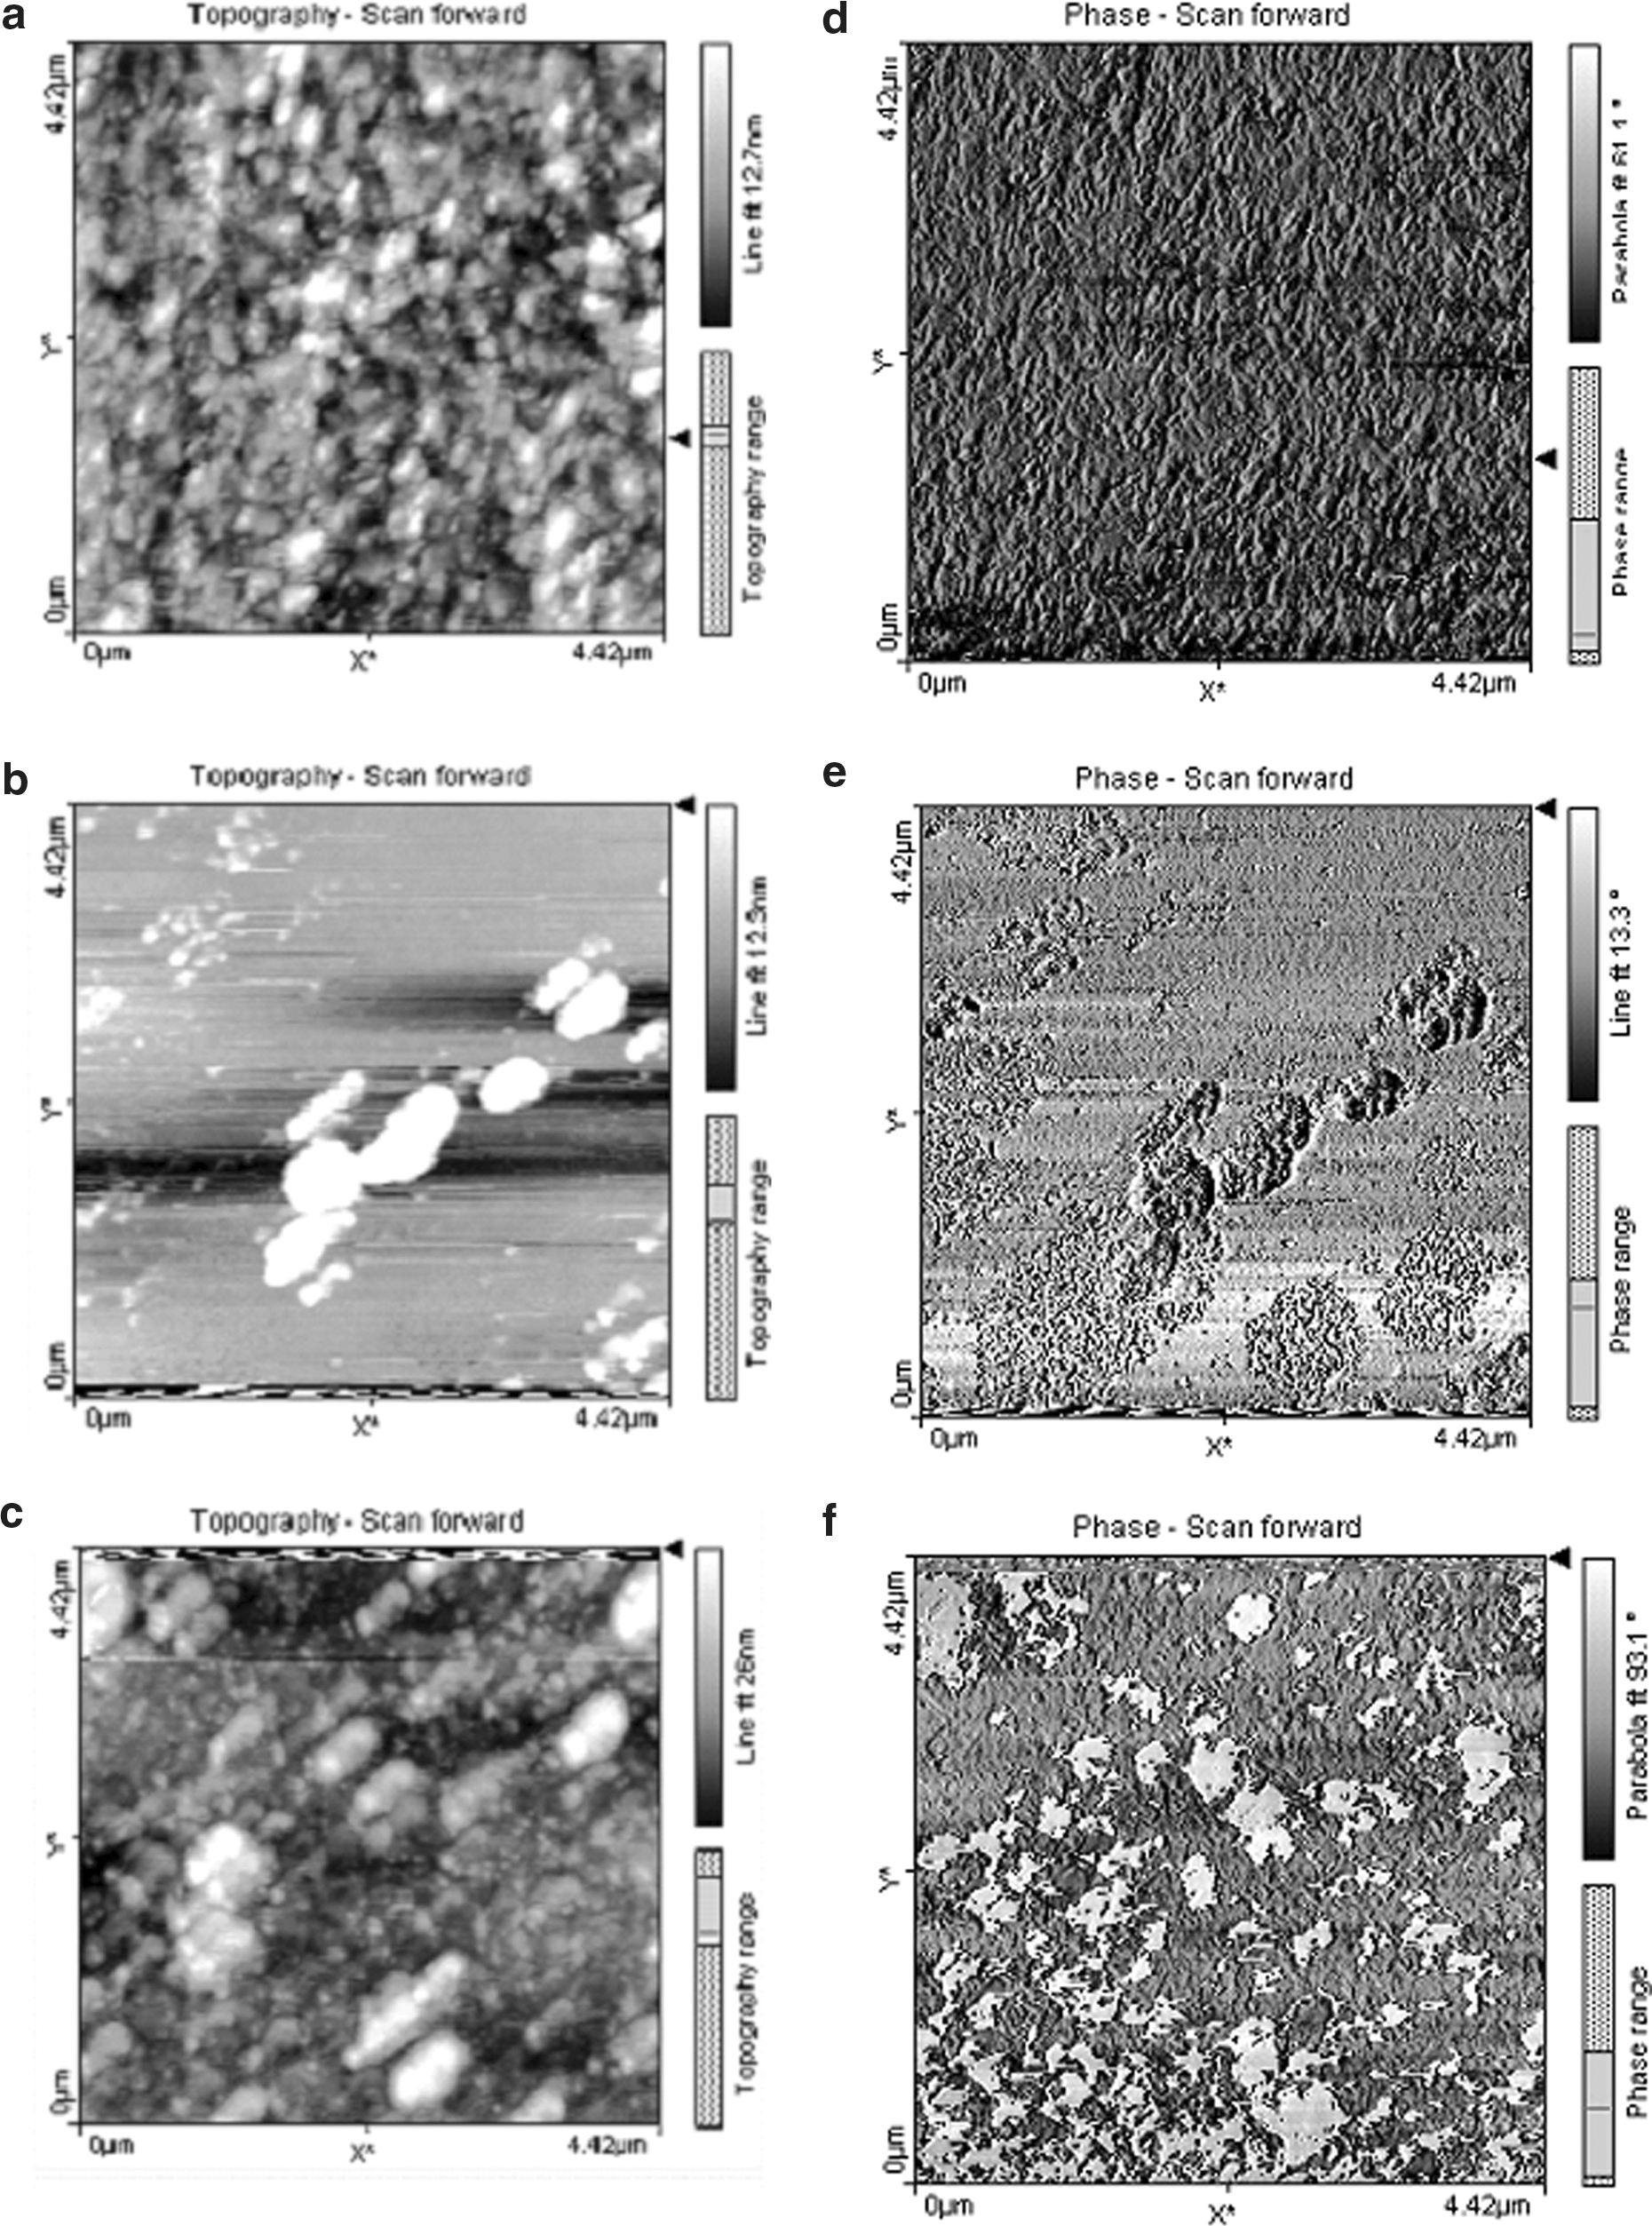
The atomic force microscopy images and the transition phase of dried free DNA and PYR-DNA complexes
Quantum mechanical calculations
The interaction of pesticides with DNA has been experimentally and theoretically studied in our laboratory (Askari et al., 2008; Gholivand et al., 2008; Ahmadi and Bakhshandeh, 2009; Ahmadi et al., 2010; Ahmadi and Jafari, 2011). Despite these investigations, the complete characterization and interaction of pesticides with DNA remains not fully understood. However, computational studies provide great potential for understanding the interaction of ds-DNA with other molecules. These methods utilize high level quantum mechanical (QM) theories to achieve highly accurate results; unfortunately, these calculations for large molecular systems are nearly impossible. A hybrid approach is the ONIOM method developed by Morokuma and coworkers (Humbel et al., 1996; Svensson et al., 1996; Froese et al., 1998; Morokuma et al., 2001; Morokuma, 2003). ONIOM is a powerful, systematic method that divides the system into onion-like layers (Morokuma, 2003). The chemically important region is treated with an accurate high-level QM method and the rest of the layers are treated with a computationally less intensive lower-level QM (for example, semiempirical) or molecular mechanics (MM) method. The basic concept of the two-layer ONIOM method is illustrated as follows (Iordanov, 2008):
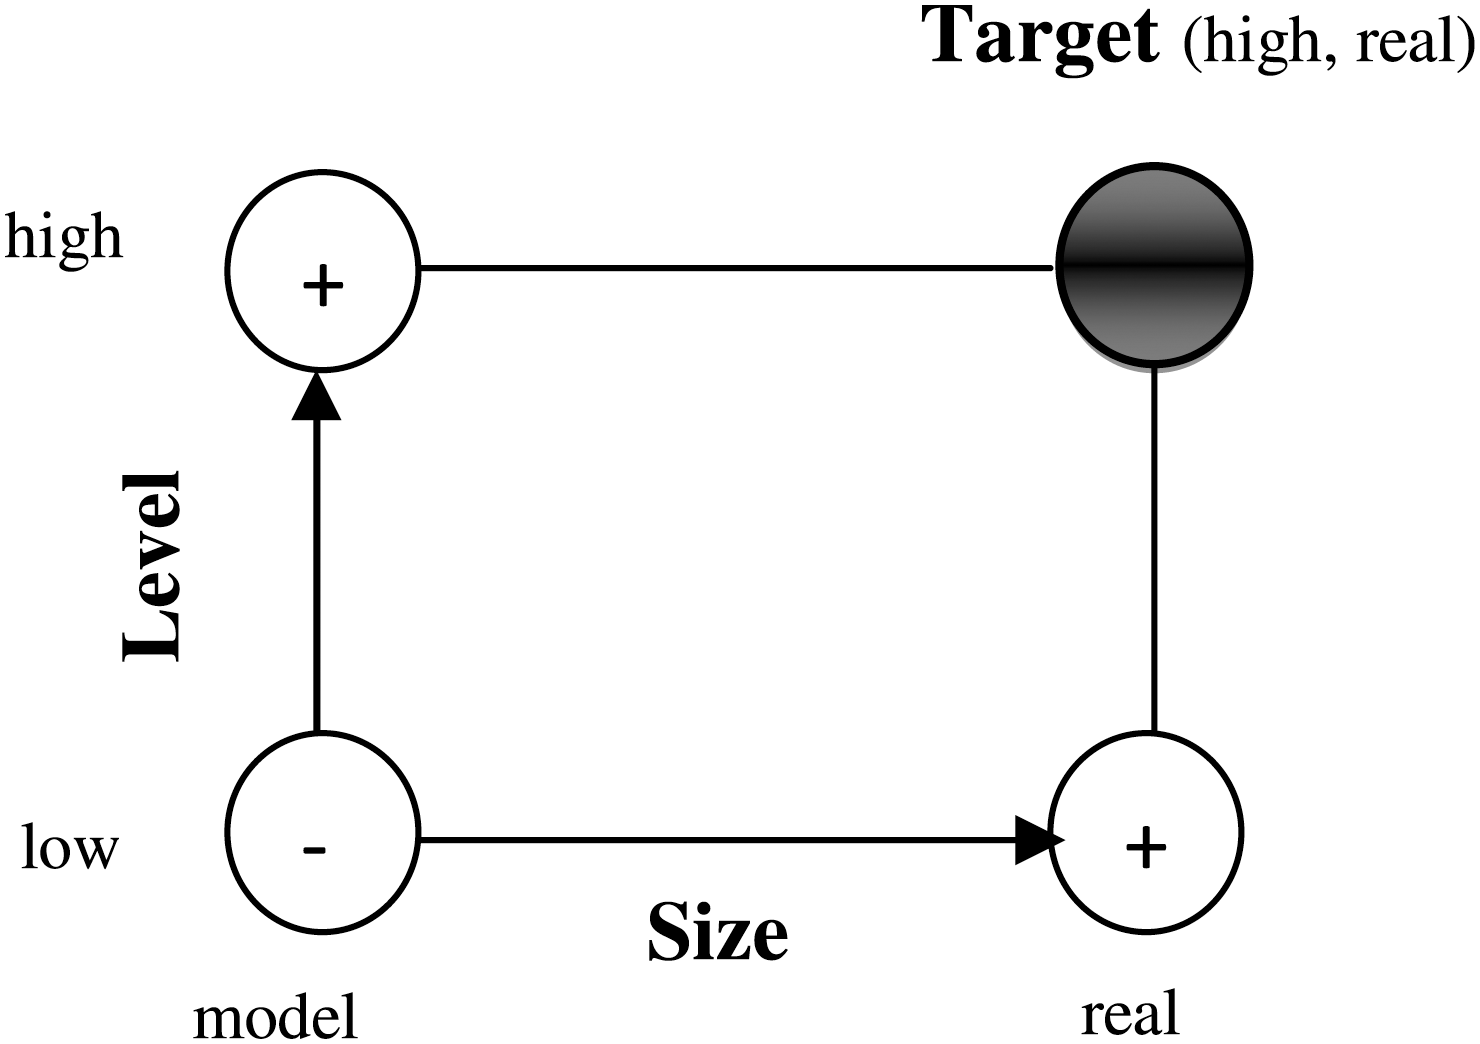
The target calculation for the relative energy is a high-level treatment for the entire real system
Here, all ΔE refers to relative energies at ONIOM geometry (//ON), such as bond energy and barrier height. The quality of the ab initio results depends mostly on the Gaussian basis set and whether electron correlation is taken into consideration sufficiently. To achieve more accurate theoretical results, it is necessary to determine which atoms or part(s) of PYR can interact with the ds-DNA molecule. We modeled part of a DNA molecule containing two pairs of GC or AT bases and backbone phosphates and sugars. In this study, we used the UFF as a mechanical molecular, and DFT as high level with 6-31++G (d,p) basis set, as none of the other methods converged in an optimization calculation of the molecule. To apply the ONIOM and represent which atoms can participate in the interaction of DNA and PYR, molecules have been divided up into two arbitrary layers of atoms as follows: 1. High-level model: containing all atoms of PYR, and two base pairs such as AT and/or GC. 2. Low-level model: containing all dioxyribose sugars and phosphate backbone.
This result allows us to correctly describe the AT and GC bonding and interactions of the DNA with PYR. To select a low-level theory, AM1, MNDO, and UFF were examined, and except for the latter, none of the other methods converged in an optimization calculation of the molecules. Thus, UFF and B3LYP 6-31++G (d,p) levels have been employed for hybrid calculations. The optimized structures of the modeled part of DNA-PYR complexes are shown in Fig. 10a, b. The results revealed that PYR interacts with AT and/or GC base pairs via induction of its pyridine ring into the space of base pairs and causes a change in modeled DNA conformation. This result confirms that PYR causes an axial elongation in GC base pairs than in AT (Table 1). The calculated distance between the two phosphate groups in the interaction region, which is supposed to increase as the base pairs separate (Vreven and Morokuma, 2000) in the models considered, is reduced from 18.46 to 17.47 for AT base pairs and from 19.18 to 14.85 for GC base pairs. To compare the relative stability of the two complexes, we have evaluated the interaction energy, ΔE, by a general equation (6). The interaction energy, ΔE, between GC-PYR and AT-PYR were −28.96 and −32.4 kJ mol−1, respectively. The results allow us to conclude that the interaction energy between AT base pairs and PYR is higher than that between GC base pairs and PYR. The lower stability of the GC-PYR complex may be due to the larger planar surface of the GC compared with the AT base pair and the shorter stacking distance, of about 0.61 Å, observed in CG-PYR compared with that in AT-PYR (Table 1). Consequently, the interaction of PYR induces a larger distortion of the structure of AT compared with that of GC. The same results were reported for interaction of proflavine with AT and GC oligonucleotides by Barone and coworkers (Ruiz et al., 2009). We believed that PYR interacts with DNA via its pyridine ring by intercalation, because the affinity for interaction with AT and GC bas pairs is more than that for the other parts of DNA (Nelson et al., 2007; Ruiz et al., 2009). In addition, from the fluorescence enhancement, FTIR, and ONIOM data, we concluded that the other parts of PYR may rotate around the outside of DNA, especially at groove positions.
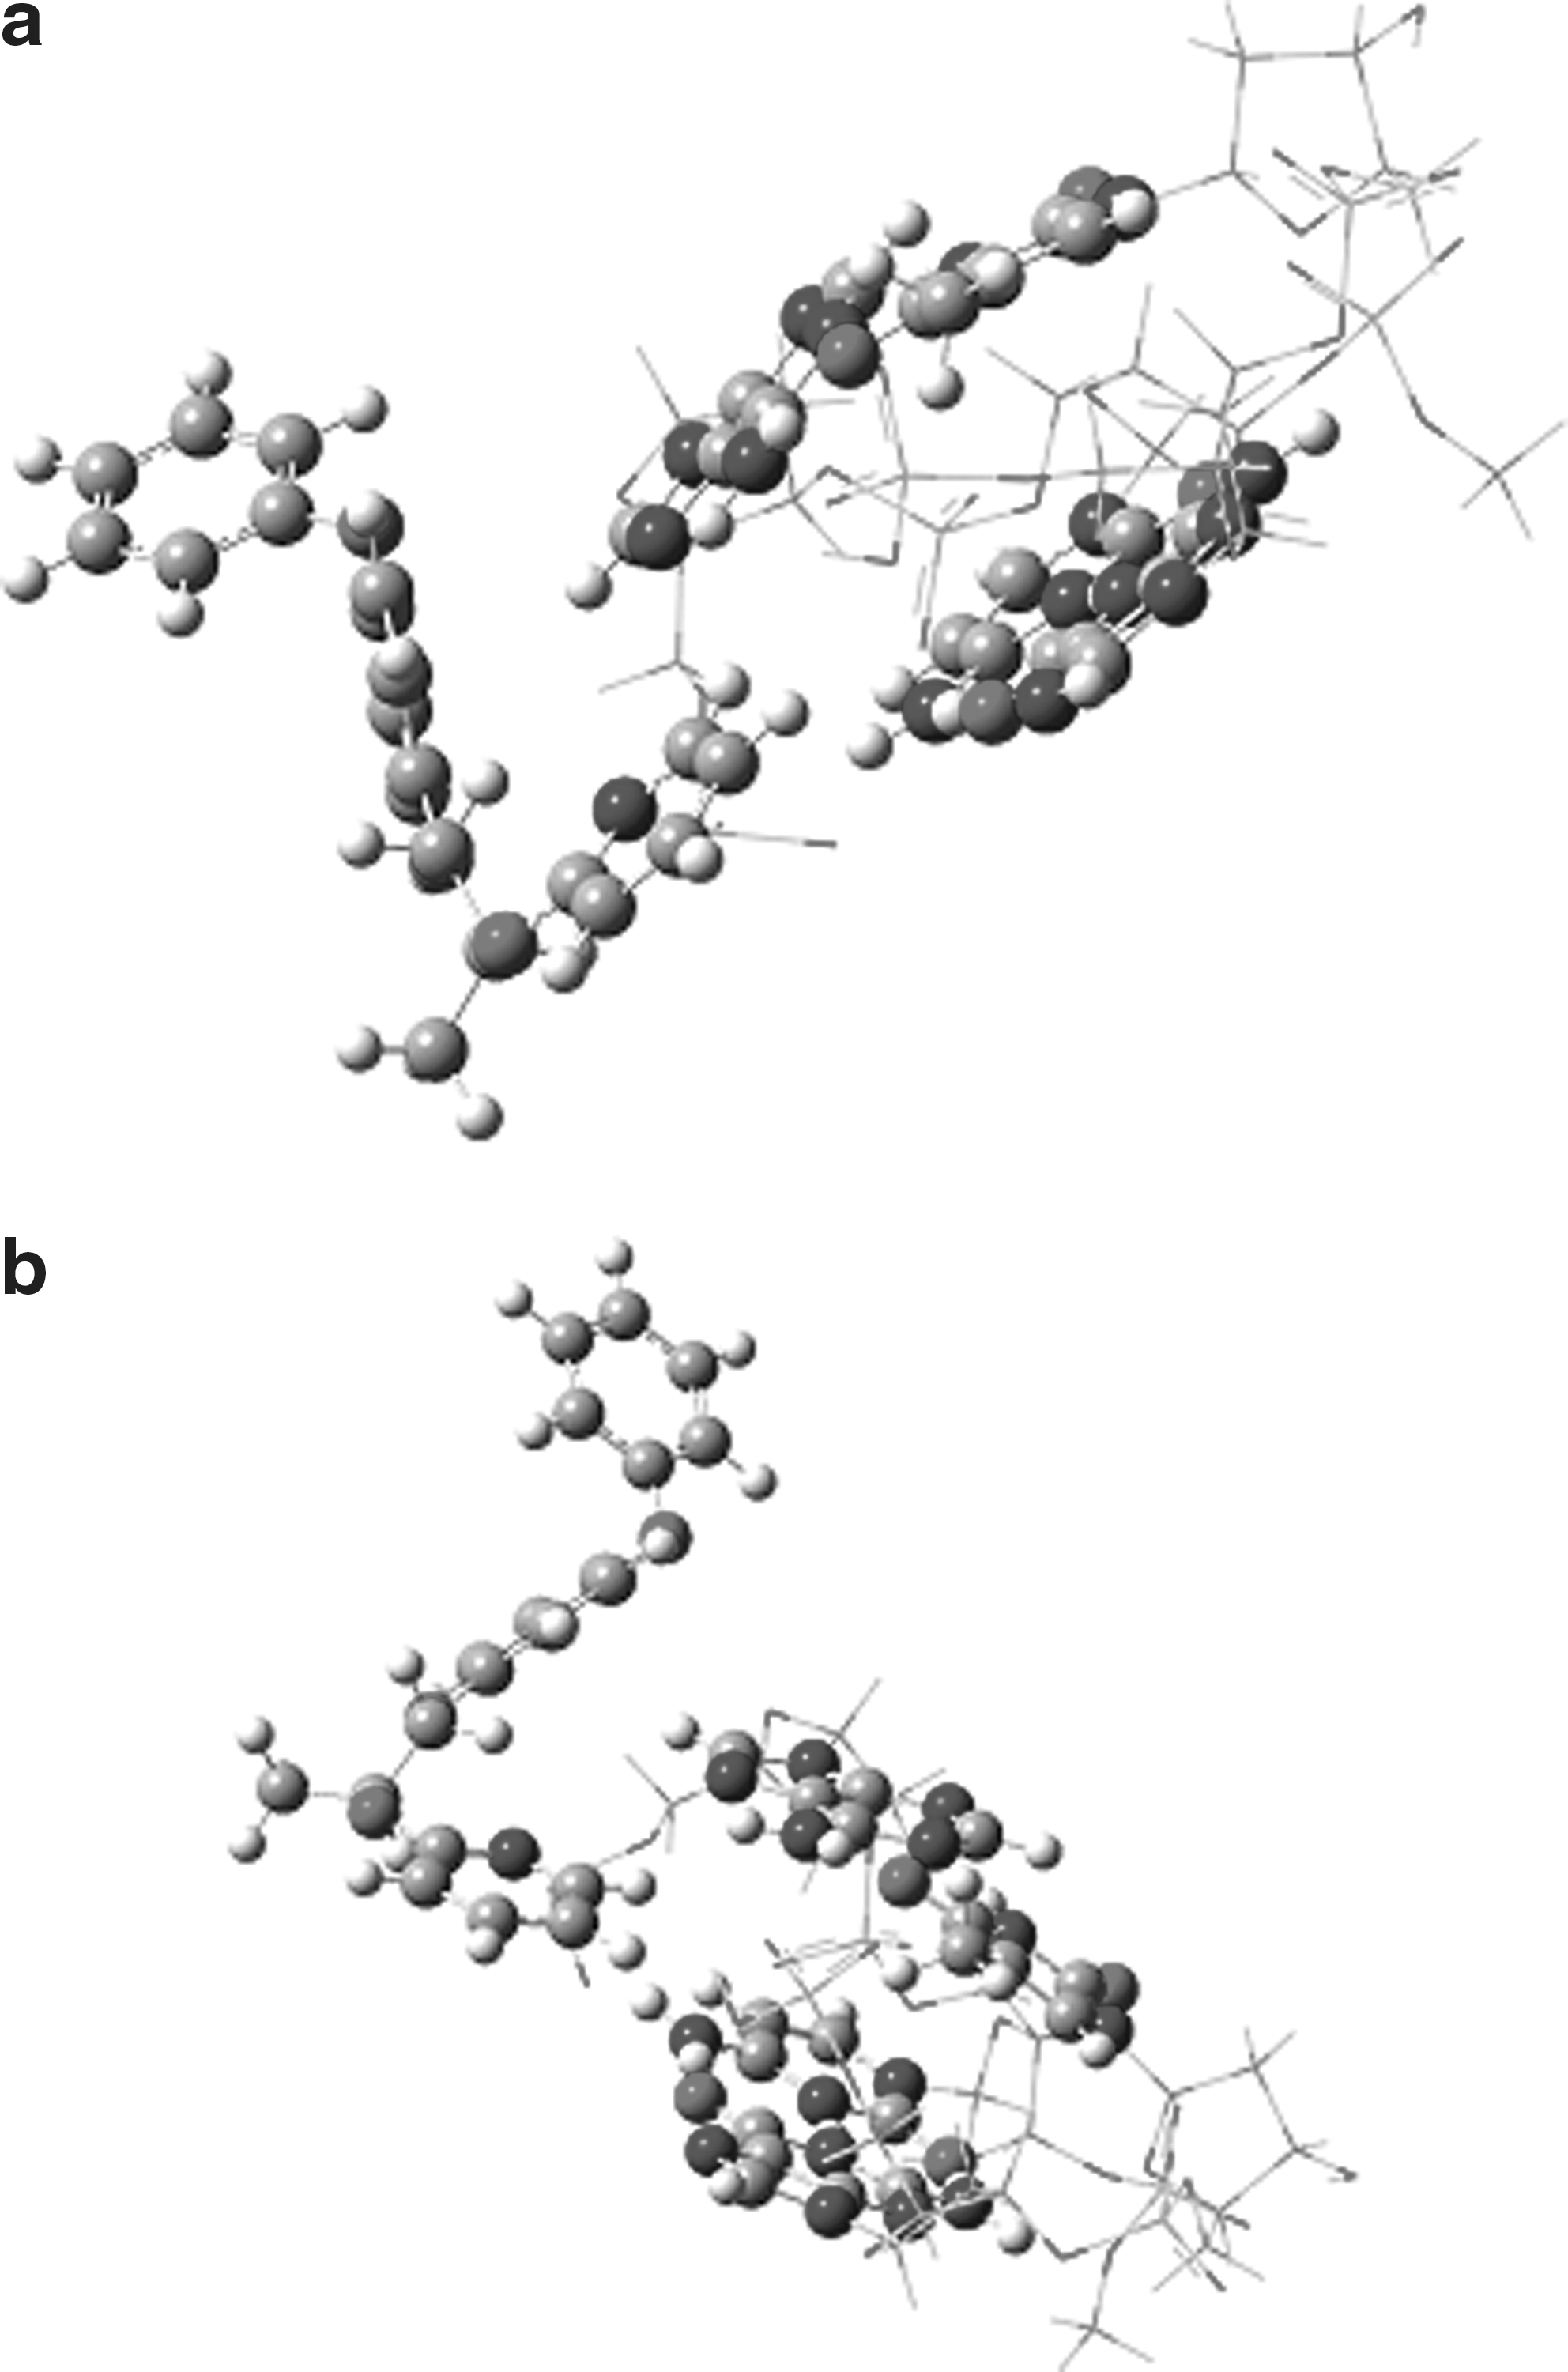
Optimized conformation of
Average stacking distances.
PYR, pyriproxyfen.
Conclusion
In this work, we combined the multispectroscopic and AFM techniques with ONIOM, based on the hybridization of QM/MM (DFT, 6.31++G (d,p)/UFF) methodology, to study DNA interaction with PYR. From all data and enhancement fluorescence, we concluded that PYR may interact with DNA via intercalation of its pyridine moiety into the base pairs and an outside interaction via DNA grooves. Also, the FTIR and ONIOM data suggest that PYR has more selectivity to the adenine–thymine (A–T) sequence when compared with the guanine–cytosine (G–C) sequence with little binding preference toward the phosphate backbone and sugars of the DNA helix. For the PYR-DNA complex, we propose a simple structural model based on the AFM images, wherein a dense DNA core is surrounded by PYR and formed a grid shape in a molar ratio of 1:2. Also, other supporting data for our conclusion are as follows: (i) the UV hyperchromism and blue shift (∼4 nm) of the absorption band at 258 nm in the presence of increasing amounts of PYR; (ii) the increase of the DNA T m of about 6°C when molar ratio of [PYR]=[DNA] is 1; (iii) the increase of CD signal around 245 and 275 nm along with increasing [PYR]/[DNA] ratio.
Footnotes
Disclosure Statement
We gratefully acknowledge Vice Chancellor for Research and Technology, Kermanshah of Medical Sciences for financial support. This work was performed in partial fulfillment of the requirements for a Pharm. D of Nasibeh Jamali in Faculty of Pharmacy, Kermanshah University of Medical Sciences, Kermanshah-Iran.