The binding properties of [Ru(bpy)2(H2IIP)]2+ (1) {bpy=2,2′-bipyridine, H2IIP=2-(indole-3-yl)-imidazolo[4,5-f][1,10]phenanthroline} with calf thymus DNA (CT-DNA) and yeast tRNA have been investigated comparatively by different spectroscopic and viscosity measurements. The results suggest that the affinity of complex 1 binding with yeast tRNA is stronger than that of complex 1 binding with CT-DNA, and complex 1 is a better enantioselective binder to yeast tRNA than to CT-DNA. The toxicity of complex 1 was concentration dependent, and HL-60 cells are more sensitive to complex 1 than Hep-G2 cells; complex 1 could induce Hep-G2 cell apoptosis.
Introduction
During the last decade, the interaction between transition metal complexes and DNA has been extensively studied (Bolos et al., 1998; Clarke et al., 1999; Strekowski et al., 2005; Tabassum and Mathur, 2005; Tan et al., 2005; Diakos et al., 2006; Maheswari et al., 2006; Vijayalakshmi et al., 2006; Chauhan and Arjmand, 2007; Pena et al., 2007; Khan et al., 2009; Liu et al., 2009; Shi et al., 2010; Zeng et al., 2010). In particular, Ru(II) polypyridyl complexes have received increasing attention because of their unique properties (Xu et al., 2003b, 2005; Deshpande et al., 2009; Liu et al., 2010). In general, Ru(II) polypyridyl complexes can bind to DNA in a noncovalent interactions such as electrostatic binding (Yang et al., 1997), groove binding (Yang et al., 1997), intercalative binding, and partial intercalative binding (Xu et al., 2003b, 2005). Many useful applications of these complexes require that the complexes bind to DNA through an intercalative mode, and the intercalative ligand dominates the DNA-binding modes and affinities (Kostova, 2006; Bugarcic et al., 2008). Therefore, the vast majority of such studies have focused on modifying the intercalative ligand (Deshpande et al., 2009; Liu et al., 2010).
RNA is a versatile molecular that plays essential roles in many biological processes, such as storage of genetic information, propagation of the genetic material, and enzymatic activity (Varani, 1997). Consequently, it is an attractive target for potential therapeutics. The structural diversity present in RNA molecules has led to specific drug recognition sites. Therefore, a considerable amount of new information for RNA–metal complex interactions has also emerged. Metal complexes were usually used as catalysts of RNA hydrolysis cleavage (Lambert et al., 2009). They were also used as shape-selective probes of RNA tertiary structure (Carter et al., 1998), agents of RNA oxidation cleavage (Abramov et al., 2008), and recognition of mismatches in RNA (Chaires et al., 1982). However, investigations of the binding mode and the enantioselectivity for the interaction between metal complexes and RNA have been relatively few (Luedtke et al., 2002; Xu et al., 2003a). The future development of RNA-targeting drugs will rely on a deeper understanding of these binding processes.
DNA and RNA are different not only in composition of bases, but also in structure. For example, calf thymus DNA (CT-DNA) is B-form configuration, whereas yeast tRNA has an A-form configuration with an L-shaped tertiary structure. Thus, a comparative study of the interactions of metal complexes with yeast tRNA and CT-DNA in binding strength, binding mode, and enantioselectivity will be very important in understanding the mechanism on the interactions and the biological impact of metal complexes.
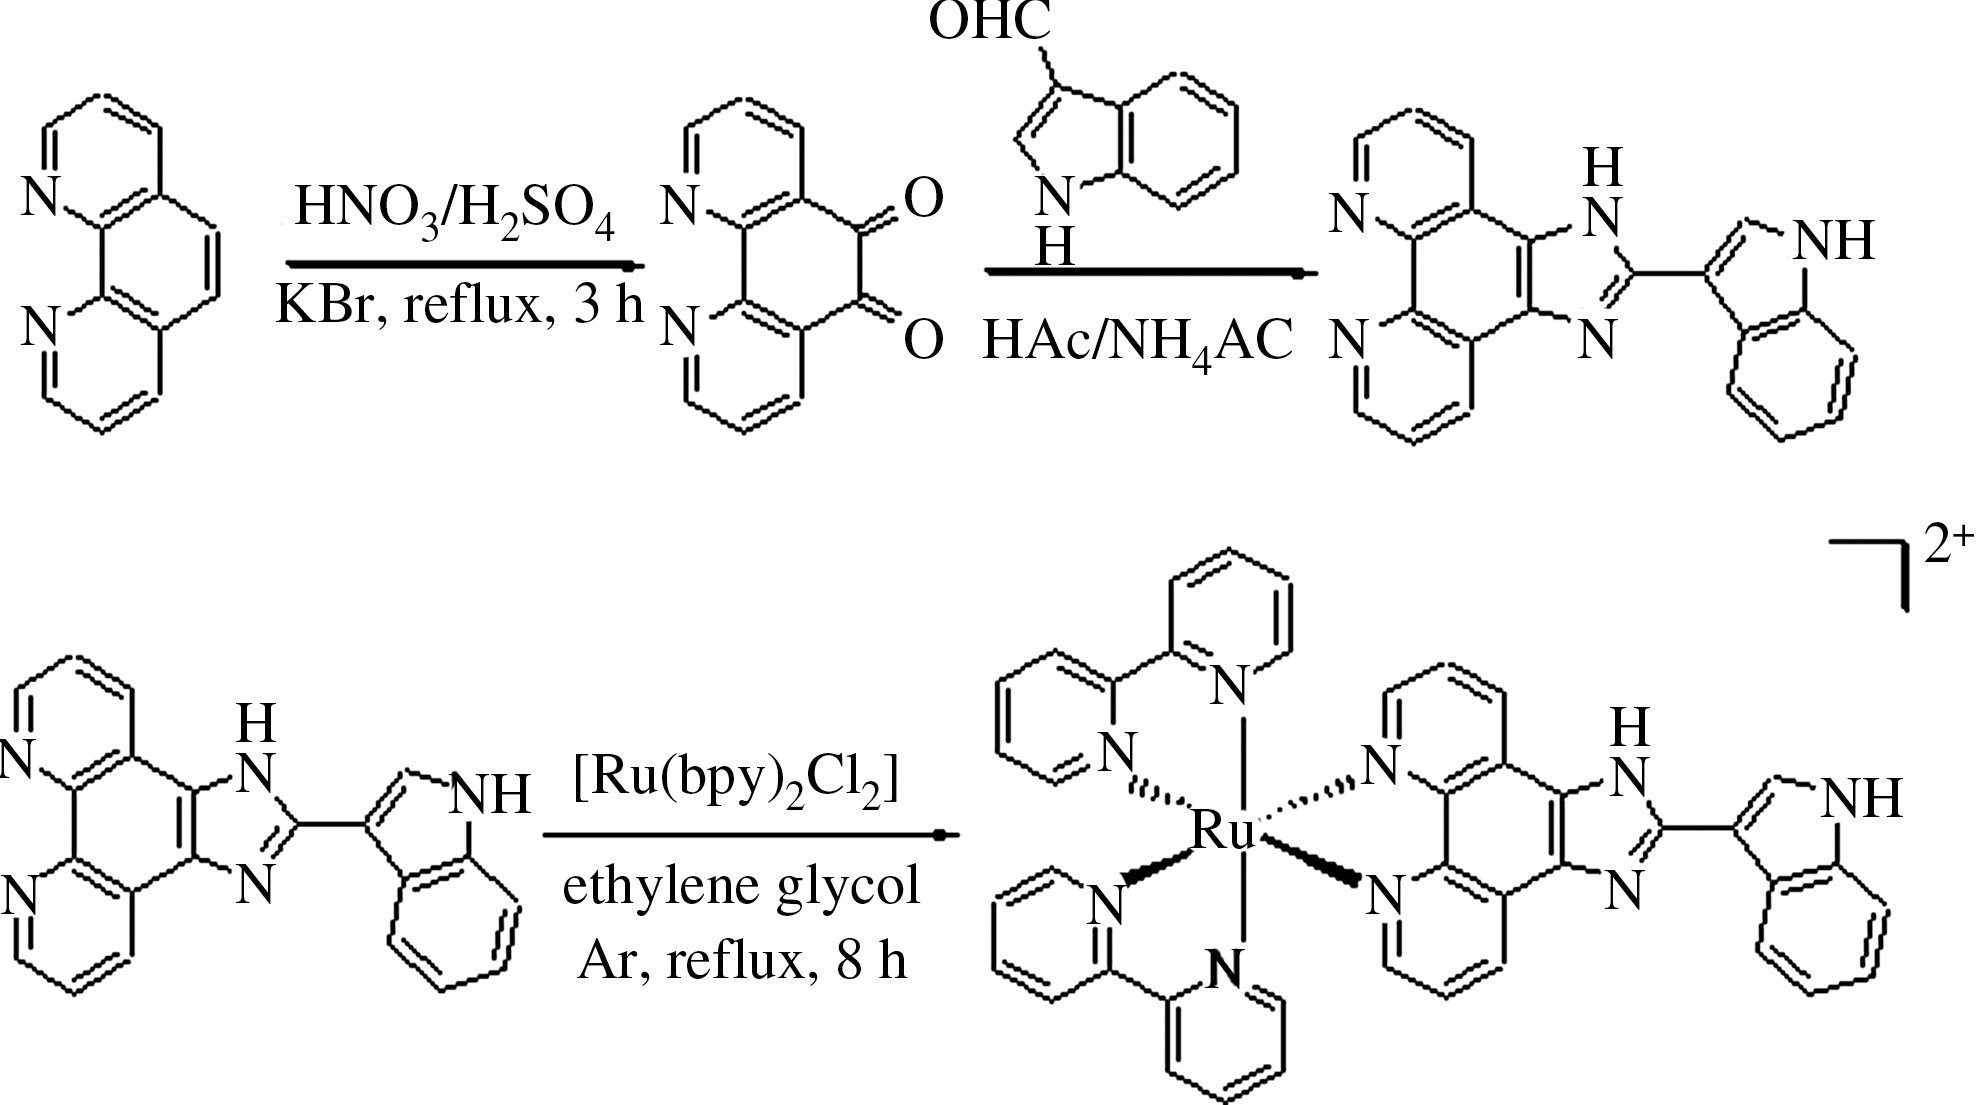
An Ru(II) complex [Ru(bpy)2(H2IIP)]2+ (1) {bpy=2,2′-bipyridine, H2IIP=2-(indole-3-yl)-imidazolo[4,5-f][1,10]phenanthroline} was designed and synthesized (Fig. 1). For complex 1, the ligand H2IIP containing indole and imidazole groups was chosen as the intercalative ligand based on the following reasons. First, the previous studies indicated that complexes containing indole group or imidazole group have anti-bacterial and anti-fungal activity (Mario et al., 2005). Second, the imine (=NH) group in the indole ring might form a hydrogen bond with nucleic base pairs, which could strengthen the interaction between complexes and nucleic acid. In this article, the interactions of complex 1 with CT-DNA and yeast tRNA were investigated by UV-visible spectroscopy, fluorescence spectroscopy, circular dichroism (CD) spectroscopy, and viscosity measurement. The cytotoxicity of complex 1 was evaluated with MTT [MTT=(3-(4,5-dimethylthiazol-2-yl)-2,5-diphenyltetrazolium bromide] and Giemsa staining. We hope the results would be of value in understanding the mechanism of the interactions of metal complexes with nucleic acids, and they should be useful in the development of nucleic acid molecular probes and new therapeutic regents.
Structures and syntheses of ligand H2IIP and complex 1.
Materials and Methods
Materials
All reagents and solvents were purchased commercially and used without further purification unless otherwise noted. CT-DNA and yeast tRNA were obtained from the Sino-American Biotechnology Company. The concentrations of CT-DNA and yeast tRNA solutions were determined at 260 nm by absorption spectroscopy using the molar absorption coefficients of 6600 M−1 cm−1 for CT-DNA (Meadows et al., 1993) and 7700 M−1 cm−1 for yeast tRNA (Reichmann et al., 1954), respectively. Solutions of CT-DNA and yeast tRNA gave ratios of UV absorbance at 260 and 280 nm of over 2.0 and 1.8–1.9, respectively, indicating that both nucleic acids were fully free of protein (Marmur, 1961). Tris–HCl buffer (5 mM Tris–HCl and 50 mM NaCl, pH 7.2) solution was prepared to dissolve CT-DNA, which was used for all spectroscopic studies and viscosity measurements. TE buffer (5 mM Tris–HCl, 0.1 mM EDTA, and pH 7.2) was prepared to dissolve yeast tRNA to avoid the degeneration of RNA induced by metal ions.
Synthesis of ligand H2IIP
A mixture of indole-3-carboxaldehyde (0.29 g, 2.0 mM), ammoniumacetate (3.1 g, 40 mM), 1,10-phenanthroline-5,6-dione (0.42 g, 2.0 mM), and glacial acetic acid (40 mL) was refluxed with moderate stirring at 120°C for 2 h. The cooled solution was filtered and diluted with water (10 mL), then neutralized with concentrated aqueous ammonia. The orange precipitate was collected and recrystallized with acetonitrile to give the pure compound. Yield: 78%, 0.53 g. Anal. Calc. for C21H17N5O2: C, 67.91; H, 4.61; N, 18.86%. Found: C, 67.80; H, 4.71; N, 18.77%. MS (FAB) 336.5 [M+1].
Synthesis of [Ru(bpy)2(H2IIP)](ClO4)2·3H2O (1)
A mixture of cis-[Ru(bpy)2Cl2]·2H2O (104 mg, 0.20 mmol), H2IIP (67 mg, 0.20 mmol) and ethylene glycol (15 mL) was thoroughly deoxygenated. The purple mixture was heated for 8 h at 150°C under argon atmosphere, and the solution finally turned red. After it had been cooled to room temperature and diluted with water (40 mL), saturated aqueous sodium perchlorate (0.20 g) was added under vigorous stirring. The orange precipitate was collected and washed with water, ethanol and diethyl ether then dried under vacuum. Purification by chromatography on a neutral alumina column was performed using a mixture of acetonitrile and ethanol (3:5, v/v) as eluent. Yield: 47%, 97 mg. Anal. Calc. for C41H35N9Cl2O11Ru: C, 49.16; H, 3.52; N, 12.58%. Found: C 48.97; H 3.64; N 12.43%. 1H-NMR (400 MHz), d6-DMSO (dimethyl sulfoxide): δ 11.83 (s, 1H), 9.18 (d, J=8.4 Hz, 1H), 9.09 (d, J=8.0, 1H), 8.87 (d, J=8.4, 2H), 8.83 (d, J=8.4, 2H), 8.65 (d, J=4.0, 1H), 8.36 (d, J=2.4, 1H), 8.22 (t, 2H), 8.10 (t, 2H), 8.03 (q, 2H), 7.86 (d, J=5.2, 2H), 7.35 (t, 2H), 7.56–7.64 (m, 5H), 7.95–7.88 (m, 2H), 7.25–7.30 (m, 2H). Electrospray ionization mass spectrometry (ESI-MS) (positive mode, MeCN): 848.6 ([M-ClO4]+), 748.1 ([M-2ClO4-H]+), 424.7 ([M-2ClO4]2+).
Instrumentation
Microanalyses (C, H, and N) were carried out on a Perkin-Elmer (Shanghai, China) 240Q elemental analyzer. 1H NMR spectra were recorded on a Bruker Avance-400 spectrometer with d6-DMSO as solvent at room temperature and tetramethylsilane as the internal standard. UV-visible spectra were recorded on a Perkin-Elmer Lambda-25 spectrophotometer, and emission spectra were recorded on a Perkin-Elmer LS-55 luminescence spectrometer at room temperature. ESI-MS data were recorded on an LCQ system (Finngan MAT; Thermo Fisher Scientific, Wattham, MA) using CH3CN as the mobile phase. CD spectra were measured on a JASCO-J810 spectropolarimeter.
The nucleic acid-binding experiments were performed at room temperature. The absorption titration of complex 1 in different buffers was performed by using a fixed Ru(II) complex concentration, to which increments of the CT-DNA or yeast tRNA stock solution were added. Complex-DNA or -yeast tRNA solutions were allowed to incubate for 5 min before the absorbance spectra was recorded. The intrinsic binding constant Kb of Ru(II) complex to DNA or RNA was calculated from Eq. (1) (Carter et al., 1989): \documentclass{aastex} \usepackage{amsbsy} \usepackage{amsfonts} \usepackage{amssymb} \usepackage{bm} \usepackage{mathrsfs} \usepackage{pifont} \usepackage{stmaryrd} \usepackage{textcomp} \usepackage{portland, xspace} \usepackage{amsmath, amsxtra} \pagestyle{empty} \DeclareMathSizes {10} {9} {7} {6} \begin{document} \begin{align*} \begin{split} pc (\varepsilon_{\rm a} - \varepsilon_{\rm f}) / (\varepsilon_{\rm b} - \varepsilon_{\rm f}) = \\ (b - (b^2 - 2K_{\rm b}{^2} C_{\rm t} [\hbox{Nucleic acid}] / s) ^{1 / 2} / (2K_{\rm b}C_{\rm t})\end{split} \tag{1\rm a} \end{align*} \end{document} \documentclass{aastex} \usepackage{amsbsy} \usepackage{amsfonts} \usepackage{amssymb} \usepackage{bm} \usepackage{mathrsfs} \usepackage{pifont} \usepackage{stmaryrd} \usepackage{textcomp} \usepackage{portland, xspace} \usepackage{amsmath, amsxtra} \pagestyle{empty} \DeclareMathSizes {10} {9} {7} {6} \begin{document} \begin{align*} b = 1 + K_{\rm b} C_{\rm t} + K_{\rm b} [\hbox{\rm Nucleic acid}]/ (2s) \tag{1\rm b} \end{align*} \end{document}
where [Nucleic acid] is the concentration of CT-DNA or yeast tRNA in base pairs, the apparent absorption coefficients ɛa, ɛf, and ɛb correspond to Aobsd/[Ru], the absorbance for the free Ru(II) complex, and the absorbance for the Ru(II) complex in the fully bound form, respectively. Kb is the equilibrium binding constant in M−1, Ct is the total metal complex concentration, and s is the binding size.
For the steady-state emission quenching experiment, [Fe(CN)6]4− (potassium ferrocyanide) was used as quencher. According to the classical Stern–Volmer equation (2) (Lakowicz and Weber, 1973): \documentclass{aastex} \usepackage{amsbsy} \usepackage{amsfonts} \usepackage{amssymb} \usepackage{bm} \usepackage{mathrsfs} \usepackage{pifont} \usepackage{stmaryrd} \usepackage{textcomp} \usepackage{portland, xspace} \usepackage{amsmath, amsxtra} \pagestyle{empty} \DeclareMathSizes {10} {9} {7} {6} \begin{document} \begin{align*} I / I_0 = 1 + K_{\rm sv}r \tag{2} \end{align*} \end{document}
where I0 and I are the luminescence intensities in the absence and presence of [Fe(CN)6]4−, respectively. Ksv is a linear Stern–Volmer quenching constant dependent on the ratio of the bound concentration of complex 1 to the concentration of DNA, r is the concentration of the quencher [Fe(CN)6]4−. In the plot of I0/I versus r, the Stern–Volmer quenching constant Ksv is derived from the slope.
Viscosity measurements were carried out using an Ubbelodhe viscometer maintained at a constant temperature at 28.0 (±0.1)°C in a thermostatic bath. DNA samples with ∼200 base pairs in average length were prepared by sonicating to minimize complexities arising from DNA flexibility (Chaires et al., 1982). Flow time was measured with a digital stopwatch, each sample was measured three times, and an average flow time calculated. Data were presented as (η/η0)1/3 versus binding ratio (Cohen and Eisenberg, 1969), where η is the viscosity of DNA in the presence of the complex and η0 is the viscosity of DNA alone.
Equilibrium dialyses were conducted at ambient temperature with 10 mL DNA or RNA (1.0 mM) sealed in a dialysis bag and 10 mL of the complex (20 μM) outside the bag, and the system was agitated on a shaker bath. After 32 h, the CD spectrum of the dialysate outside the bag was measured on a JASCO-J810 spectropolarimeter.
Standard 3-(4,5-dimethylthiazole)-2,5-diphenyltetraazolium bromide (MTT) assay procedures were used (Mosmann, 1983). Human hepatoma Hep-G2 cells and human leukemia HL-60 cells were cultured in Dulbecco's modified Eagle's medium with 10% (v/v) fetal bovine serum, 100 units/mL penicillin, and 100 μg/mL streptomycin at 37 °C in a humidified atmosphere (90%) containing 5% CO2. For MTT assay, cells were seeded in 96-well microassay culture plates at a density of 20–30 cells/μL (volume of 200 μL/well) and incubated overnight at 37°C in a 5% CO2 incubator. Test complexes were then added to the wells to achieve final concentrations ranging from 10−6 to 10−4 M. Control wells were prepared by addition of culture medium (200 μL). Wells containing culture medium without cells were used as blanks. The plates were incubated at 37°C in a 5% CO2 incubator for 48 h. After incubation, stock MTT dye solution (20 μL, 5 mg/mL) was added to each well. After 4 h incubation, N,N-dimethylformamide (150 μL) was added to solubilize the MTT formazan. The optical density of each well was then measured on a microplate spectrophotometer at a wavelength of 490 nm. IC50 values of the target compounds were calculated using sigmaplot software and expressed as mean±S.D. of triplicate experiments.
To detect apoptosis, Hep-G2 cells treated with test compounds for 48 h were stained with Giemsa stain and then observed by microscopy for signs of apoptosis including nuclear condensation, cell shrinkage, and formation of apoptotic bodies.
Results
Synthesis and characterization
The synthetic routes to the ligand H2IIP and complex 1 are presented in Figure 1. H2IIP was synthesized on the basis of the method for imidazole ring preparation established by Steck and Day (1943). Then, complex 1 was prepared in yields of 78% by direct reaction of H2IIP with cis-[Ru(bpy)2Cl2]·2H2O in ethylene glycol. The Ru(II) complex was isolated as the corresponding perchlorates and then purified by column chromatography. Each synthetic step involved is straightforward and provides a relatively high yield of the desired product in pure form.
In the ESI-MS spectra of complex 1, three signals of [M-ClO4]+, [M-2ClO4-H+]+, and [M−2ClO4]2+ were observed, and the determined molecular weights are consistent with expected values. The structure of complex 1 was also confirmed by 1H NMR. For complex 1, two sets of NMR signals were observed, one set corresponds to the ancillary ligand (bpy), and the other set corresponds to the intercalative ligand H2IIP. The chemical shifts of protons on the nitrogen atom of the imidazole are not observed for complex 1, probably because the protons are exchanged quickly between the two nitrogens of the imidazole ring in solution.
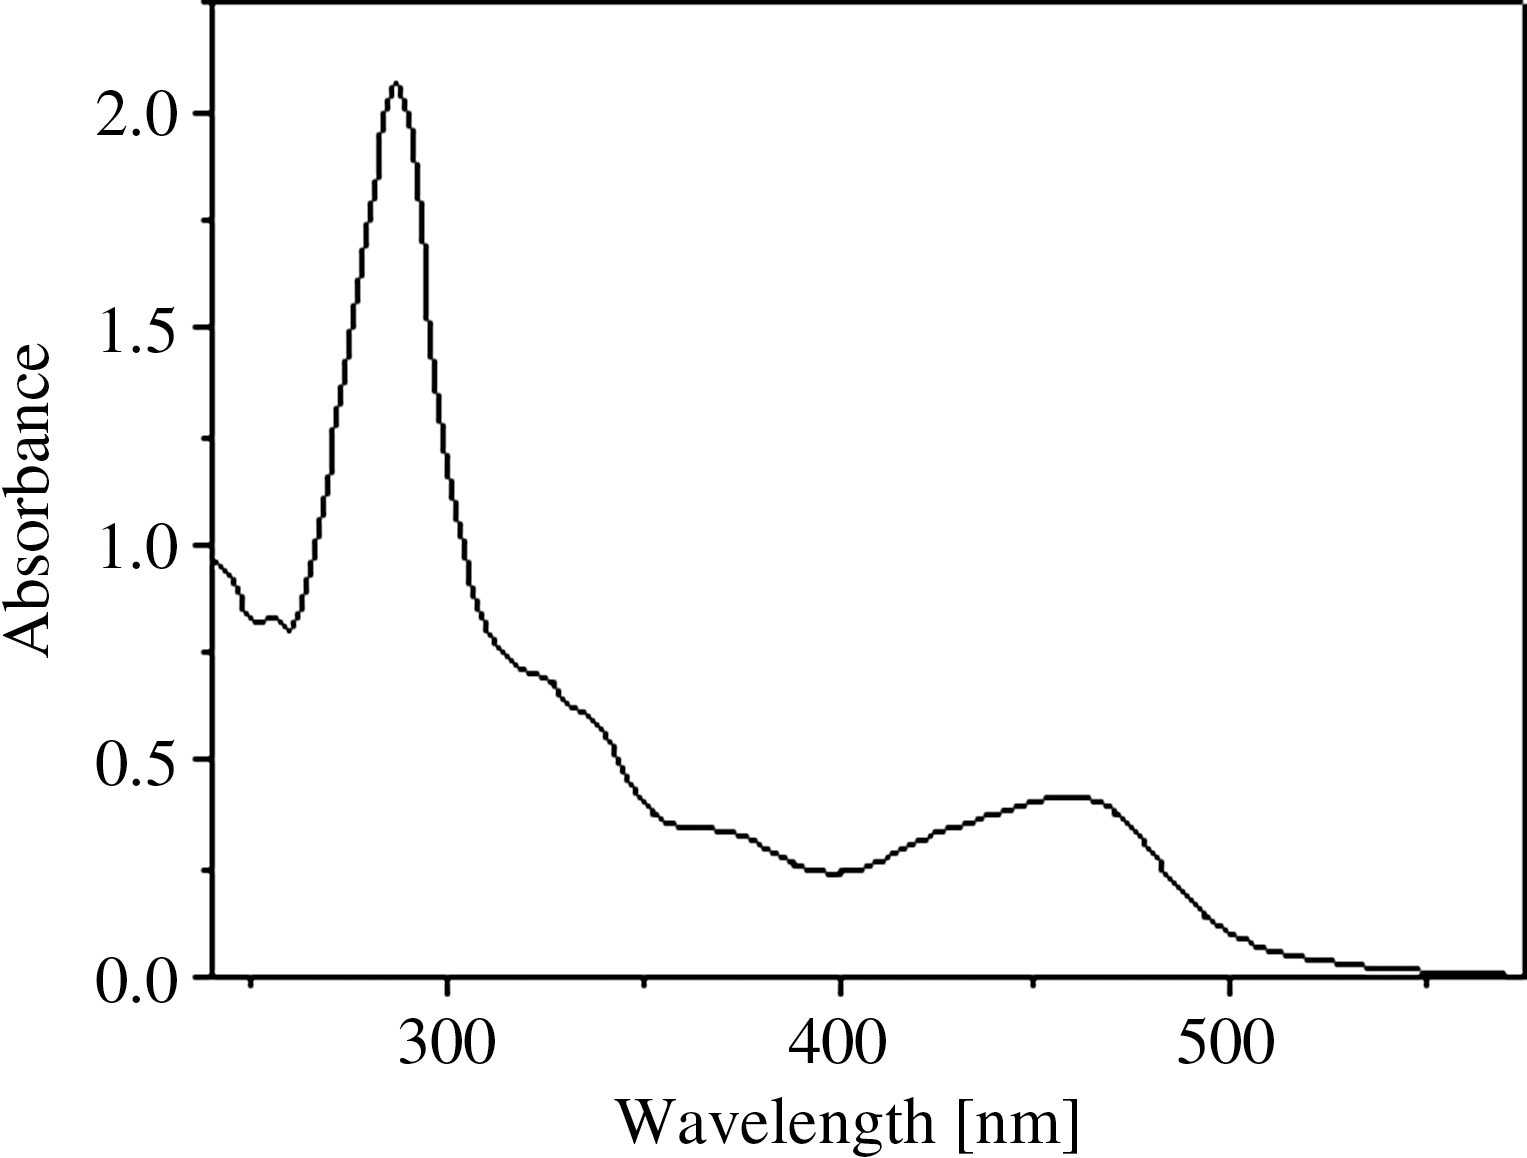
The absorption spectra of complex 1 shows two well-resolved bands in the range 200–600 nm (Fig. 2), characterized by intense π→π* ligand transitions in the UV region, as well as by metal-to-ligand charge transfer (MLCT) transition in the visible region. The broad MLCT absorption band appears at 458 nm for complex 1, which was attributed to Ru(dπ)→H2IIP(π*) transition. This band is bathochromically shifted relative to those of [Ru(phen)3]2+ (448 nm) (Liu et al., 2001a) and [Ru(bpy)3]2+ (452 nm) (Bryant et al., 1971). The peak at 278 nm is assigned to internal π→π* transition of bpy and H2IIP (Bryant et al., 1971; Liu et al., 2001a).
Absorbance of complex 1 in CH3CN at room temperature.
Absorption titration
The application of electronic absorption spectroscopy in nucleic acid binding studies is a useful technique (Xu et al., 2003a). In the presence of DNA or RNA, the electronic absorption spectroscopy of the complex is perturbed due to the stacking interactions between the aromatic chromophore of the intercalative ligand in the complex and the base pairs of DNA or RNA. Therefore, complexes binding with nucleic acid through intercalation usually result in hypochromism and bathochromism.
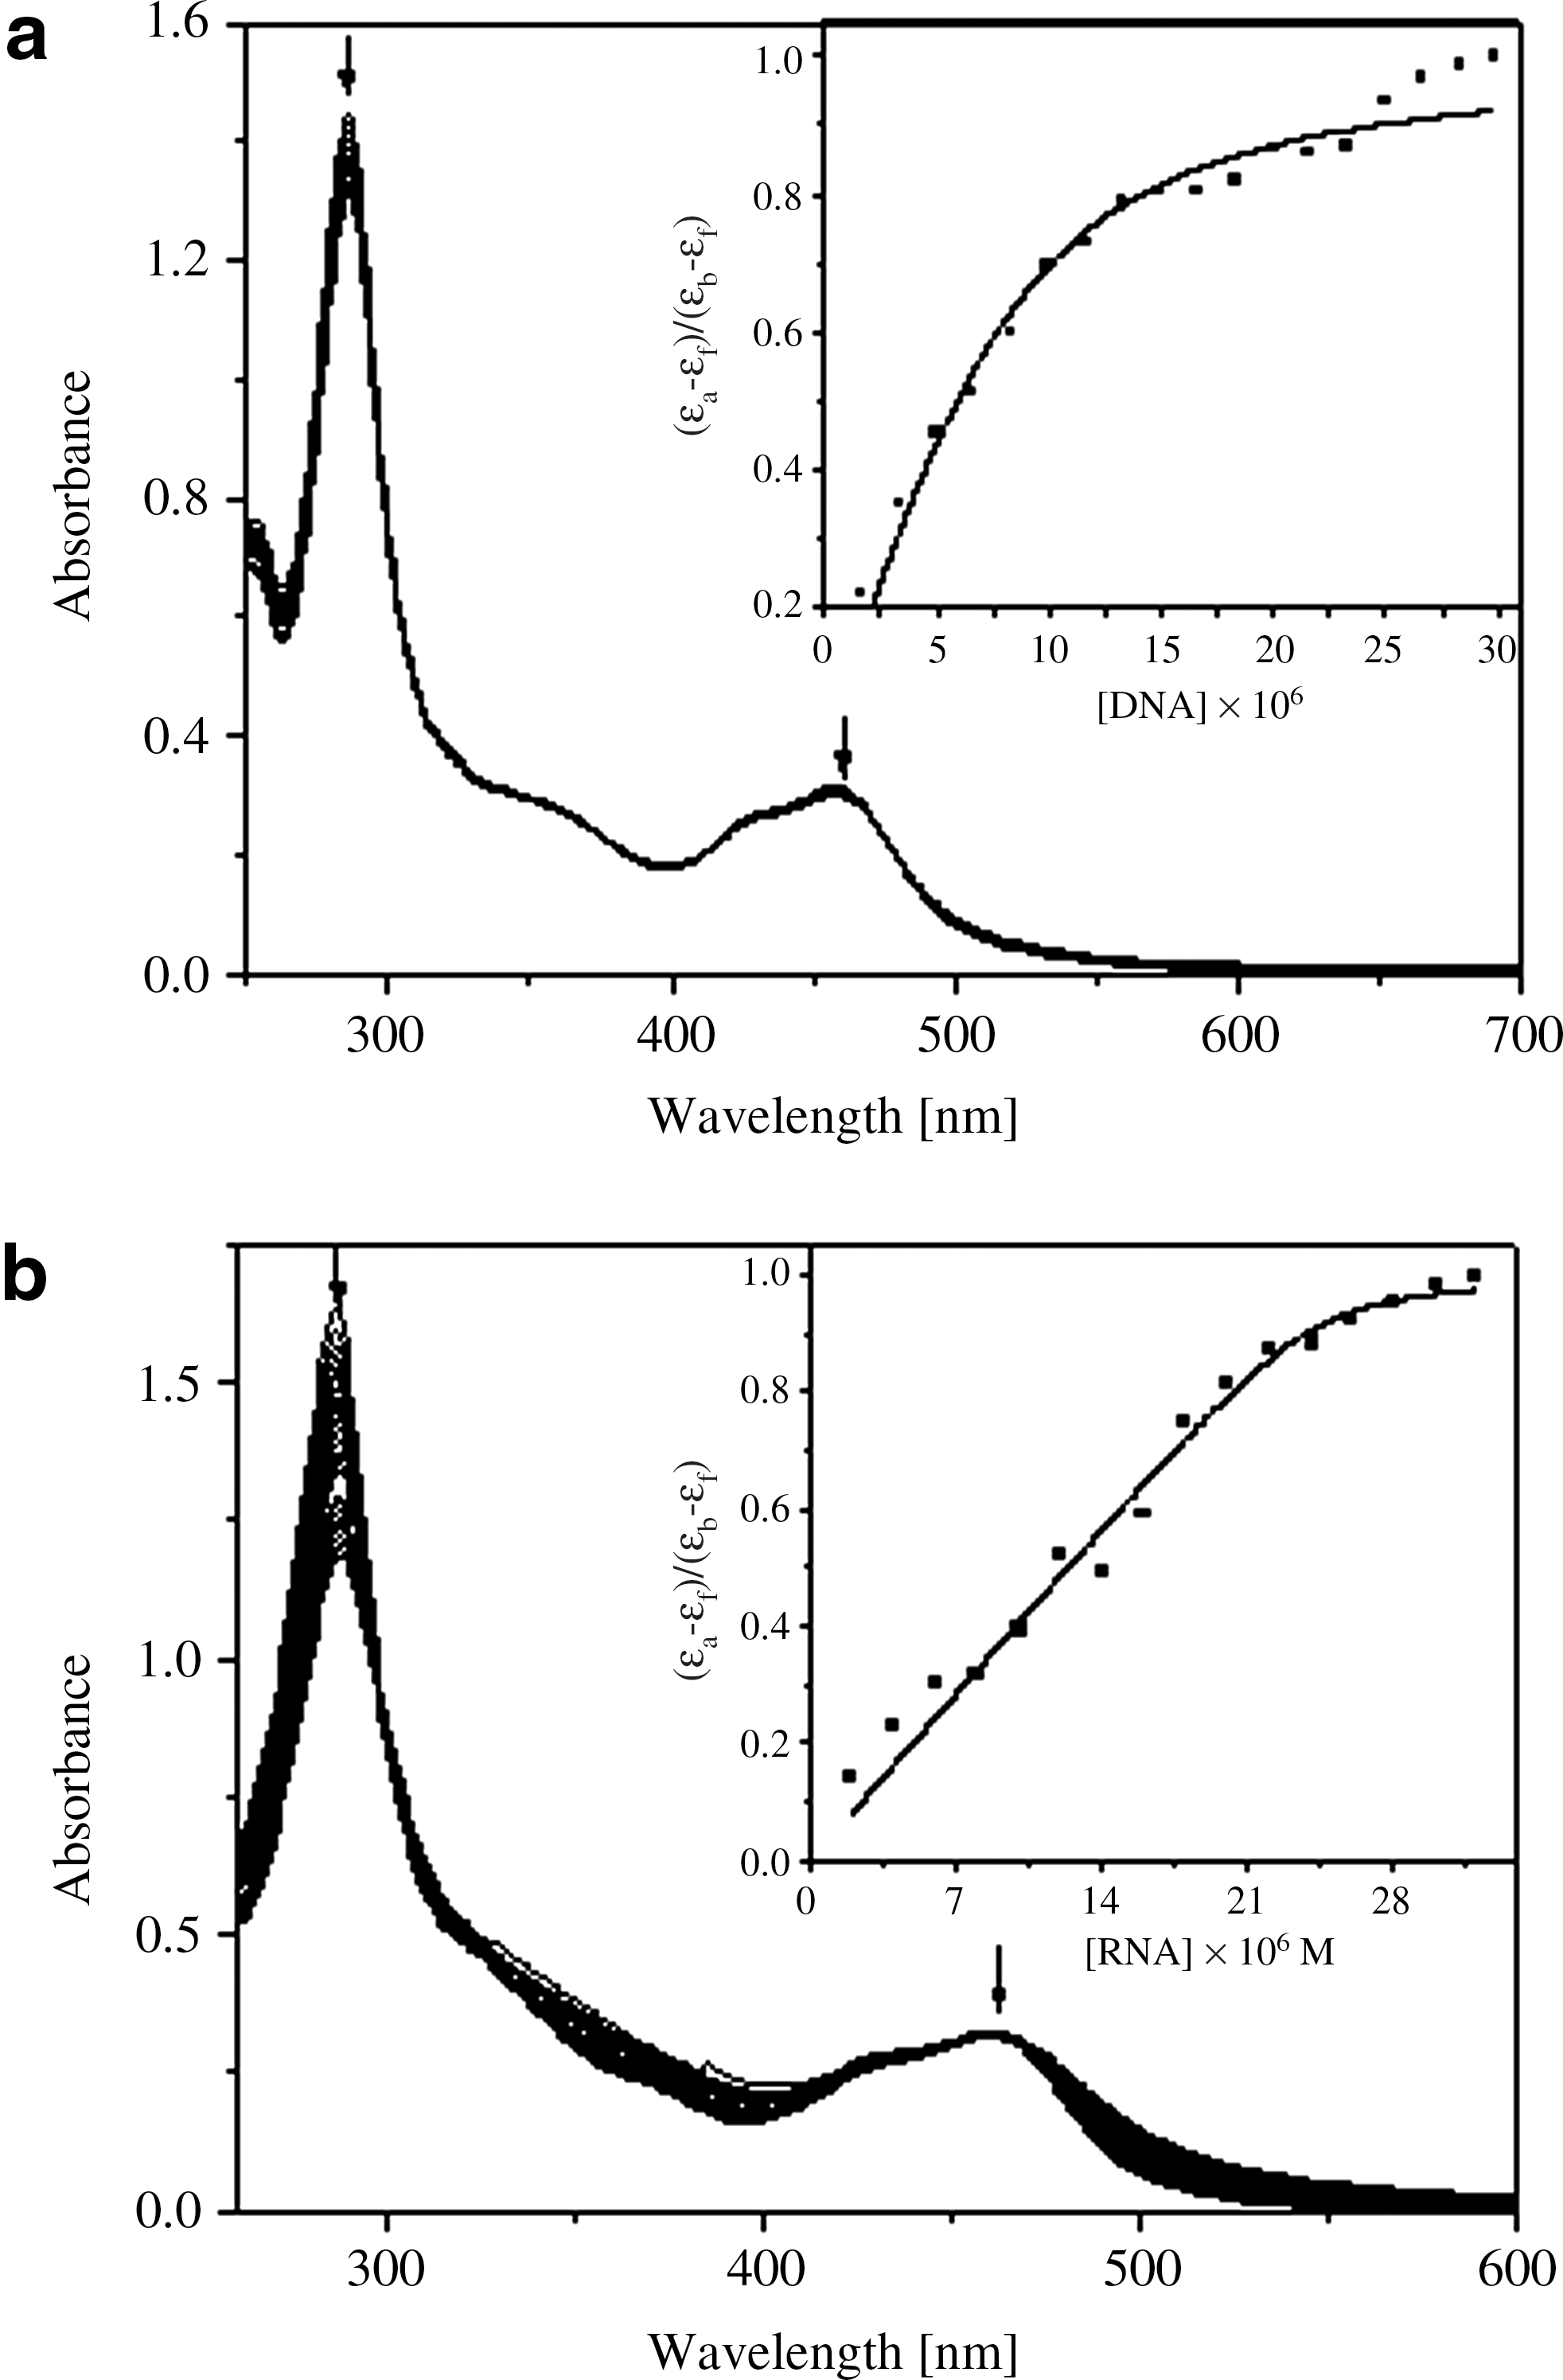
The UV-visible spectra of complex 1 titrated with CT-DNA or yeast tRNA are given in Figure 3. Figure 3 indicates that increasing of the concentration of CT-DNA or yeast tRNA results in spectra hypochromism and red shift. For CT-DNA binding with complex 1, the hypochromism reaches as high as 7.7% and 24.9% at a ratio of [DNA]/[Ru] of 2.3 at 457 nm and 286 nm respectively. For yeast tRNA binding with complex 1, the UV-visible spectra indicate that addition of yeast tRNA to complex 1 yields hypochromism about 3.5% and 27.3% at a [DNA]/[Ru] ratio of 1.6 in the MLCT (MLCT) band at 460 nm and the IL (internal ligand) band at 286 nm respectively. Obviously, these spectral characteristics suggested that complex 1 could interact with yeast tRNA and CT-DNA.
UV-visible spectra of complex 1 in different buffers after the addition of calf thymus DNA (CT-DNA) (a) and yeast tRNA (b). [complex 1]=2.0×10⁻⁵ M, [DNA]=(0–4.66)×10−5 M. [RNA]=(0–3.22)×10−5 M. Arrow shows the absorbance changing with increasing DNA and RNA concentrations. Inset: plots of (ɛa−ɛf)/(ɛb−ɛf) [in (M)2 cm] versus [Nucleic acid] (in M) for the titration of DNA and RNA, respectively, with complex 1 for the determination of the binding constant Kb at 286 nm.
To compare the affinity of complex 1 binding with CT-DNA and yeast tRNA quantitatively, the intrinsic binding-constant values (Kb) were determined by monitoring the changes of absorption at the IL band position using Eq.(1). The intrinsic binding constants Kb of complex 1 binding with CT-DNA and yeast tRNA are (2.03±0.60)×105 M−1 and (5.68±0.39)×106 M−1 respectively.
Fluorescence spectroscopic studies
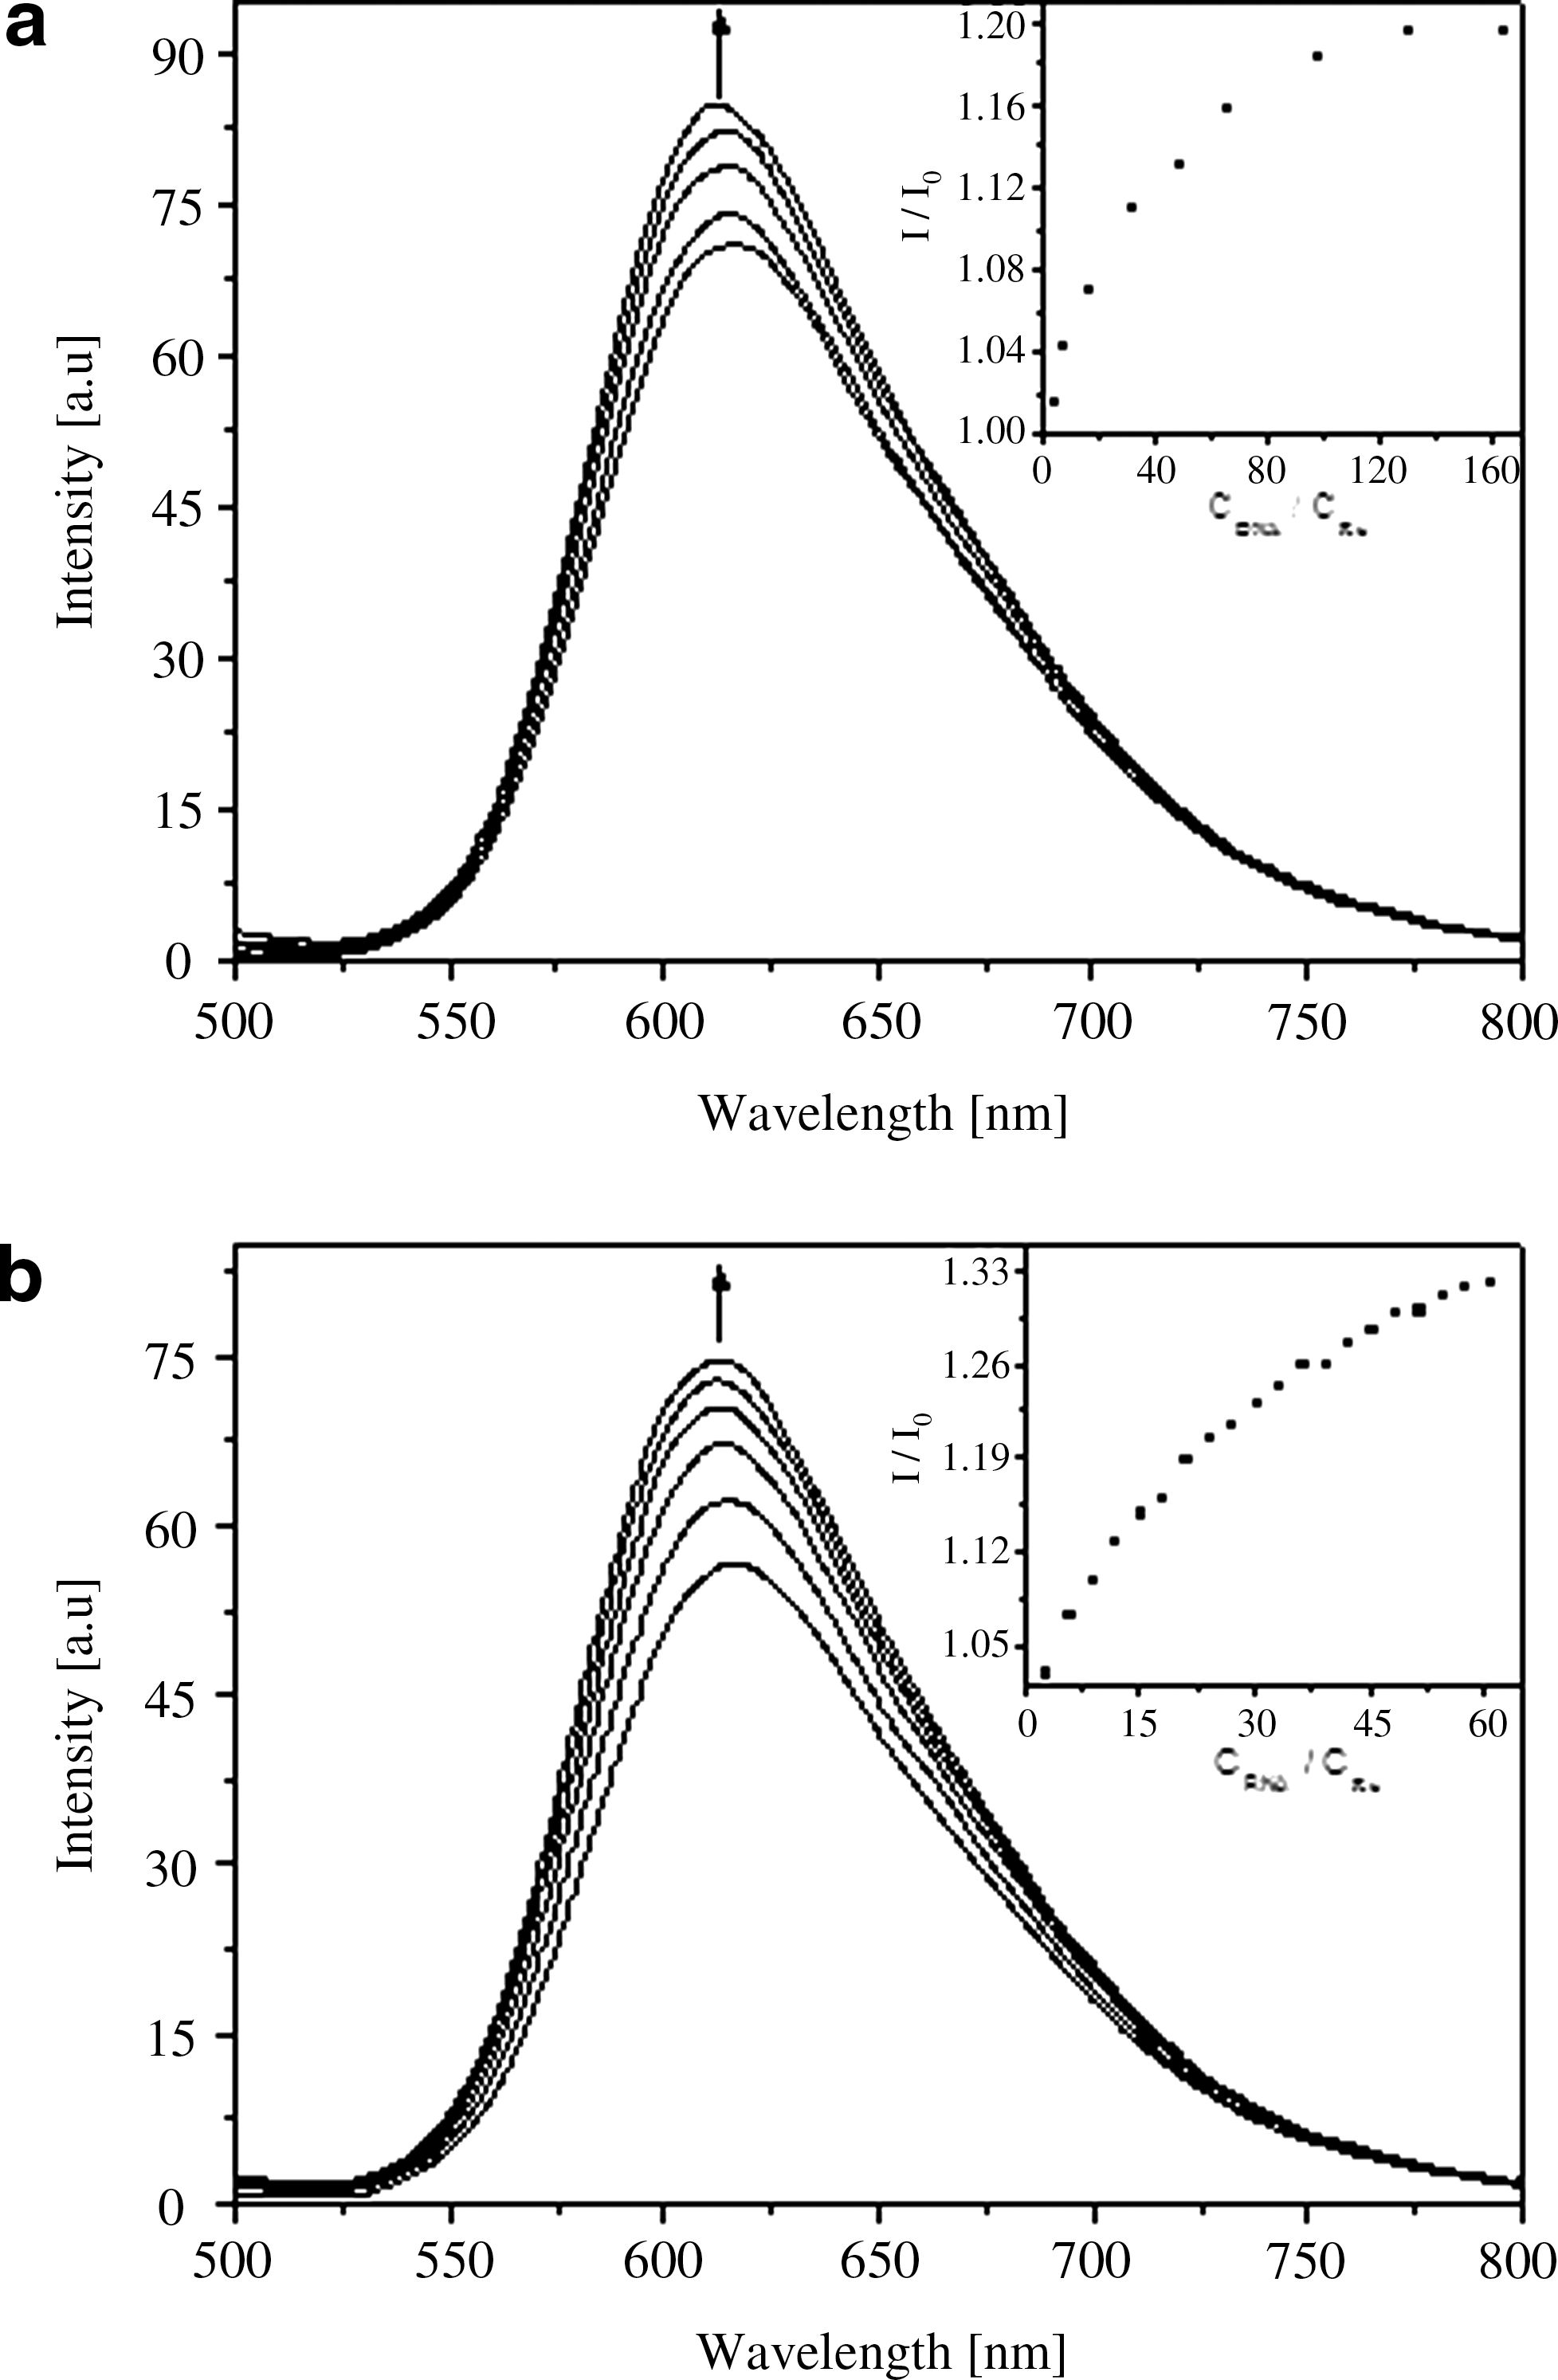
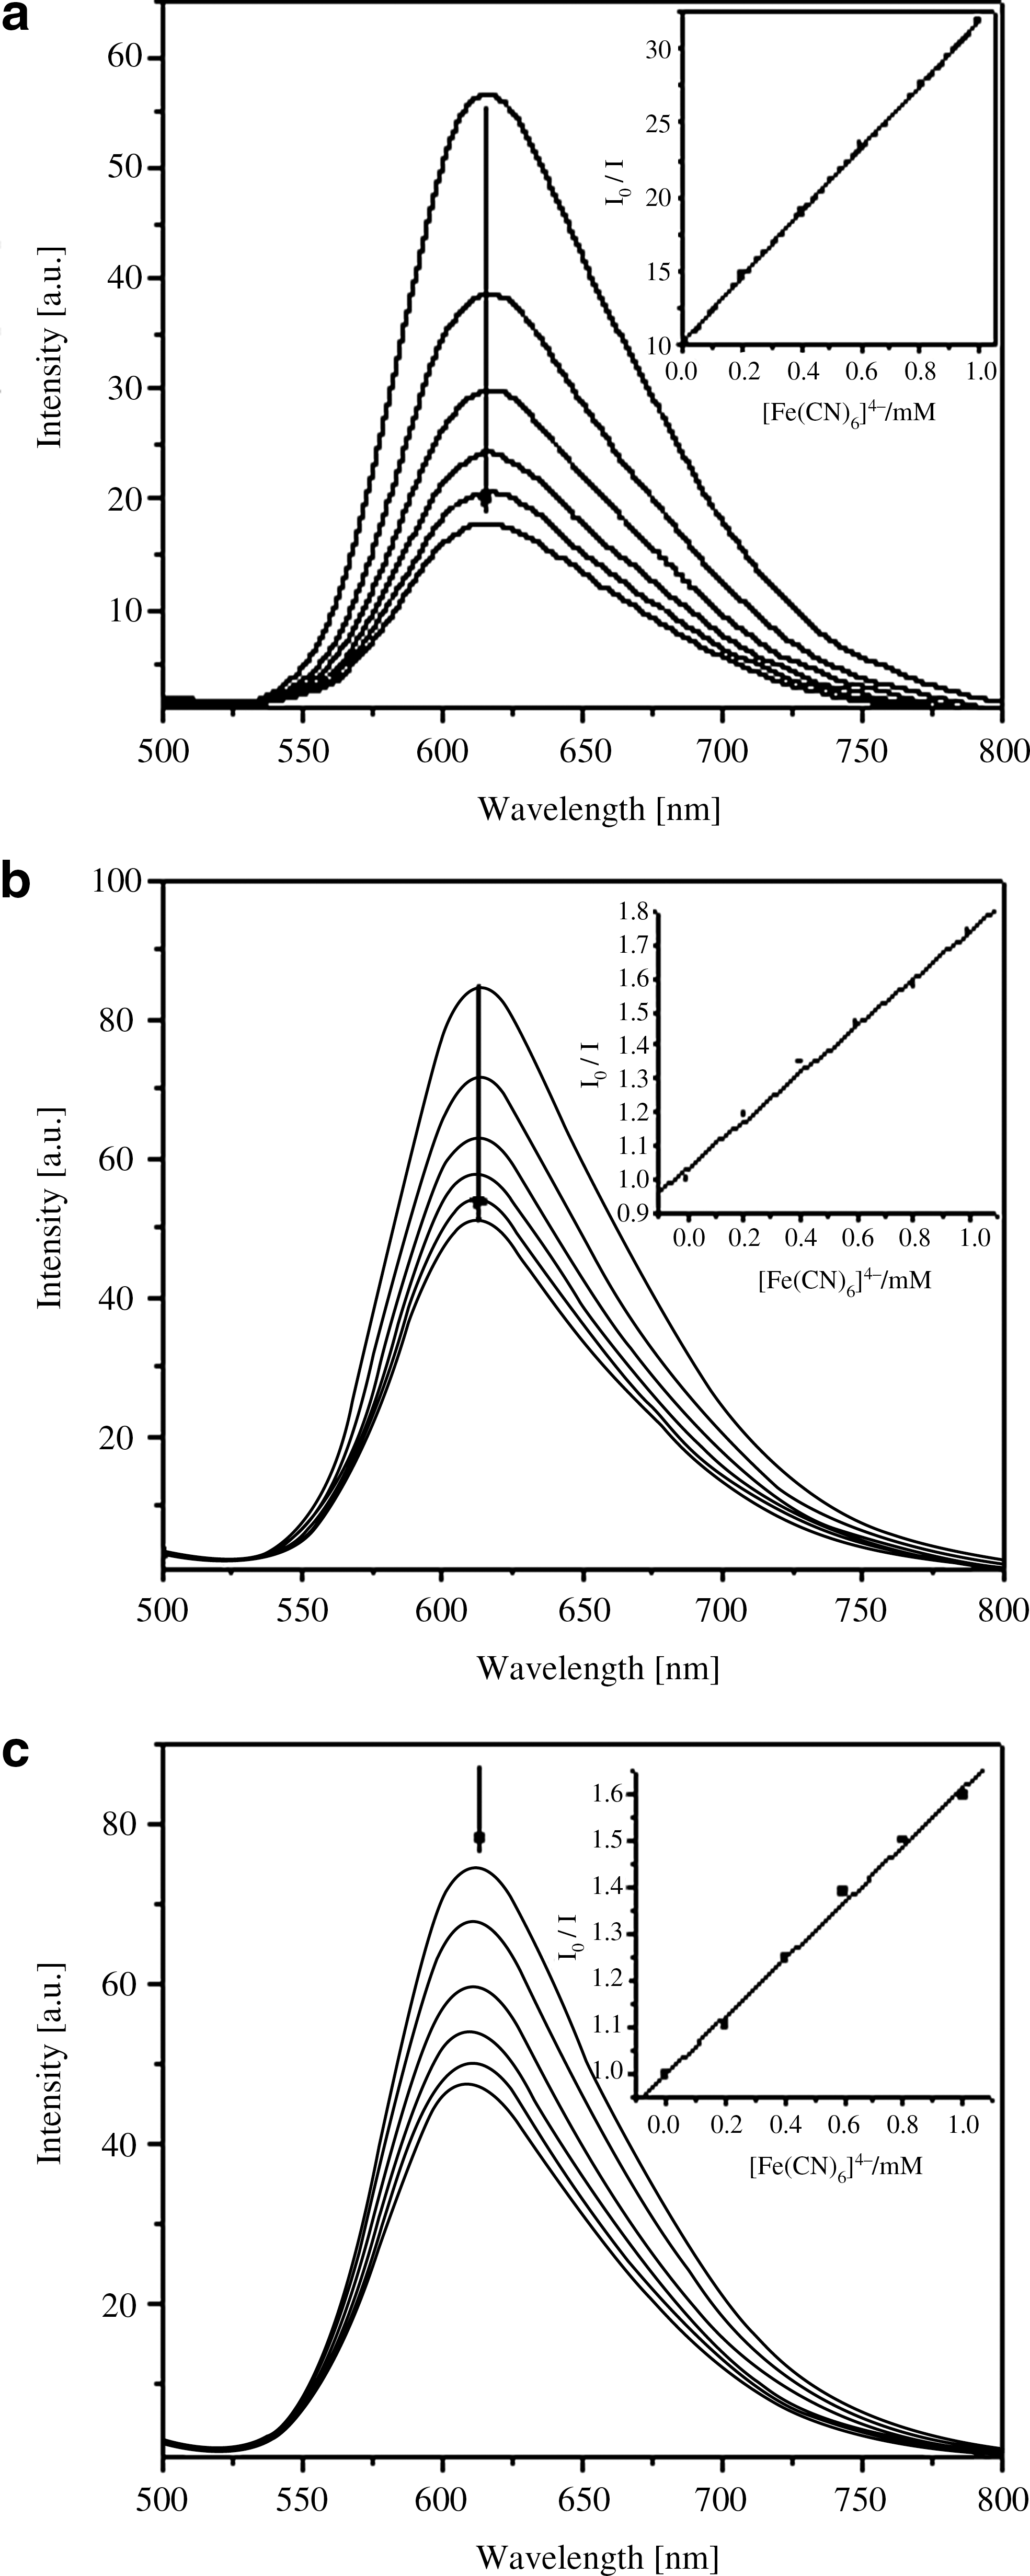
Luminescence spectroscopy is one of the most common and sensitive ways to analyze drug–nucleic acid interactions. The results of the emission titration of complex 1 with CT-DNA and yeast tRNA are illustrated in Figure 4. Complex 1 can emit luminescence in buffers at ambient temperature with a maximum appearing at about 612 nm on excitation using a wavelength of 462 nm. On addition of CT-DNA (Fig. 4a), the emission intensity increases by a factor of ca. 1.20 and saturates at a [DNA]/[Ru] ratio of 131.5. However, on addition of yeast tRNA (Fig. 4b), the fluorescence-emission intensity increases by a factor of ca. 1.34 and saturates at an [RNA]/[Ru] ratio of 60.5. The steady-state emission quenching experiments using K4[Fe(CN)6] as quencher is illustrated in Figure 5. Figure 5 indicates that in the presence of yeast tRNA and CT-DNA, the quenching constants Ksv are 0.62 M−1 and 0.70 M−1, the final fluorescence intensities are 64.5.7% and 59.1%, respectively.
Emission spectra of complex 1 in different buffers at room temperature in the absence and presence of CT-DNA (a) and yeast tRNA (b) respectively. [Complex 1]=2.0×10⁻⁶ M, [DNA]=(0–2.63)×10−4 M, [RNA]=(0–1.21)×10−4 M. Arrow shows the intensity changing with increasing DNA and RNA concentrations. Inset: plots of relative integrated emission intensity versus [DNA]/[complex 1] and [RNA]/[complex 1], respectively.
Emission quenching with [Fe(CN)6]4− for the complex in the absence (a) and presence of CT-DNA (b) and RNA (c), respectively. [Complex 1]=2.0×10⁻⁶ M, [DNA]/[complex 1]=[RNA]/[complex 1]=40, [Fe(CN)6]4−=(0–1.0) mM, where I0 and I are the fluorescence intensities in the absence and the presence of the quencher, respectively. Inset: plots of I0/I versus [Fe(CN)6]4−.
Viscosity measurements
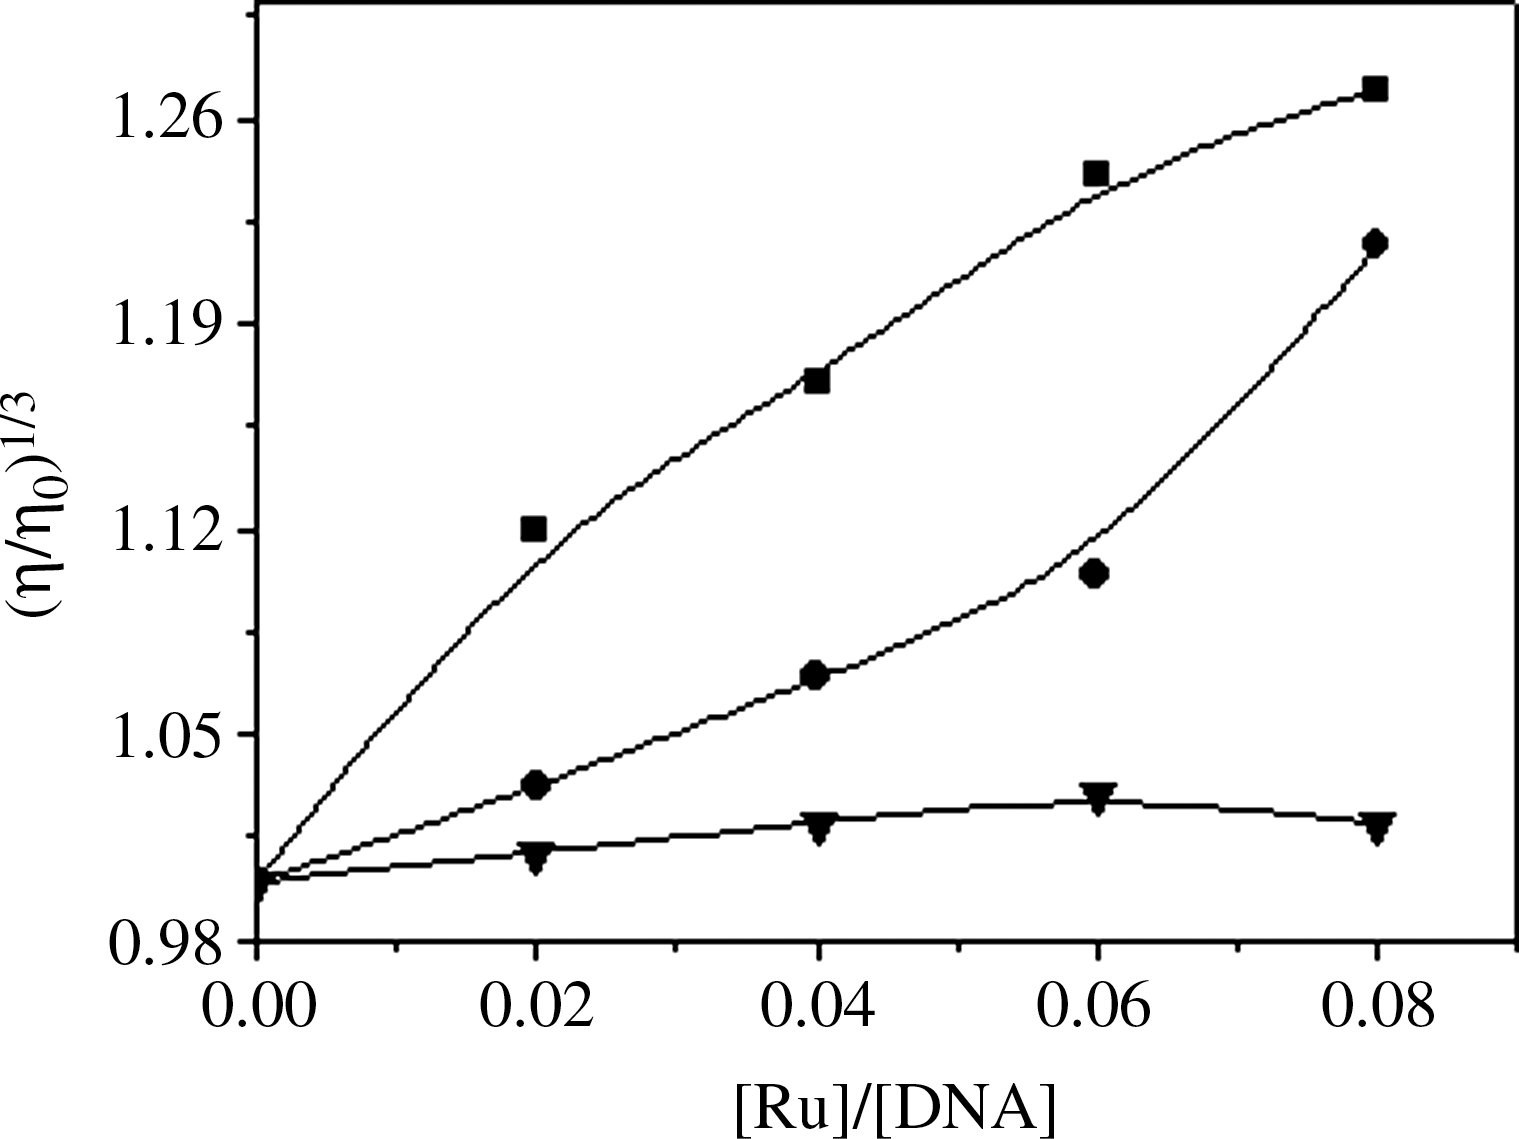
Figure 6 shows the viscosity of CT-DNA after addition of different concentrations of ethidium bromide (EB), [Ru(bpy)3]2+ and [Ru(bpy)2(H2IIP)]2+. With increasing amounts of complex 1, the relative viscosity of DNA increases steadily, which is similar to the behavior of EB. The increased degree of viscosity, which may depend on its affinity to DNA, follows the order EB>complex 1>[Ru(bpy)3]2+. However, no obvious change in flow time is observed for yeast tRNA in the presence of complex 1.
Effect of increasing amounts of ethidium bromide (▪), [Ru(bpy)3]2+ (▾) and complex 1 (•) on the relative viscosity of CT-DNA at (28±0.1)°C. The total concentration of DNA is 0.5 mM.
Enantioselective binding
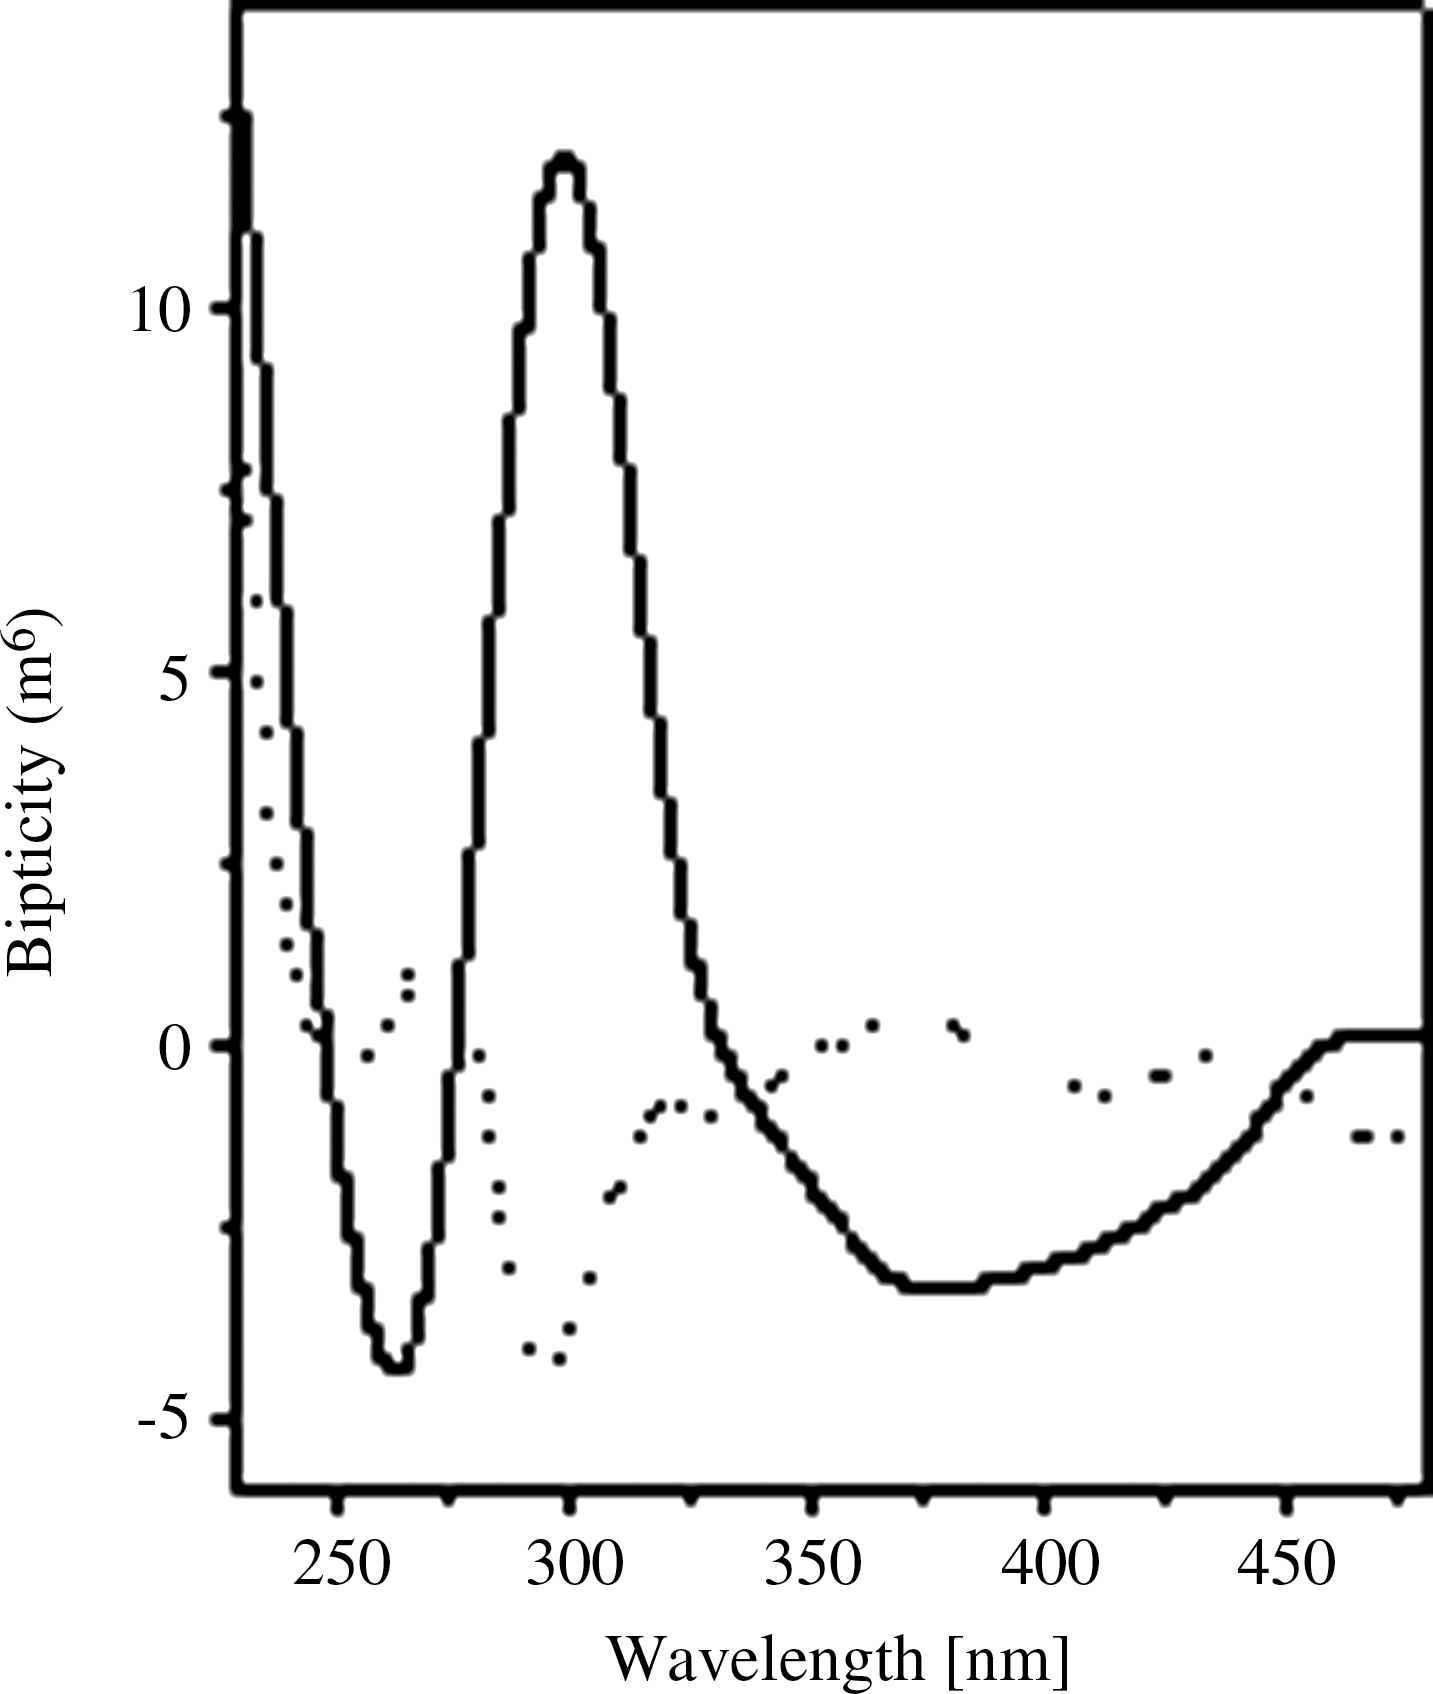
Equilibrium dialysis experiments examine the enantioselectivity of complexes binding to nucleic acid (Liu et al., 2001a). Racemic solutions of complex 1 were dialyzed against CT-DNA or yeast tRNA for 32 h, and then subjected to CD analysis. During the course of the dialysis, the CD signals started from none, increased to the maximum magnitude after 32 h dialysis of the complex, and then no longer changed. The CD spectra in the region of 230–480 nm for complex 1 dialyzed against CT-DNA and yeast tRNA are shown in Figure 7. Figure 7 shows that complex 1 dialyzed against CT-DNA produced one distinct set of CD signals, with a positive peak at about 271 nm and a negative peak at about 296 nm; however, the dialysates of complex 1 dialyzed against yeast tRNA showed another set of CD signals, with a negative peak at about 263 nm and a positive peak at about 298 nm. Further, the CD signals for the dialysate of complex 1 dialyzed against yeast tRNA were stronger than those for the complex dialyzed against CT-DNA.
Circular dichroism spectra of complex 1 after 32 h of dialysis against CT-DNA (dotted line) and yeast tRNA (solid line), respectively, in stirred aqueous solution.
in vitro cytotoxicity
The MTT test, which measures mitochondrial dehydrogenase activity as an indication of cell viability, was performed on two tumor cell lines (HL-60 and Hep-G2). cis-Pt(NH3)2Cl2 was included as the control, and it showed high cytotoxicity in accordance with published reports (Jiang et al., 2009). The solubility of complex 1 is limited in water, so a DMSO solution was used and blank samples containing the same amount of DMSO were included as a control. The effects of complex 1 are expressed as corrected % inhibition values according to the following equation (3) (Blanca et al., 2007): \documentclass{aastex} \usepackage{amsbsy} \usepackage{amsfonts} \usepackage{amssymb} \usepackage{bm} \usepackage{mathrsfs} \usepackage{pifont} \usepackage{stmaryrd} \usepackage{textcomp} \usepackage{portland, xspace} \usepackage{amsmath, amsxtra} \pagestyle{empty} \DeclareMathSizes {10} {9} {7} {6} \begin{document} \begin{align*} \% \ {\rm inhibition}_{\rm corr} = [1 - (T / C)] \times 100\% \tag{3} \end{align*} \end{document}
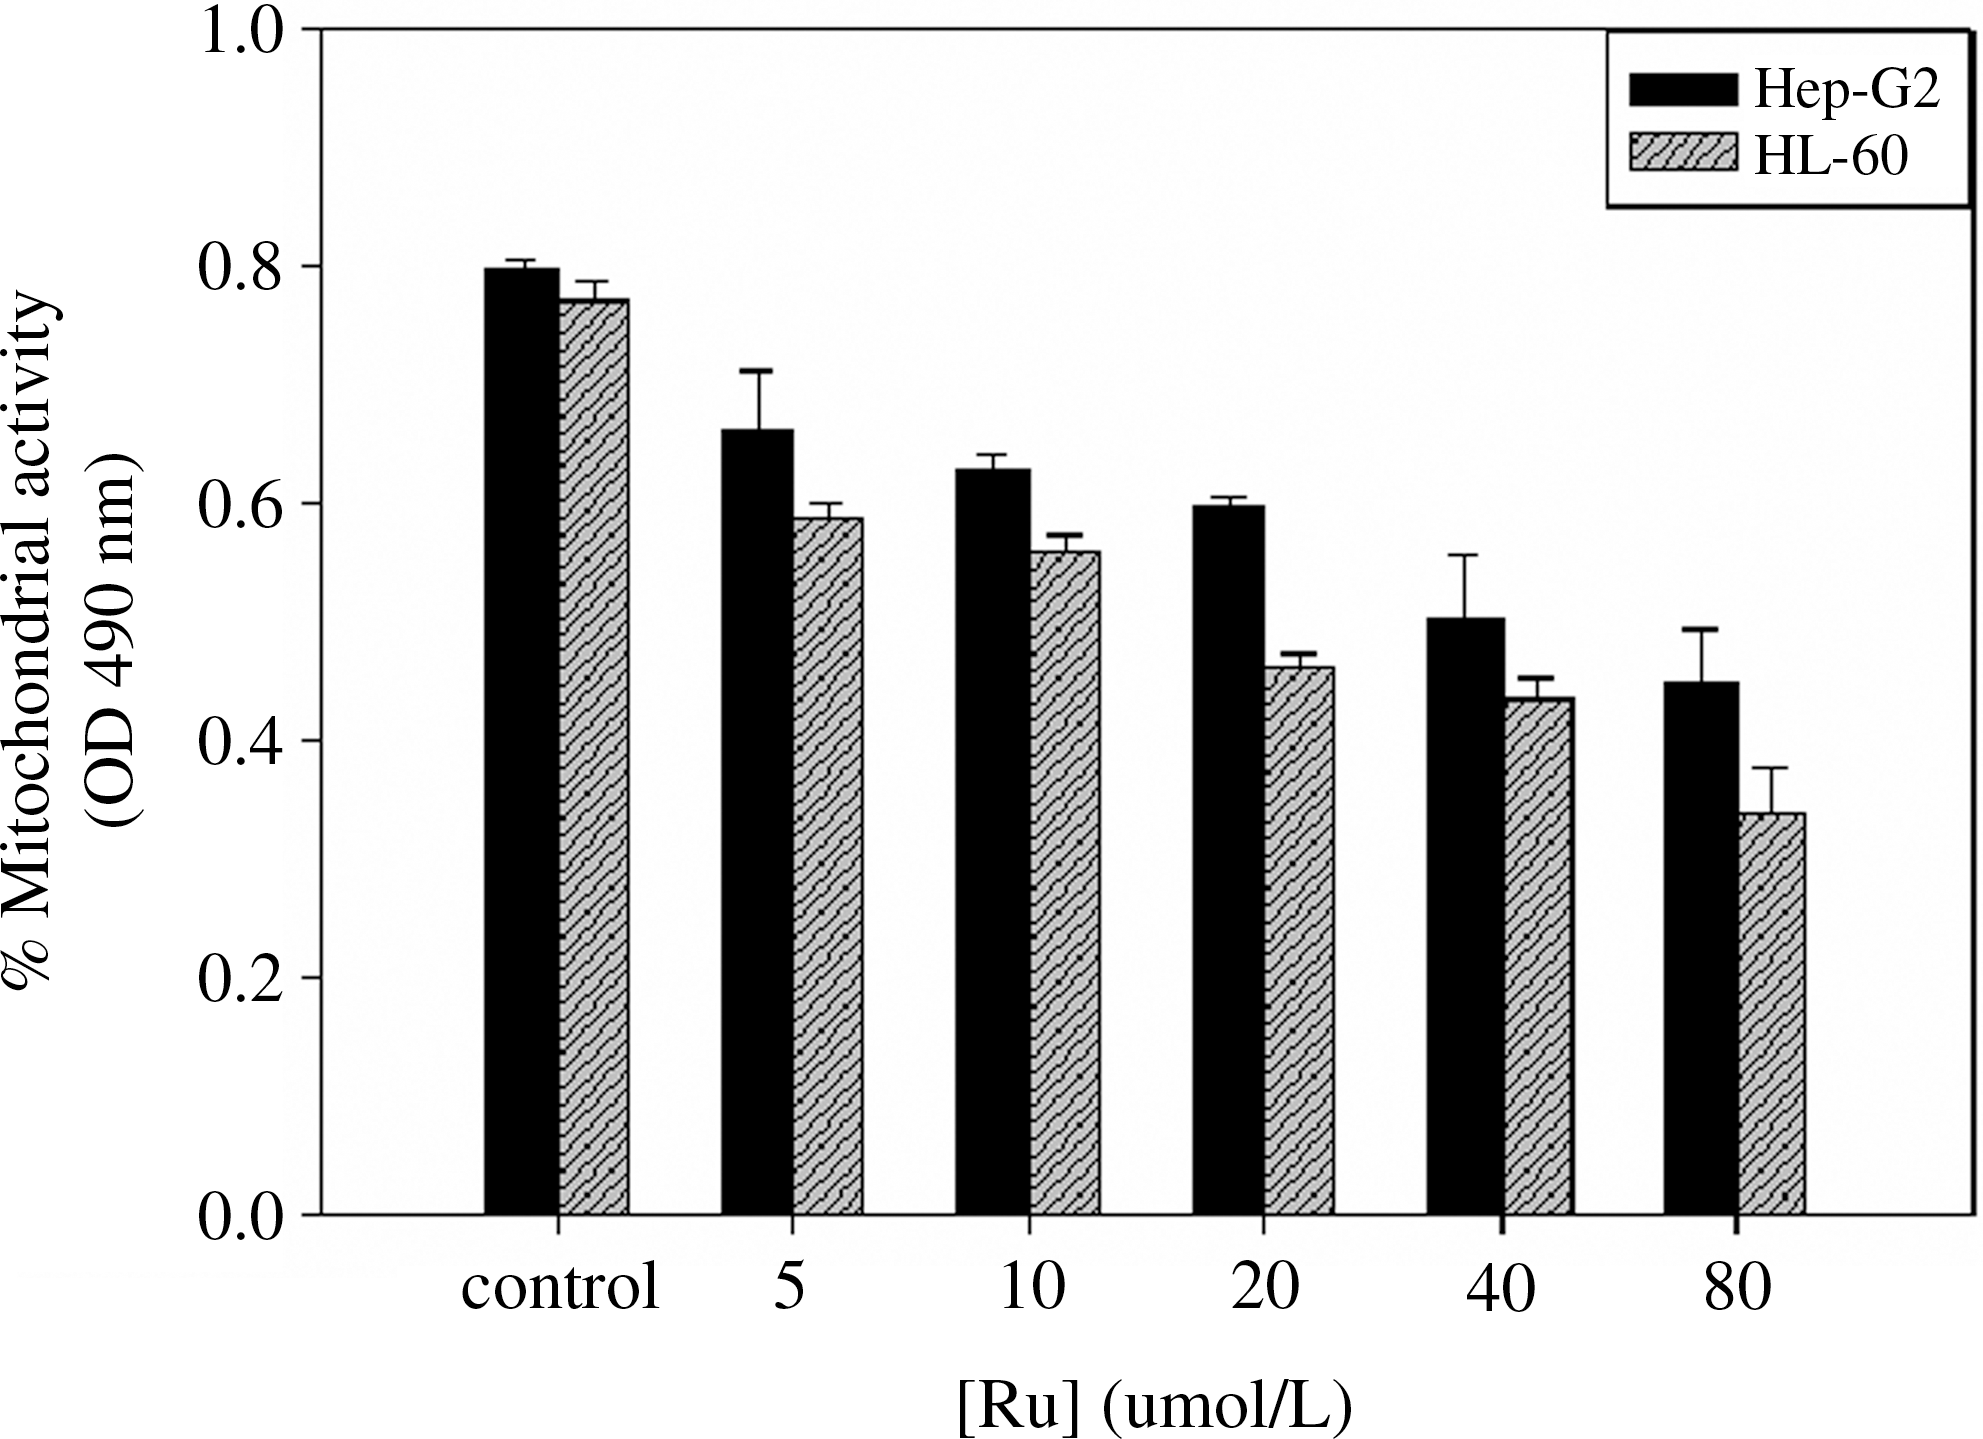
where T is the mean absorbance of the treated cells, and C is the mean absorbance of the controls with DMSO. Figure 8 illustrates that complex 1 exhibits dose-dependent growth inhibitory effect against the tested cell lines (Tan et al., 2008). At the concentration of 80 μM, complex 1 causes a decrease in the mitochondrial activity at the rate of 43.6% and 56.2% for HL-60 and Hep-G2 cell lines, respectively. IC50 is another indicator to measure cytotoxicity; the smaller the IC50, the higher the cytotoxicity. The IC50 values were calculated after 48 h of incubation with complexes according to the modified Kaber method, equation (4) as follows: \documentclass{aastex} \usepackage{amsbsy} \usepackage{amsfonts} \usepackage{amssymb} \usepackage{bm} \usepackage{mathrsfs} \usepackage{pifont} \usepackage{stmaryrd} \usepackage{textcomp} \usepackage{portland, xspace} \usepackage{amsmath, amsxtra} \pagestyle{empty} \DeclareMathSizes {10} {9} {7} {6} \begin{document} \begin{align*}{\rm lg}{\rm IC}_{50} = X_{\rm m} - I \times (P - (3 - P_{\rm m} - P_{\rm n}) / 4) \tag{4} \end{align*} \end{document}
Dose-dependent action of complex 1 as inhibitors of HL-60 and Hep-G2 cells. Complex 1 exhibits dose-dependent growth inhibition against the tested cell lines. Cells were treated with test compounds for 48 h; cell viability was assessed by the MTT colorimetric method. The means±SD value are from three independent experiments.
lg represents logarithm; Xm represents the logarithm of maximal dose; I is the logarithmic value of maximal dose versus adjacent dose; P, Pm, and Pn are the sum of inhibition, maximal, and minimal inhibition, respectively.
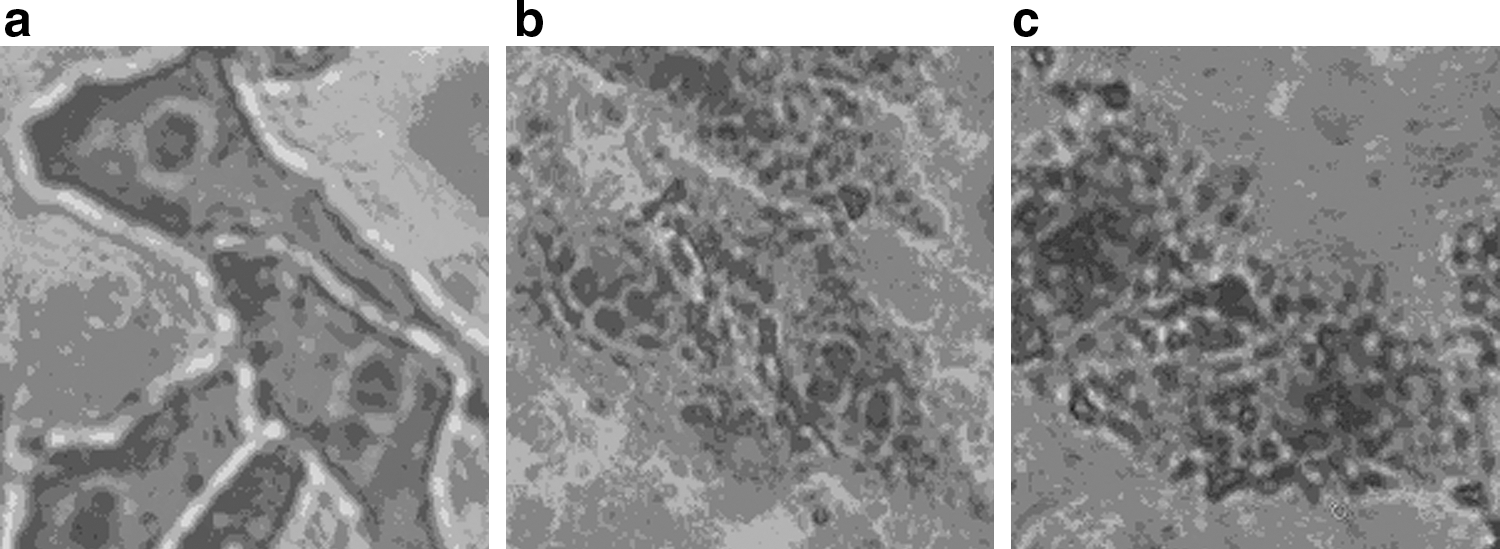
Giemsa staining was used to gain information about the apoptosis of Hep-G2 cells induced by complexes. After exposure to 10 μM tested complexes, the majority of the Hep-G2 cells displayed classic morphological features of apoptosis, including nuclear condensation, cell shrinkage, and formation of apoptotic bodies (Fig. 9).
Effects of complex 1 on Hep-G2 cell proliferation in vitro. Light microscopy of Hep-G2 cells after treatment for 48 h in the absence of drugs (a); 20.0 mM complex 1 (b); and 20.0 mM cis-Pt(NH3)2Cl2(c). (Cells were observed using an inverted microscope and photographed by a digital camera.)
Discussion
The spectral characteristics of the UV-visible spectra of complex 1 titrated with CT-DNA and yeast tRNA suggested that complex 1 could interact with CT-DNA and yeast tRNA. On the other hand, for complex 1 binding with DNA and RNA, no obvious hypochromism was observed in the MLCT band, which might be the reason that the MLCT band was mainly Ru-to-bpy charge transfer in nature. The intrinsic binding-constant values (Kb) are larger than those of complex [Ru(bpy)2(fpp)]2+ ((1.73±0.30)×105 M−1) (Liu et al., 2009), but smaller than those of complex [Ru(bpy)2(HBT)]2+ ((5.71±0.20)×107 M−1) (Arockiasamy et al., 2009) binding with CT-DNA. Both [Ru(bpy)2(fpp)]2+ and [Ru(bpy)2(HBT)]2+ bind with DNA in an intercalation mode; therefore, we can deduce that both binding modes of complex 1 to CT-DNA and yeast tRNA are most likely intercalation. Comparing the affinity of complex 1 binding to DNA with that of complex 1 binding to yeast tRNA, we can see that complex 1 binding with yeast tRNA is stronger than that of complex 1 binding with CT-DNA. A possible explanation for this trend may be due to the A-form configuration and the L-shaped tertiary structure of yeast tRNA, in which the major grove is wide and shallow, thus its base pairs are exposed and can be attacked by complexes easily. In addition, complex 1 may bind to the bugle region of yeast tRNA, which may be another reason why the affinity of complex 1 binding with RNA is greater (Xu et al., 2005).
Steady-state emission quenching experiments using [Fe(CN)6]4− as the quencher can further support the intercalation interaction, but they cannot determine the mode of binding. These results suggest that complex 1 can interact with CT-DNA and tRNA to some extent, and complex 1 can be more efficiently protected by tRNA than that by CT-DNA from water molecules. The hydrophobic environment inside the nucleic acid reduces the accessibility of solvent water molecules to the complex and the complex mobility is restricted at the binding site leading to a decrease of the vibrational modes of relaxation and, thus, higher emission intensity. In the absence of DNA and RNA, the emission of the complex is efficiently quenched by [Fe(CN)6]4−, resulting in a strictly linear Stern–Volmer plot with a slope of 2.17. However, in the presence of CT-DNA (Fig. 5b, solid lines) or yeast tRNA (Fig. 5c, solid lines), the emission is difficult to quench. Bound complex 1 is protected from the anionic water-bound quencher by the array of negative charges along the DNA and RNA phosphate backbone (Kumar et al., 1985). On the other hand, Figure 5 indicated that the fluorescence quenching curves were in agreement with the Stern–Volmer equation. In the presence of CT-DNA and yeast tRNA, the quenching constants Ksv were 0.70 and 0.62 M−1, and the final fluorescence intensities were 59.1% and 64.5%, respectively. The curvatures reflect different degrees of protection or relative accessibility of bound cations, a large slope for the Stern–Volmer curve parallels poorer protection and low binding. This further confirms that complex 1 binds to yeast tRNA more strongly than to CT-DNA.
Measurement DNA viscosity is regarded as the least ambiguous test of a DNA binding mode in solution in the absence of crystallographic structural data (Satyanarayana et al., 1992). A classical intercalation mode demands that the DNA helix lengthen as base pairs are separated to accommodate the binding ligand, leading to the increase of DNA viscosity. In contrast, a partial or nonclassical intercalation ligand could bend (or kink) the DNA helix, reduce its effective length, and concomitantly its viscosity (Barton et al., 1986). Figure 6 shows the viscosity of DNA after addition of different concentrations of EB, [Ru(bpy)3]2+ and [Ru(bpy)2(H2IIP)]2+. EB, a classic intercalator, lengthens the DNA helix (Satyanarayana et al., 1992); [Ru(bpy)3]2+ interacts with DNA in a electronic mode and cannot change the DNA helix. After increasing the amount of complex 1, the relative viscosity of DNA increases steadily, which is similar to the behavior of EB. The increased degree of viscosity, which may depend on its affinity to DNA, follows the order of EB>complex 1>[Ru(bpy)3]2+. The results suggest that complex 1 binds to DNA through a classical intercalation mode.
No obvious change in viscosity was observed for yeast tRNA in the presence of complex 1. Therefore, viscometry cannot be used to study the interaction between yeast tRNA and metal complexes, because yeast tRNA is not a linear structure. However, comparing its binding constant with those observed for many other DNA and RNA-intercalative ruthenium complexes (Liu et al., 2001b; Xu et al., 2003a, 2004, 2005), complex 1 can strongly bind to yeast tRNA, and the ligand H2IIP of complex 1 is most likely to intercalate into the double-helical regions of yeast tRNA.
The presence of CD signals indicates enrichment of the enantiomer binding less favorably to yeast tRNA or CT-DNA. Although the complex was not resolved into the pure enantiomers, and we cannot determine which enantiomer binds preferentially yeast tRNA or CT-DNA, it is evident that the complex interacts enantioselectivly with both yeast tRNA and CT-DNA, and that the complex is a better candidate for an enantioselective binder to yeast tRNA than to CT-DNA. According to the proposed binding model by Barton (1986), the Δ enantiomer of the complex, a right-handed propeller-like structure, displays a greater affinity than the Λ enantiomer with the left-handed CT-DNA helix due to more-appropriate steric matching. Although the configuration of CT-DNA is different from that of yeast tRNA, both yeast tRNA and CT-DNA have the same right-handed helix structure. Therefore, we can deduce that the Δ enantiomer of complex 1 may bind more favorably to both yeast tRNA and CT-DNA than the Λ enantiomer does. In addition, the finding that the CD signals for the dialysate of the complex dialyzed against yeast tRNA are much stronger than those for the complex dialyzed against CT-DNA implies that complex 1 binding with yeast tRNA shows more enantioselective than that with CT-DNA. As show in Table 1, complex 1 demonstrates different cytotoxicity against selected tumor cell lines in vitro, and HL-60 cells are more sensitive to complex 1 than the Hep-G2 cells under the same conditions. This phenomenon has also been found with complex [Ru(bpy)2(fpp)]2+ (Liu et al., 2009). Comparing complex 1 with [Ru(bpy)2(fpp)]2+, complex 1 displays greater antitumor activity. However, comparing complex 1 with cis-Pt(NH3)2Cl2, the latter displays greater antitumor activity. cis-Pt(NH3)2Cl2 forms cis-DDP-DNA adducts, which interfere with DNA replication and transcription and ultimately induces cell death. However, platinum drugs have poisonous side effects. In contrast, Ru(II) complexes have the similar cytotoxic effects but with fewer side effects. However, no leaving group exists in complex 1; therefore, the anti-tumor mechanism of complex 1 may not occur with the DNA cross-linking reaction. Further, the anti-tumor mechanism of complex 1 does not seem entirely like that of some organic molecules, such as adriamycin and daunorubicin, which inhibit tumors by inserting into DNA. We speculate that the antitumor activity of complex 1 may be related not only to DNA insertion, but also to the specific molecular shape of complex 1 and the chemical structure and nature of the inserted ligand.
IC50 of Complex 1 and cis-Pt(NH3)2Cl2 Against Different Tumor Cells
IC50 (μM)
Complexes
HL-60 Hep-G2
1
18.36±1.35
20.45±1.53
cis-Pt(NH3)2Cl2
5.85±0.44
11.18±0.84
Each IC50 is the mean±standard error obtained from at least three independent experiments.
Figure 9 suggests that complex 1 could induce Hep-G2 cell apoptosis. However, Giemsa staining only qualitatively depicts apoptosis. Further studies are currently underway to quantitate cell apoptosis
In summary, the modes of complex 1 binding with CT-DNA and yeast tRNA are most likely intercalation, and RNA binding of complex 1 is stronger than DNA binding. Different CD spectra were observed for complex 1 dialyzed against CT-DNA and yeast tRNA. These results indicated that the Δ enantiomer of complex 1 may bind more favorably to both CT-DNA and yeast tRNA, and complex 1 is a better candidate for an enantioselective binder to yeast tRNA than to CT-DNA. The toxicity of complex 1 was concentration dependent, and HL-60 cells are more sensitive to complex 1 than the Hep-G2 cells. Complex 1 could induce Hep-G2 cell apoptosis. Information obtained from the present study can enhance our understanding of the mechanism for the binding of metal complexes to nucleic acids and is helpful in the development of nucleic acid molecular probes and new therapeutic regents.
Footnotes
Acknowledgments
The authors are grateful to the supports of the National Natural Science Foundation of the People's Republic of China (21071120) and the Scientific Research Foundation of Key Lab of Environment-friendly Chemistry and Application in Ministry of Education (09HJYH09).
Disclosure Statement
No competing financial interests exist.
References
1.
AbramovM., SchepersG., AerschotA.V., HummelenP.V., HerdewijnP.2008. HNA and ANA high-affinity arrays for detections of DNA and RNA single-base mismatches. Biosens Bioelectron, 23:1728–1732.
2.
ArockiasamyD.L., RadhikaS., ParthasarathiR., NairB.U.2009. Synthesis and DNA-binding studies of two ruthenium(II) complexes of an intercalating ligand. Eur J Med Chem, 44:2044–2051.
3.
BartonJ.K.1986. Metals and DNA: molecular left-handed complements. Science, 233:727–734.
4.
BartonJ.K., GoldbergJ.M., KumarC.V., TurroN.J.1986. Binding modes and base specificity of tris(phenanthroline)ruthenium(II) enantiomers with nucleic acids: tuning the stereoselectivity. J Am Chem Soc, 108:2081–2088.
5.
BlancaR.M., FélixA.J., GustavoE., AnaG., RosaM.C., ConsueloE., JoséE., HeraM.2007. Synthesis, spectral characterization and cytotoxicity of Ru–bipyridyl complexes containing hexakis(pyrazol-1-yl)benzene (hpzb) as a co-ligand. Polyhedron, 26:4373–4382.
6.
BolosC.A., NikolovG.S., EkateriniadouL., KortsarisA., KyriakidisD.A.1998. Structure activity relationships for some diamine, triamine and schiff base derivatives and their copper (II) complexes. Met Based Drugs, 5:323–332.
7.
BryantG.M., FergussonJ.E., PowellH.K.J.1971. The nuclear magnetic resonance spectra of 4,4′-dimethyl-2,2′-bipyridyl complexes of iron, ruthenium, and osmium. Aust J Chem, 24:441–444.
8.
BugarcicT., NovakovaO., HalamikovaA., ZerzankovaL., VranaO., KasparkovaJ., HabtemariamA., ParsonsS., SadlerP.J., BrabecV.2008. Cytotoxicity, cellular uptake, and DNA interactions of new monodentate ruthenium(II) complexes containing terphenyl arenes. J Med Chem, 51:5310–5319.
9.
CarterM.T., RodriguezM., BardA.J.1989. Voltammetric studies of the interaction of metal chelates with DNA. 2. Tris-chelated complexes of cobalt(III) and iron(II) with 1,10-phenanthroline and 2,2′-bipyridine. J Am Chem Soc, 111:8901–8911.
10.
CarterP.J., ChengC.C., ThorpH.H.1998. Oxidation of DNA and RNA by oxoruthenium(IV) metallointercalators: visualizing the recognition properties of dipyridophenazine by high-resolution electrophoresis. J Am Chem Soc, 120:632–642.
11.
ChairesJ.B., DattaguptaN., CrothersD.M.1982. Studies on interaction of anthracycline antibiotics and deoxyribonucleic acid: equilibrium binding studies on the interaction of daunomycin with deoxyribonucleic acid. Biochemistry, 21:3933–3940.
12.
ChauhanM., ArjmandF.2007. Stannoxane capping derived from chiral tridentate NNO donor ligand for nickel and copper macrocycles: comparative binding studies of stannoxane moiety and its modulated copper complex with CT-DNA. J Organomet Chem, 692:5156–5164.
CohenG., EisenbergH.1969. Viscosity and sedimentation study of sonicated DNA-proflavine complexes. Biopolymers, 8:45–55.
15.
DeshpandeM.S., KumbharA.A., KumbharA.S., KumbhakarM., PalH., SonawaneU.B., JoshiR.R.2009. Ruthenium(II) complexes of bipyridine-glycoluril and their interactions with DNA. Bioconjug Chem, 20:447–459.
16.
DiakosC.I., FentonR.R., HambleyT.W.2006. DNA-binding and molecular mechanics modelling studies of the bulky chiral platinum(II) complex [PtCl2(mepyrr)] (mepyrr=N-methyl-2-aminomethylpyrrolidine)J Inorg Biochem, 100:1965–1973.
17.
JiangQ., ZhuJ.H., ZhangY.M., XiaoN., GuoZ.J.2009. DNA binding property, nuclease activity and cytotoxicity of Zn(II) complexes of terpyridine derivatives. Biometals, 22:297–305.
18.
KhanN.H., PandyaN., KureshyR.I., AbdiS.H.R., AgrawalS., BajajH.C., PandyaJ., GupteA.2009. Synthesis, characterization, DNA binding and cleavage studies of chiral Ru(II) salen complexes. Spectrochim Acta A, 74:113–119.
19.
KostovaI.2006. Ruthenium complexes as anticancer agents. Curr Med Chem, 13:1085–1107.
20.
KumarC.V., TurroN.J., BartonJ.K.1985. Photophysics of ruthenium complexes bound to double helical DNA. J Am Chem Soc, 107:5518–5523.
21.
LakowiczJ.R., WeberG.1973. Quenching of fluorescence by oxygen. Probe for structural fluctuations in macromolecules. Biochemistry, 12:4161–4170.
22.
LambertD., LeipplyD., ShimanR., DraperD.E.2009. The influence of monovalent cation size on the stability of RNA tertiary structures. J Mol Biol, 390:791–804.
23.
LiuJ.G., ZhangQ.L., JiL.N.2001a. Synthesis, characterization and interaction of mixed polypyridyl ruthenium(II) complexes with calf thymus DNA. Transit Metal Chem, 26:733–738.
24.
LiuJ.G., ZhangQ.L., ShiX.F., JiL.N.2001b. Interaction of [Ru(dmp)2(dppz)]2+ and [Ru(dmb)2(dppz)]2+ with DNA: effects of the ancillary ligands on the DNA-binding behaviors. Inorg Chem, 40:5045–5050.
25.
LiuX.W., LuJ.L., ChenY.D., LiL., ZhangD.S.2010. A novel DNA light switch [Ru(bpy)2pzip]2+ activated by cobalt(II) ion. Inorg Chem Commun, 13:449–451.
26.
LiuY.J., ZengC.H., WuF.H., YaoJ.H., HeL.X., HuangH.L.2009. Synthesis, characterization, photocleavage of DNA and cytotoxicity of ruthenium(II) mixed-ligand complexes. J Mol Struct, 932:105–111.
27.
LuedtkeN.W., HwangJ.S., GlazerE.C., GutD., KolM., TorY.2002. Eilatin Ru(II) complexes display anti-HIV activity and enantiomeric diversity in the binding of RNA. Chem Biochem, 3:766–771.
28.
MaheswariP.U., RajendiranV., Stoeckil-EvansH., PalaniandavarM.2006. Interaction of rac-[Ru(5,6-dmp)3]2+ with DNA: enantiospecific DNA binding and ligand-promoted exciton coupling. Inorg Chem, 45:37–50.
29.
MarioH., RaedA.-Q., YoungA.H., LeeY.2005PCT Int Appl 7266http://worldwide.espacenet.com/publicationDetails/originalDocument?CC=WO&NR=2005047266A1&KC=A1&FT=D&date=20050526&DB=EPODOC&locale=en_EP
30.
MarmurJ.1961. A procedure for the isolation of deoxyribonucleic acid from microorganisms. J Mol Biol, 3:208–218.
31.
MeadowsK.A., LiuF., SouJ., HudsonB.P., McMillinD.R.1993. Spectroscopic and photophysical studies of the binding interactions between copper phenanthroline complexes and RNA. Inorg Chem, 32:2919–2923.
32.
MosmannT.1983. Rapid colorimetric assay for cellular growth and survival: application to proliferation and cytotoxicity assays. J Immunol Methods, 65:55–63.
33.
PenaC., AlfonsoI., ToothB., VoelckerN.H., GotorV.2007. Synthesis and stereoselective DNA binding abilities of new optically active open-chain polyamines. J Org Chem, 72:1924–1930.
34.
ReichmannM.E., RiceS.A., ThomasC.SA., DotyP.1954. A further examination of the molecular weight and size of desoxypentose nucleic acid. J Am Chem Soc, 76:3047–3053.
35.
SatyanarayanaS., DabrowiakJ.C., ChairesJ.B.1992. Neither Δ− nor Λ Tris(phenanthroline)ruthenium(II) Binds to DNA by Classical Intercalation. Biochemistry, 31:9319–9323.
36.
ShiS., GengX.Y., ZhaoJ., YaoT.M., WangC.R., YangD.J., ZhengL.F., JiL.N.2010. Interaction of [Ru(bpy)2(dppz)]2+ with human telomeric DNA: preferential binding to G-quadruplexes over i-motif. Biochimie, 92:370–377.
37.
SteckE.A., DayA.R.1943. Reactions of phenanthraquinone and retenequinone with aldehydes and ammonium acetate in acetic acid solution. J Am Chem Soc, 65:452–456.
38.
StrekowskiL., CeglaM.T., HonkanV., BuczakH., Rucks-WinkeljohnW., BaumstarkA.L., David-WilsonW.2005. Chiral discrimination in binding of enantiomers of 2-(aminoalkoxy)-substituted 4-(2-thienyl)pyrimidines and 4,6-bis(2-thienyl)pyrimidines with duplex DNA. Bioorg Med Chem Lett, 15:2720–2723.
39.
TabassumS., MathurS.2005. Synthesis, characterization, solution stability studies, electrochemistry, and DNA-binding behavior of Cu(II) complexes of D-gluconic acid. J Carbohydr Chem, 24:865–887.
40.
TanC.P., LiuJ., ChenL., ShiS., JiN.J.2008. Synthesis, structural characteristics, DNA binding properties and cytotoxicity studies of a series of Ru(III) complexes. J Inorg Biochem, 102:1644–1653.
41.
TanL.F., ChaoH., LiuY.J., LiH., SunB., JiL.N.2005. DNA-binding and photocleavage studies of [Ru(phen)2(NMIP)]2+Inorg Chim Acta, 358:2191–2198.
VijayalakshmiR., KanthimathiM., ParthasarathiR., NairB.U.2006. Interaction of chromium(III) complex of chiral binaphthyl tetradentate ligand with DNA. Bioorg Med Chem, 14:3300–3306.
44.
XuH., DengH., ZhangQ.L., HuangY., LiuJ.Z., JiL.N.2003a. Synthesis and spectroscopic RNA binding studies of [Ru(phen)2MHPIP]2+Inorg Chem Commun, 6:766–768.
45.
XuH., LiangY., ZhangP., DuF., ZhouB.R., WuJ., LiuJ.H., LiuZ.G., JiN.J.2005. Biophysical studies of a ruthenium(II) polypyridyl complex binding to DNA and RNA prove that nucleic acid structure has significant effects on binding behaviors. J Biol Inorg Chem, 10:529–538.
46.
XuH., ZhengK.C., DengH., LinL.J., ZhangQ.L., JiL.N.2003b. Effects of the ancillary ligands of polypyridyl ruthenium(II) complexes on the DNA-binding behaviors. New J Chem, 27:1255–1263.
47.
XuH., ZhengK.C., LinL.J., LiH., GaoY., JiL.N.2004. Effects of the substitution positions of Br group in intercalative ligand on the DNA-binding behaviors of Ru(II) polypyridyl complexes. J Inorg Biochem, 98:87–97.
48.
YangG., WuJ.Z., WangL., JiL.N., TianX.1997. Study of the interaction between novel ruthenium(II) polypyridyl complexes and calf thymus DNA. J Inorg Biochem, 66:141–144.
49.
ZengC.H., ChengH., LiuY.J., LiZ.Z., LiangZ.H., HuangH.L., WuF.H.2010. DNA-binding, antioxidant activity and in vitro cytotoxicity induced by ruthenium(II) complexes containing polypyridyl ligands. Transit Metal Chem, 35:731–736.