
Abstract
Basic fibroblast growth factor (FGF2) is a well-known endothelial mitogen that regulates endothelial cell proliferation, migration, differentiation, and survival. In the present study, we investigated the levels of FGF2 and fibroblastic growth factor receptor 1 (FGFR1) in saliva and serum of patients with salivary gland tumors. Saliva and serum samples were collected from 43 patients with salivary gland tumors and 40 healthy volunteers. The FGF2 and FGFR1 concentrations in saliva and serum samples were measured by enzyme-linked immunosorbent assay. We found that the levels of FGF2 and FGFR1 in saliva and serum from patients with salivary gland tumors were significantly higher than those from healthy control subjects. These results suggest that salivary FGF2 and FGFR1 can be used as potential biomarkers in the diagnosis of salivary gland tumors.
Introduction
At present, there is renewed interest in biological factors that are not only involved in the development of malignant diseases but may also serve as prognostic markers for survival and as predictive signals for the efficacy of a specific therapy for lung cancer (Kaminska et al., 2006).
Salivary analysis is a noninvasive diagnostic method. Salivary glands are responsible for production of a large portion of saliva, so the composition and content of saliva can directly reflect the pathological change of salivary glands, for example, in this study, we quantitatively measured the levels of FGF2/fibroblastic growth factor receptor 1 (FGFR1) in the saliva and serum from patients with salivary gland tumors, using an enzyme-linked immunosorbent assay (ELISA). Our aim was to evaluate the feasibility of using saliva as a valid diagnostic medium in the diagnosis of salivary gland tumors.
Materials and Methods
Subjects
Forty-three patients with salivary gland tumors admitted to the Oral and Maxillofacial Surgical Department of Affiliated Hospital of NingXia Medical University between 2009 and 2010 were enrolled in this study. The presence of salivary gland tumors in these patients were confirmed by postoperative histological examinations (Table 1). Control subjects were randomly selected: 40 age- and sex-matched healthy volunteers without any associated systemic disease. All subjects had no periodontal disease, gingivitis, ulcer, or other oral disease as evaluated by oral examination. This study was approved by the Ethics Committee of NingXia Medical University Affiliated Hospital and all subjects provided written informed consent.
Saliva and blood sample collection: All saliva and serum samples were obtained prior to the initiation of any treatment. Saliva samples were collected from all subjects between 9 a.m. and 10 a.m. to minimize any circadian rhythm effects. All subjects refrained from oral intake, tooth brushing, and smoking for at least 2 h before saliva collection. All subjects were instructed to rinse their mouth with distilled water and swallow all saliva in the mouth. All subjects underwent oral examination and had no periodontal disease, gingivitis, ulcer, or other oral disease. The unstimulated saliva was collected into sterilized plastic centrifuge tubes. At least 1 mL of saliva was collected and transferred to Eppendorf tubes and immediately frozen at −80°C. Blood samples were collected from both patients and healthy individuals and subsequently centrifuged at 3000 g for 10 min at 4°C. The supernatant was transferred into microtubes and frozen at −80°C until use.
FGF2 and FGFR1 concentrations were measured by enzyme-linked immunosorbent ELISA assays (ADL, Inc.) according to the manufacturer's recommendations. All samples were assayed in duplicate. The detection limits for FGF2 and FGFR1 were 1.0 pg/mL and 0.01 ng/mL, respectively.
Statistical analysis
All results were expressed as mean±standard deviation. Two-sample t-tests were used to compare the saliva or serum levels of FGF2 and FGFR1 from patients with salivary gland tumor and healthy volunteers. The statistical significance level assumed was α=0.05. Calculating sensitivity and specificity, we plotted a receiver–operator characteristics (ROC) curve. The data generated were analyzed using SPSS11.5 software.
Results
A statistically significant difference was observed between patients with salivary gland tumors and the control group regarding the values of FGF2 measured in both saliva (4.36±2.46 ng/mL vs. 1.94±1.22 ng/mL, p<0.001) and serum (171.1±79.74 pg/mL vs. 114.84±65.57 pg/mL, p=0.002).
The salivary FGFR1 concentrations from patients with salivary gland tumors and healthy controls were 1.82±0.98 ng/mL and 0.93±0.45 ng/mL, respectively (P=0.0001). The serum FGFR1 concentration from patients with salivary gland tumors and healthy controls were 2.41±0.98 pg/mL and 1.64±0.52 pg/mL, respectively (P=0.0001).
The ROC curve for FGF2 in saliva and serum levels is given in Figure 1. FGF2 in saliva had a sensitivity of 80.0% and a specificity of 78.3%. The ROC curve for FGF2 serum levels showed a sensitivity of 76.5% and a specificity of 72.7%.The ROC curve for FGFR1 saliva and serum levels is given in Figure 2. FGFR1 in saliva had a sensitivity of 74.6% and a sensitivity of 75.0%. The FGFR1 serum levels were lower than in saliva, with a sensitivity of 76.5% and a specificity of 76.3%.The relationship between FGF2 and FGFR1 in the patient group and the control group is also shown in Figures 3 –5.
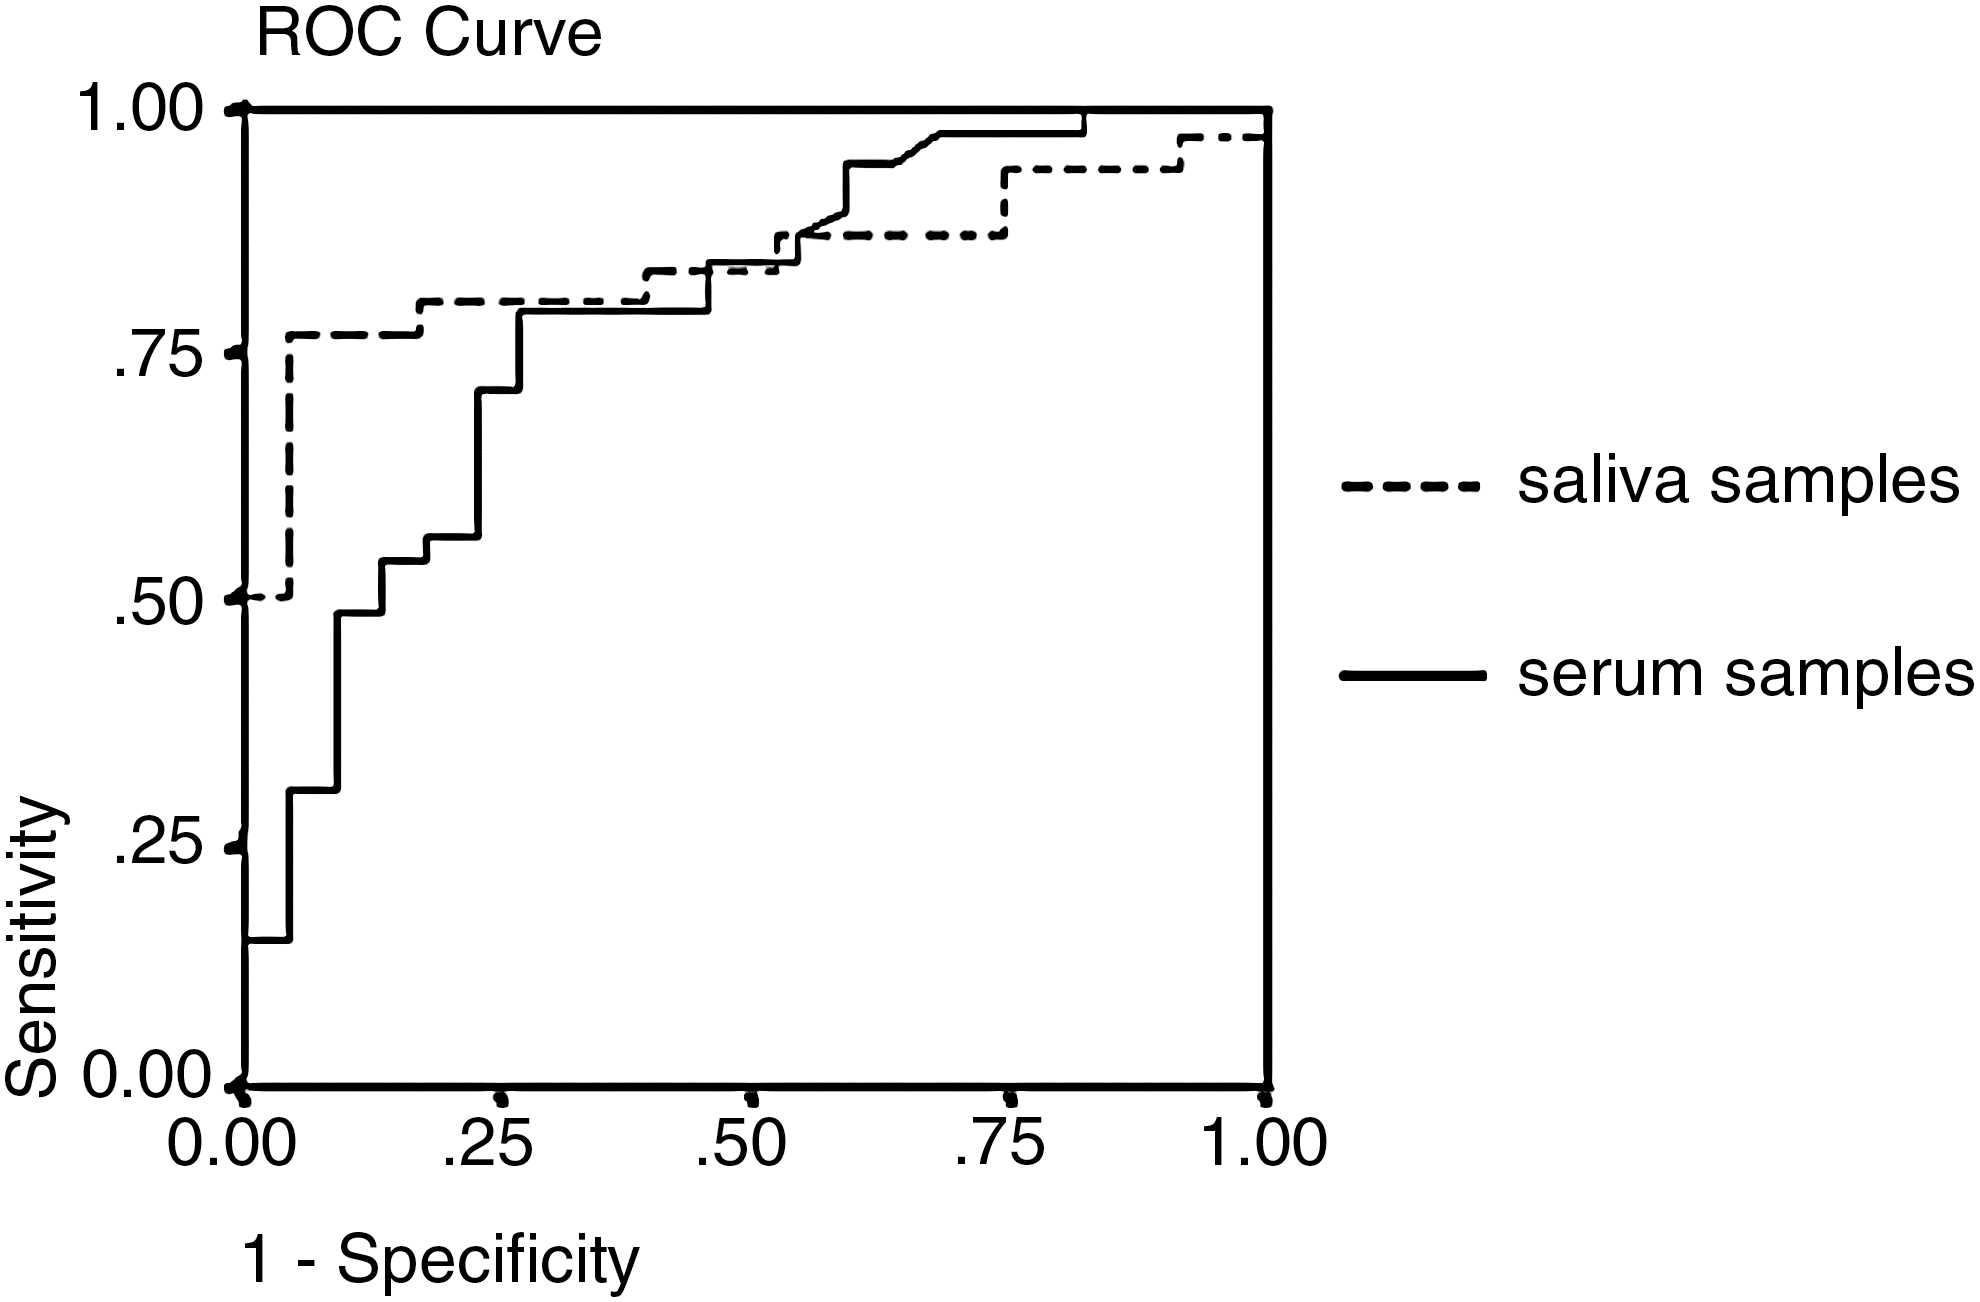
ROC curve for FGF2 in saliva and serum samples. FGF2 in saliva reached a sensitivity of 80.0% at a specificity of 78.3%. FGF2 in serum reached a sensitivity of 76.5% at a specificity of 72.7%. The percentages of area under the curve were 83.9% and 78.9%. ROC, receiver–operator characteristics; FGF2, basic fibroblast growth factor.
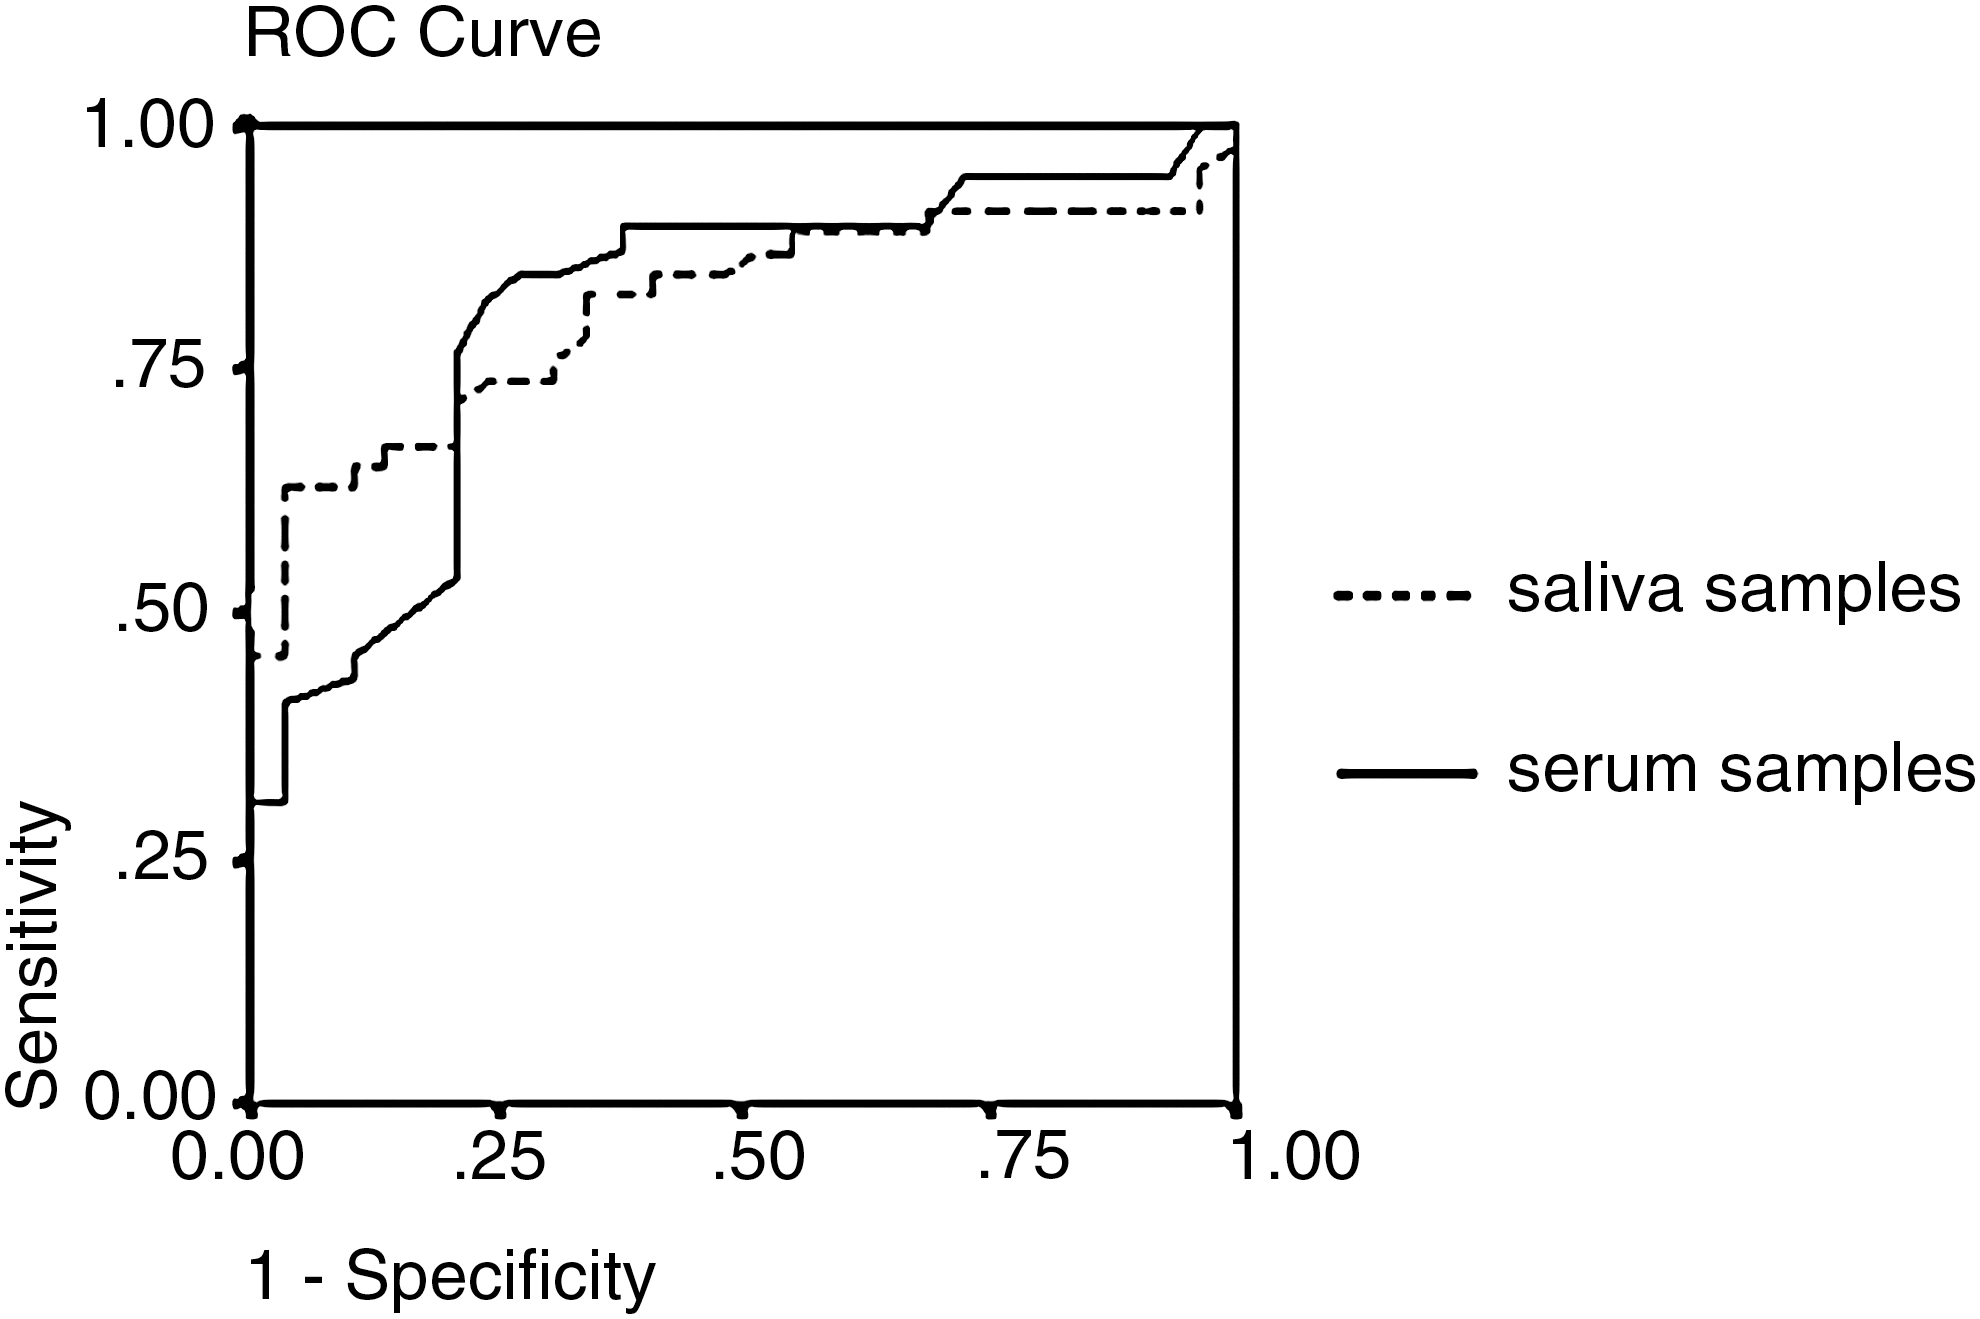
ROC curve for FGFR1 in saliva and serum samples. FGFR1 in saliva reached a sensitivity of 74.6% at a specificity of 75.0%. FGFR1 in serum reached a sensitivity of 76.5% at a specificity of 76.3%. The percentages of area under the curve were 81.4% and 81.1%. FGFR1, fibroblastic growth factor receptor 1.
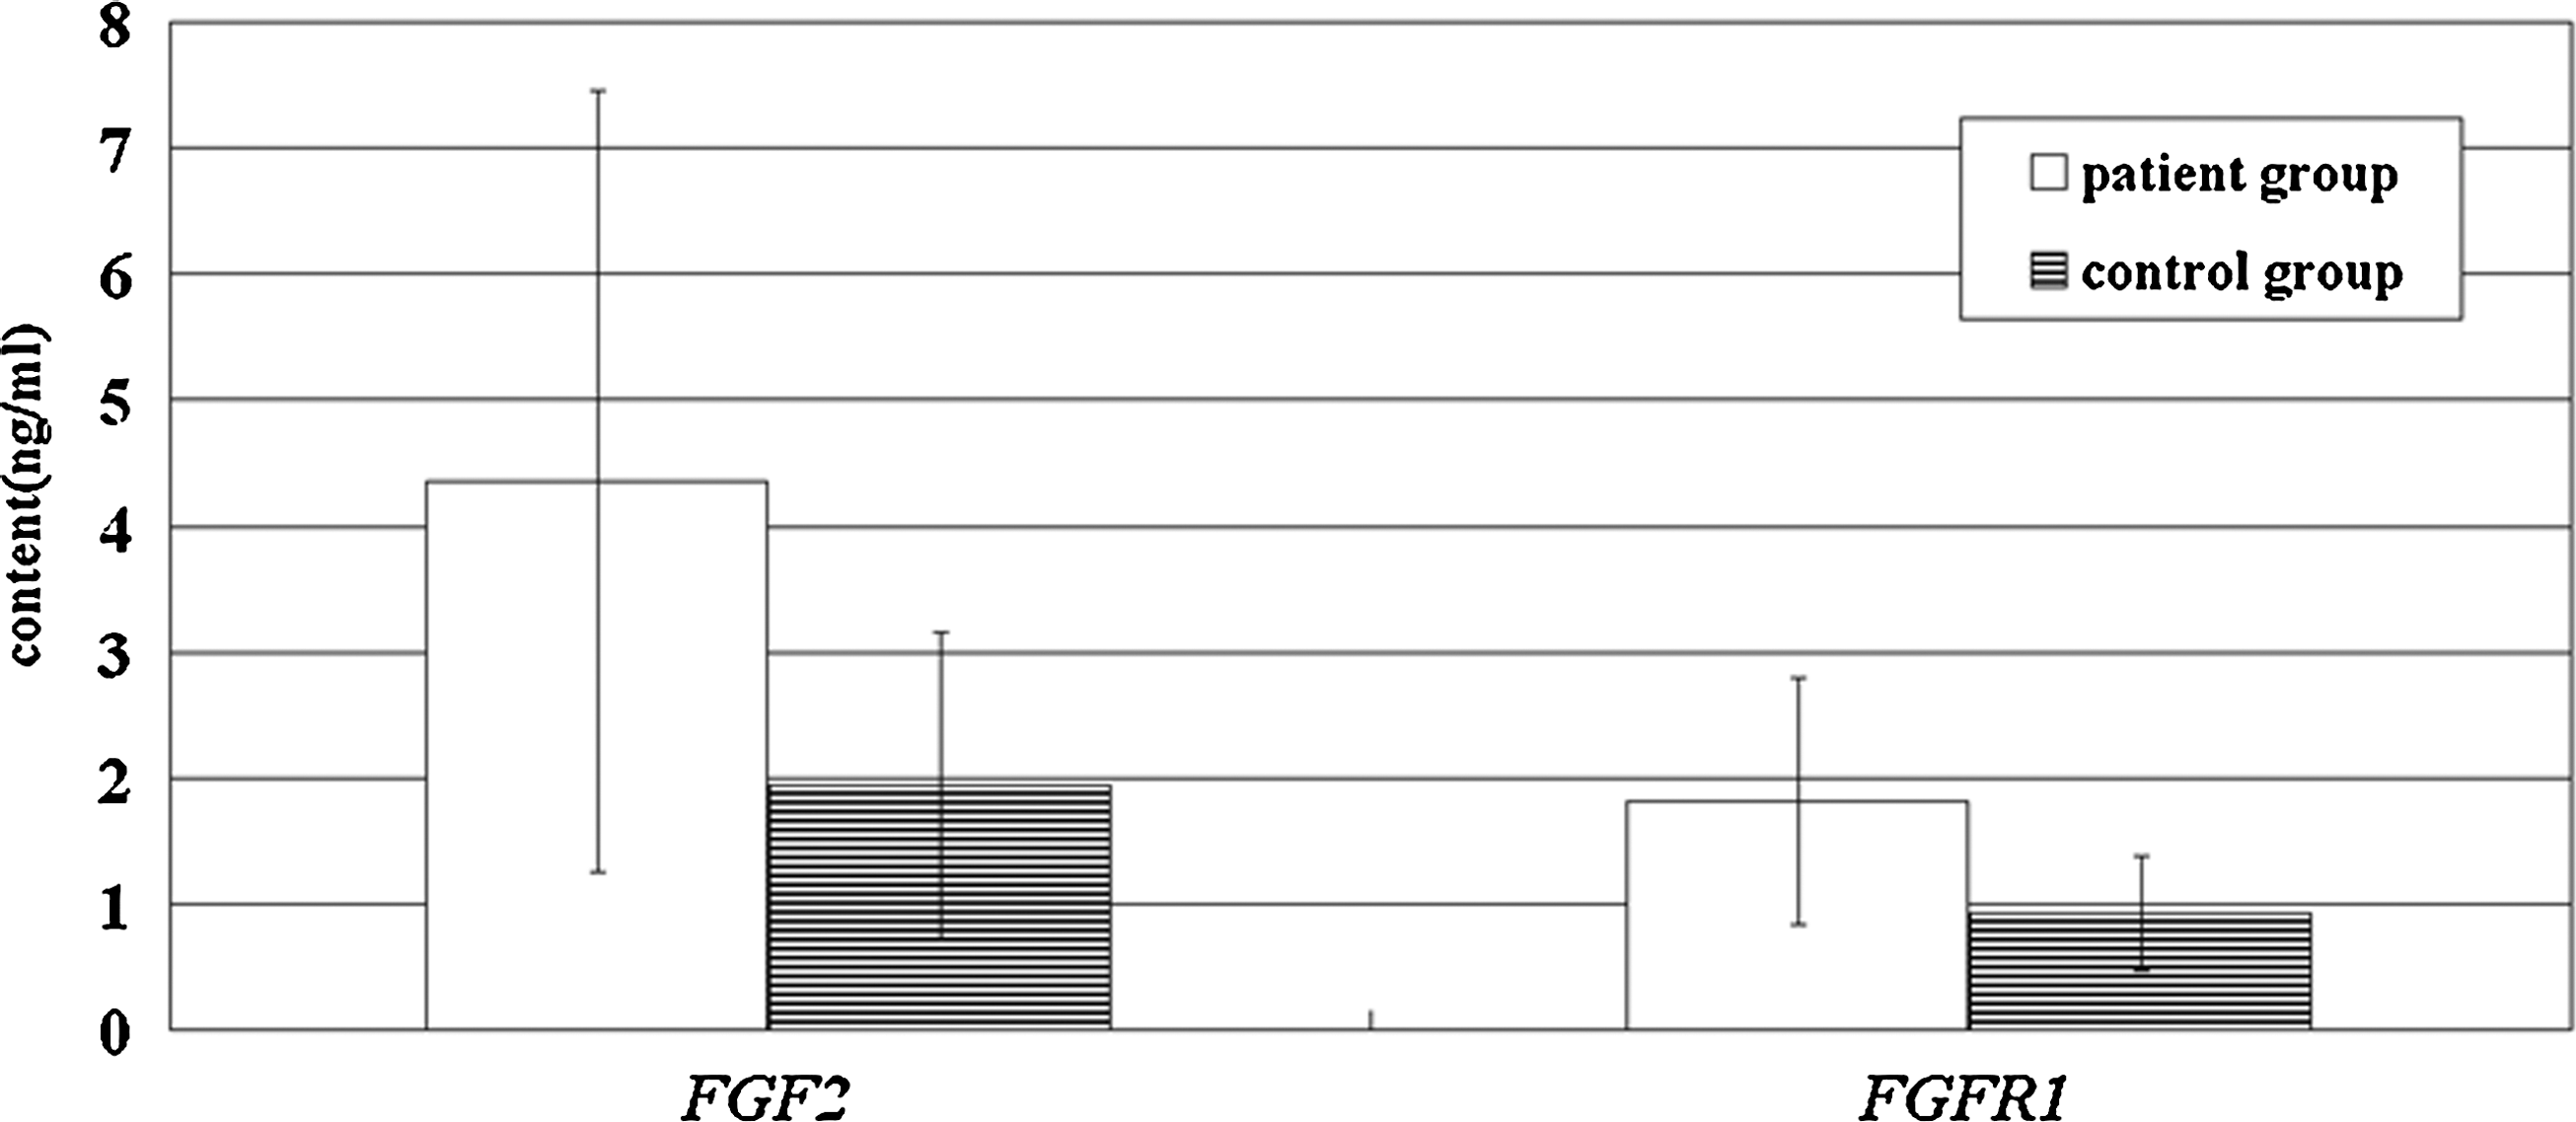
FGF2 and FGFR1 levels in saliva from the patient and control groups.
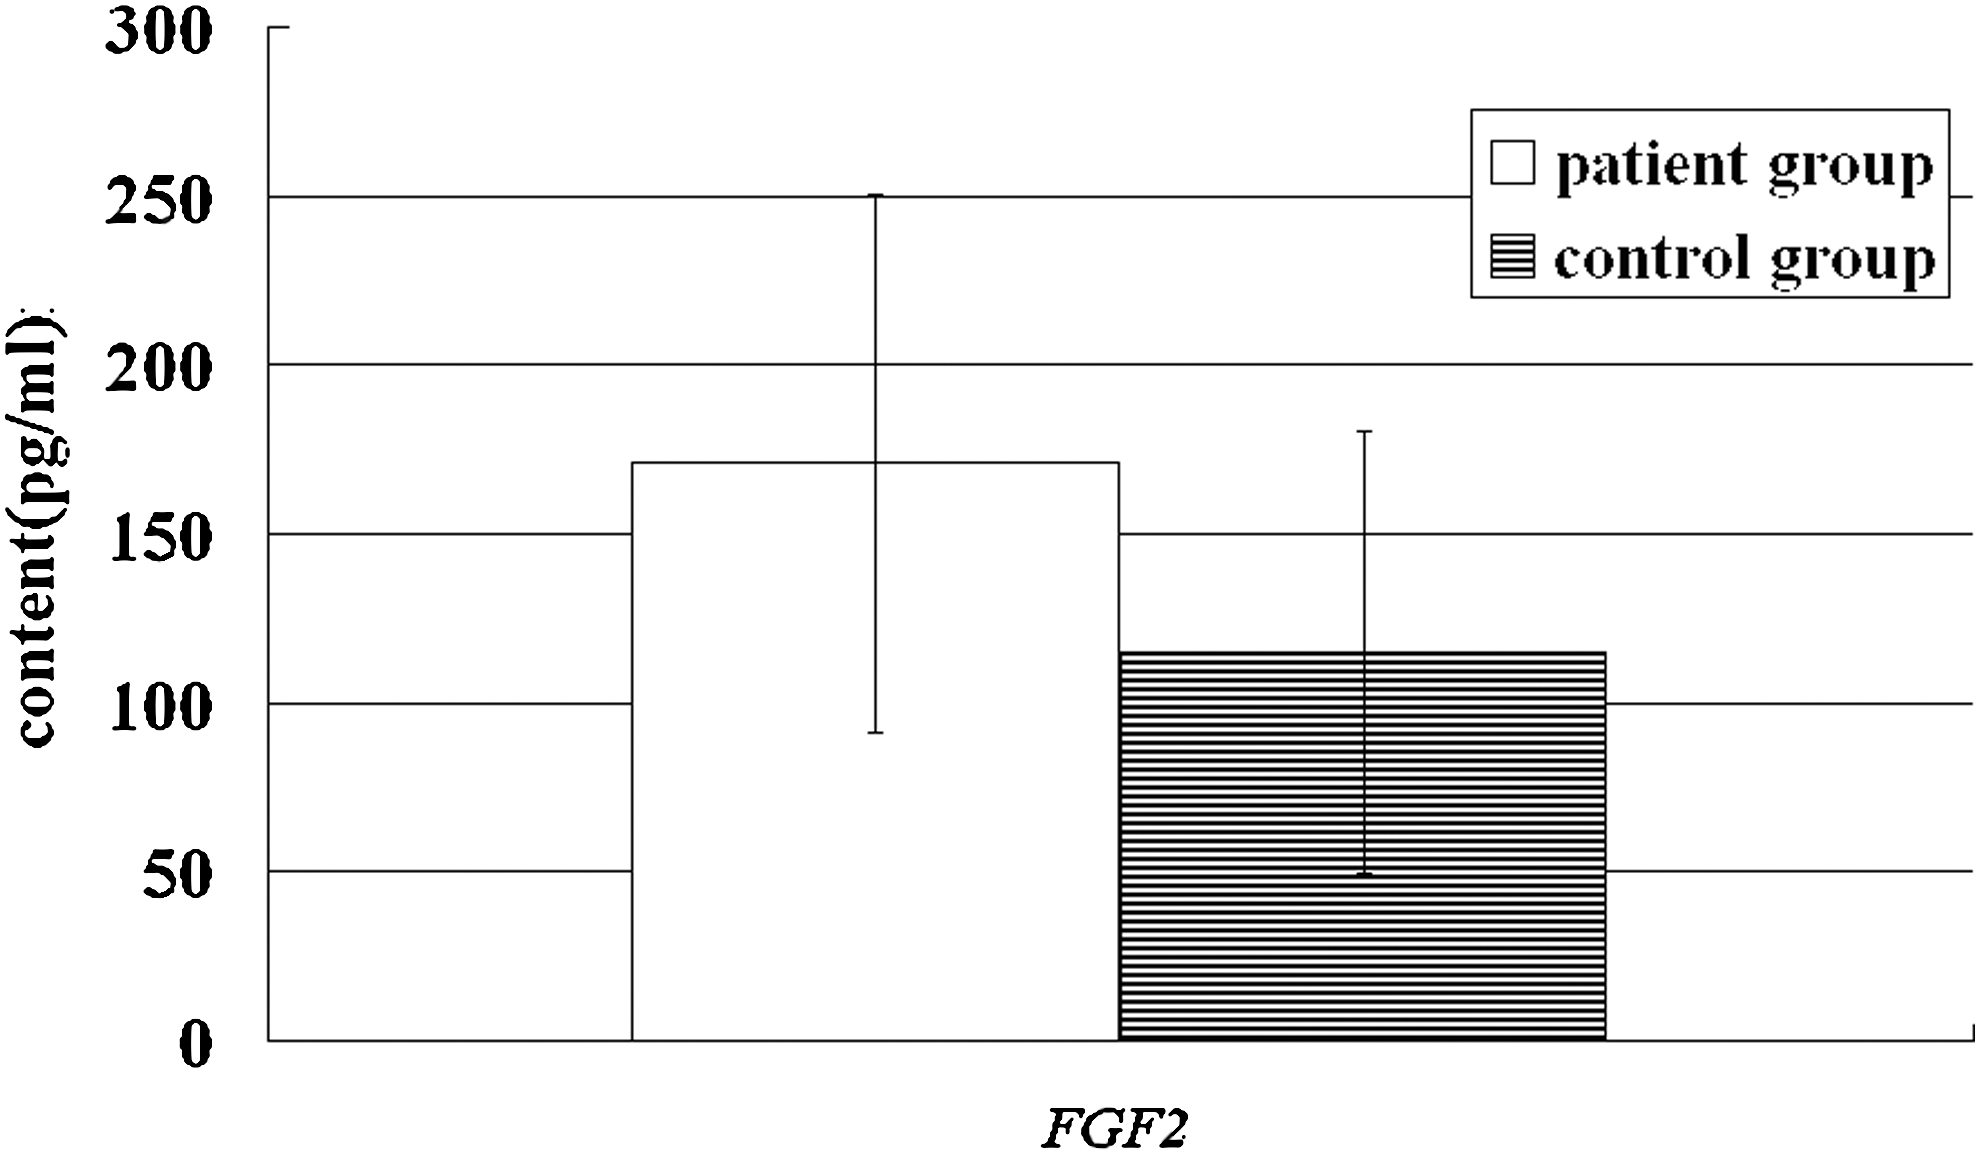
FGF2 levels in serum from the patient and control groups.
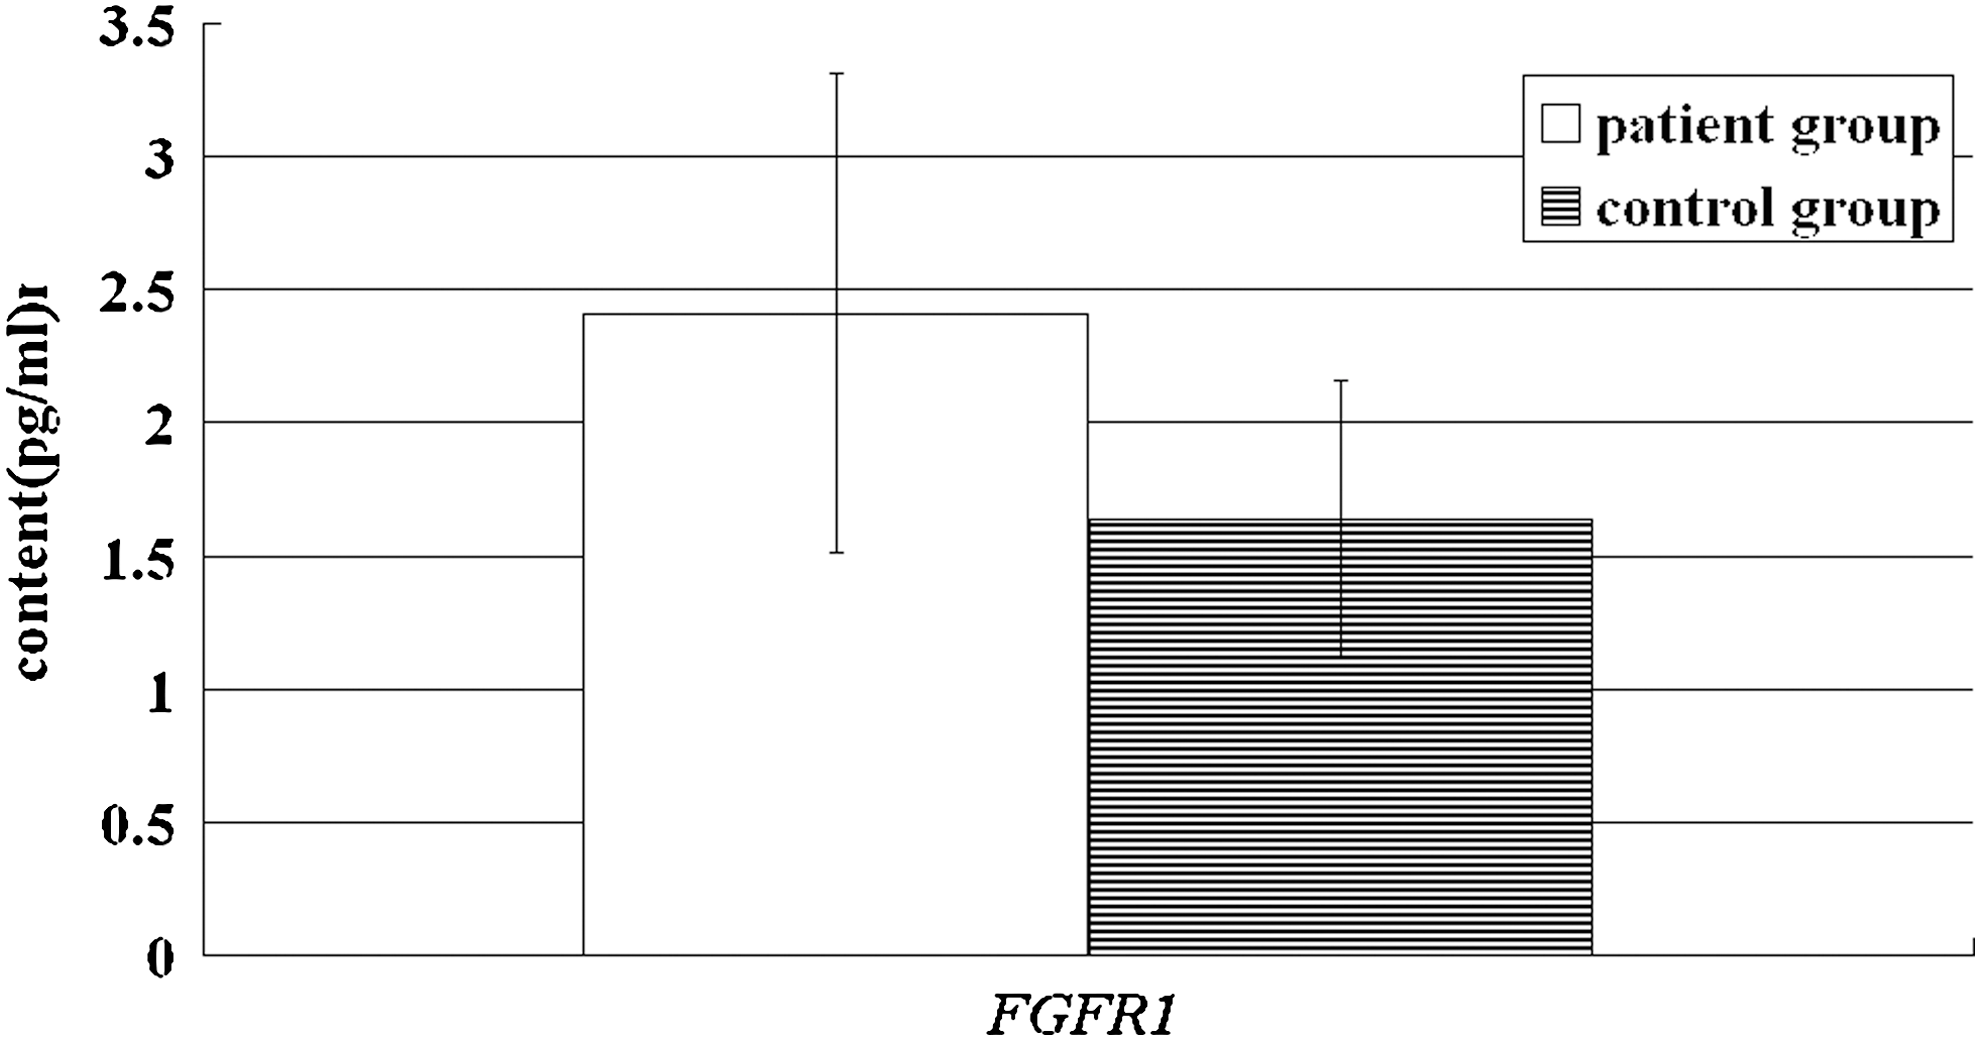
FGFR1 levels in serum from the patient and control groups.
Discussion
Biomarkers are gaining importance in molecular medicine. Saliva is a reservoir of analytes from systemic sources that reach the oral cavity through various pathways. Thus, it is reasonable to develop fast diagnostics approaches and promote human oral health surveillance by analysis of saliva. In patients with oral lichen planus (OLP), tumor necrosis factor (TNF)-α levels in saliva are elevated, correlating with the severity of illness. Salivary TNF-α analysis may be a useful diagnostic tool and a potential prognostic marker in OLP (Pezelj-Ribaric et al., 2004). The methodology used for collecting saliva to assess qualitative and quantitative changes associated with local or systemic diseases has been described (Navazesh and Kumar, 2008). Use of salivary collection methods could assess patients' risk of disease, including diseases related to salivary hypofunction such as Sjögren syndrome, rheumatoid arthritis, and systemic lupus erythematosus (Navazesh and Kumar, 2008).
FGF2 is a growth factor and its level is regulated by multiple processes (e.g., during would healing, angiogenesis) (Morikawa et al., 1996). Abnormal signal transmission of bFGF/FGFR1 plays an important role in the occurrence and development of many kinds of tumors (Morikawa et al., 1996). Abnormal expression of FGF2 has been detected in human tumors and urine levels of FGF2 are associated with metastasis and are of prognostic relevance in human malignancies such as lymphoma and leukemia (Nguyen et al., 1994). In addition, FGF2/FGFR1 is involved in the invasion and prognosis of oral squamous cell carcinoma (Hase et al., 2006; Pieter et al., 2007). Ishizaki et al. (2000) detected the concentration of FGF2 in 56 saliva samples and suggested that FGF2 in saliva is involved in the reparative processes of mucous membranes. Therefore, we performed a pilot study to investigate the concentration of saliva and serum FGF2/FGFR1 from patients with salivary gland tumors. This is the first report to our knowledge that has assessed the levels of FGF2 and FGFR1 in the saliva and serum of patients with salivary gland tumors. A statistically significant difference was observed between patients with salivary gland tumors and the control group regarding the values of FGF2 and FGFR1 in both saliva and serum, especially in saliva. FGF2 seems promising as a tumor marker. The ROC curve for FGF2 (Fig. 1) in saliva showed that, at a specificity of 80.0%, sensitivity reaches 78.3%, higher than in serum. However, the ROC curve for FGFR1 (Fig. 2) showed that there was no significant difference of sensitivity and specificity characteristics for saliva and serum. Therefore, the saliva levels of FGF2 in patients with salivary gland tumor were significantly associated with the presence of tumor and showed good sensitivity/specificity characteristics in these patients. These results suggest that salivary FGF2 and FGFR1 can be used as potential biomarkers in the diagnosis of salivary gland tumors. However, the sample size in our study may be too small to give a definite statement about the usefulness of FGF2 in the prediction of salivary gland tumors. Considering these preliminary results, further studies with an increased number of patients are needed to clarify the prognostic value and monitoring abilities of FGF2 saliva levels.
Footnotes
Acknowledgments
This work was supported by a research grant from the Educational Department of NingXia Province (2005–2021) and the science funds from the Personal Department of NingXia Province (2006–2021).
Disclosure Statement
No competing financial interests exist.