
Abstract
The abnormal function of O6-methylguanine-DNA methyltransferase (MGMT) is reported to be associated with the occurrence of various tumors and malignant tumor progression. However, little evidence is available to describe its role in esophageal carcinogenesis. To address this issue, we constructed a stable MGMT-silenced esophageal cancer cell line by RNA interference, and exposed the cells to N-methyl-N-nitro-N-nitrosoguanidine (MNNG) to investigate the role that MGMT plays in toxicity. During this time, we also observed the malignant behavior of cells in vitro and in vivo. In addition, two-dimensional electrophoresis and mass spectrometry were used to detect and confirm the proteins that were differentially expressed in the MGMT-deficient and MGMT-proficient cells, which might be responsible for the malignant alteration of cells. Results showed that the IC50 of MGMT-deficient and MGMT-proficient cells exposed to MNNG was 30 μM and 65 μM, respectively, and MGMT-deficient cells had more aggressive motility and invasive abilities compared with MGMT-proficient cells. Nineteen differentially expressed proteins were detected between the MGMT-deficient and MGMT-proficient cells, 14 of which were identified, including the membrane–cytoskeleton linker protein, Ezrin, which was confirmed by both mass spectrometry and western blot analysis. The correlation between MGMT, Ezrin expression, and the malignant behavior of one normal epithelial esophageal cell line and seven esophageal cancer lines is discussed. In conclusion, loss of MGMT expression leads EC109 esophageal cancer cells to have increased malignant behavior, which may correlate with its high Ezrin protein expression.
Introduction
To study the function of MGMT in esophageal cancer, we used RNA interference to silence its expression in the EC109 esophageal cancer cell line. We observed that MGMT-deficient cells had more malignant behavior than MGMT-proficient cells after exposure to a low dose of N-methyl-N-nitro-N-nitrosoguanidine (MNNG). Fourteen differentially expressed proteins between MGMT-deficient and MGMT-proficient cells were identified by two-dimensional electrophoresis and mass spectrometry technology; these proteins maybe responsible for the increased malignant behavior in MGMT-deficient esophageal cancer cells. Of these proteins, we were particularly interested in Ezrin because of its role in the metastatic abilities of cells. We suspected that the malignant progression of EC109 cells might be due to changes in Ezrin expression, which was supported by analyzing the effects of MGMT and Ezrin expression on the malignant behavior of other esophageal cancer lines.
Materials and Methods
Cell culture
One normal esophageal epithelial cell line, H5E46, and eight esophageal cancer cell lines, SHEEC, CaEs-17, EC9706, EC109, TE-10, TE-1, KYSE150, and KYSE510, were cultured in RPMI 1640 (GIBCO) supplemented with 10% fetal bovine serum and penicillin/streptomycin/L-glutamine at 37°C and 5% CO2.
Stable MGMT-silenced EC109 cells by RNA interference
shRNA-expressing plasmid vectors were constructed using pRNAT-CMV3.2/Neo/GFP (Genscript) according to the manufacturer's instructions. Target sites in MGMT mRNA were as follows—sense: 5′ CCAGACAGGTGTTATGGAA 3′, antisense: 5′ TTCCATAACACCTGTCTGG 3′ (Kato et al., 2010) with a loop sequence of TTCAAGAGA. A specific scrambled siRNA sequence (Ambion) was used as the negative control. Then, recombinant plasmid vectors were transferred into DH5α for amplification. Next, constructed plasmid vector DNA was extracted and purified using a QIAGEN Endofree Plasmid Kit (QIAGEN). EC109 cells were transfected with the vector DNA using Lipofectamine2000 (Invitrogen) according to the manufacturer's instructions. The cells were incubated for 72 h with the medium followed by addition of fresh medium containing G418 (800 μg/mL, active components, Geneticin; GIBCO-BRL). After 30–40 days, G418-resistant cell pools were established. The cells with the interference sequence and negative control sequence were named siMGMT-G and siMGMT-Y, respectively.
Quantitative real-time polymerase chain reaction
The transcript level of MGMT was evaluated by quantitative real-time polymerase chain reaction (qRT-PCR). In brief, total RNA was isolated according to the TRIZOL RNA isolation protocol. cDNA synthesis was then performed using M-MLV reverse transcriptase according to the manufacturer's protocol (Promega). The transcript levels of MGMT and Ezrin were analyzed using primers, MGMT: 5′ CCTGGCTGAATGCCTATTTC 3′ (forward) and 5′ GATGAGGATGGGGACAGGATT 3′ (reverse), Ezrin: 5′ GATGATGCGCGCGAGAAGGAGGAGTT 3′ (forward) and 5′ GGGGCGGGGGTGCTGTCAT 3′ (reverse), by RT-PCR (Applied Biosystems, ABI Prism7300) with the SYBR Green method. The relative gene expression of MGMT was normalized to the expression of the housekeeping gene β-actin, which was amplified using primers 5′ CCTGGCACCCAGCACAAT 3′ (forward) and 5′ GCCGATCCACACGGAGTACT 3′ (reverse), via the ΔΔCt method. PCR efficiency (>90%) for each gene was checked via standard dilution curves.
Western blot
Twenty micrograms of cell lysates were separated on 12% sodium dodecyl sulfate-polyacrylamide gel electrophoresis (SDS-PAGE) gels and then transferred onto nitrocellulose membranes. Specific monoclonal anti-MGMT, monoclonal anti-β-actin, and monoclonal anti-Ezrin primary antibodies (all from Santa Cruz Biotechnology) were used, and HRP-conjugated immunoglobulin was used as a secondary antibody (Jackson ImmunoResearch Laboratories). West Pico chemiluminescent (Pierce) was used as the substrate to visualize protein bands, which were quantified using densitometric image analysis software (Image Master VDS; Pharmacia Biotech). Normalization was made against β-actin expression.
Chemical treatment
MNNG (Sigma) was dissolved in a small quantity of dimethyl sulfoxide (DMSO) that was freshly made for each experiment and adjusted with the appropriate volume of distilled water.
Measurement of cell survival
The cytotoxicity of MNNG was examined by the 3-(4,5-Dimethylthiazol-2-yl)-2.5-diphenyltetrazolium bromide (MTT) test as previously described (Zhu and Yu, 2004). Briefly, corresponding cells were seeded at ∼1×10⁴ cells per well in 96-well tissue culture trays. Confluent monolayers were washed and incubated with medium containing 0.625, 1.25, 2.5, 5, 10, 20, 40, 80, and 160 μM of MNNG. Then 100 μL medium containing 0.5 mg/mL MTT was added to each well after 24 h of MNNG treatment. The medium was discarded, followed by addition of 150 μL DMSO to each well to dissolve the formazan. Absorbance was measured at 570 nm in a microtiter plate reader (BioTek). Relative survival was represented as the absorbance of treated sample/absorbance of control group.
Cell migration assay
The migratory ability of cells was evaluated as previously described (Thompson et al., 2007). In brief, siMGMT-G and siMGMT-Y cells were treated with 10 μM MNNG for 24 h. After being cultured for 2 weeks, cells went through three passages and were seeded at 1×10⁶ cells/mL in six-well dishes. Confluent monolayers were wounded using a pipette tip, and photographs were taken immediately: 0, 24, and 48 h, respectively. Cell migration was measured as the distance from the cell monolayer to the leading edge of the wound. Results are presented as a migration index, that is, the migration distance of siMGMT-G cells relative to the migration distance of control siMGMT-Y cells. Experiments were carried out in triplicate and repeated at least five times.
Cell invasion assay
The invasive ability of siMGMT-G, siMGMT-Y (2 weeks after MNNG exposure, as migration assay), and the other eight cell lines was measured using 24-well transwell units with polycarbonate filters (pore size, 8 μm) coated on the upper side with Matrigel (Becton Dickinson Labware) according to the manufacturer's protocol. Briefly, 1×10³ cells in 100 μL medium were seeded in the top chamber. The bottom chamber contained 10% fetal calf serum medium. After a 24-h incubation, noninvasive cells were removed with a cotton swab. Cells that migrated to the bottom surface of the membrane were fixed in formaldehyde, stained with 0.1% crystal violet solution, and counted under a microscope.
In vivo tumor study
Five-week-old male athymic BALB/c mice were used in the study, and maintained in a laminar flow cabinet under specific pathogen-free conditions. siMGMT-G and siMGMT-Y cells (the time point was in accordance with the in vitro study described previously) were harvested from subconfluent monolayer cultures by 0.25% trypsin, and washed with PBS twice before being resuspended in 100 μL PBS with 1×10⁶ cells for left armpit subcutaneous injection into nude mice. Four weeks after injection, animals were killed, the length (L), width (W), height (H), and weight of tumors were measured, and tumor mass was calculated using the formula: π/6×L×W×H (Tomayko and Reynolds, 1989).
Two-dimensional electrophoresis and protein identification
To acquire high-quality authentic protein, corresponding cells were homogenized with a homogenizer in lysis buffer containing 7 M urea, 2 M thiourea, 4% (w/v) 3-[(3-cholamidopropyl)-dimethylammonio]-1-propane (CHAPS), 1% (w/v) dithiothreitol (DTT), 1% protease inhibitor cocktail (v/v), and 2% (v/v) immobilized pH gradient (IPG) buffer (pH 3–10) at 11,000 IU/min on ice, and then centrifuged at 40,000 g for 1 h at 4°C. The supernatant was saved and quantified by the bicinchoninic acid method (BCA). The 24-cm precast IPG strips were rehydrated for 12 h in ceramic strip holders in 450 μL of sample buffer containing 8 M urea, 2% CHAPS, 20 mM DTT, 0.5% (v/v) IPG buffer (pH 3–10), and 0.001% bromophenol blue with a linear pH range of 3–10 on an Ettan IPGphor3 (GE Healthcare). Next, 80 μg of protein was loaded, and first-dimensional isoelectric focusing (IEF) was carried out at 18°C using the linear ramping mode of the IEF voltage. Strips were then immediately equilibrated at room temperature for 15 min in an equilibration solution consisting of the same recipe with DTT replaced with 2.5% (w/v) iodoacetamide. Second-dimensional SDS-PAGE was performed on 12.5% SDS gels in an Ettan DALTsix apparatus (GE Healthcare) with constant power at 5 W per gel for the first 30 min, followed by 12 W per gel for 6–7 h. Gels were silver stained as previously described (Shevchenko et al., 1996). Three replicates were run for all samples. Sequentially, the differentially expressed proteins were analyzed by Image Master™ 2D platinum software (Version 5.0; GE Healthcare) for spot detection, quantification, matching, and comparative analysis. Data were averaged from three independent experiments, and the statistical significance was calculated and assessed using the Student's t-test (Image Master 2D platinum software). Statistical significance was established at p<0.05, and the average spot intensity was greater than 1.2-fold (Shan et al., 2007).
Finally, protein spots were excised and digested with trypsin. Peptide masses were identified by matrix-assisted laser desorption/ionization-time of flight (MALDI-TOF) mass spectrometry and tandem TOF/TOF mass spectrometry on a time-of-flight Ultraflex II mass spectrometer (Bruker Daltonics). Peptide mass maps were acquired in positive reflection mode, averaging 800 laser shots per MALDI-TOF spectrum and 800 shots per TOF/TOF spectrum. Resolution was 15,000–20,000. The Bruker calibration mixtures were used to calibrate the spectrum to a mass tolerance within 0.1 Da. Each acquired mass spectrum (m/z range 700–4000) was processed using the software FlexAnalysis v.2.4 (Bruker Daltonics). The peak detection algorithm was SNAP (sort neaten assign and place); S/N threshold, 3; quality factor threshold, 50. The tryptic autodigestion ion picks (842.51 and 2211.10 Da) were used as internal standards to validate the external calibration procedure. Matrix and/or autoproteolytic trypsin fragments and known contaminant ions, such as keratins, were excluded. The resulting peptide mass lists were used to search the IPI human sequence database. The following search parameter criteria were used: significant protein MOWSE score at p<0.05, minimum mass accuracy of 100 ppm, trypsin as an enzyme, one missed cleavage site allowed, cysteine carbamidomethylation, acrylamide modified cysteine, methionine oxidation, similarity of isoelectric point and relative molecular mass specified, and minimum sequence coverage of 15%.
Results
Stable MGMT-RNA interference was constructed in EC109 cells. After G418 selection, green fluorescent protein expression in cells was observed using an inverted fluorescence microscope (Fig. 1). The silencing effect of MGMT expression was evaluated by qRT-PCR and western blot analysis. The results showed that the transcript level of MGMT in siMGMT-G cells was downregulated to 0.23-fold compared with EC109 cells, and the transcript level of MGMT in siMGMT-G cells was 0.27-fold of siMGMT-Y cells. The protein expression of MGMT in siMGMT-G cells was lower than that in siMGMT-Y and EC109 cells, which was in accordance with the qRT-PCR results (Figs. 2 and 3).
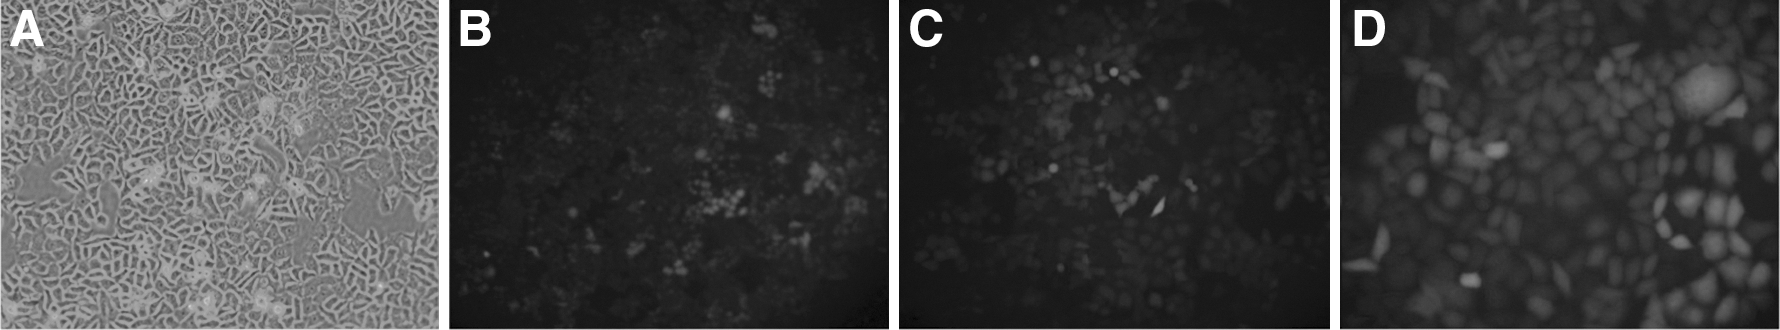
Expression of GFP protein in transfected cells.
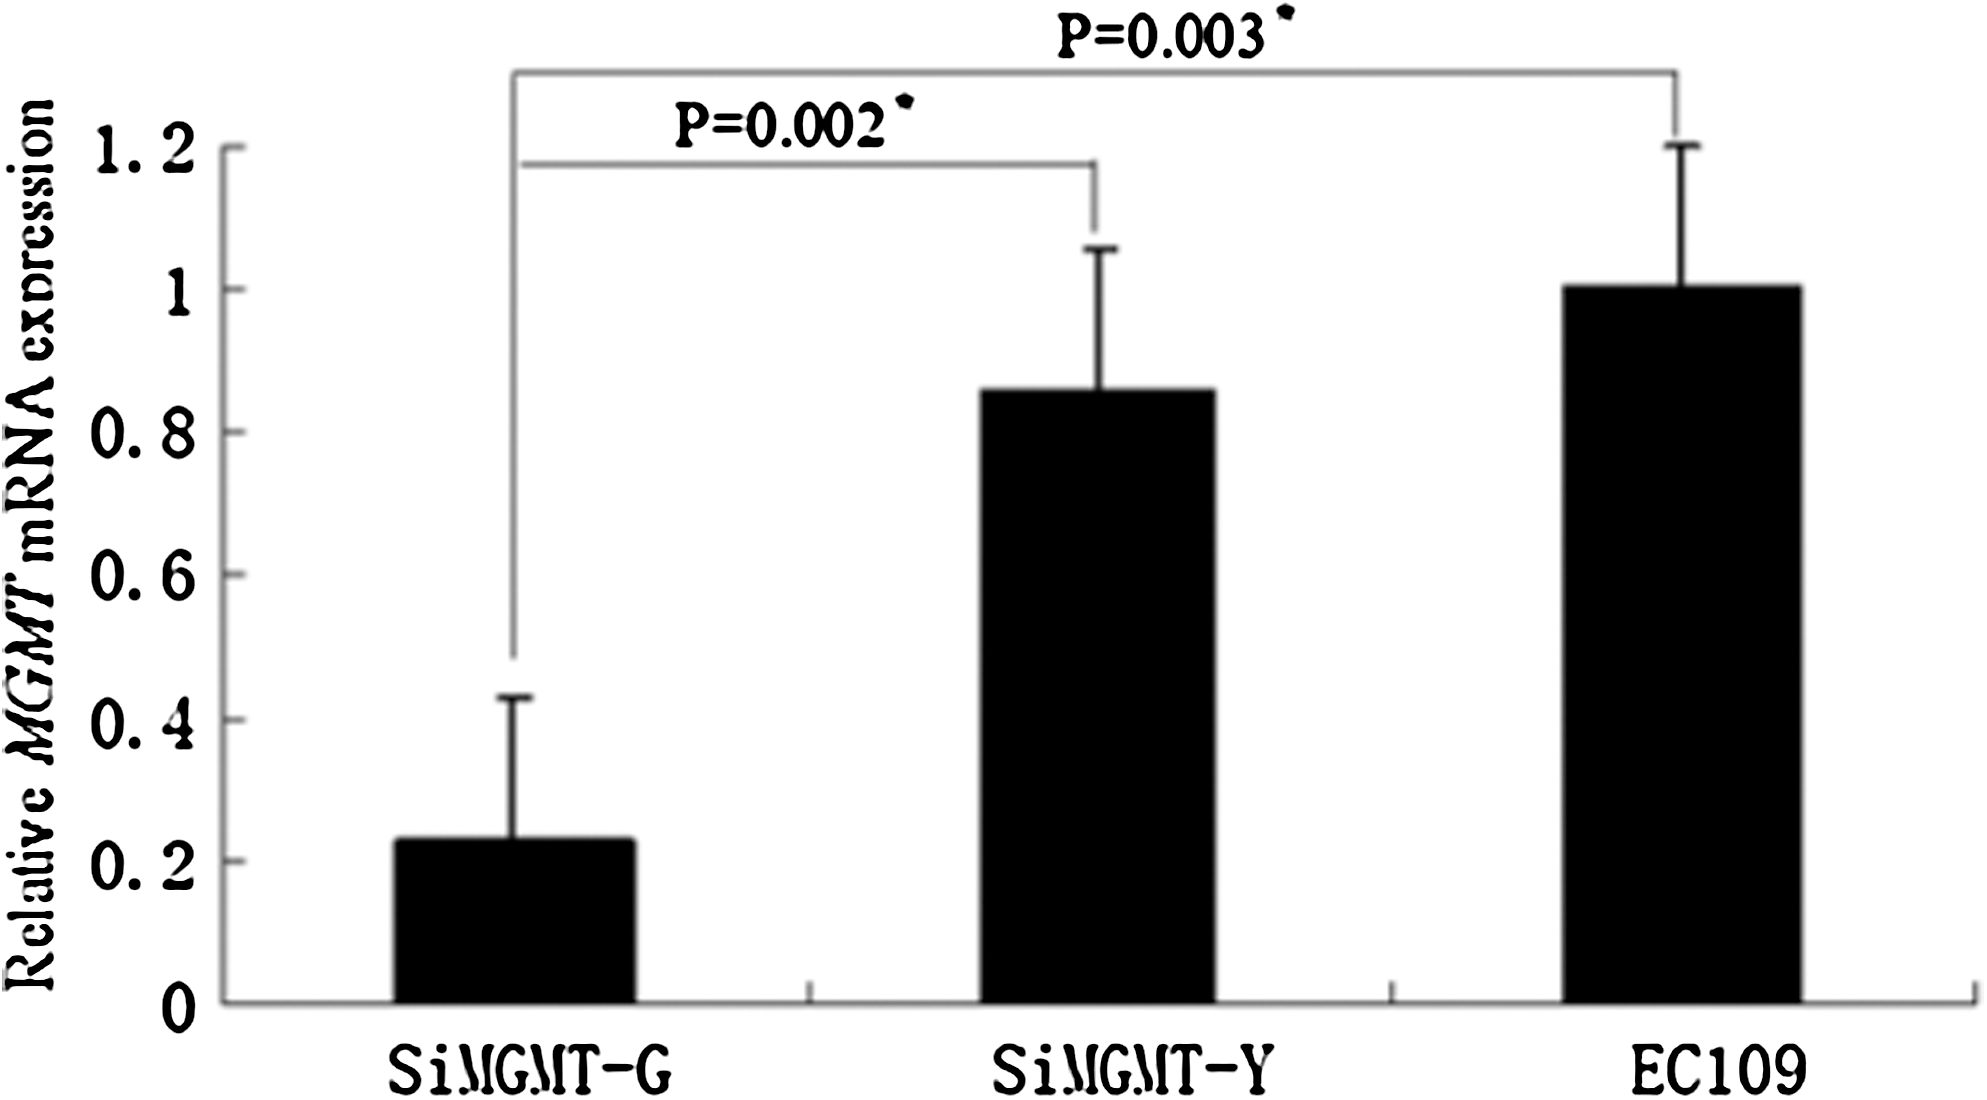
Relative transcript level of MGMT in siMGMT-G cells: 0.26±0.03- and 0.23±0.07-fold compared with that in siMGMT-Y and EC109 cells (we defined MGMT mRNA in EC109 as a standard), respectively, which is statistically significant. *, statistical significance was found between siMGMT-G MGMT expression and siMGMT-Y MGMT expression, EC109 MGM expression.
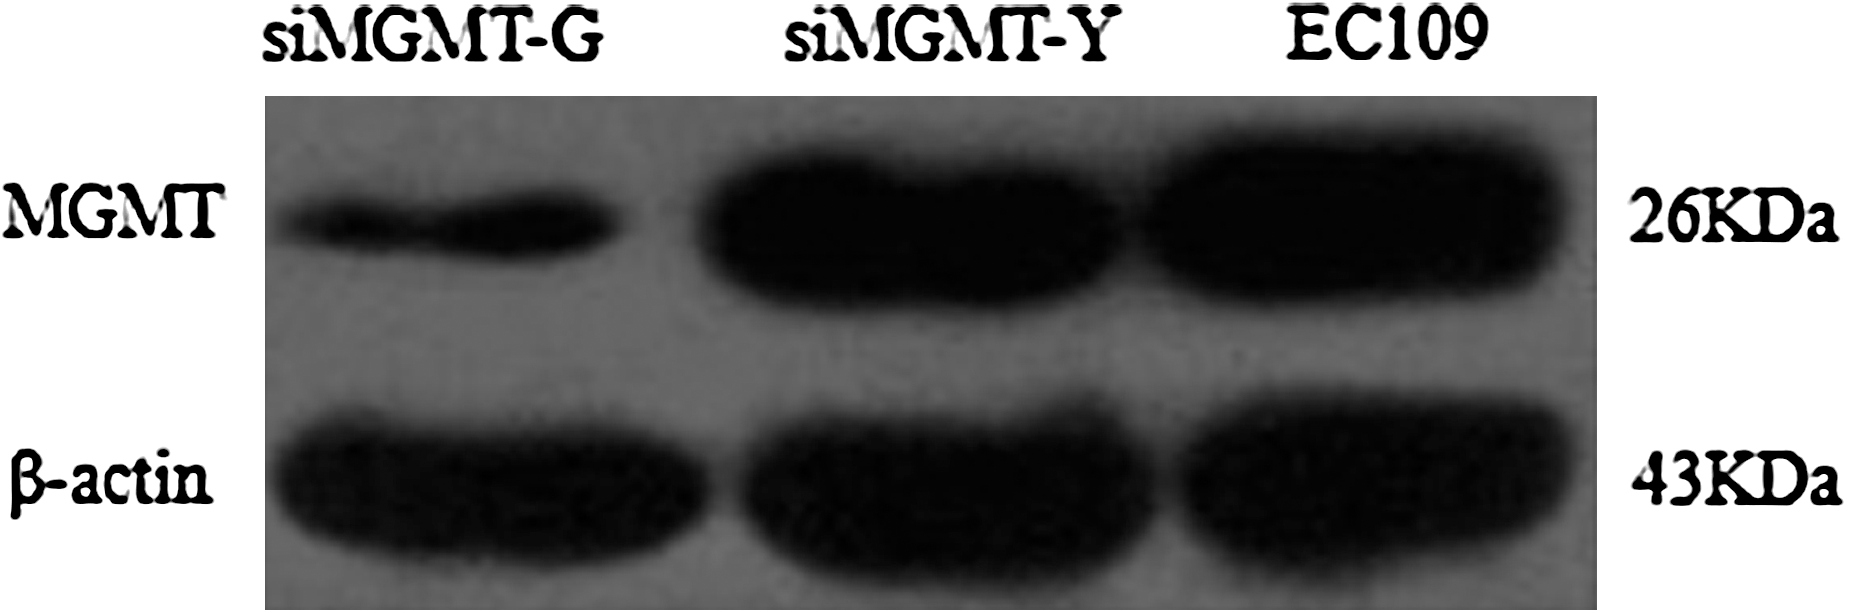
Protein expression of MGMT quantified by western blot analysis in siMGMT-G, siMGMT-Y, and EC109 cells. In accordance with the transcript level of MGMT, its protein level in siMGMT-G was 26% and 24% of siMGMT-Y and EC109, respectively.
The cytotoxity assay showed that siMGMT-G cells were more sensitive to MNNG cytotoxity. The IC50 of siMGMT-G was ∼35 μM, which was lower than that of siMGMT-Y (65 μM), and comparative dose–response curves were observed above 10 μM in both cell lines. The survival curves of siMGMT-G and siMGMT-Y from 20 to 160 μM, respectively, indicated that siMGMT-G cells were more sensitive to MNNG when exposed to higher doses. However, no obvious cytotoxicity was observed at doses of 10 μM or less (Fig. 4). To avoid the cytotoxic effect of MNNG, we selected the dose of 10 μM MNNG to stimulate malignant behavior in siMGMT-G and siMGMT-Y cells. After a 24-h exposure, the medium was refreshed and the cells were cultured for another 2 weeks (three passages during which malignant behavior was observed) and harvested for migration and invasion assays. As shown in Table 1, siMGMT-G cells had more aggressive invasive abilities, as the rate of cells that passed through extracellular matrix (ECM) membrane was 69% higher than that of siMGMT-Y cells, which had a rate of 37%. In addition, the wound-healing assay revealed that the migration index of siMGMT-G cells was 0.8 (24 h) and 1.3 (48 h), which was greater than that of the siMGMT-Y cells, which had a migration index of 0.5 (24 h) and 0.8 (48 h) (Fig. 5). Furthermore, the increased malignant behavior of siMGMT-G cells was also confirmed in a nude mice xenograft model. Tumor tissue isolated from the siMGMT-G injection group displayed more remarkable tumor parameters, in that tumor mass and tumor weight/total had greater values than the siMGMT-Y injection group (Table 2 and Fig. 6).
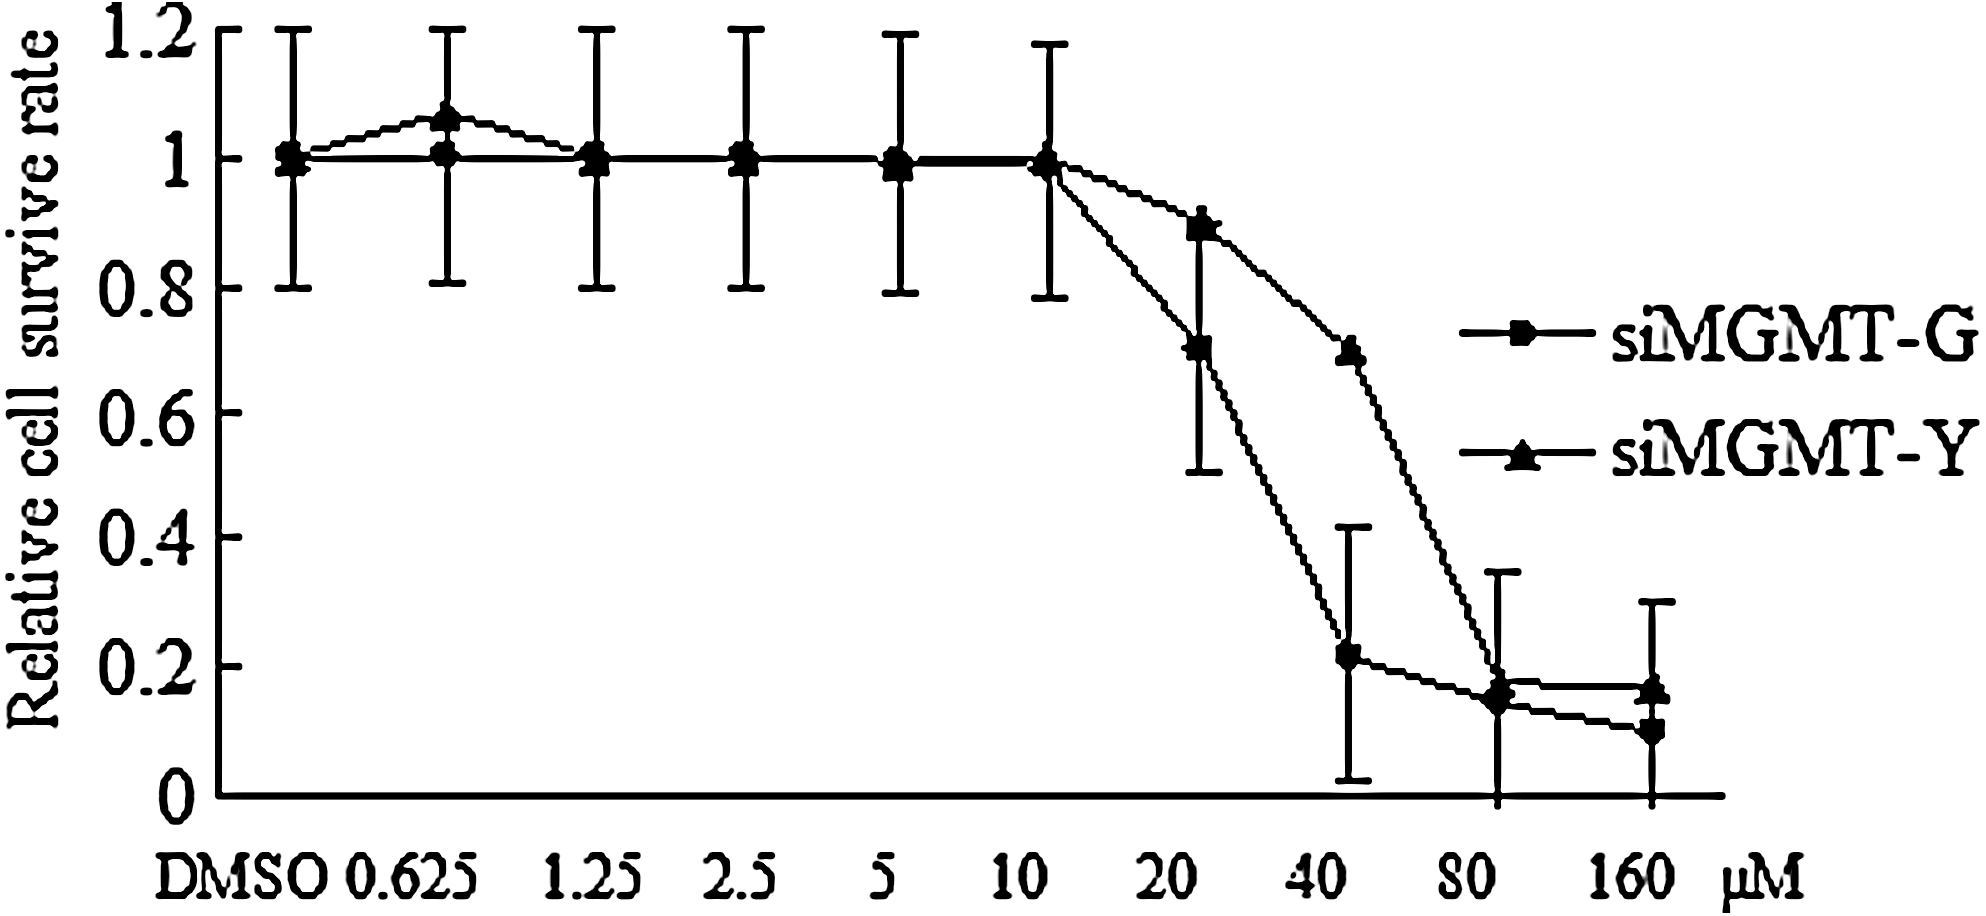
Cell survival rate of siMGMT-G and siMGMT-Y after a 24-h exposure to MNNG with DMSO as a negative control. Comparative dose–response curves were present above 10 μM in both cell lines and IC50 of siMGMT-G and siMGMT-Y was 35 μM and 65 μM, respectively. The survival rate curves showed that siMGMT-G was more sensitive to MNNG. Statistical significance of cell survival rate between the two cell types was found at 40 μM. MNNG, N-methyl-N-nitro-N-nitrosoguanidine; DMSO, dimethyl sulfoxide.
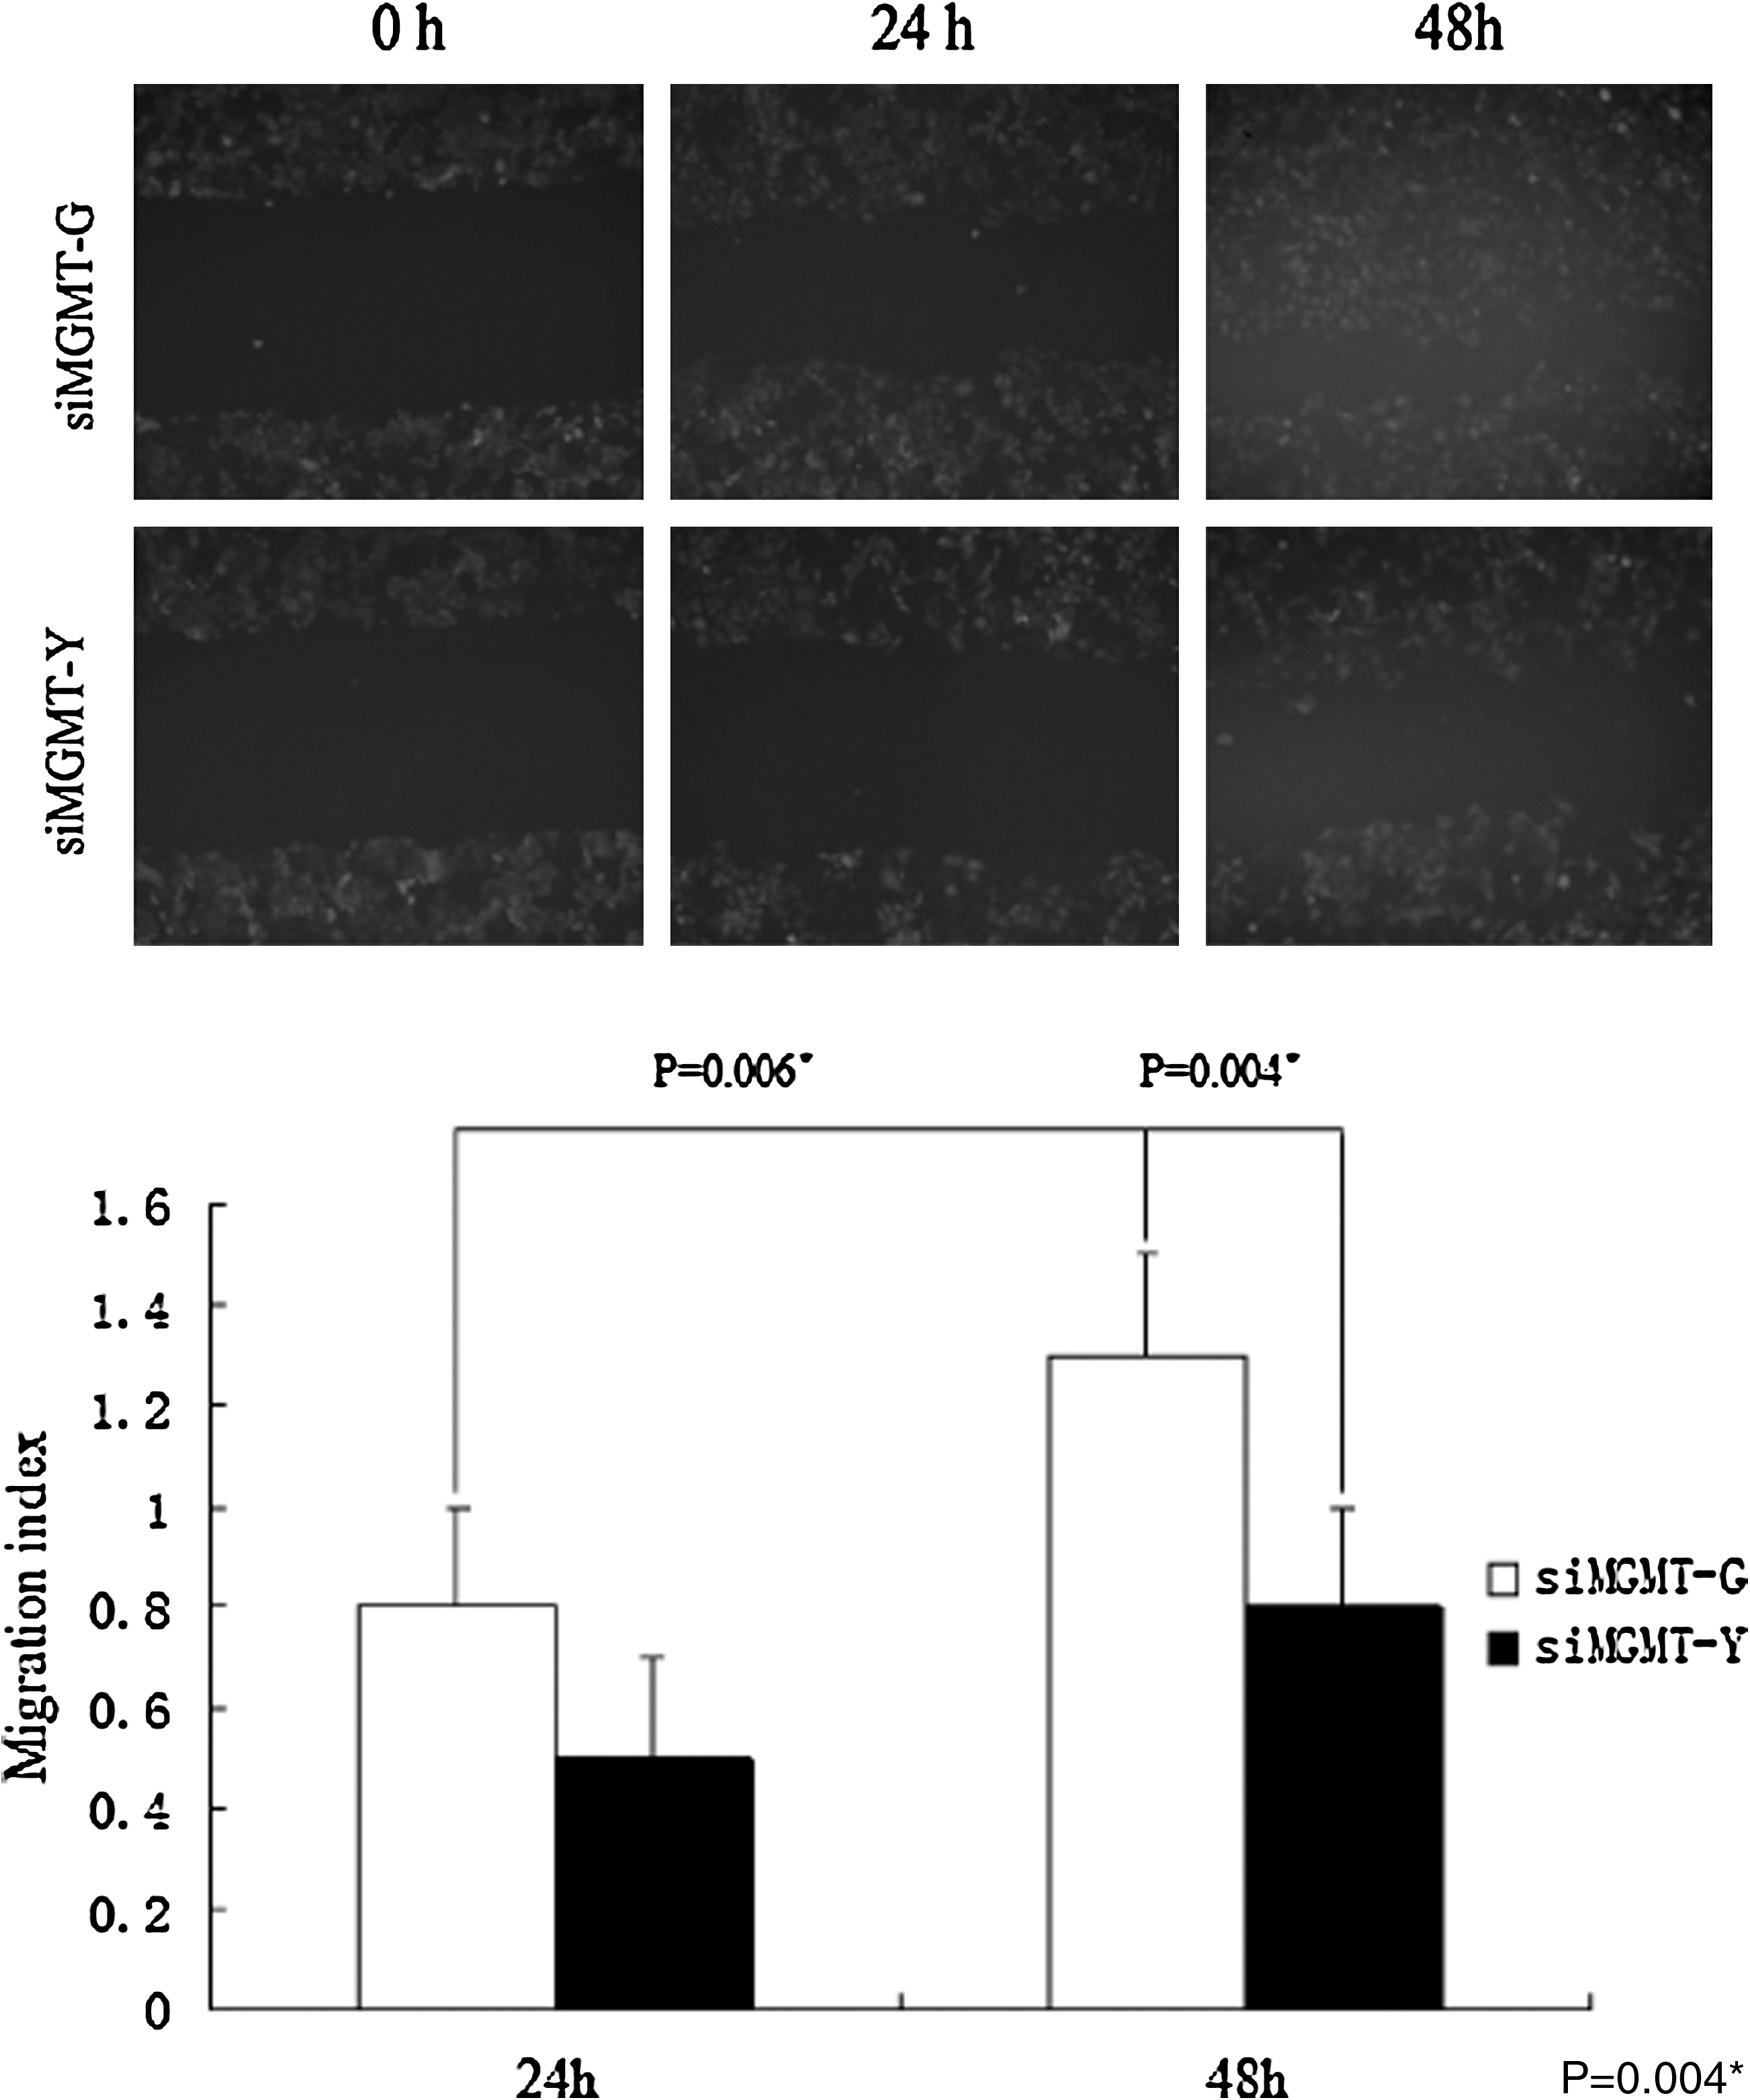
The ability of cell motility through the level of scratch healing. Data and representative images are shown for the two lines: siMGMT-G had a migration index of 0.8 (24 h) and 1.3 (48 h) higher than that of siMGMT-Y, with an index of 0.5 (24 h) and 0.8 (48 h), respectively. The differences were statistically significant. *(p=0.006): the migration index of siMGMT-G at 48h was larger than that at 24h with statistical significance. *(p=0.004): at 48h. The migration index of siMGMT-G was larger than that of siMGMT-Y and statistical significance was found.
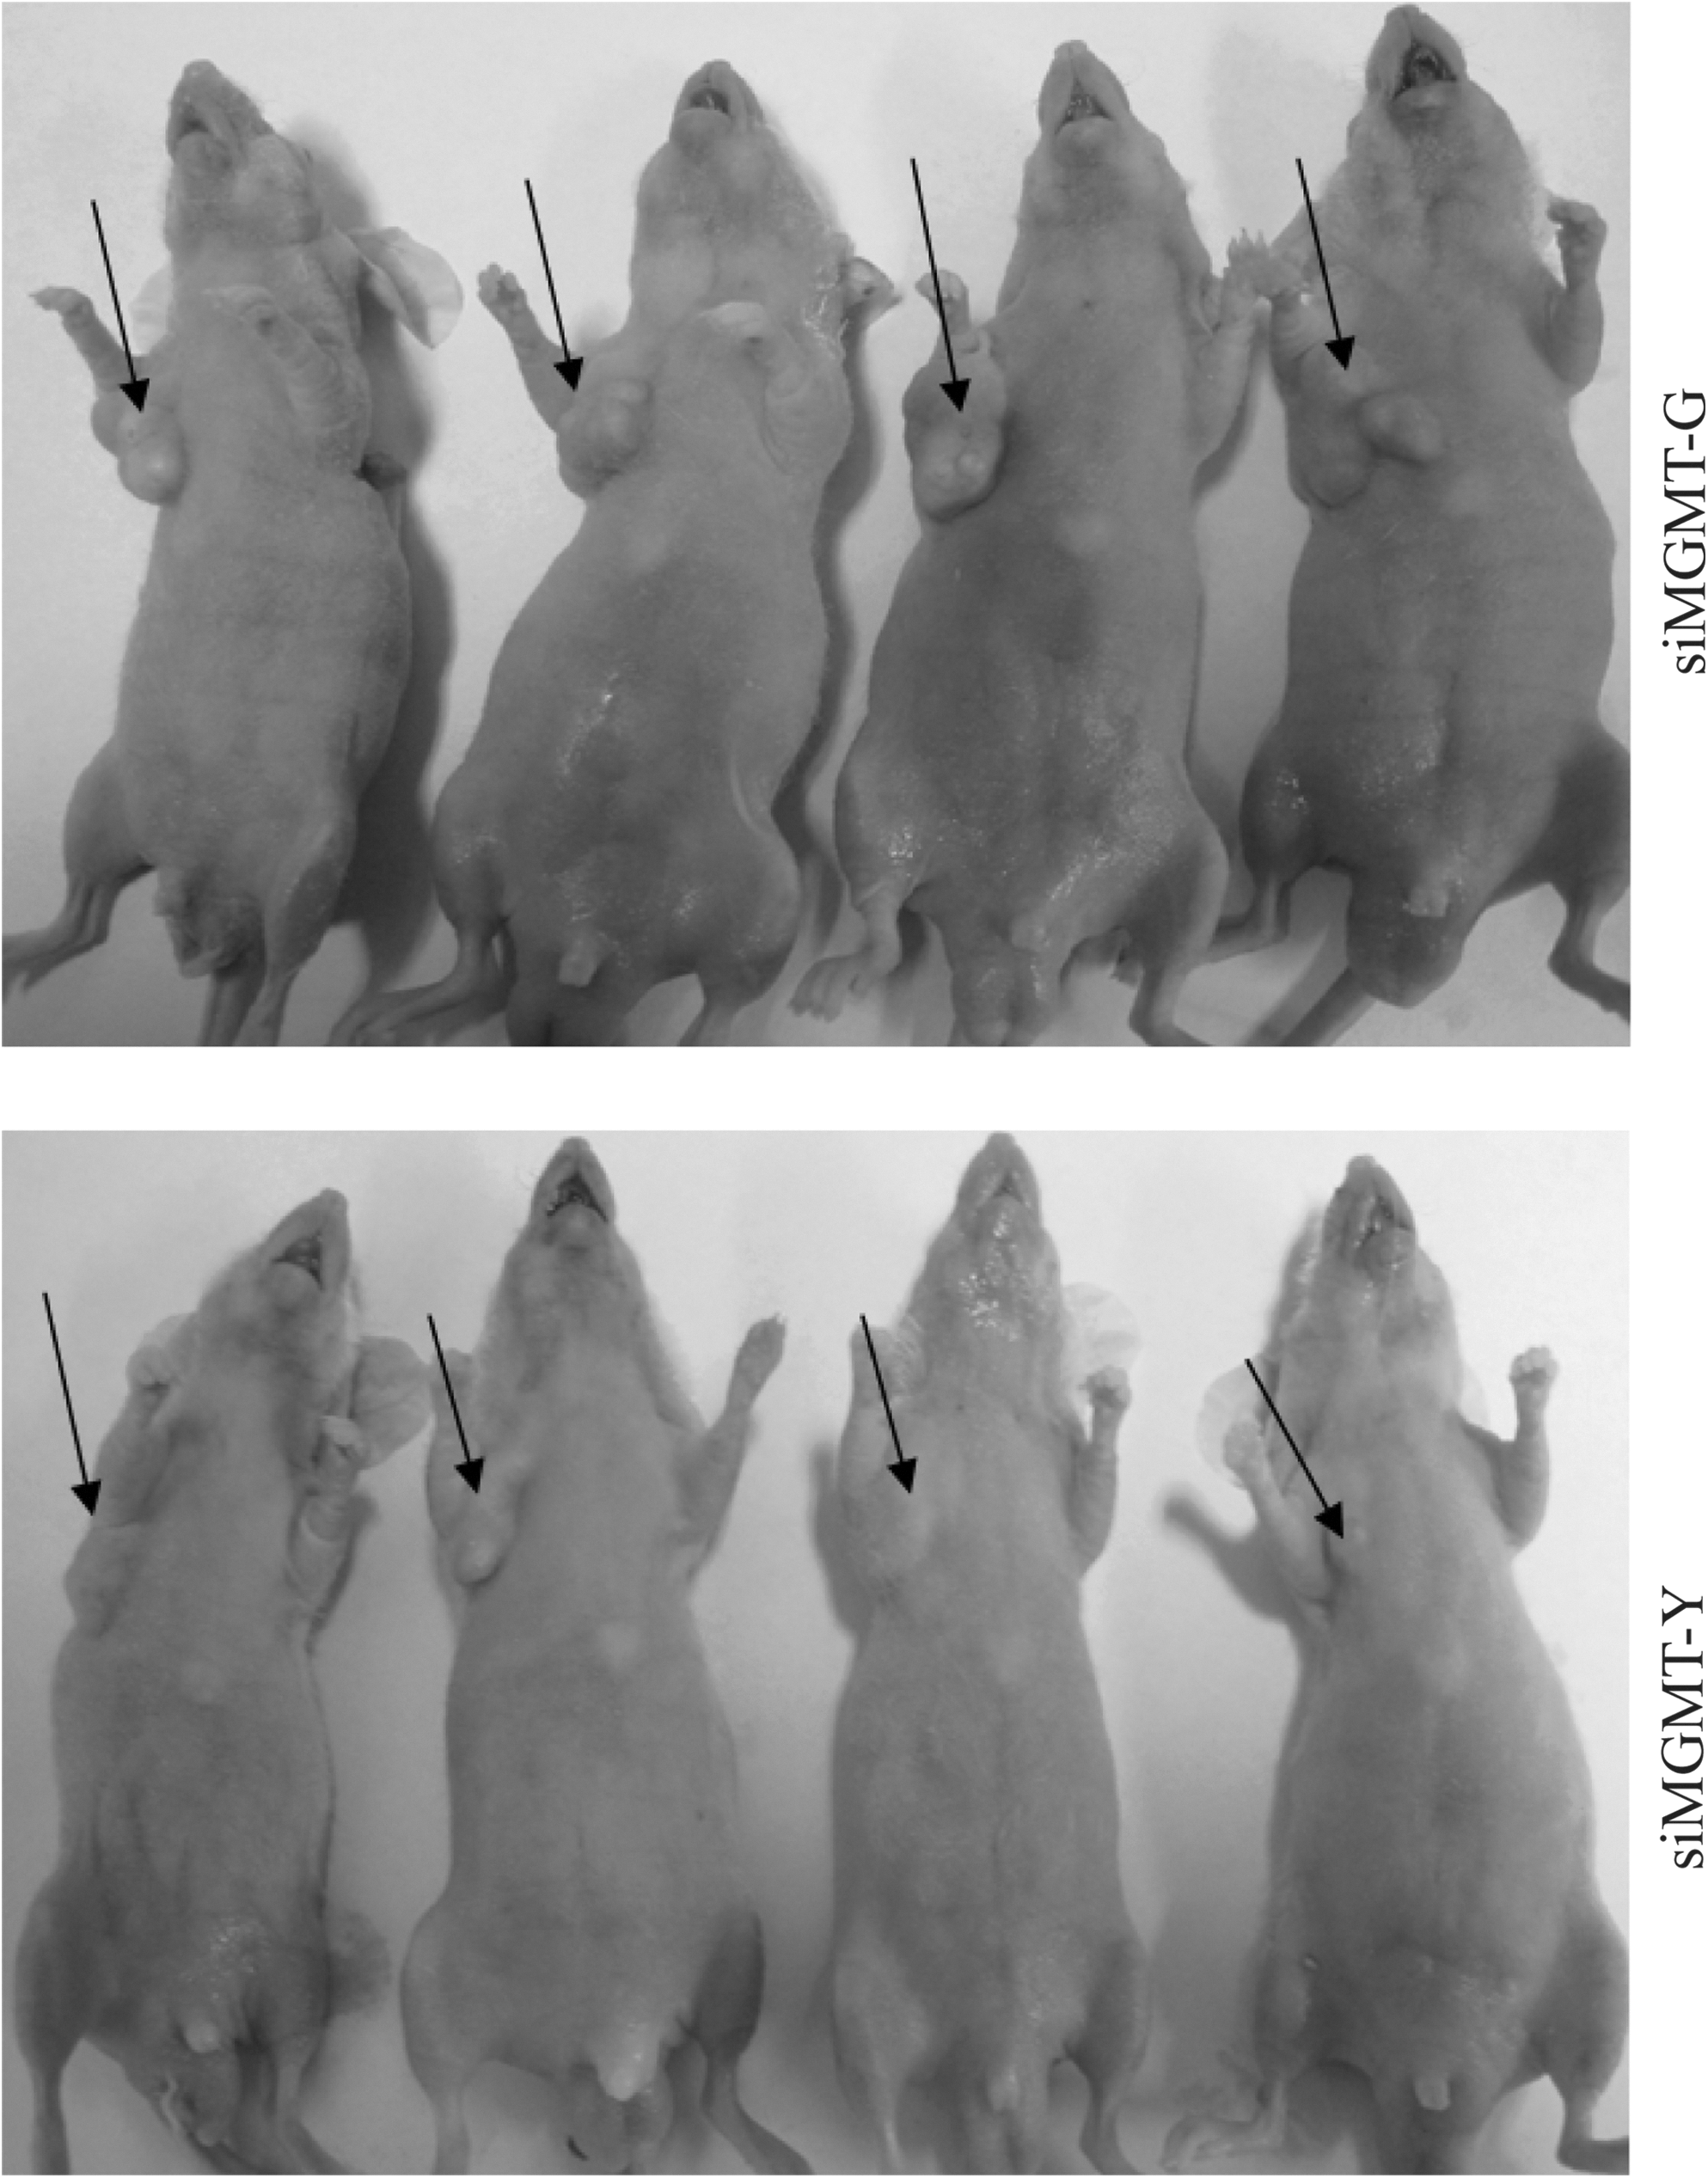
Tumors in the left armpit of individual mice.
In vitro invasion assay showed that more siMGMT-G cells passed through the ECM membrane with a rate of 69%, which is statistically significant compared with siMGMT-Y cells, demonstrating that siMGMT-G acquired a more progressive capability of invasion.
ECM, extracellular matrix.
Statistical significance was found.
Tumor size in individual mice was calculated through the formula: π/6×L×W×H, the value of tumor weight/total weight was also evaluated. The siMGMT-G injection group had higher values of the two parameters and statistical significance was found.
L, length; W, width; H, height; total weight, the weight of the whole body of individual nude mouse.
Tumor mass: π/6×L×W×H T/T: Tumor weight/Total weight.
P1 : Tumor mass was statistically compared between siMGMT-G and siMGMT-Y (Levene's test).
P2 : T/T was statistically compared between siMGMT-G and siMGMT-Y (Levene's test).
Next, two-dimensional electrophoresis (2-DE) was carried out to detect the differentially expressed proteins that maybe responsible for the differences in malignant behavior between siMGMT-G and siMGMT-Y cells. Interestingly, 19 differentially expressed proteins were found (Fig. 7), among which 14 proteins were identified (Table 3) by mass spectrometry. We subsequently focused our study on spot 1816, and mass spectrometry confirmed its identity: Ezrin, a membrane–cytoskeleton linker protein (Fig. 7). Its differential expression between siMGMT-G and siMGMT-Y cells was verified by western blotting, which showed that protein levels was 2.89-fold higher in siMGMT-G cells than in siMGMT-Y cells (Fig. 8).
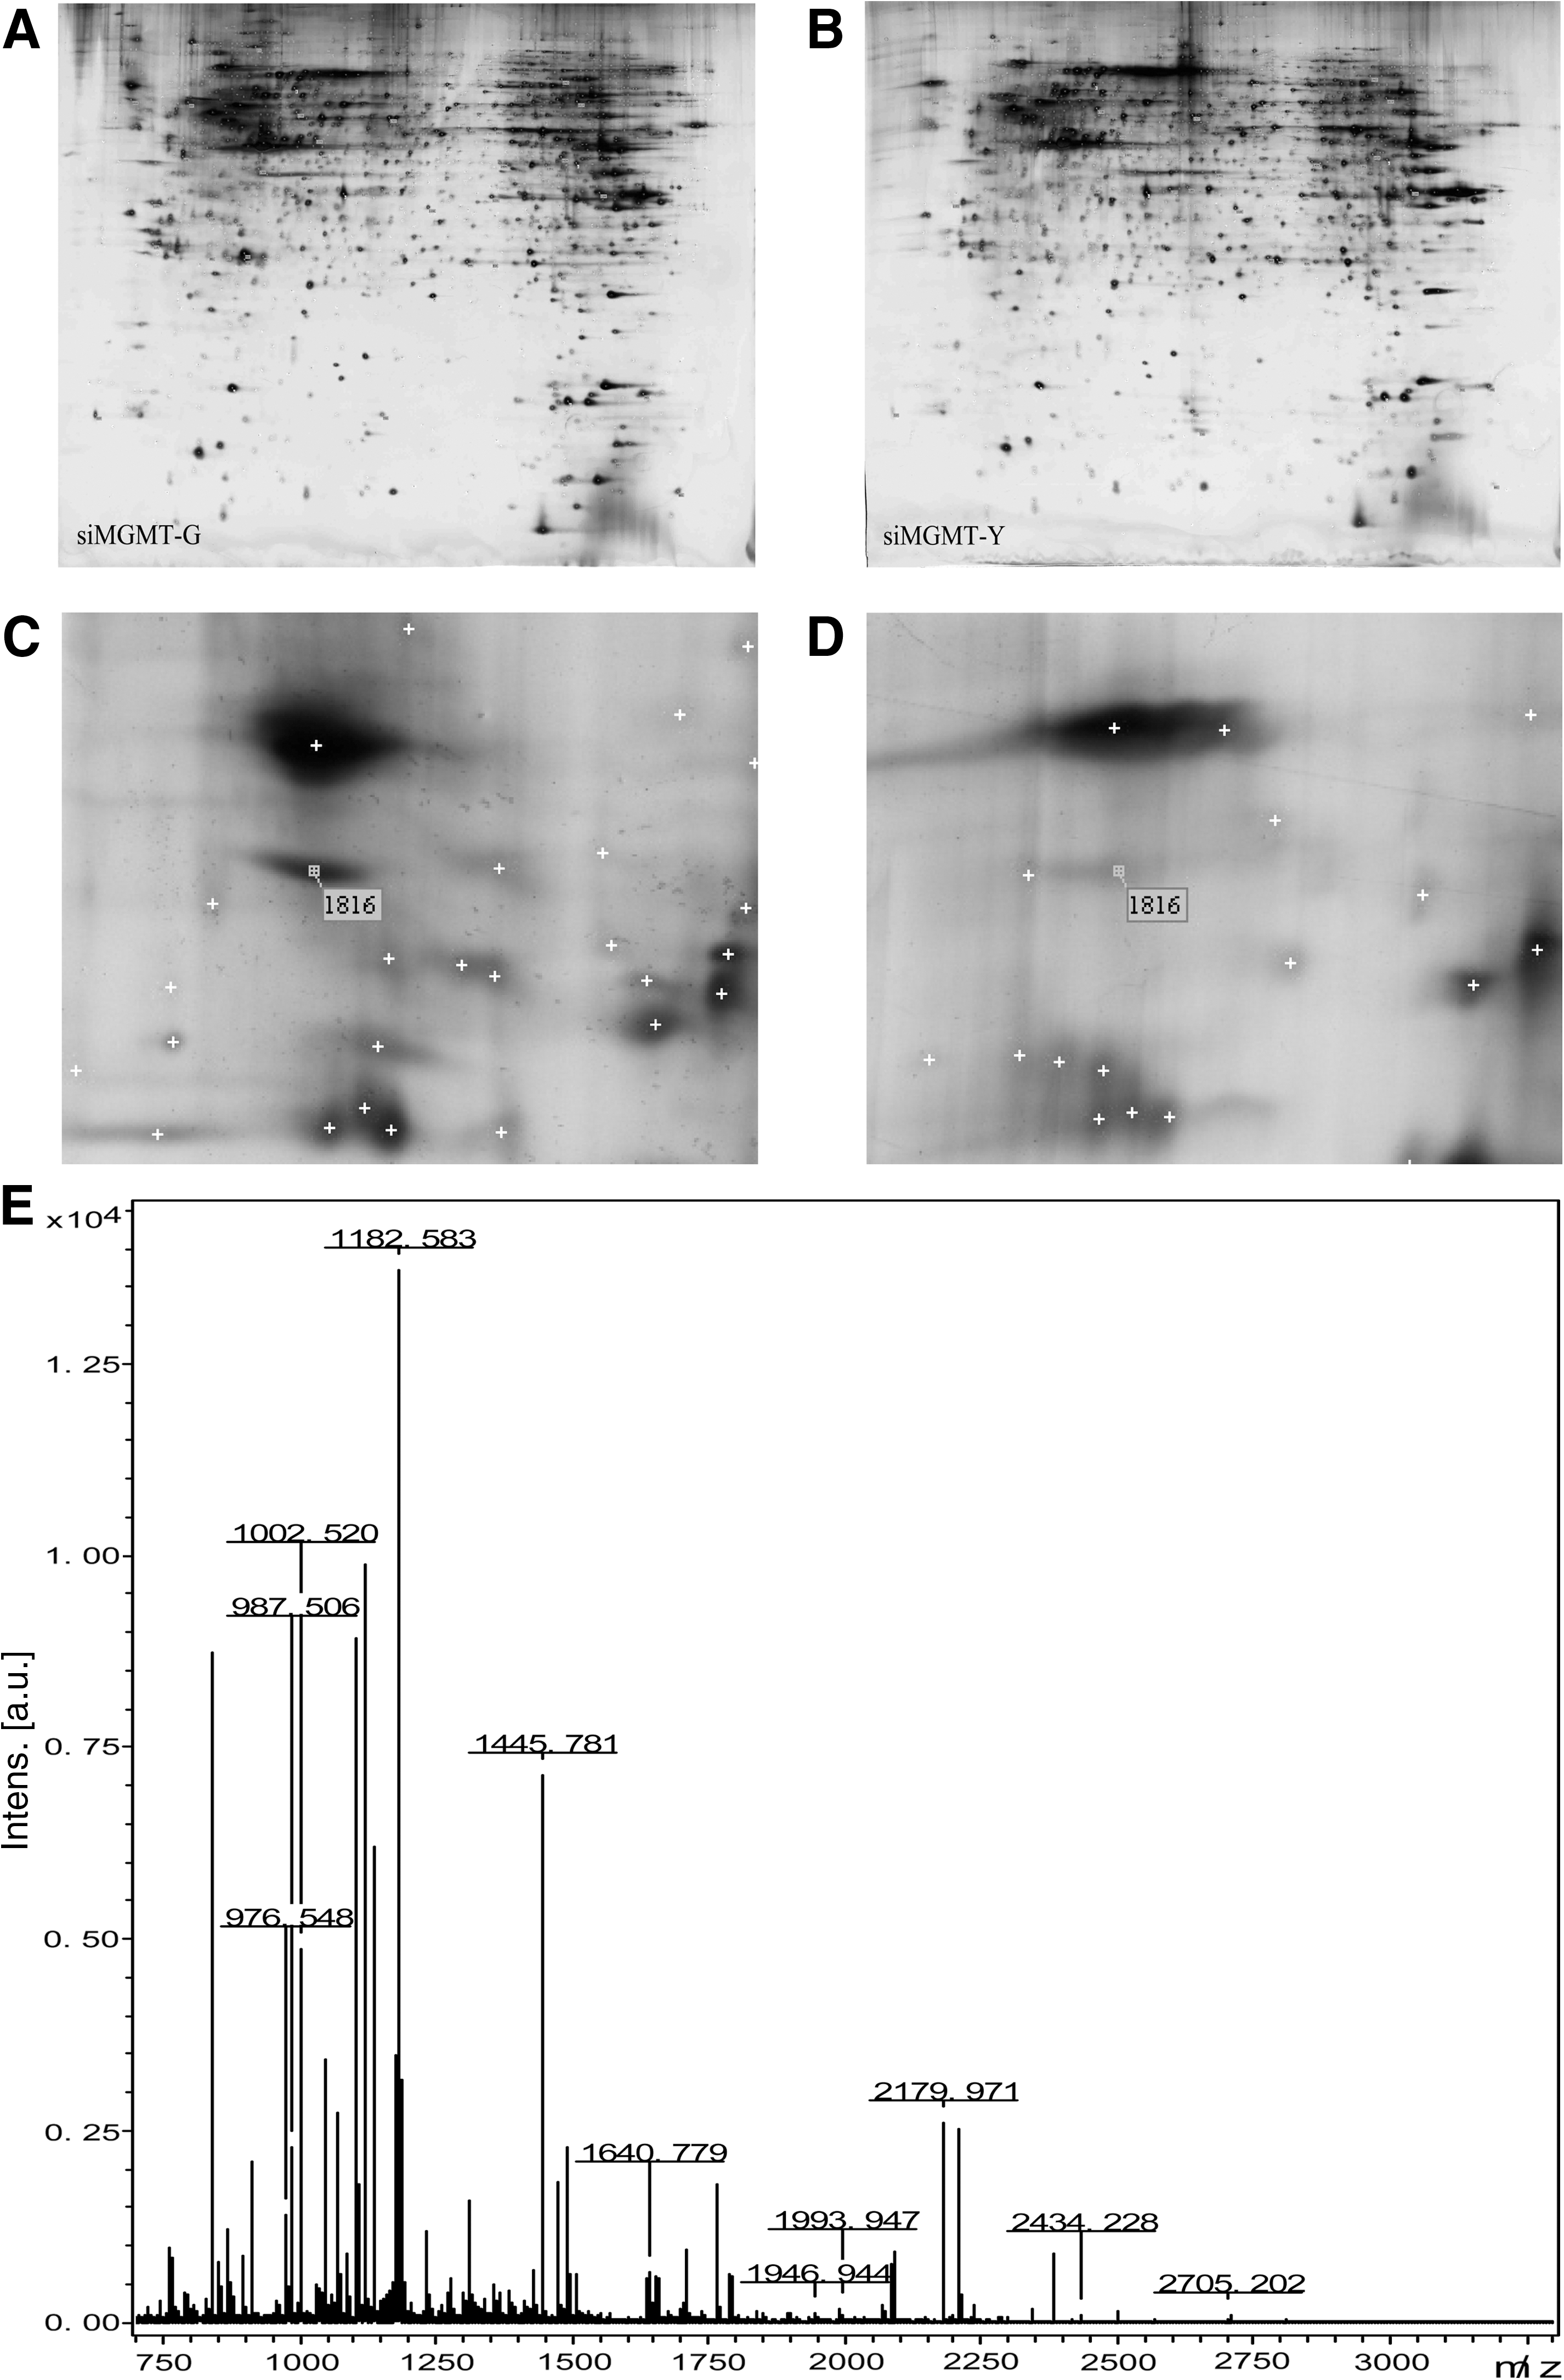
Representative image of two-dimensional electrophoresis (2-DE) silver-stained polyacrylamide gel. Identified spots are indicated by spot numbers. Proteins were extracted from siMGMT-G
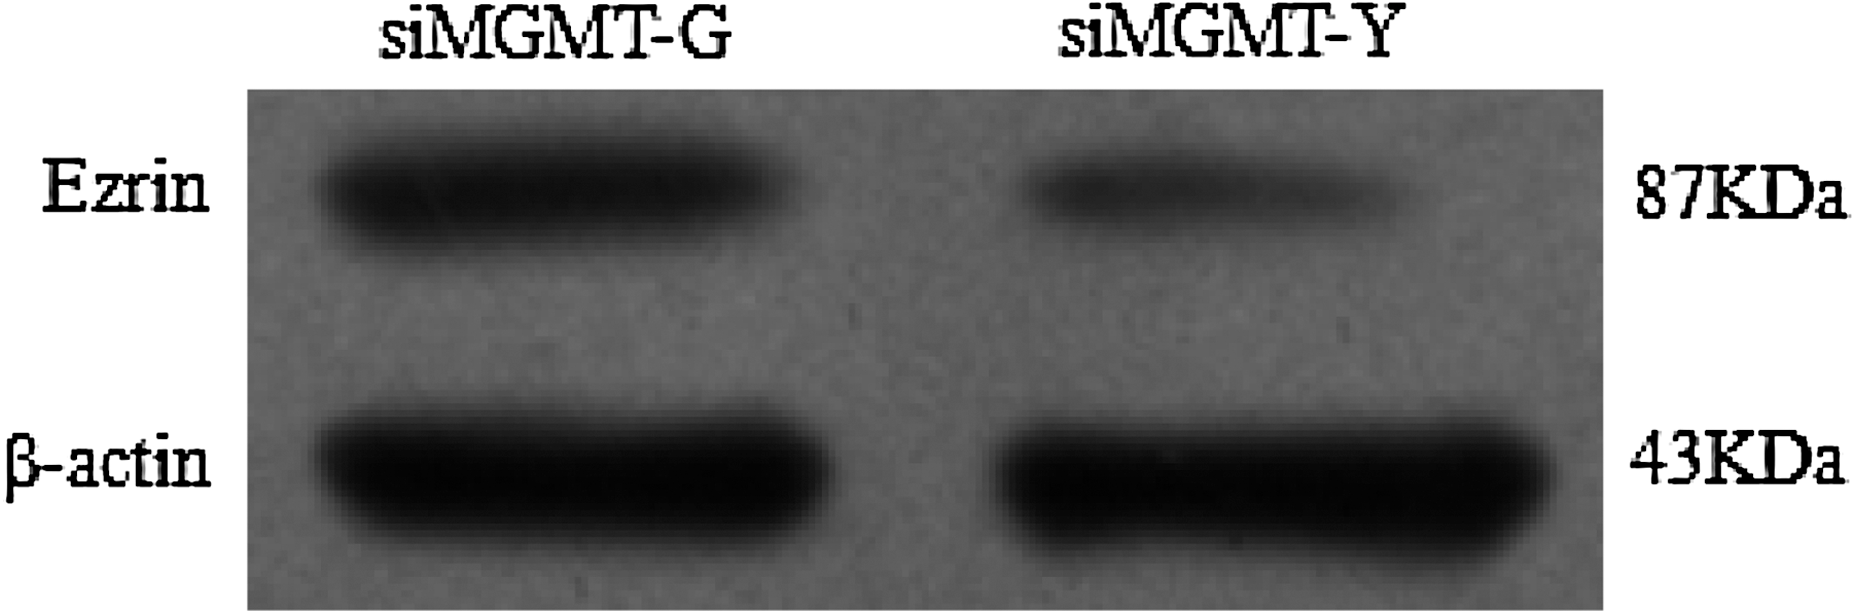
Ezrin protein expression variation was confirmed in siMGMT-G and siMGMT-Y cells after 10 μM MNNG exposure for 24 h: 2.89-fold in siMGMT-G than that in siMGMT-Y (the time point was in accordance with the wound healing and in vitro invasion assay).
Fourteen proteins that were identified are shown in this table, but the other five proteins were unconfirmed (not listed in the table).
pI, isoelectric point.
In addition, we evaluated MGMT and Ezrin expression at the transcript and protein level in the normal esophageal epithelial cell line and in eight esophageal cancer lines. As Figures 9 and 10 show, expression of the two proteins was in accordance with mRNA expression in the nine cell lines, and the expression profiles of the two genes had no significance in H5E46, SHEEC, CaEs-17, EC9706, EC109, and TE-10 cells; however, MGMT had decreased expression in TE-1, KYSE150, and KYSE510 compared with the other six cell lines. In contrast to MGMT, Ezrin was more highly expressed in TE-1, KYSE150, and KYSE510 cells in comparison with the other six cell lines.

mRNA expression of MGMT and Ezrin in the nine cell lines. In the MGMT expression figure, we defined the MGMT mRNA level of H5E46 as the standard, and compared the mRNA level in other eight cell lines with H5E46. No statistical significance was found between H5E46, SHEEC, CaEs-17, EC9706, EC109, and TE-10; however, the MGMT mRNA level in TE-1, KYSE150, and KYSE510 was obviously lower than that in the former six cell lines and we detected a statistically significant difference between EC109 (the lowest MGMT mRNA expression level among the former six cell lines) and TE-1 (the highest MGMT mRNA expression level among the latter three cell lines). In the Ezrin expression figure, we defined the expression level in KYSE510 as standard. Ezrin mRNA level in TE-1, KYSE150, and KYSE510 was significantly higher than that in the former six cell lines, and a statistically significant difference was detected between EC109 (the highest Ezrin mRNA expression level among the former six cell lines) and TE-1 (the lowest Ezrin mRNA expression level among the latter three cell lines). *Statistical significance was found.

MGMT and Ezrin protein expression in the nine cell lines. The trend of MGMT and Ezrin protein expression in the nine cell lines was in accordance with the corresponding mRNA expression level—lower MGMT expression and higher Ezrin expression in TE-1, KYSE150, and KYSE510.
We assayed the invasive abilities of the nine cell lines sequentially (Fig. 11 and Table 4), and found that KYSE150 and KYSE510 cells were more progressive in passing through the ECM membrane compared with the other seven cell lines. Interestingly, the two cells had a similar gene expression profile; MGMT had low expression levels and Ezrin was highly expressed, which reasonably correlates with the more malignant behavior of these two cell lines. Although TE-1 cells have a similar gene expression profile as KYSE150 and KYSE510 cells, its invasive abilities are not as advanced as the other six cell lines.

The number of cells of the nine cell lines that passed through ECM in in vitro invasion assay, stained by 0.1% crystal violet solution, under 200 magnification. ECM, extracellular matrix.
The invasion ability was measured among one normal esophageal epithelial cell line and eight esophageal cancer cell lines. The rate of KYSE150 and KYSE510 cells through ECM was 67% and 71%, respectively, which is statistically significant compared with the other seven cell lines.
Statistical significance was found.
Discussion
The function of MGMT protein in cancer and therapeutics has been widely discussed in recent years (Esteller et al., 1999; Nakagawachi et al., 2003; Gerson, 2004). The role of MGMT protein in repairing the DNA lesion O6-methylguanine was described, which can be generated by numerous alkylating agents including nitrosamines. Although O6-methylguanine accounts for 0.3%–8% of total DNA methyl adducts (Kaina et al., 2007), it is the most critical lesion due to its tendency to mispair with thymine, resulting in G→A transition (Margison et al., 2002). MGMT repairs O6-methylguanine in a one-step reaction, in which the alkyl group from the oxygen in DNA is transferred to a cysteine residue in the catalytic pocket of the protein, thereby restoring DNA and inactivating itself. This suicide action of MGMT is crucial, for if not repaired by MGMT, O6-methylguanine can give rise to mutations, cell death, chromosomal aberrations, and even cancer (Kaina et al., 2007). Consequently, there is quite a bit of data in the literature detailing the correlation between the aberrant function of MGMT and carcinogenesis (Silber et al., 1993; Liu et al., 1999; Kitajima et al., 2003; Mőllemann et al., 2005; Oh et al., 2005), in particular, the contribution of MGMT to the malignant process of tumorigenesis (Becker et al., 2003; Bobola et al., 2007; Nakasu et al., 2007; Sawhney et al., 2007).
However, there is less information available exploring the relationship between MGMT and esophageal carcinomas. Our previous study in an area of China (with a high rate of esophageal cancer) implied that loss of MGMT function might contribute to local tumor occurrence after analysis of MGMT expression between the tumor tissue and its adjacent normal counterpart. This phenomenon is well explained, as epidemiological and ecological studies have revealed that exposure to nitrosamines is a high risk factor for cancer. Nitrosamines commonly exist in the daily diet of local residents who have the inclination to eat pickles because of traditional customs and poor economic conditions, resulting in the possible accumulation of O6-methylguanine in the population. Therefore, the protective function of MGMT is extremely vital for maintaining genomic integrity and protection against O6-methylguanine mutations for the local population. In addition, the results from Kuester's group showed that MGMT might participate in alterations of the metaplasia–dysplasia–carcinoma sequence of Barrett's esophagus, which implies that MGMT might play a significant role in the progression of esophageal adenocarcinoma (Kuester et al., 2009).
To investigate the role of MGMT in esophageal carcinogenesis, we selected an esophageal cancer cell line with relatively low malignancy (EC109) and high MGMT expression (compared with the other five esophageal cancer lines kept in our lab, data not presented here), and silenced it by RNA interference, which can be stably achieved in mammalian cells (Elbashir et al., 2001; Cullen, 2006). As the silencing effect achieved by RNAi was about 73%, we should consider the effect of the enzyme activity of the remaining active MGMT protein, which could be inhibited by O6-benzylguanine. However, the specialty of MGMT in repairing O6-methylguanine depends on the number of MGMT molecules that the cell contains, so siMGMT-G cells clearly had limited ability for O6-methylguanine repair regardless of enzyme activity, especially after long exposure times to MNNG.
Since MNNG is both cytotoxic and mutagenic (Domoradzki et al., 1984), as it releases alkylating moieties that covalently bind to DNA forming O6-methylguanine, the cytotoxic impact of MNNG was evaluated through the MTT assay. The result of the cytotoxic experiments showed that MGMT provided protection against MNNG cytotoxicity in the EC109 cells, as siMGMT-Y cells endured a higher dose of MNNG than siMGMT-G cells. However, no growth inhibitory effects were detected at doses lower than 10 μM in both siMGMT-G and siMGMT-Y cells. Compared to the previous studies, the IC50 in this study was relatively higher, potentially due to the fact that different cells were used. The protective role against MNNG cytotoxicity was mainly due to the reduction of O6-methylguanine by MGMT. Although other alkylating agents maybe generated during MNNG exposure, such as N-alkylpurines, these agents are mostly repaired by ABH2, ABH3, and base excision systems, the functions of which in both siMGMT-G and siMGMT-Y cells were not disrupted. So the cytotoxicity of N-alkylpurines to the two cells should be at the same level, thus the different cytotoxic effect of MNNG on siMGMT-G and siMGMT-Y cells mainly due to O6-methylguanine.
Moreover, we observed variation in the biological behavior between the two cell lines upon exposure to 10 μM of MNNG during cell passages. After three passages, malignant differences were observed, and siMGMT-G cells had a greater cell motility and invasive abilities, which was demonstrated in wound-healing and invasion assay, as well as in nude mice. Such variation may result from the low expression of MGMT in siMGMT-G cells, giving rise to O6-methylguanine accumulation, which as previously mentioned, leads to mutations, especially in genes that are crucial for malignant transformation such as the H-ras oncogene (Barch et al., 1991) and TP53 tumor suppressor gene (Ohgaki et al., 1992). To confirm this hypothesis, future studies should focus on the link between the abnormal function of MGMT and mutations in tumor-related genes.
The results from our studies indicate that the mechanism underlying the malignant conversion of siMGMT-G cells appears to be due to accumulation of O6-methylguanine, which resulted from low MGMT protein in siMGMT-G cells. However, we were also interested in addressing another issue; namely, determining how the low expression of a DNA repair gene could link to measurable alterations in cytological behavior that could not be directly controlled by genes such as H-ras or TP53 factor. In other words, there should be certain functional factors that lead to malignant progression. Thus, we performed 2-DE to identify possible functional proteins that were differentially expressed in siMGMT-G and siMGMT-Y cells, and employed mass spectrometry to confirm their identities. Interestingly, 14 differentially expressed proteins were identified (Table 3). The identity of the membrane–cytoskeleton linker protein, Ezrin, was verified by mass spectrometry (Fig. 7) and western blot analysis (Fig. 8), and was of particular interest to us because of its role in cell metastasis. Ezrin links the cell membrane to the actin cytoskeleton, thereby making the cell interact directly with its microenvironment, which provides an intracellular scaffolding that promotes signal transduction through a series of growth factor receptors and adhesion molecules (Algrain et al., 1993). Therefore high Ezrin protein expression supposedly facilitates the metastasis of tumor cells, including pancreatic adenocarcinomas (Akisawa et al., 1999), breast carcinoma cells (Elliott et al., 2005), osteosarcoma cells (Khanna et al., 2004), and esophageal cancer cells (Shen et al., 2003). Furthermore, evidence showing that Ezrin participates in the invasion and motility of esophageal cancer cells was directly demonstrated by Fan et al. (2010), who showed that EC9706 cells displayed greater invasive and motility abilities when transfected with an Ezrin mammalian expression vector. In this study, we also demonstrated that two esophageal cancer cell lines, KYSE150 and KYSE510, had increased malignant behavior that correlated well with their higher Ezrin expression. Although the two cell lines also had low MGMT expression, evidence was limited in determining the effect of MGMT protein loss on Ezrin expression. However, the correlation of the malignant behavior of the cells with MGMT expression might be due to mutation accumulation resulting from low MGMT expression, as mutations were widely regarded to be associated with cancer malignancy. Though TE-1 cells also have a low-MGMT and high-Ezrin expression profile, no malignant advance of TE-1 was found compared with the other six cell lines as expected in KYSE150 and KYSE510 cells. The different behavior of TE-1 might be due part to the variant origin of cell lines; TE-1 was cultured from an adenocarcinoma sample while the other seven esophageal cancer lines were originally from squamous cell cancers.
In conclusion, this study provides substantial evidence that malignant progression in MGMT-deficient esophageal cancer cells is associated with high expression of Ezrin protein. However, the precise signal transducers between MGMT and Ezrin is still unclear; therefore, this should be further researched in future studies and confirmed in large numbers of human esophageal squamous-cell carcinoma tissue samples.
Footnotes
Acknowledgments
This study is funded by the National Natural Science Foundation of China (No. 81072259, 30671732, and 30800891), Research Fund for the Doctoral Program of Higher Education of China (No. 200802861045), Natural Science Foundation of JiangSu province of China (No. BK2010407), and Research and Teaching Fund for the Excellent Youth Scholars of Southeast University (2009).
Disclosure Statement
No competing financial interests exist.