
Abstract
The interaction of calf thymus DNA (ct-DNA) with a novel synthesized pyrazolo[1,5-a]indole compound 1-methyl-7H-indeno[1,2-b]quinolinium-7-(4-dimethylamino) benzylidene triflate (MIDBT) was extensively studied by various spectroscopic techniques, viscosity measurements, and gel electrophoresis. The UV-visible observation implied that the compound interacted with ct-DNA by two binding modes, intercalating into the DNA base pairs and attaching to the helix exterior of DNA. The results of the fluorescent quenching and viscosity measurements showed that MIDBT could intercalate into DNA base pairs deeply in a classical intercalative mode. Circular dichroism results showed that the binding of MIDBT shifted ct-DNA conformation from B to A at low concentrations. In the gel electrophoresis, the compound was found to promote the cleavage of plasmid pBR 322 DNA effectively. Furthermore, cytotoxic studies of this compound against eleven selected tumor cell lines have been done. The values of 50% cytotoxic concentration (IC50) were in the range of 1.09–18.84 μM, exhibiting the potent cytotoxic properties.
Introduction
The study of DNA binding interaction is of great importance to the understanding of the detailed mechanism of anticancer activity (Monnot et al., 1991). Moreover, some of the antitumor drugs, strong topoisomerase inhibitors (e.g., camptothecin), were tested to exhibit lack of any chemical reactivity with purified DNA (Pommier et al., 1991). To the best of our knowledge, little is reported on the DNA binding properties of pyrazolo[1,5-a]indole derivatives. Therefore, the interaction patterns between the antitumor pyrazolo[1,5-a]indole derivatives and DNA need to be investigated. Since the spectroscopic methods (including UV-visible [UV-vis] absorption, fluorescence, and circular dichorism [CD] techniques) enable us to evaluate and predict DNA interactions or damages by the cytotoxic compounds (Dervan, 2001), much attention has been paid to the spectroscopic investigations on the interaction of the binding of small molecules with DNA (Graves and Velea, 2000; Wang et al., 2003; Chi et al., 2010b). In continuation of our construction of substituted pyrazolo[1,5-a]indole skeleton (Zhu et al., 2003, 2007; Liu et al., 2008; Chi et al., 2010a), the present work was carried out to investigate the cytotoxic activity of 1-methyl-7H-indeno[1,2-b]quinolinium-7-(4-dimethylamino) benzylidene triflate (MIDBT), one of the synthesized pyrazolo[1,5-a]indole derivatives, and its interaction with calf thymus DNA (ct-DNA) by spectrometric methods (UV-vis, fluorescence, CD). The viscosity measurements and the cleavage of plasmid pBR 322 DNA were also used to examine its DNA-binding behaviors. We described the results of experiments aimed at gaining further insight into mechanism of the pyrazolo[1,5-a]indole derivatives interaction with DNA.
Materials and Methods
Materials
All reagents and chemicals were obtained from commercial sources. Ethidium bromide (EB), 3-(4,5-dimethylthiazol-2-yl)-2,5-diphenyltetrazolium bromide (MTT) and ct-DNA were purchased from Sigma. Camptothecin was purchased from Winherb Medical Science Co., Ltd. Plasmid pBR322 DNA was purchased from Fermentas International Inc. The human breast carcinoma MDA-MB-231, MCF-7 cell lines, human hepatoma BEL-7402, SMMC-7721, HepG2 cell lines, human leukemic HL60 and K562 cell lines, gastric carcinoma SGC-7901 cell line, human lung adenocarcinoma A549 cell line, murine cervical carcinoma U14 cell line, and a rat ascetic tumor S180 cell line were obtained from the Shanghai Cell Bank in the Chinese Academy Sciences.
Synthesis of 1-methyl-7H-indeno[1,2-b]quinolinium-7-(4-dimethylamino) benzylidene triflate
Synthesis of MIDBT was carried out according to Figure 1. 11H-indeno[3, 2-b]quinolinium (2 mmol) one was dissolved in dry CH2Cl2 (10 mL) in a flask, and methyl trifluoromethanesulfonate (0.46 mL, 4 mmol) was filled via a syringe with stirring under nitrogen. The resulting mixture was stirred for about 20 h at room temperature. After the removal of the solvent, the residue was purified by chromatography (silica gel H, solvents: methylene chloride/methanol) to give 2 as a solid in 94% yield. 2 (1 mmol) and 4-dimethylaminobenzaldehyde (200 mg, 1.35 mmol) were dissolved in glacial acetic acid (75 mL) and refluxed for 2 days with stirring. Removing the solvent under reduced pressure, the residue was purified by chromatography (silica gel H, solvents: methylene chloride/methanol) to get a deep red solid 3 (65.2% yield). Compound 3: m.p. 176–178°C; IR (KBr) cm−1: 3090, 2922, 2852, 1620, 1590, 1525, 1370, 1343, 1263, 1223, 1190, 1156, 1029, 945, 814, 758, 636; 1H NMR (400 MHz, DMSO-d 6) δ: 3.07(s, NMe2, Z), 3.10 (s, NMe2, E), 4.86 (s, 3H, N+Me), 6.82–6.89 (m, 2H, Ar-H), 7.61–7.97 (m, 5H, Ar-H,=C-H), 8.15–8.37(m, 4H, Ar-H), 8.62–8.70 (m, 2H, Ar-H), 9.33–9.57 (d, J=7.80 Hz, 1H, Ar-H); 13C NMR (400 MHz, DMSO-d 6) δ: 34.6, 46.4(×2), 117.1(×2), 124.3(×2), 126.6(×2), 128.3, 128.7(×2), 132.2, 132.6, 133.6(×2), 134.0(×2), 134.6, 136.0(×2), 136.8, 137.8, 138.4, 139.4(×2), 139.5, 140.0(×2), 141.5(×2), 142.0, 143.5(×2), 146.9, 151.0, 157.1, 157.6, 159.9(×2); HRMS (M+H)+: Calcd for C27H23F3N2O3S: 512.1381. Found: 512.1382.
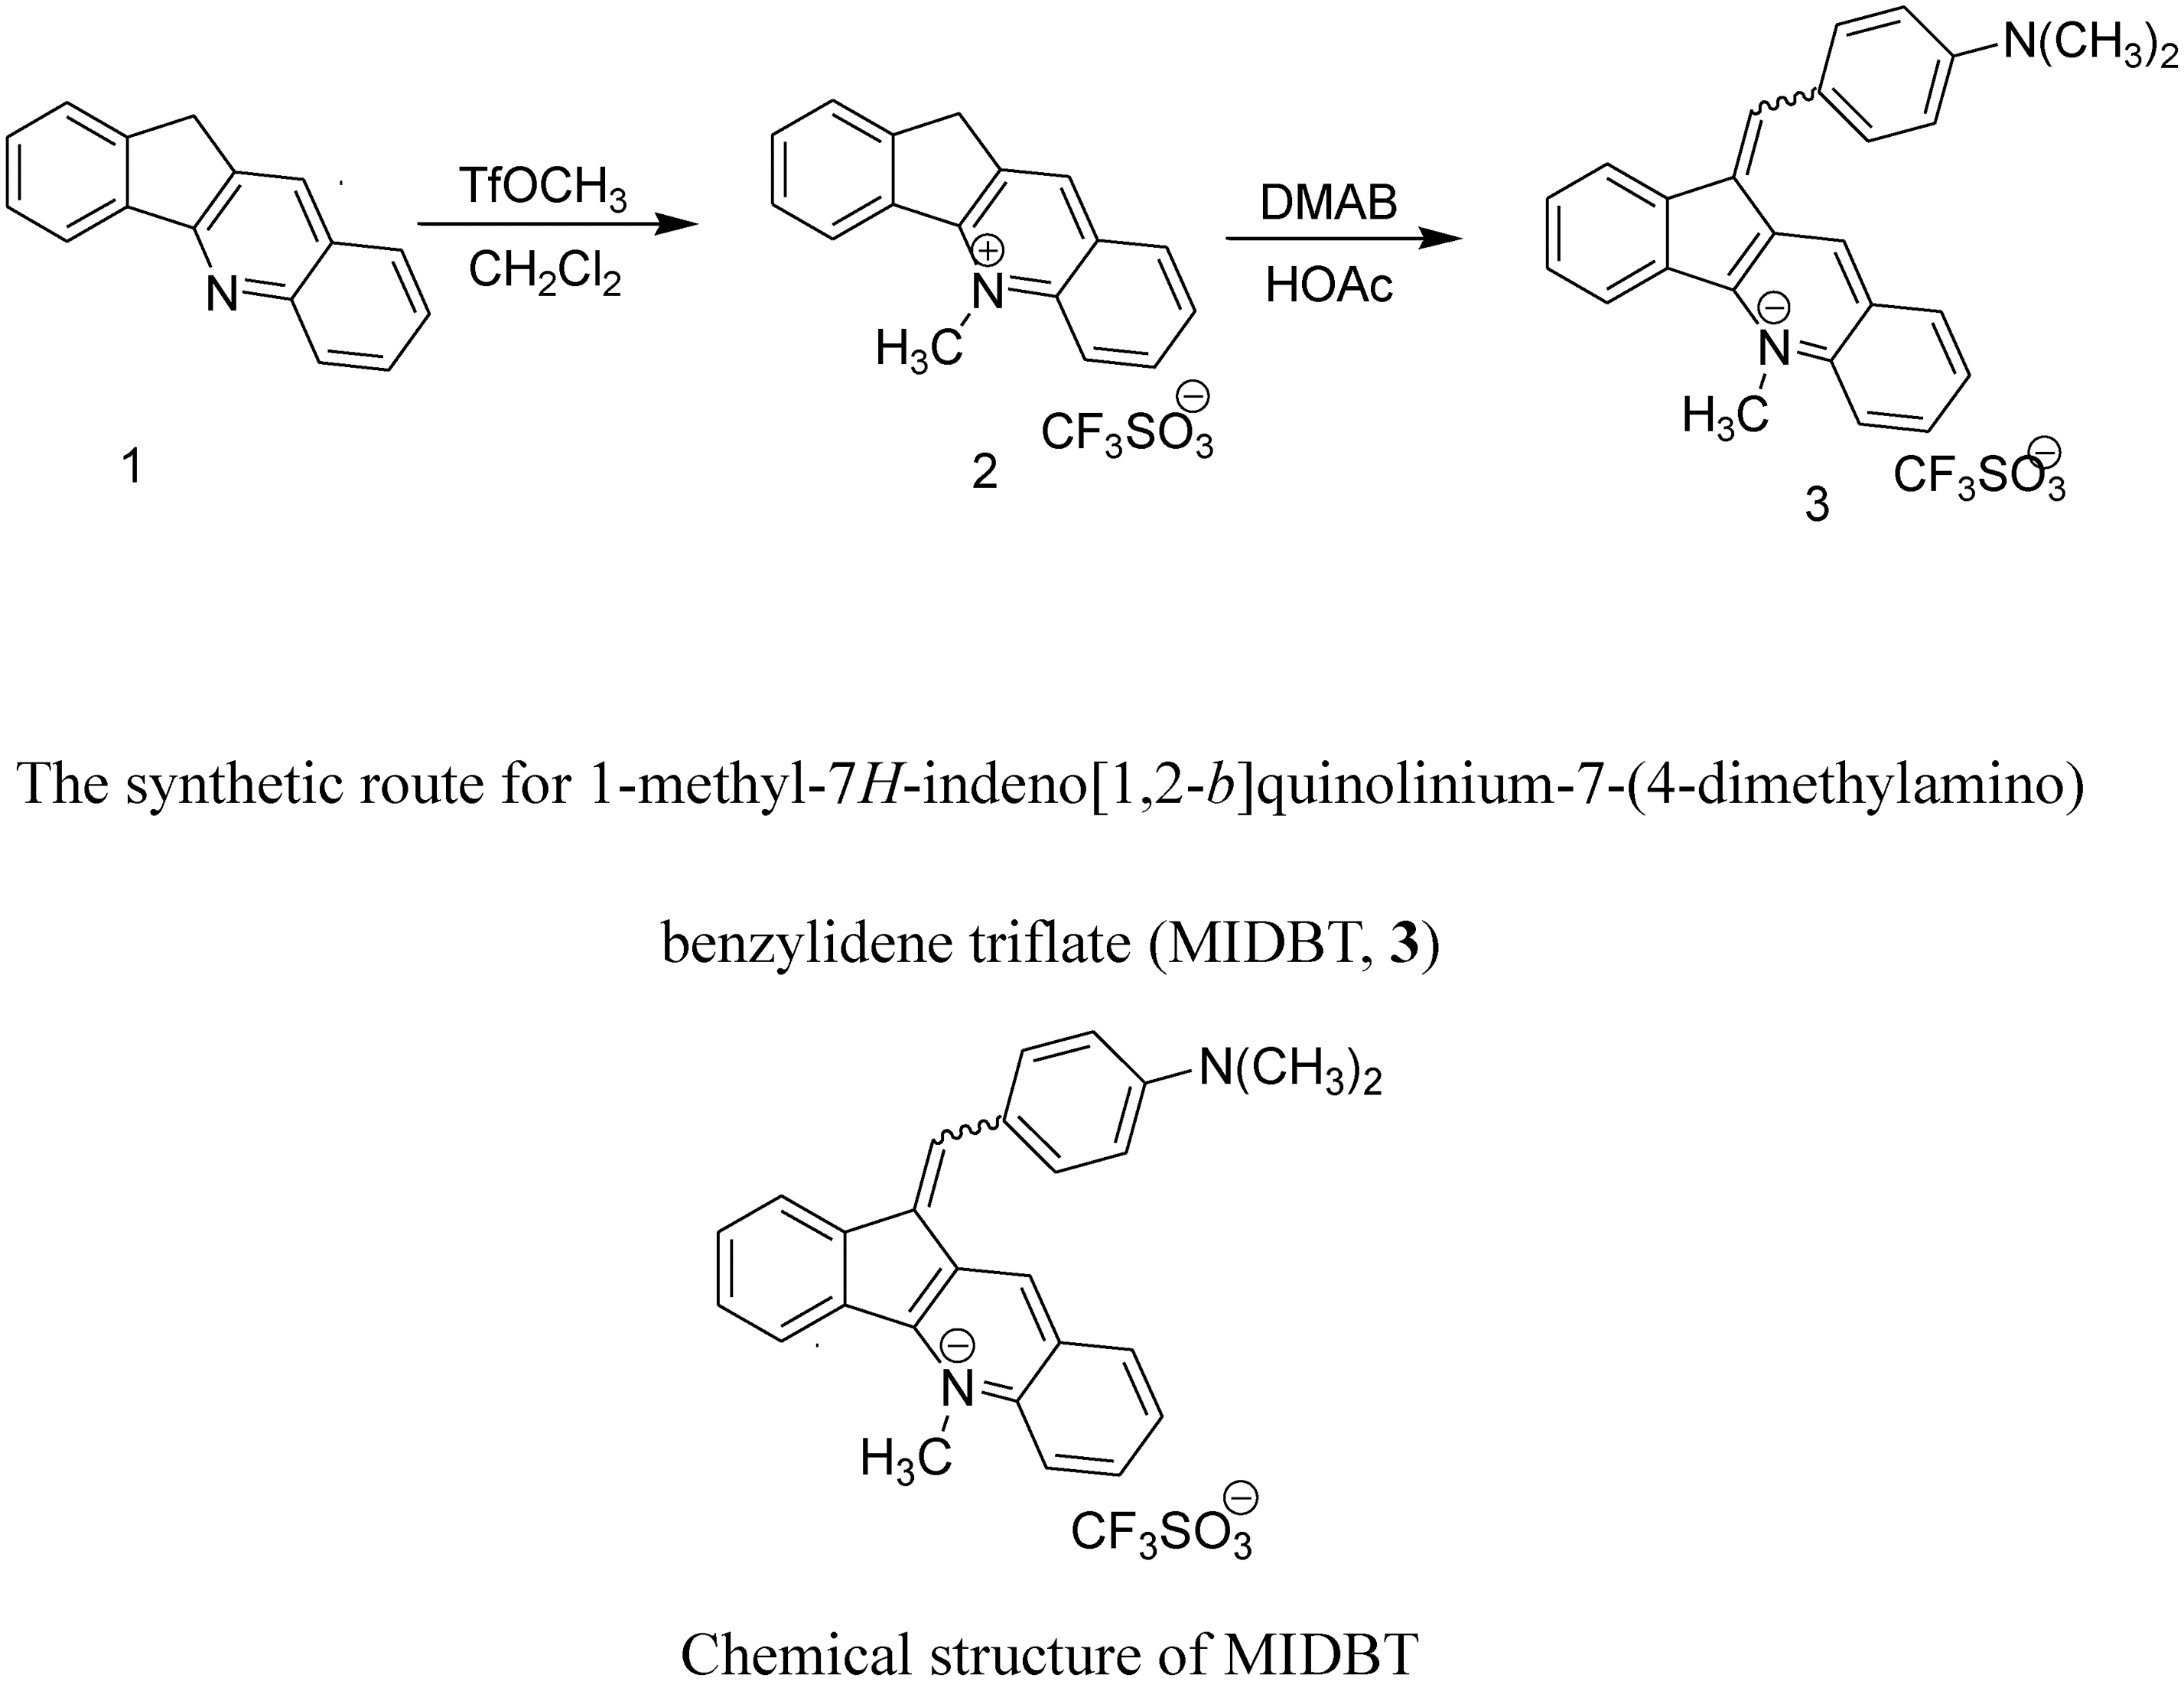
The synthetic route for 1-methyl-7H-indeno[1,2-b]quinolinium-7-(4-dimethylamino) benzylidene triflate (MIDBT) and its structure.
Cytotoxicity assay
Tumor cell lines in this work were grown in an RPMI-1640 medium supplemented with 10% (v/v) calf serum at 37°C under 5% CO2. Cells in 100 μL culture mediums were seeded into 96-well plates. The cytotoxic activities of the compound were measured by the MTT assay. MIDBT was dissolved in DMSO and diluted with culture medium before used. After the cells had been seeded for 24 h, MIDBT was added with different concentrations and incubated for 24 h (37°C). Camptothecin was used as a reference drug. The growth inhibitory rate of treated cells was calculated using the data from three replicate tests by (ODcontrol −ODtest )/ODcontrol×100%. The cytotoxicity of the compunds was expressed as an IC50, defined as the concentration required for 50% inhibition of cell growth compared with control cells and determined from at least three independent experiments.
UV-vis measurement
UV-vis spectra were recorded on a UV2401 ultraviolet spectrometer. Triple distilled water was used to prepare buffers (10 mM hydroxymethylaminomethane (Tris) and 18 mM NaCl, pH 7.4). A solution of ct-DNA in the buffer gave a ratio of UV absorbance at 260 and 280 nm of ca. 1.8–1.9:1, indicating that the DNA was sufficiently free of protein (Marmur and Doty, 1962). The DNA concentration per nucleotide was determined by absorption spectroscopy using the molar absorption coefficient (6600 M−1 cm−1) at 260 nm (Reichmann et al., 1954). The stock solution of ct-DNA was stored at 4°C and used in 4 days. The EB was dissolved in Tris-HCl buffer (10 mM Tris, 18 mM NaCl, pH 7.4). All other reagents were the highest grade commercially available and used without further purification. The compound MIDBT was prepared and dissolved in Tris-HCl buffer with an appropriate amount of methanol.
Absorption titrations were performed by using a fixed MIDBT concentration to which increments of the DNA stock solution were added. MIDBT-DNA solutions were allowed to incubate for 15 min before the absorption spectra were recorded with the UV region from 220 to 450 nm. Absorption titrations were carried out by employing the Wolfe–Shimmer equation (Wolfe et al., 1987): [DNA]/(|ɛA-ɛF|)=[DNA]/(|ɛB-ɛF|)+1/{Kb (|ɛB−ɛF|)}, where [DNA] is the concentration of DNA in base pairs; ɛA, ɛF, and ɛB correspond to A obsd/[compound], the extinction coefficient of the free MIDBT and the extinction coefficient of the compound in the fully bound form, respectively. In the plot of [DNA]/(|ɛA−ɛF|) versus [DNA], the intrinsic binding constant Kb is then given by the ratio of the slope to the intercept.
Fluorescence measurement
Fluorescence quenching experiments were carried out with DNA pretreated with EB for 30 min. To this pretreated DNA solution, various amounts of the compound were added, and their effect on the emission intensity was measured. Samples were excited at 262 nm, and the emission was observed between 540 and 800 nm. Fluorescence determination was performed on a PerkinElmer LS 55 spectrophotometer (Waltham). According to the classical Stem–Volmer equation (Lakowicz and Weber, 1973): I0/I=1+K r , where I0 and I are the fluorescence intensities in the absence and presence of the compound, respectively. K is a linear Stem–Volmer quenching constant dependent on the ratio of r, the ratio of the concentration of the compound to that of DNA. In the plot of I0/I versus r ([compound]/[DNA]), K is given by the ratio of the slope to the intercept.
Circular dichroism spectra
CD spectra were recorded on a JASCO J-716 spectrophotometer using matched 10 mm path length quartz cells. Each sample solution was mixed and incubated for 15 min, then scanned in the range of 230–300 nm. A CD spectrum was generated that represented the mean of three scans from which the buffer background had been electronically subtracted.
Viscosity measurements
Viscosity measurements were carried out using an Ubbelodhe viscometer maintained at a constant temperature at 25.0±0.1°C in a thermostatic bath. Titrations were performed for an investigated compound that was introduced into the DNA solution present in the viscometer. Flow time was measured with a digital stopwatch, each sample was measured thrice, and an average flow time was calculated. Data are presented as (η/η0)1/3 versus the ratio of the compound to DNA, where η is the viscosity of DNA in the presence of the compound corrected from the solvent effect, and η0 is the viscosity of DNA alone. Relative viscosities for DNA in either the presence or absence of the compound were calculated according to the literatures (Satyanarayana et al., 1992, 1993; Eriksson et al., 1994).
Agarose gel electrophoretic assay
In plasmid DNA cleavage experiments, MIDBT was prepared and dissolved in Tris-HCl buffer with appropriate amount of methanol, and was diluted by 1× TAE buffer. Supercoiled pBR322 DNA was treated with the compound in the buffer. The solutions were allowed to incubate for 3 h at 37°C. The samples were electrophoresed for 3 h at 50 V on a 0.8% agarose gel in tris-acetic acid-EDTA (TAE) buffer. The gel was stained with 0.5 μg/mL EB and then photographed under UV light.
Results and Discussion
Cytotoxicity properties
We initiated our study by examining the MIDBT cytotoxicities using MTT assay on various cancer cells (Table 1). MIDBT displayed cytotoxic activity against all 11 different types of tumor cells (IC50=1.09–18.84 μM), where IC50 values of 1.09 μM for HL60 and 18.84 μM for A549 cells. Among the tested cancer cell lines, HL60 cells were the most vulnerable to MIDBT. As reported in 3-Oxo-3H-pyrazolo[1,5-a]indole derivatives, the compound with 4-dimethylaminophenyl side chain at the C-4’position of the pyrazole ring was the most active against murine leukemia L1210 cells, uterus cervical carcinoma HeLa cells, human lung cancer PC-1 cells, gastric cancer KATO III cells, colon carcinoma LoVo cells, and breast carcinoma MCF-7 cells (IC50=0.69–1.66 μM) (Katayama et al., 1997). In the structure of MIDBT, the pyrazole ring was changed by a methylated quinoline, leading to a weaker activity. However, MIDBT could inhibit the growth of HL60 effectively, exhibiting the potent cytotoxicity to this carcinoma cell line.
Cells seeded in 96-well plates were treated with various concentrations of drugs for 24 h. Cell viability was determined by 3-(4,5-dimethylthiazol-2-yl)-2,5-diphenyltetrazolium bromide assay (see Materials and Methods). IC50s were shown as mean±SD of three independent experiments. Camptothecin was used as a reference drug.
The interaction of MIDBT with DNA determined by UV-vis
In the UV region from 220 to 450 nm, the compound had strong absorption peaks at 285 nm and 355 nm (Fig. 2). A considerable decrease in the absorption of the compound and a weak red shift of the spectra was observed when DNA was added. As reported, a hypochromic effect and blue shift of the absorption spectra are signs of external binding, while a red shift and of the spectra is a sign of intercalation (Dourlent and Hélène, 1971; Long and Barton, 1990; Timtcheva et al., 2000). It can be seen from Figure 2 that MIDBT had strong absorption peaks at 285 nm and 355 nm. When r (r=[DNA]/[MIDBT]) was low (≤0.93), the absorption decreased with increasing ct-DNA concentration, suggesting that the compound was attached to the helix exterior. When r was higher (≥3.72), as ct-DNA increased, the absorption peak kept decreasing and was red shifted (from about 355 to 360 nm), which demonstrated that MIDBT intercalated into DNA base pairs. A red shift has also been detected in the spectra of some three-dimensional dyes that bind to the groove in DNA (Latt and Wohlleb, 1975; Zimmer and Wahnert, 1986). However, MIDBT has an approximated planar structure; so, we believe that the compound could interact with DNA by intercalation. Based on the Wolfe–Shimmer equation (Wolfe et al., 1987), the binding constants obtained for the compound are 1.13×10⁵ M−1 (K b =1.4×10⁵ M−1 for EB-DNA), indicating that MIDBT has a good planarity and a high ability to form hydrogen bonding with DNA.

Absorption spectra of MIDBT in the presence of an increasing amount of ct-DNA. [MIDBT]=20 μM, [DNA]=0−1.86×10² μM, r=[DNA]/[MIDBT]=0, 0.93, 3.72, 7.44, 9.30. The spectra were recorded at pH 7.4 in 18 mM NaCl and 10 mM hydroxymethylaminomethane (Tris) buffer. ct-DNA, calf thymus DNA.
Fluorescence quenching on EB-DNA
No fluorescence was observed for MIDBT either in aqueous solution or in the presence of ct-DNA. So, the binding of the compound samples with DNA cannot be directly presented. In the emission spectra, the binding of the compound samples to ct-DNA has been studied by competitive EB binding experiments (Fig. 3). The molecular fluorophore EB is known to show intense fluorescence light when bound to DNA, due to its strong intercalation between the adjacent DNA base pairs (Olmsted III and Kearns, 1977). The quenching extent of fluorescence of EB bound to DNA is used to determine the extent of binding between the second molecule and DNA (Barton et al., 1984). As shown in Figure 3, the EB-DNA system showed a characteristic strong emission at about 610 nm when excited at 252 nm, indicating that the intercalated EB molecules have been sufficiently protected by the neighboring DNA base pairs from being quenched by the external polar solvent molecules (such as H2O) (Kumar et al., 1985). With increasing the concentration of MIDBT added by titration, the emission intensity of EB intensively decreased. The result indicates that the compound exhibits higher competitive binding ability with EB in the ct-DNA system. In the plot of I0/I versus r ([compound]/[DNA]), K is given by the ratio of the slope to the intercept. The K for MIDBT is 2.43, which is higher than that of ordinary transition metal complexes (K≤2) (Kumar and Arunachalam, 2006; Liu et al., 2002). This result suggested that there was a strong interaction of the compound with DNA.
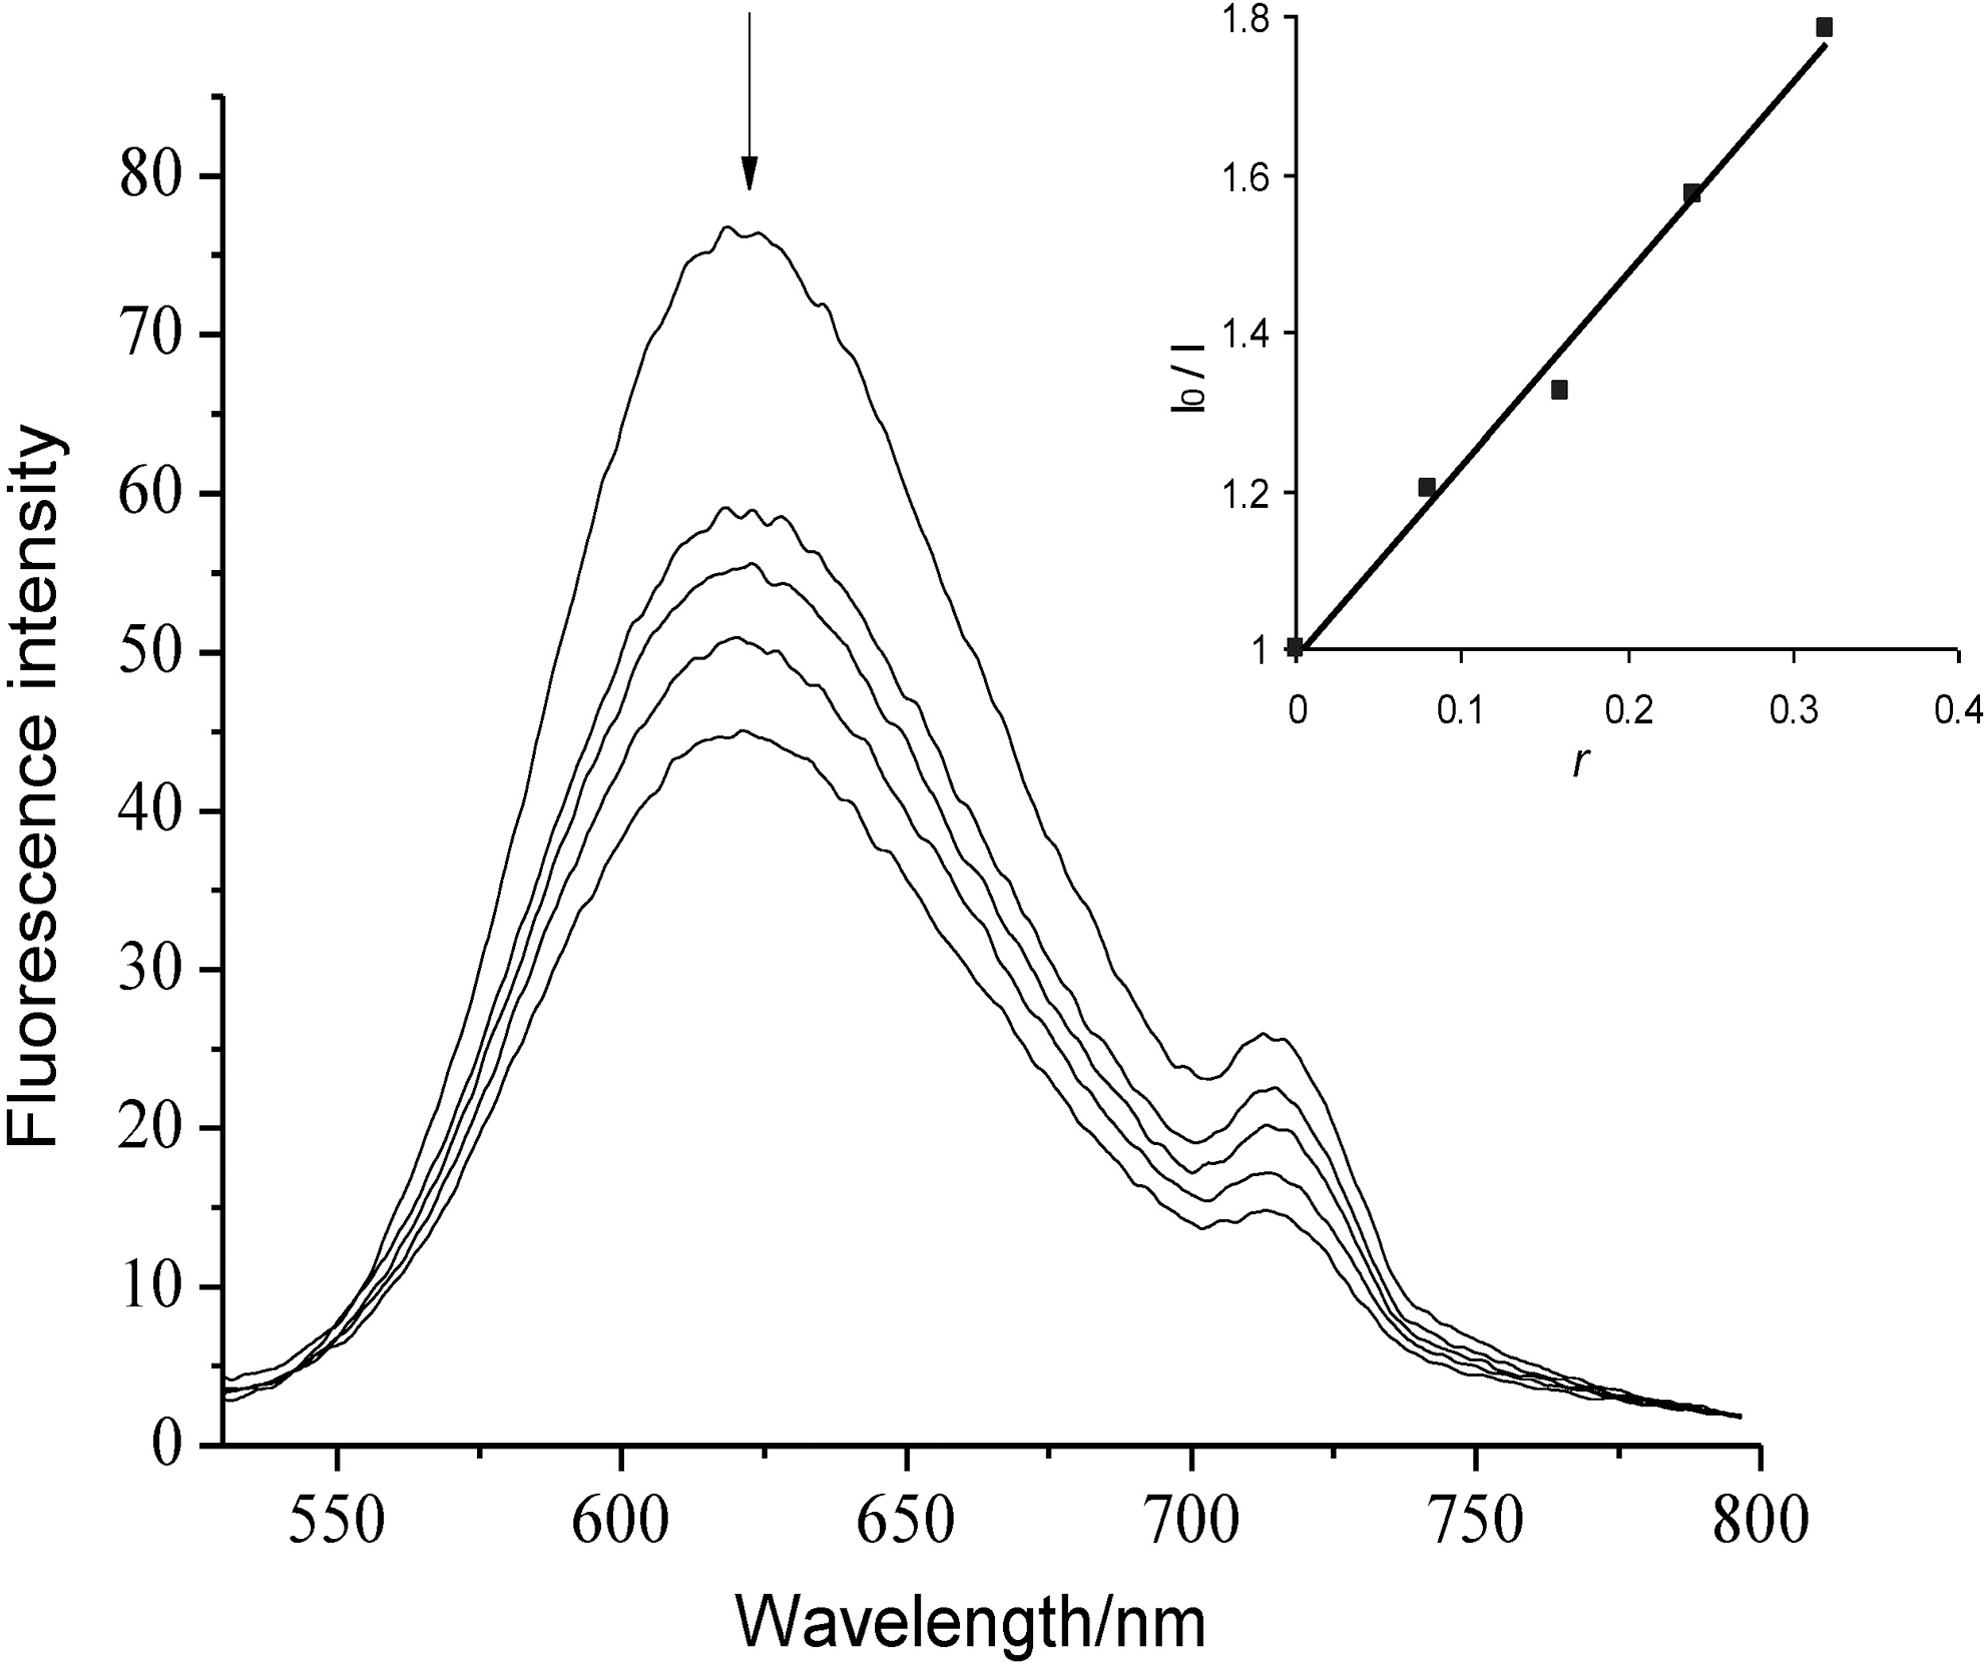
Emission spectra of EB bound to DNA in the absence and presence of MIDBT. [EB]=50 μM, [DNA]=3.72 μM, [MIDBT]=0−1.19 μM, [MIDBT]/[DNA]=r=0, 0.08, 0.16, 0.24, 0.32. λex=252 nm. The spectra were recorded at pH 7.4 in 18 mM NaCl and 10 mM hydroxymethylaminomethane (Tris) buffer.
Interaction between MIDBT and ct-DNA measured by circular dichroism
The characteristic CD spectrum of ct-DNA consists of a positive band at 270–285 nm (band-I) due to base stacking and a negative band at 240–245 nm (band-II) due to the right-handed helix, which is characteristic of DNA in B form in the solution system (Chen et al., 2011). Generally accepted, the CD absorption spectrum of DNA is very sensitive to its conformational changes, which means that when small molecules bind to ct-DNA by intercalation or covalent binding, it may result in the DNA conformational modifications or inducing significant CD spectral perturbation of DNA (Brabec and Nováková, 2006). With increasing the concentration of MIDBT (R=[MIDBT]/[DNA], 0.09, 0.18) in ct-DNA solution, the intensity of the positive band increased with a small red shift and the negative band decreased (Fig. 4), indicating that the CD spectrum was exhibiting a more positive feature instead of positive and negative peaks counteracting with each other. Some investigators believed that these type of changes in the CD spectra may be reflected due to a shift from a B-like DNA structure toward one with some contributions from an A-like conformation (Ivanov et al., 1973; Poklar et al., 1996; Li et al., 2006). While in the Tris buffer (pH 7.4), increasing the concentration of MIDBT in the ct-DNA solution (at R=1.8, 3.6), the intensities of both positive and negative bands increased (Fig. 4), suggesting that DNA bound with MIDBT just as the proportion of right-handed form of DNA increased in the solution. Some investigators believed that these type of changes in the CD spectra may be reflected due to the base stacking interactions through intercalation and band-II exemplifying stabilization of the right-handed B form (Maheswari and Palaniandavar, 2004; Katsarou et al., 2008). Tong et al. (2010) believed that this phenomenon could be due to electrostatic attraction that stabilizes the right-handed B form of DNA. It could be also suggested that the possible binding mode of MIDBT to ct-DNA was a combinational effect of the π-π stacking intercalation and electrostatic attraction, because MIDBT as a cation might bind to the phosphate group of the DNA helix by electrostatic attraction, which could stabilize the structure of DNA and make the CD intensity of ct-DNA increase.
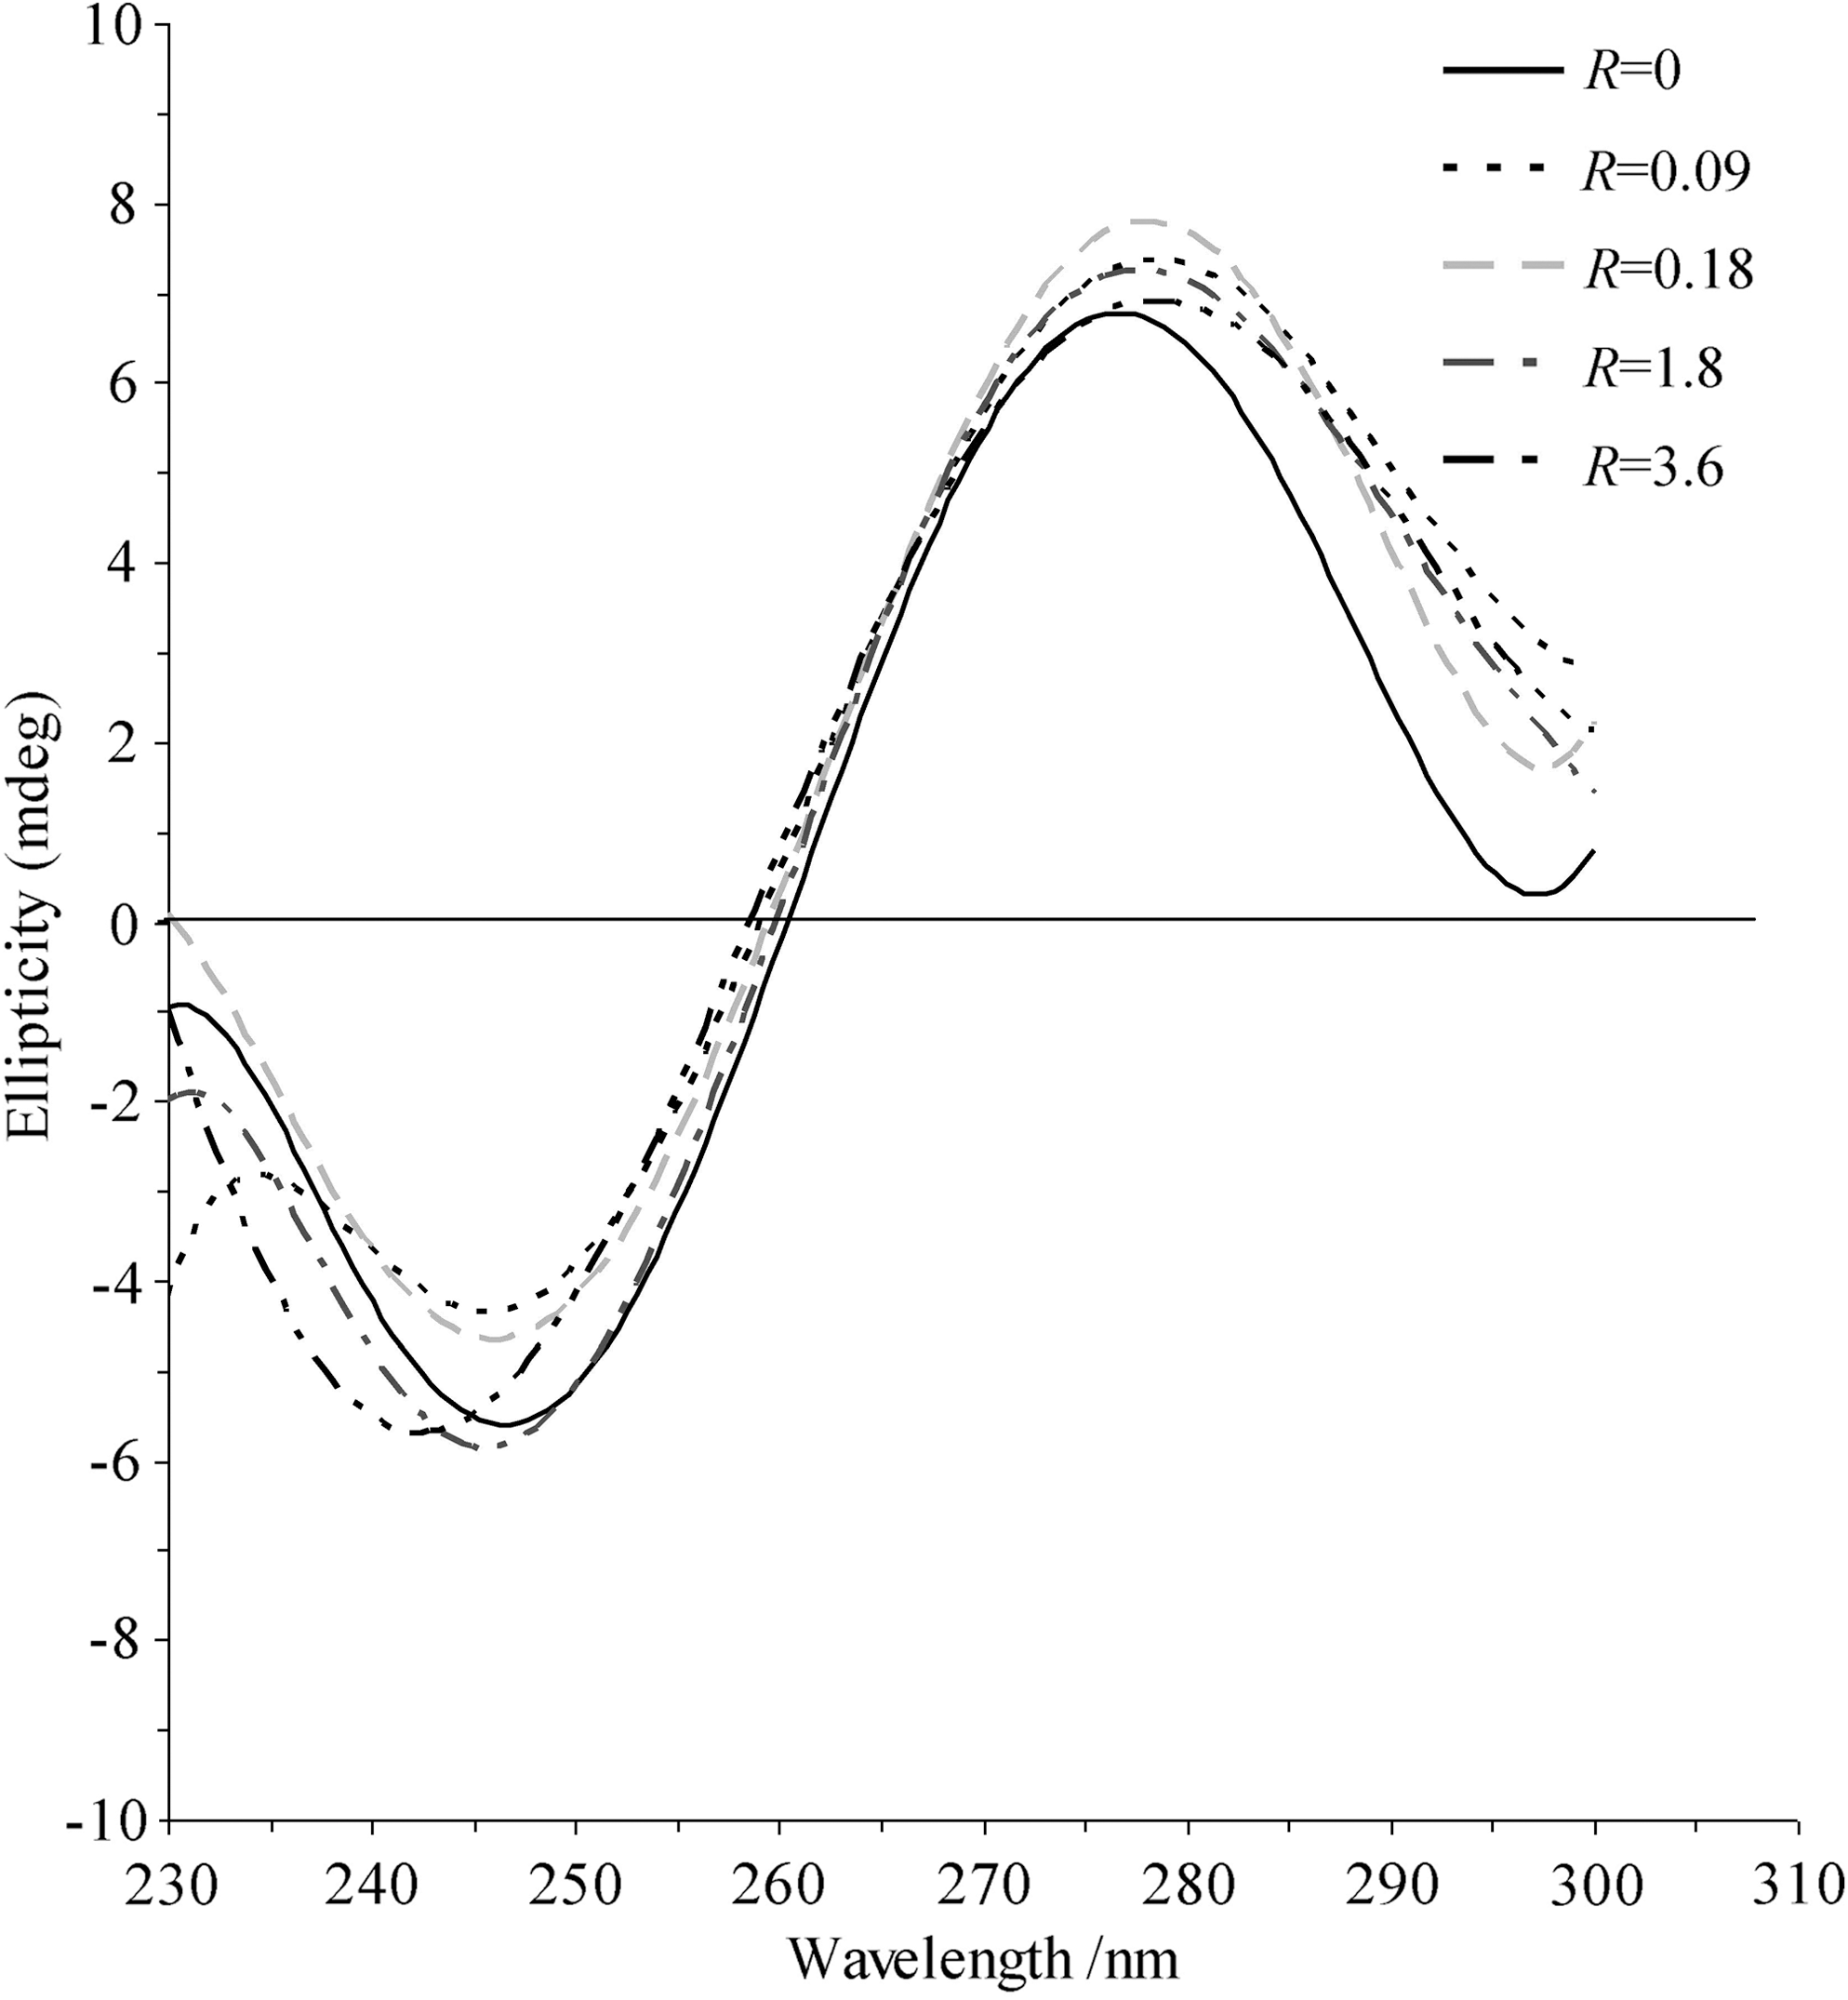
Circular dichorism spectral changes of ct-DNA by the addition of MIDBT in 10 mM Tris buffer (pH 7.4) containing 18 mM NaCl. [DNA]=5.58 μM, [MIDBT]=0–20 μM, R=[MIDBT]/[DNA]=0, 0.18, 0.90, 1.80, 3.60.
Viscosity measurements
A classical intercalative mode causes a significant increase in the viscosity of DNA solution due to an increase of base pairs at intercalation sites and, hence, an increase in overall DNA length. By contrast, compounds that bind exclusively in the DNA grooves by partial and/or nonclassical intercalation typically cause less pronounced (positive or negative) or no change in DNA solution viscosity (Kelly et al., 1985). In our study, the values of (η/η0)1/3 were plotted against [compound]/[DNA] (Fig. 5). The results revealed that the presence of the compound increased the relative viscosity for the lengthening of DNA double helix. Our results suggested that MIDBT could intercalate into DNA base pairs deeply in a classical intercalative mode.
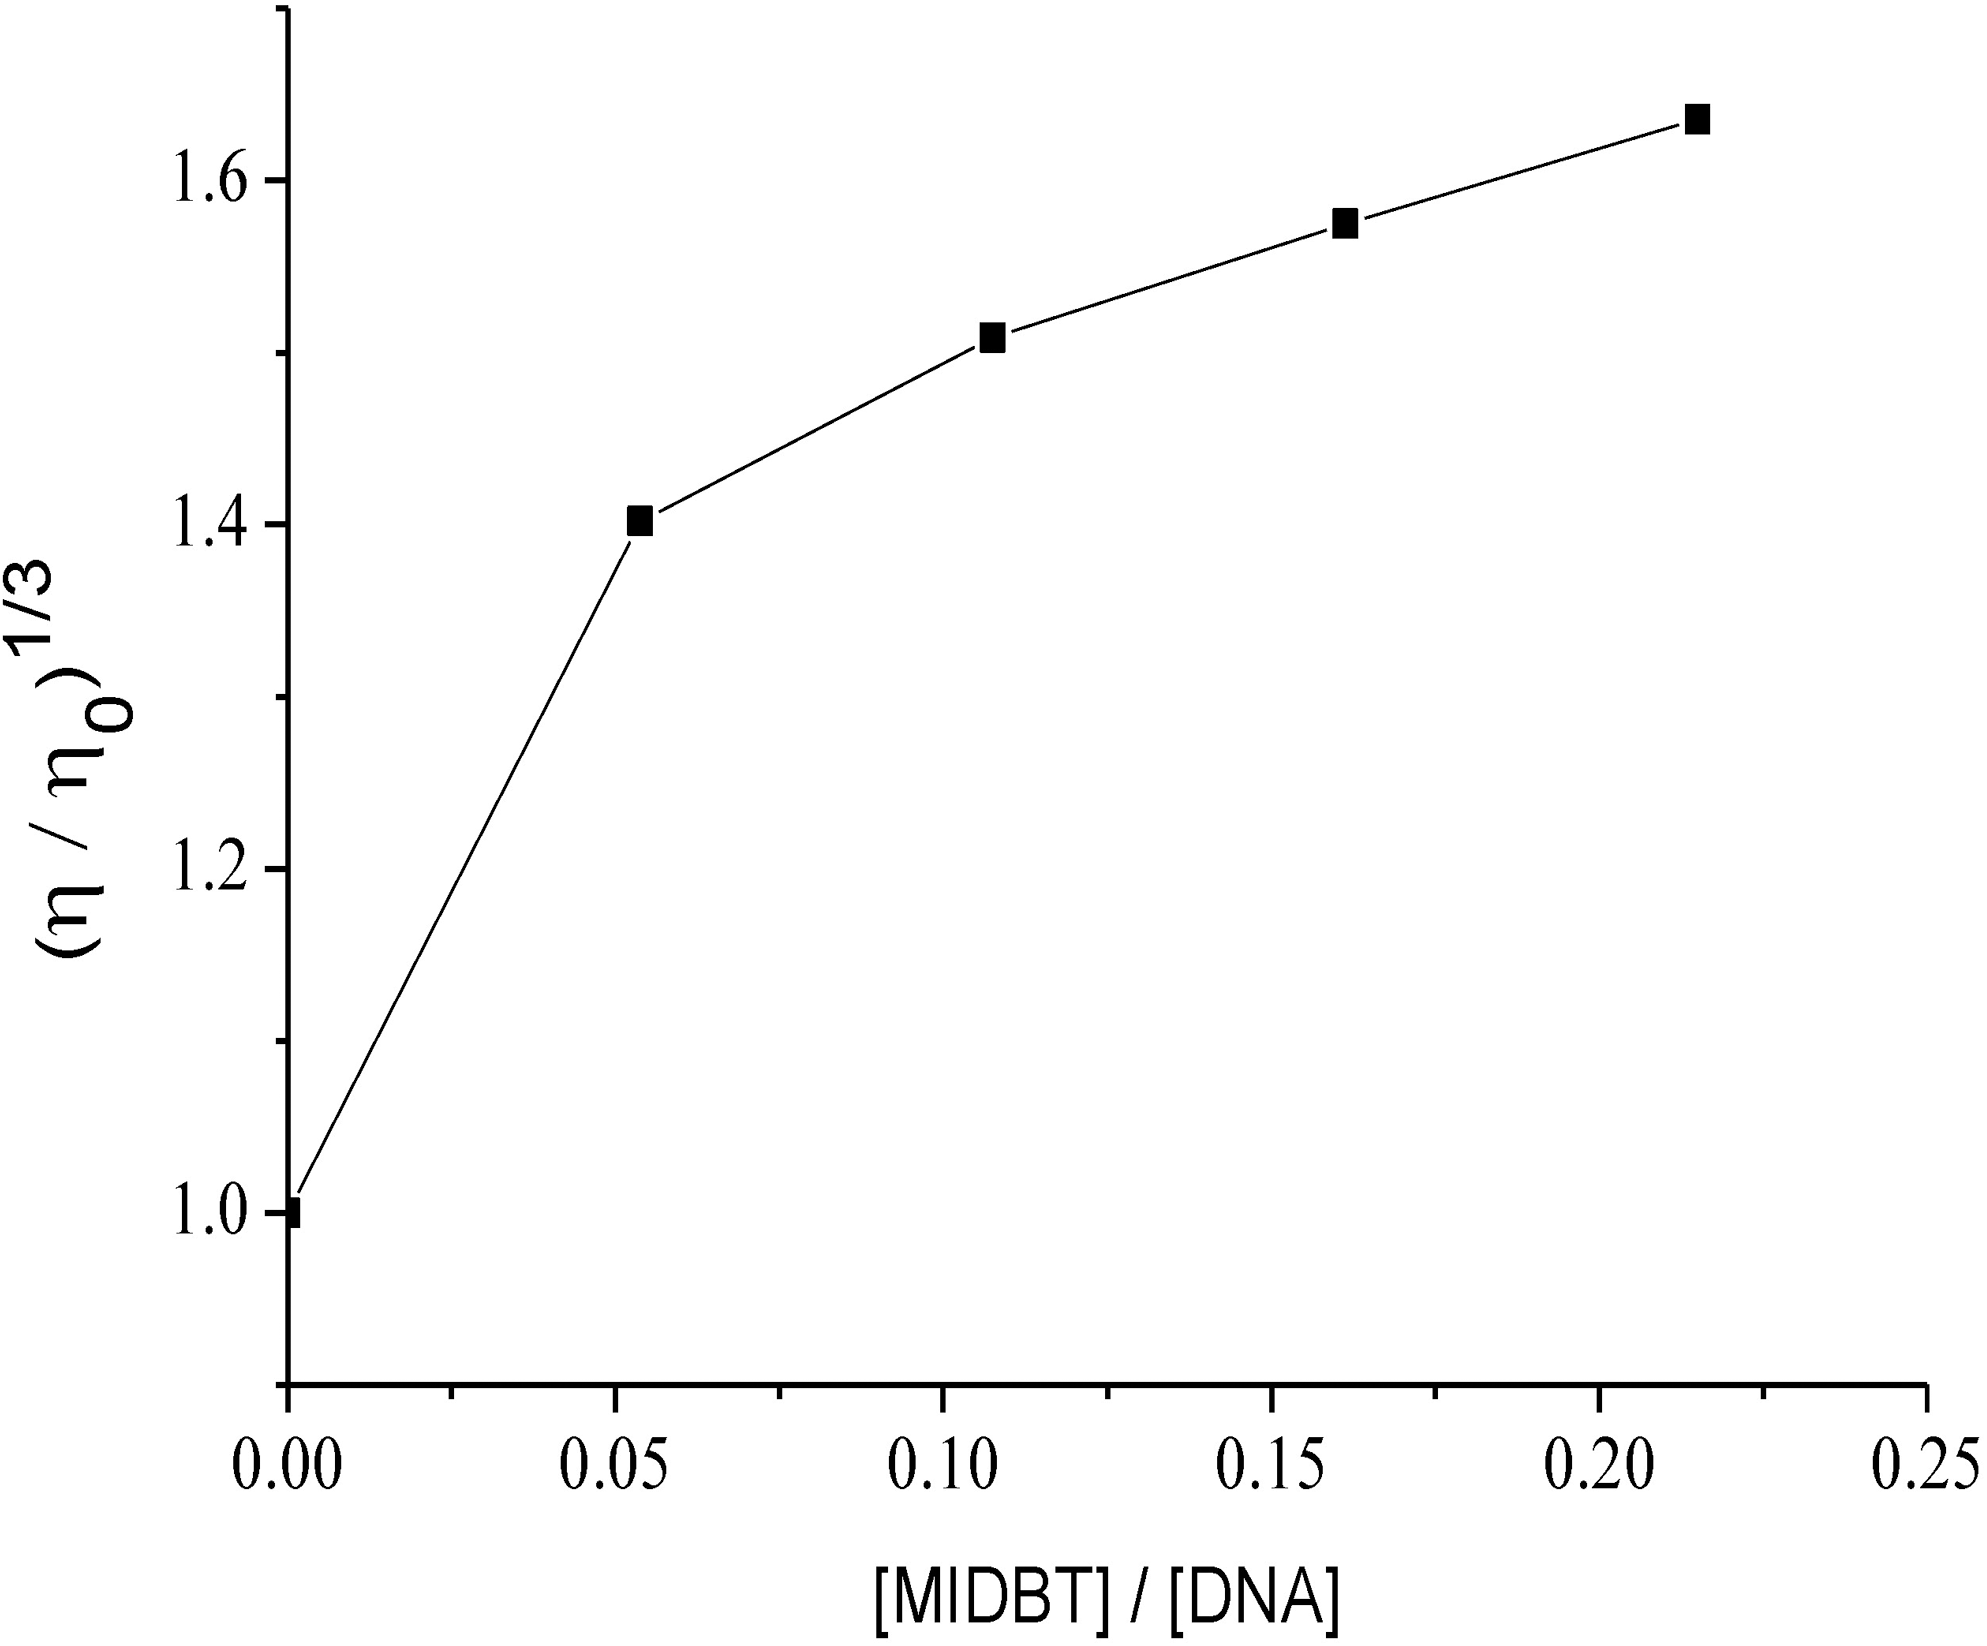
Effect of increasing amounts of MIDBT on the relative viscosities of ct-DNA. [DNA]=5.58 μM, [MIDBT]/[DNA]=r=0, 0.054, 0.108, 0.162, 0.216, 0.240.
The cleavage of pBR322 DNA
When circular plasmid DNA is subject to electrophoresis, relatively fast migration will be observed for the intact supercoiled form (Form I). If scission occurs on one strand (nicking), the supercoils will relax to generate a slower-moving open circular form (Form II) (Barton and Raphael, 1984). As reported, many organic molecules interacting with DNA could bring scission of DNA stands, and a change of Form I to Form II could be observed after incubation with organic molecules (Kumar and Arunachalam, 2007; Yu et al., 2009). In Figure 6, lane 1 was pure DNA not treated with MIDBT. Lanes 2–6 represented the DNA treated with MIDBT of various solution concentrations. The migration of the DNA band was retarded as the concentration of MIDBT in the solution was increased. It was reported that many polycationic organic polymer molecules interacted with DNA through electrostatic interactions between phosphate groups of the DNA and oppositely charged groups of polymer (Bronich et al., 2000; Kumar and Arunachalam, 2006; 2007). Our results suggested that the binding between DNA and MIDBT could occur through electrostatic interactions between phosphate groups of the DNA and the cationic segments of MIDBT. Moreover, MIDBT caused nicking of supercoiled plasmid DNA at a concentration of 0.5, 1.0, 5.0 μM, indicating that MIDBT could behave as a chemical nuclease, mediating the conversion of form I (supercoiled DNA) to form II (nicked circular DNA). Further studies are currently underway to clarify the cleavage mechanism.
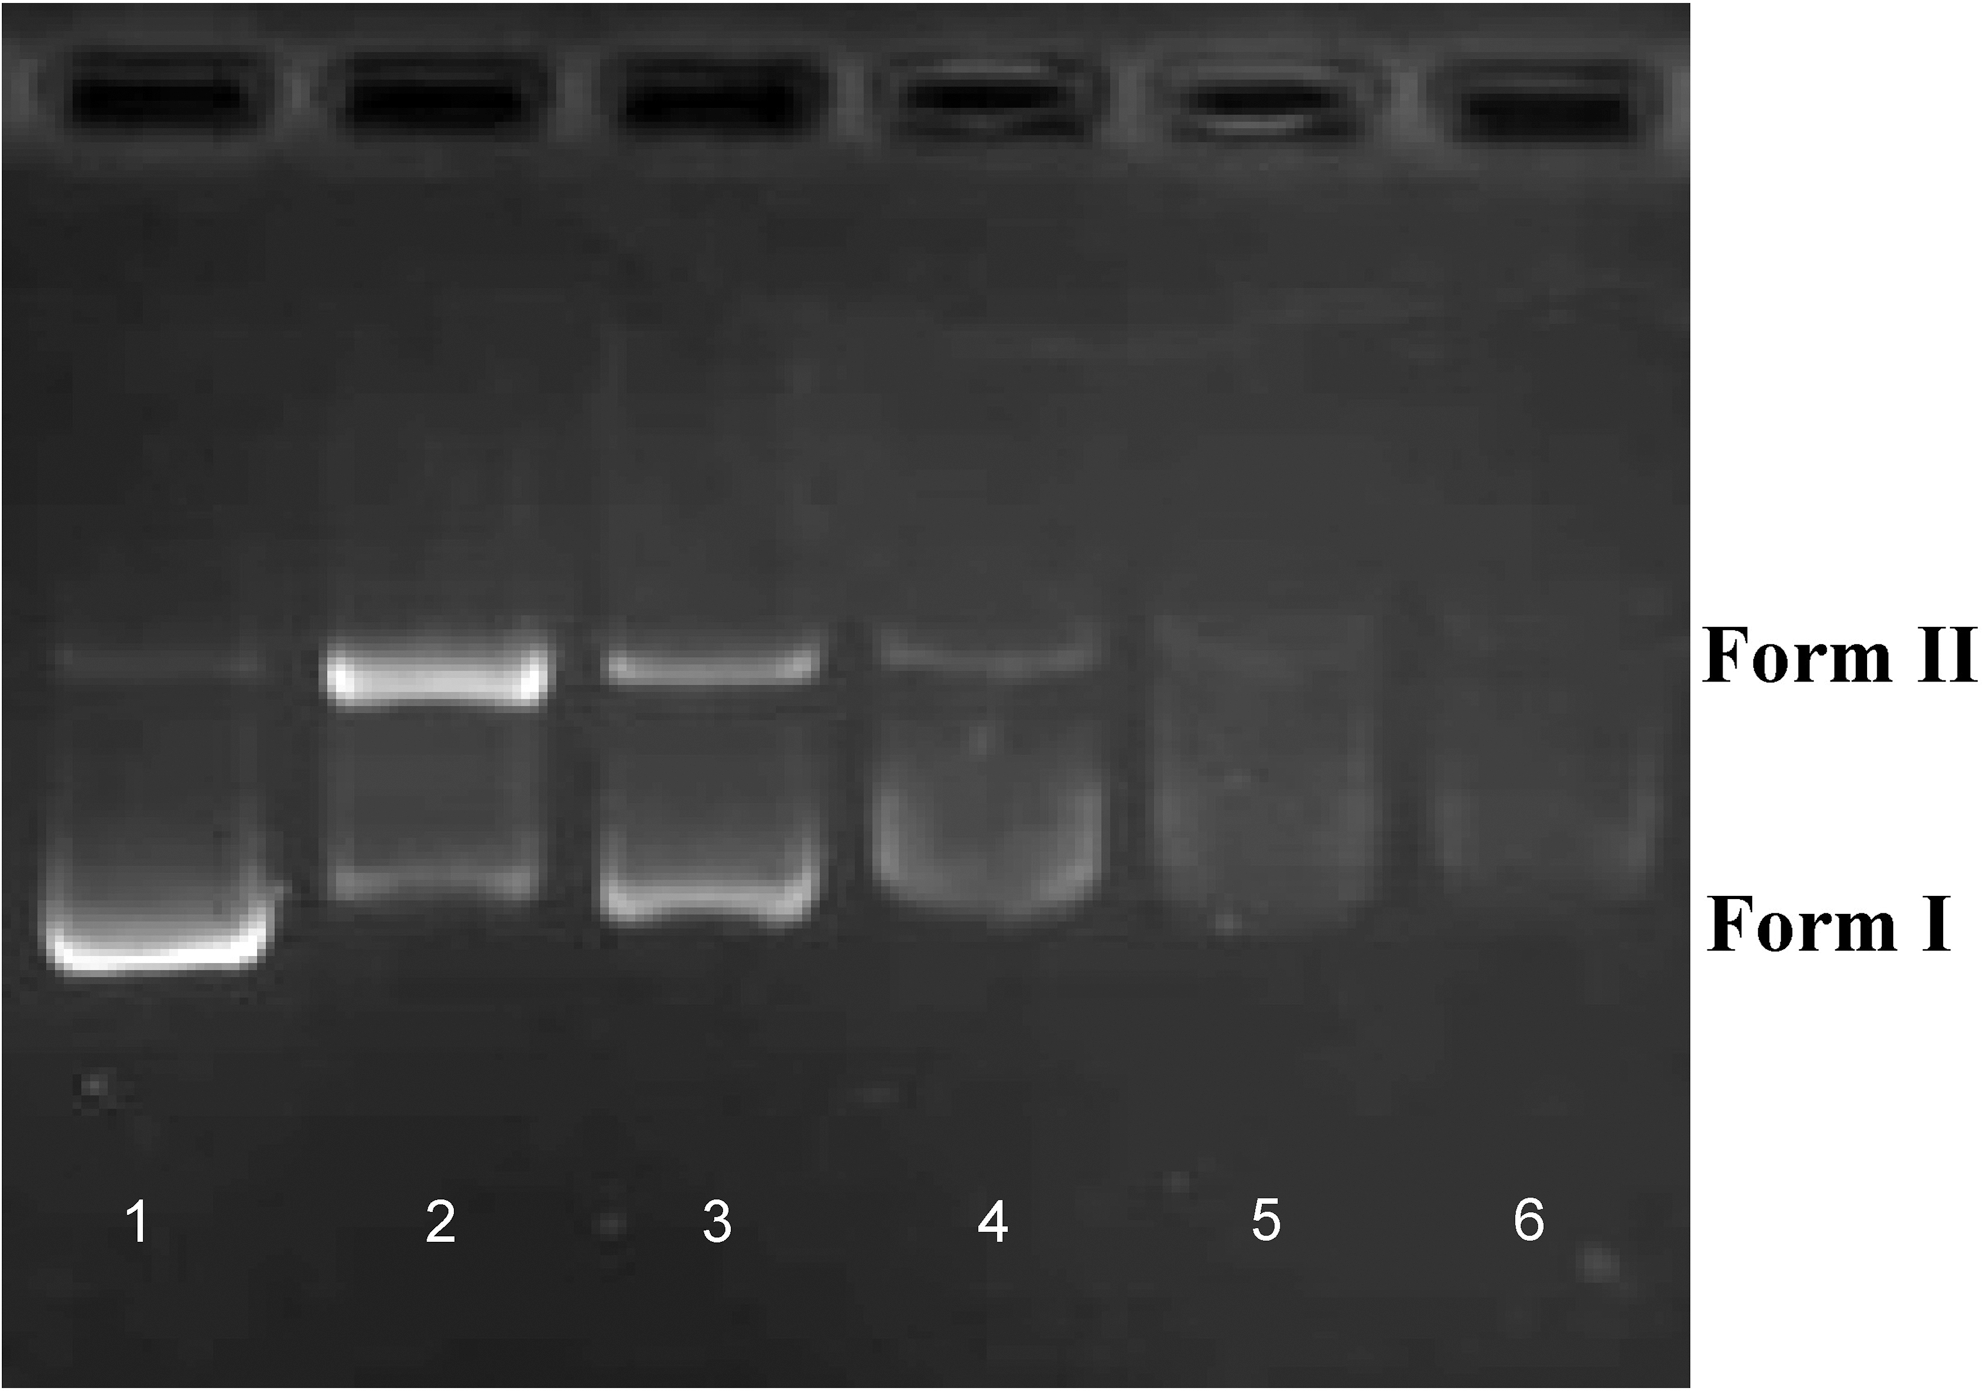
Cleavage of pBR322 DNA in the presence of MIDBT after 3h incubation at 37°C. DNA alone (lane 1), the concentration of MIDBT was 0.5, 1, 5, 10, 20 μM (lanes 2∼6).
Conclusion
In continuation of our previous work, we have synthesized a novel pyrazolo[1,5-a]indole compound MIDBT. This compound exhibited cytotoxic properties and might be applicable against rapidly proliferating tumor cells. Interestingly, this compound showed much lower IC50 values than other pyrazolo[1,5-a]indole derivatives reported earlier against some human tumor cell lines such as leukemic HL60 and K562 cells. The mechanisms of the interaction of MIDBT with ct-DNA have been explored using spectroscopic methods. The results of UV-vis absorption, fluorescence quenching spectra, and viscosity measurements agreed with each other. UV-vis absorption indicated that at a low DNAs concentration (r=≤ 0.93), MIDBT was attached to the helix exterior of DNA; when r was higher (≥3.72), the compound MIDBT intercalated into DNA base pairs. The K value 2.43 in fluorescence spectra suggested that there was a strong interaction of the compound with DNA. The results obtained from viscosity measurements showed that MIDBT could intercalate into DNA base pairs deeply in a classical intercalative mode. The CD results indicated that MIDBT interacted with the bases of DNA and made the DNA undergo conformation transition to A-form at low MIDBT concentrations, while the right-handed B form of DNA was stabilized due to the electrostatic binding at high MIDBT concentrations. MIDBT was found to promote the cleavage of plasmid pBR 322 DNA from the supercoiled form I to the open circular form II. We believe that the binding mode of MIDBT with DNA studied here will provide useful information on the mechanism of the anticancer activity of pyrazolo[1,5-a]indole derivatives.
Footnotes
Acknowledgments
This work was supported by grants from Soochow Scholar Program (No. 14317363), the fifth Jiangsu Leading Discipline Program (BU 132802), and the project sponsored by PAPD and SRF for ROCS (K513201011).
Disclosure Statement
No competing financial interests exist.