
Abstract
The interaction of deltamethrin (DM), a synthetic insecticide, with calf thymus DNA was studied. The cyclic voltammetric (CV) results revealed that DM has two irreversible cathodic peaks. The first peak (a) was devoted to reduction of −CN by 4 electrons and the second peak (b) was devoted to reduction of the −C=C− moiety by two electrons. By using non-linear regression analysis of CV data of peak (a), the binding constant, binding site size, and diffusion coefficient for free DM (D f ) and DNA-DM (D b ) were calculated as: 2.6×10⁴, 1.6, 3.2×10⁻⁴Cm2 S−1, and 8.5×10⁻⁶Cm2 S−1, respectively. The thermal denaturation, competitive fluorescence, and AFM results revealed that the mode of interaction may be non-intercalative. Also the circular dichroism spectra showed that the conformation of CT DNA was converted from right-handed B-DNA to A-DNA due to the destacking of the adjacent guanine bases in pH 7.3 solution.
Introduction

The structure of deltamethrin.
Materials and Methods
Highly polymerized calf-thymus double strand deoxyribonucleic acid (dsDNA) and DM with high purity were purchased from Sigma and used as received. All other reagents were of the highest commercial grade and were used without further purification. Deionized double distilled water was used throughout the experiments. dsDNA was dissolved in Tris-HCl buffer and was dialyzed against the same buffer overnight (Kashanian et al., 2007). Solutions of dsDNA gave ratios of UV absorbance at 260 and 280 nm above 1.8, indicating that dsDNA is sufficiently free of protein. Ds-DNA concentration per nucleotide was determined by UV/Vis spectrophotometery using the molar absorption coefficient of 6600 M−1 at 258 nm (Kashanian et al., 2007). An HP Agilent (8453) UV-Vis spectrophotometer equipped with a peltier (Agilent 89090A) was used for thermal denaturation of DNA. All competitive fluorescence measurements were carried out with a Beckman spectrofluorometer (LS 45). Maximum excitation wavelength used was 330 nm. The pH values of the solutions were adjusted employing a Metrohm model 827 using a combined glass electrode. The AFM imaging of DNA-PYR complexes were performed in phase contrast and dynamic force operating mode and noncontact Mounted cantilever (Nanosurf Mobile S) using high frequency (170 kHz) by silicon cantilevers with thickness 7 μm, length 225 μm and width 38. Images were treated using the software Installation Instructions for Nanosurf Mobile S version 1.8. The cyclic voltammetry measurements were performed by a Metrohm VA 797 computrace (Metrohm) with a three-electrode system: a Hanging Mercury drop electrode (HMDE) as working electrode, silver-silver chloride (Ag/AgCl) as reference electrode, and a platinum wire as counter-electrode. For all types of voltammetric measurements, the supporting electrolyte (5.0 mM Tris-HCl buffer solution, pH 7.3) was placed in a polarographic cell of volume 10 mL and deaerated via purging with pure N2 gas for 2 min. The cyclic voltammetric (CV) measurements were carried out by keeping both concentration of the DM and the total volume of solution constant while the dsDNA concentration varied.
Result and Discussion
Electrochemical behavior of DM
The electrochemical behavior of 2.5×10⁻⁵ M of DM in binary mixture of acetonitrile-Tris-HCl buffer (20:80 v/v; pH=7.3) at the surface of HMDE was evaluated. A typical cyclic voltammogram of DM in the studied solution is shown in Figure 2. At the HMDE, the cyclic voltammogram of DM demonstrates two irreversible cathodic peaks in the −1.04 and −1.4 V. In 1999, Samatha and Sreedhar studied DM by polarography and also reported the electrochemical behavior of DM over the pH ranges of 2.0–12.0 at a drop mercury electrode. Their results revealed a single, well defined, irreversible peak at −0.7 V versus SCE in pH=4.0. They concluded that the cathodic peak arises from the reduction of the −C=C− moiety of DM by a two electron process. When the HMDE was used, two irreversible peaks were observed (see Fig. 2). To measure the symmetry of the energy barrier and all electrons in each peak, the equation (I) was used for both cathodic peaks.
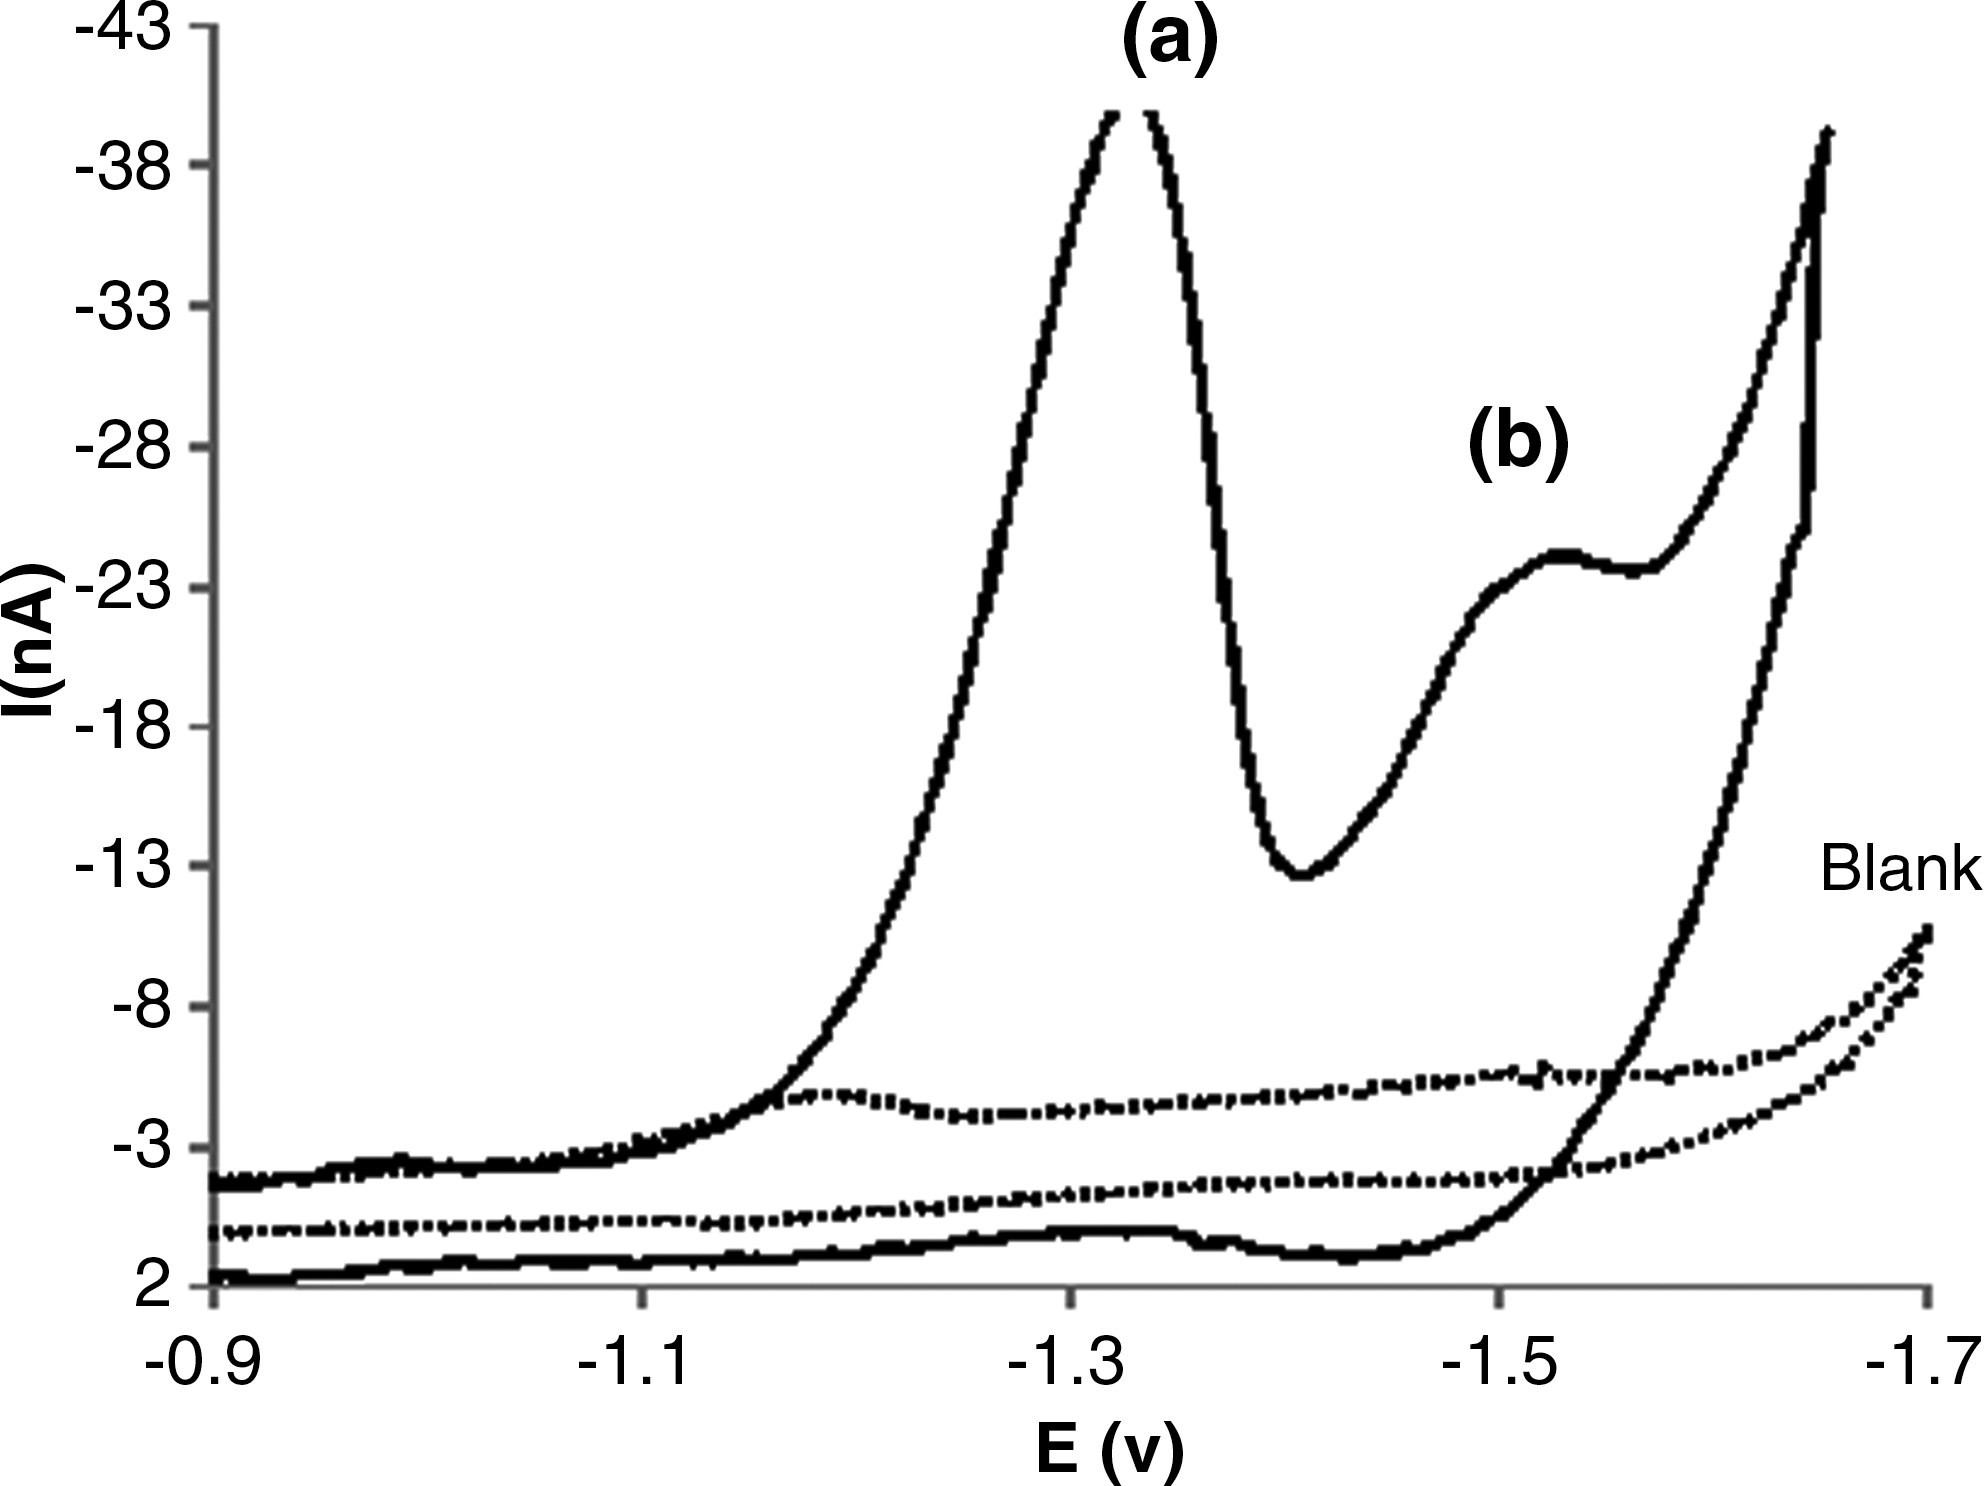
Cyclic voltammogram of 5.0×10⁻⁵ M of deltamethrin in the absence of DNA in 5 mM Tris-HCl buffer (pH 7.3), scan rate was 50 mV s−1.
Where E
p/2 is the potential, where i=i
p/2 in cyclic voltammograms. For exact measurement of |E
p −E
p/2| all CV peaks were obtained by using the determination mode of the Metrohm VA 797 computrace instrument. As the |E
p −E
p/2| may be changed by scan rate, the average value of |E
p −E
p/2| in all scan rates (10 to 80 mV s−1) for both cathodic peaks of a and b were calculated as 25 and 37.8 mV, respectively. The values of (αn)a and (αn)b, calculated from equation I, were 1.907 and 1.26, respectively. Generally, α in the totally irreversible electrode process is assumed as 0.5. Hence, 4 electrons are involved in the reduction process for peak a and 2 electrons are devoted to peak b. The values of α were 0.476 for peak a and 0.63 for peak b. The symmetry of the energy barrier (α) was calculated again, using the Anson equation (II) (Anson, 1983):
The α value was calculated from the slope of the linear between E p and lnν. The α value for peak a was 0.49 and for peak b was 0.66. Peak a may have resulted from the reduction of the −CN moiety and peak b may have resulted from the reduction of the −C=C− moiety. Therefore, on the basis of above results, the following mechanism may be proposed for each peak.
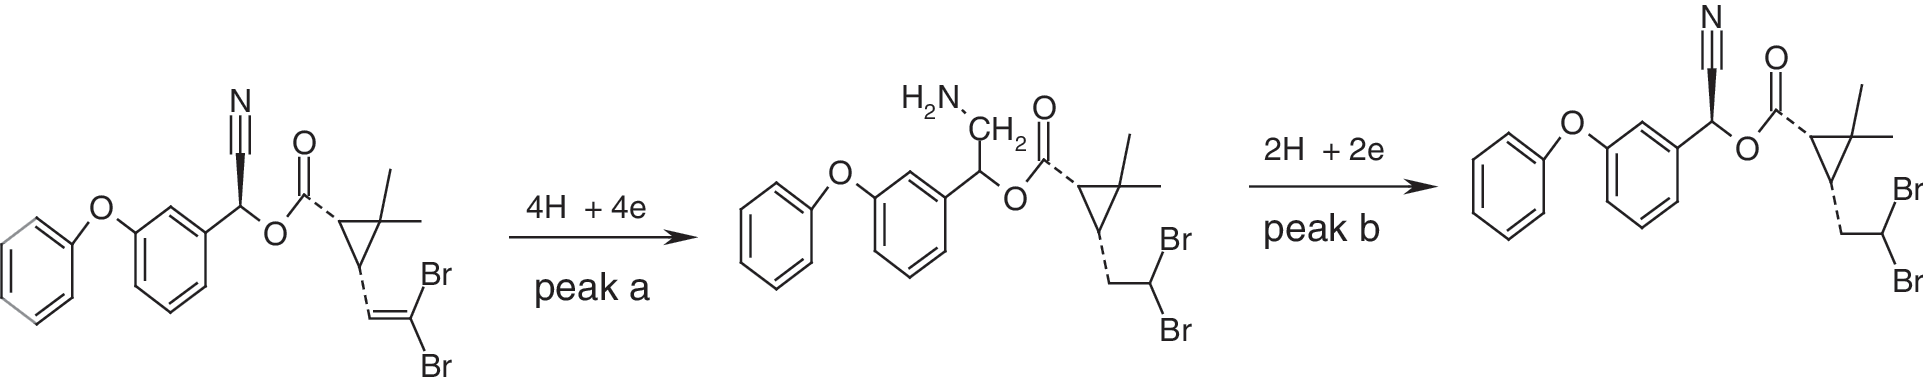
As the reduction of the −CN moiety is carried out by 4e, the intensity of peak a in pH=7.3 is higher, and i pa is remarkably more than the i pb. Also, the influence of pH on the peak potentials of DM was studied in the pH range of 3.0 to 9.0 for a solution containing 5.0×10⁻⁵ M of DM by the cyclic voltammetry method. The results revealed that the peak potential (E p) of the both cathodic peaks of DM as a function of pH were changed and were shifted toward negative, whereas, peak a was more shifted toward the pH range of 3–9. The plots of voltammetric peaks potential versus pH were straight lines with slope of 53.9 and 30.2 mV, respectively, which agrees with four and two reduction process with transfer coefficient α=0.5, respectively (Fig. 3). Therefore, the proposed reduction mechanism of DM was confirmed. The dependence of both cathodic peak currents of DM to the scan rate (ν) in the absence and presence of an excess of DNA was examined at HMDE., With increasing scan rate, both cathodic peak currents of DM in absence of DNA considerably increased, whereas in the presence of 5.0×10⁻⁵ M of DNA both the peak currents slowly increased. The negative shift of both peak potentials with increasing scan rate (ν) demonstrated an irreversible electrode process for DM. The plots of both peak currents versus ν and ν 1/2 for DM are shown in Figure 4a and 4b. Both cathodic peak currents of DM linearly vary with square root of the scan rate, ν 1/2, rather than with ν. The linear equation of i pc versus ν 1/2 for peak a is: i pca (nA)=−4.761 ν 1/2 (mV S−1)1/2–3.374 with R=0.995; and for peak b is i pcb (nA)=−1.996 ν 1/2 (mV S−1)1/2–0.948 with R=0.995. The results indicated that the mass transport of DM to the HMDE surface is a diffusion controlled process (Wang et al., 2003a). In the presence of DNA (R=[DNA]/[DM]=1), both cathodic peaks of DM decreased. The plots of i pc versus ν and ν 1/2 for each peak of DNA-DM complex are presented in Figure 5a and 5b. The linear equation of i pc versus ν 1/2 for peak a is: i pc(a) (nA)=−4.8078 ν 1/2 (mV S−1)1/2+ 1.1263 with R2=0.997; and for peak b is i pc(b) (nA)=−2.4356 ν 1/2 (mV S−1)1/2+ 4.261 with R2=0.998. The linearity of i pc versus ν 1/2 plots indicated that the main transport of complex to the electrode surface is controlled by diffusion (Wang et al., 2007). The lower diffusion coefficient of the DM-DNA species is responsible for the decay of current signals in CV behavior of DM. Also the larger slopes of plots of i pc versus ν 1/2 for DM in the presence of DNA could be attributed to the non-intercalation with DNA (Rehman et al., 2009). In our previous studies, we showed that decreases in the current of the complex is not from the viscosity of the solution or the blocking of the electrode surface by DNA adsorption (Ahmadi and Jafari, 2011; Ahmadi et al., 2011b; Ahmadi et al., 2011a). In order to show this decrease in current did not arise from the viscosity of the solution or the blockage of the electrode surface by DNA adsorption, we studied the CV of K4Fe(CN)6 in the absence and presence of DNA. The results revealed that DNA had no effects on the diffusion from the changed viscosity of the solution and/or the DNA adsorption. Therefore, a large decrease in current could be attributed to the diffusion of DM bound to the large, slowly diffusing DNA.
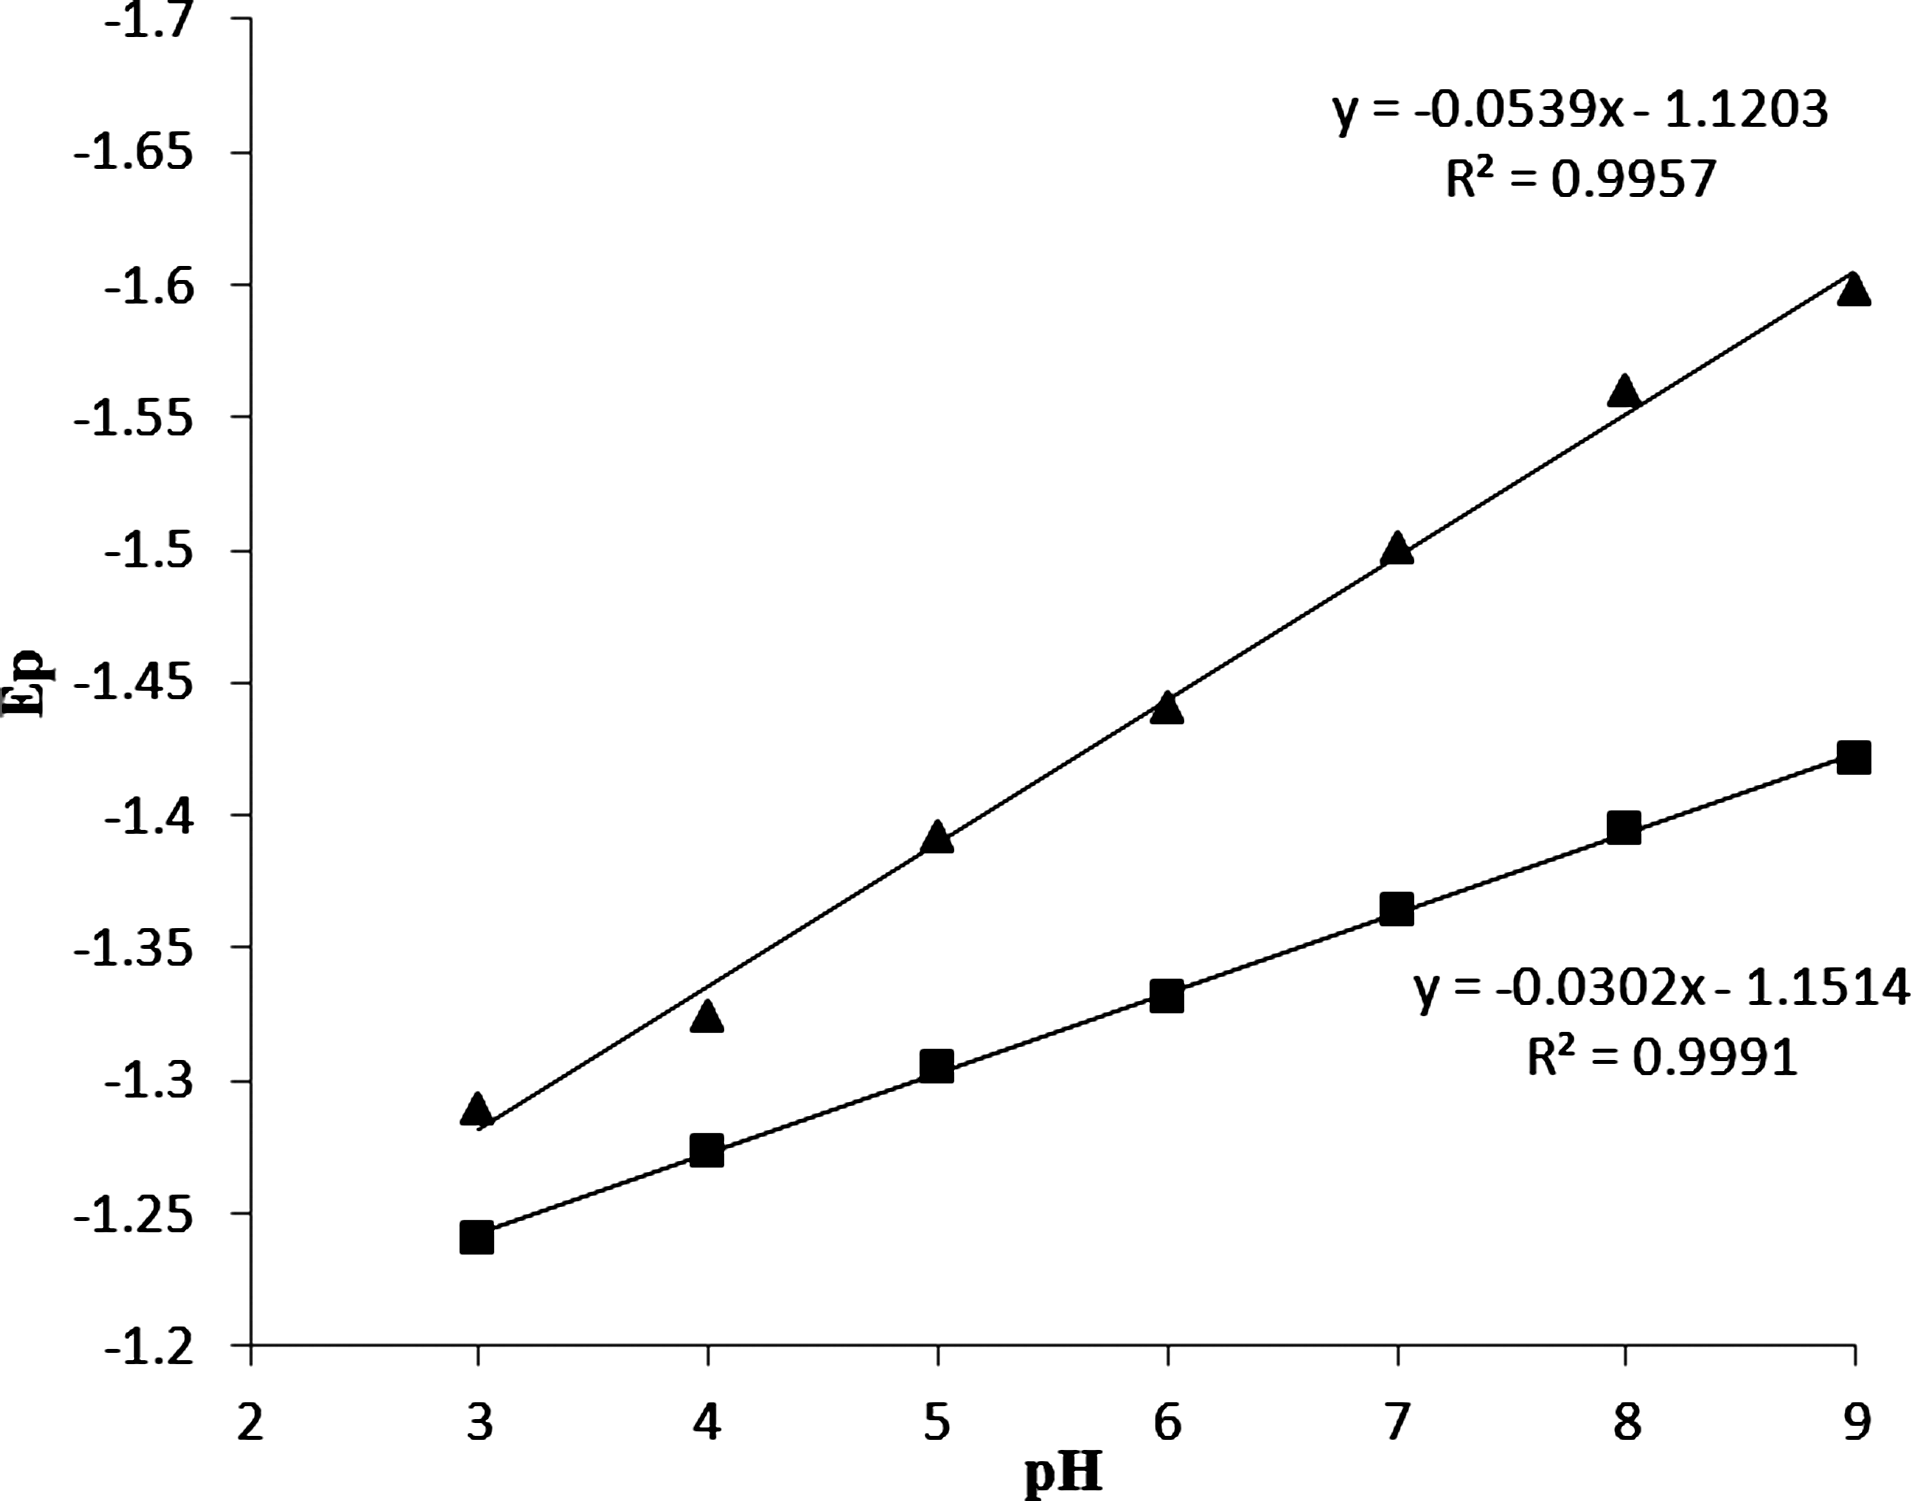
The dependences of cathodic peak potential Ep versus pH for peak a (▪) and peak b (▴). The conditions were as follows: 10 mL of electrolyte containing 20% (v/v) AN–Tris-HCl buffer, scan rate 50 mV s−1.

The cathodic current variations of peak a (▪) and peak b (▴) of DM with

The cathodic current variations of peak a (▪) and peak b (▴) of DM-DNA complex with
CV titration of DM with DNA
Electrochemical titration is valuable in quantifying the interaction parameters of an electroactive molecule with DNA than other methods (Ahmadi and Bakhshandeh, 2009; Ahmadi and Jafari, 2011; Ahmadi et al., 2011b; Ahmadi et al., 2011a). By addition of different amounts of DNA to the voltammetric cell containing 1.0×10⁻⁵ M of DM, the cathodic peak currents of DM begin to decrease and the formal potential shifts to more positive values which suggest the interaction of the DM with DNA. When
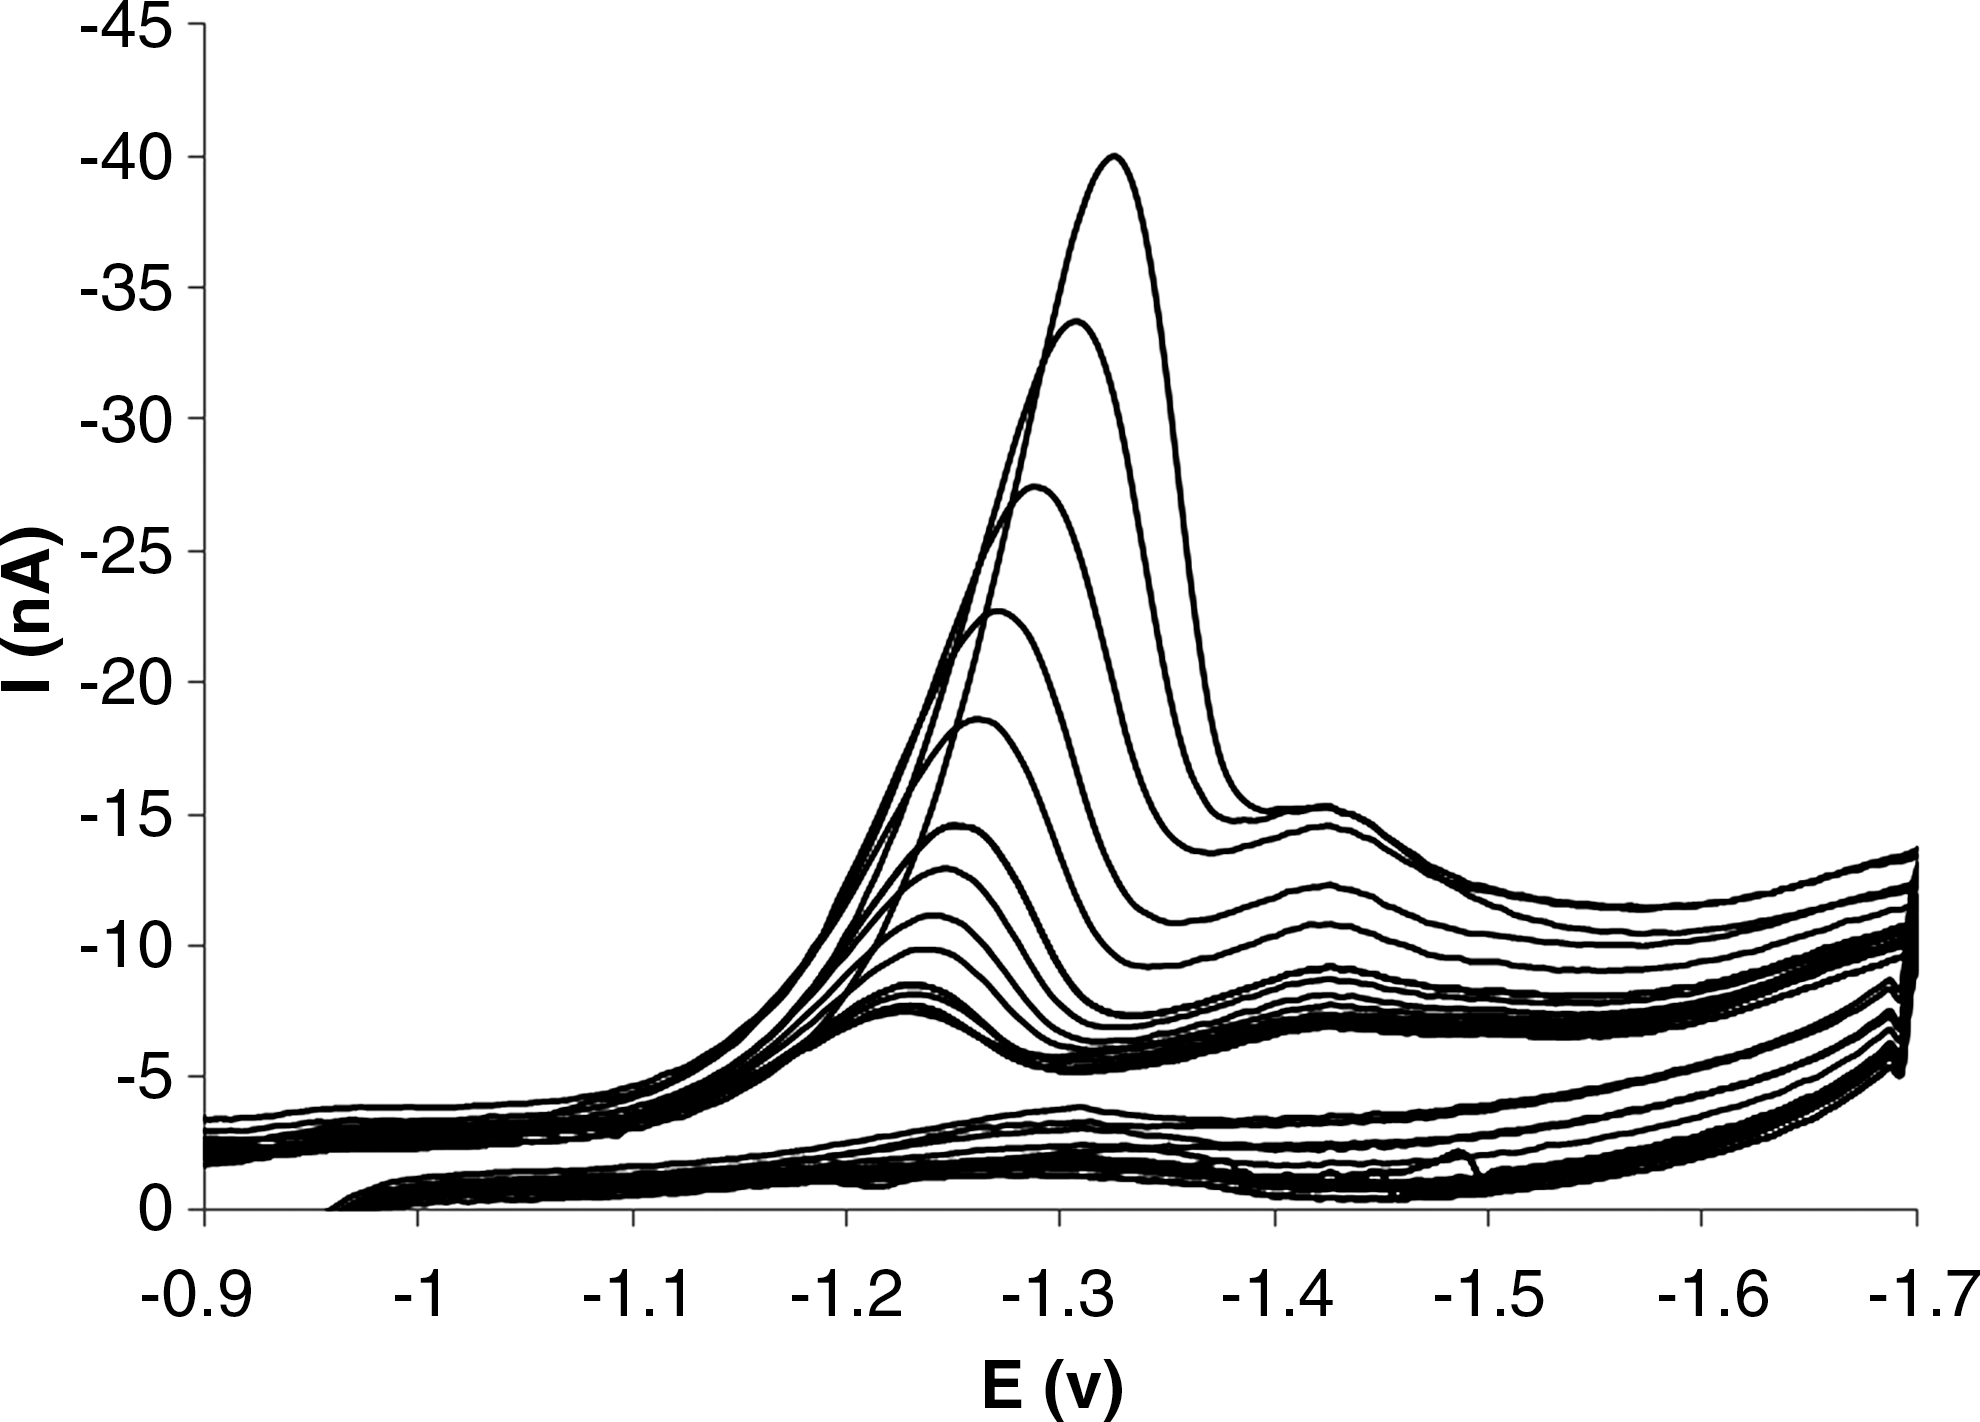
Cyclic voltammetric titration of 5.0×10⁻⁵ M of DM with DNA (DNA concentration varied from 0.0 to 2.5×10⁻⁴M).
Equilibrium constant measurements
Cyclic voltammeric titration is valuable for quantifying binding of the DM to DNA. By addition of different amounts of DNA to the electrolyte solution, the peak currents begin to decrease and the formal potential shifts to more positive values, which suggests strong interaction of the DM with DNA. When R=5.0 (R is defined as the ratio of the total concentration of nucleic acid to that of DM), the currents were stable (Fig. 7). If an electroactive molecule (E) nonspecifically reacts with a DNA duplex at a binding site, which is composed of base pairs (S), a DNA-electroactive molecule complex (E −S) is produced as follows:
As DM non-specifically binds to the DNA duplex and covers S consecutive base pairs (i.e., one binding site), the binding constant, K, can be given by the equation (IV):
Where Cb, Cf
, and Cs
represent the equilibrium concentrations of the DNA-DM complex, free DM and free binding site, respectively. The total concentration of DM, Ct
, is:
The average of number of binding sites (x) along a DNA duplex molecule with an average total number of base pairs L can be described by the following:
where
CNP
represents the concentration of nucleotide phosphate, which is determined by the UV absorption at 260 nm. The total concentration of binding sites can also be expressed as follows:
The ratio of the NP concentration and the total concentration of electroactive molecules can be defined as R:
For an irreversible reaction in CV, the total cathodic current (Ipc
) under the fixed potential with any R can be calculated:
B represents the appropriate, concentration-independent terms in the voltammetric expression. A Nernstain reaction in CV at 25°C is shown as follows (Wang et al., 2003b):
Where n is the number of electron transferred, A the electrode area, v the scan rate, Df and Db are the diffusion coefficients for free and bound molecules, α f and α b are the electron transfer coefficients for free and bound molecules, and C f and C b are the bulk concentrations of the free and bound irreversibly electroactive species.
Based on Carter and Bar (1987) the binding constant, K, can be expressed as the following form:
Where s is the size of binding site in terms of base pairs. Making appropriate substitutions and eliminating Cb
and Cf
from Eq. (X), a new equation was obtained:
Where
Since ipc , Ct and [NP] are experimentally measurable and (αn) f , (αn) b , have already been acquired as mentioned above, the binding constant (K) and binding site size (s) of the DM-DNA, Df and Db can be obtained from a nonlinear regression analysis of the experimental data (ipc versus [R] plot; Fig. 7) according to Eq. (XIII). The nonlinear fit analysis yielded K=2.6×10⁴ and s=1.6, D f =3.2×10⁻⁴Cm2 S−1 and D b =8.5×10⁻⁶ Cm2 S−1.
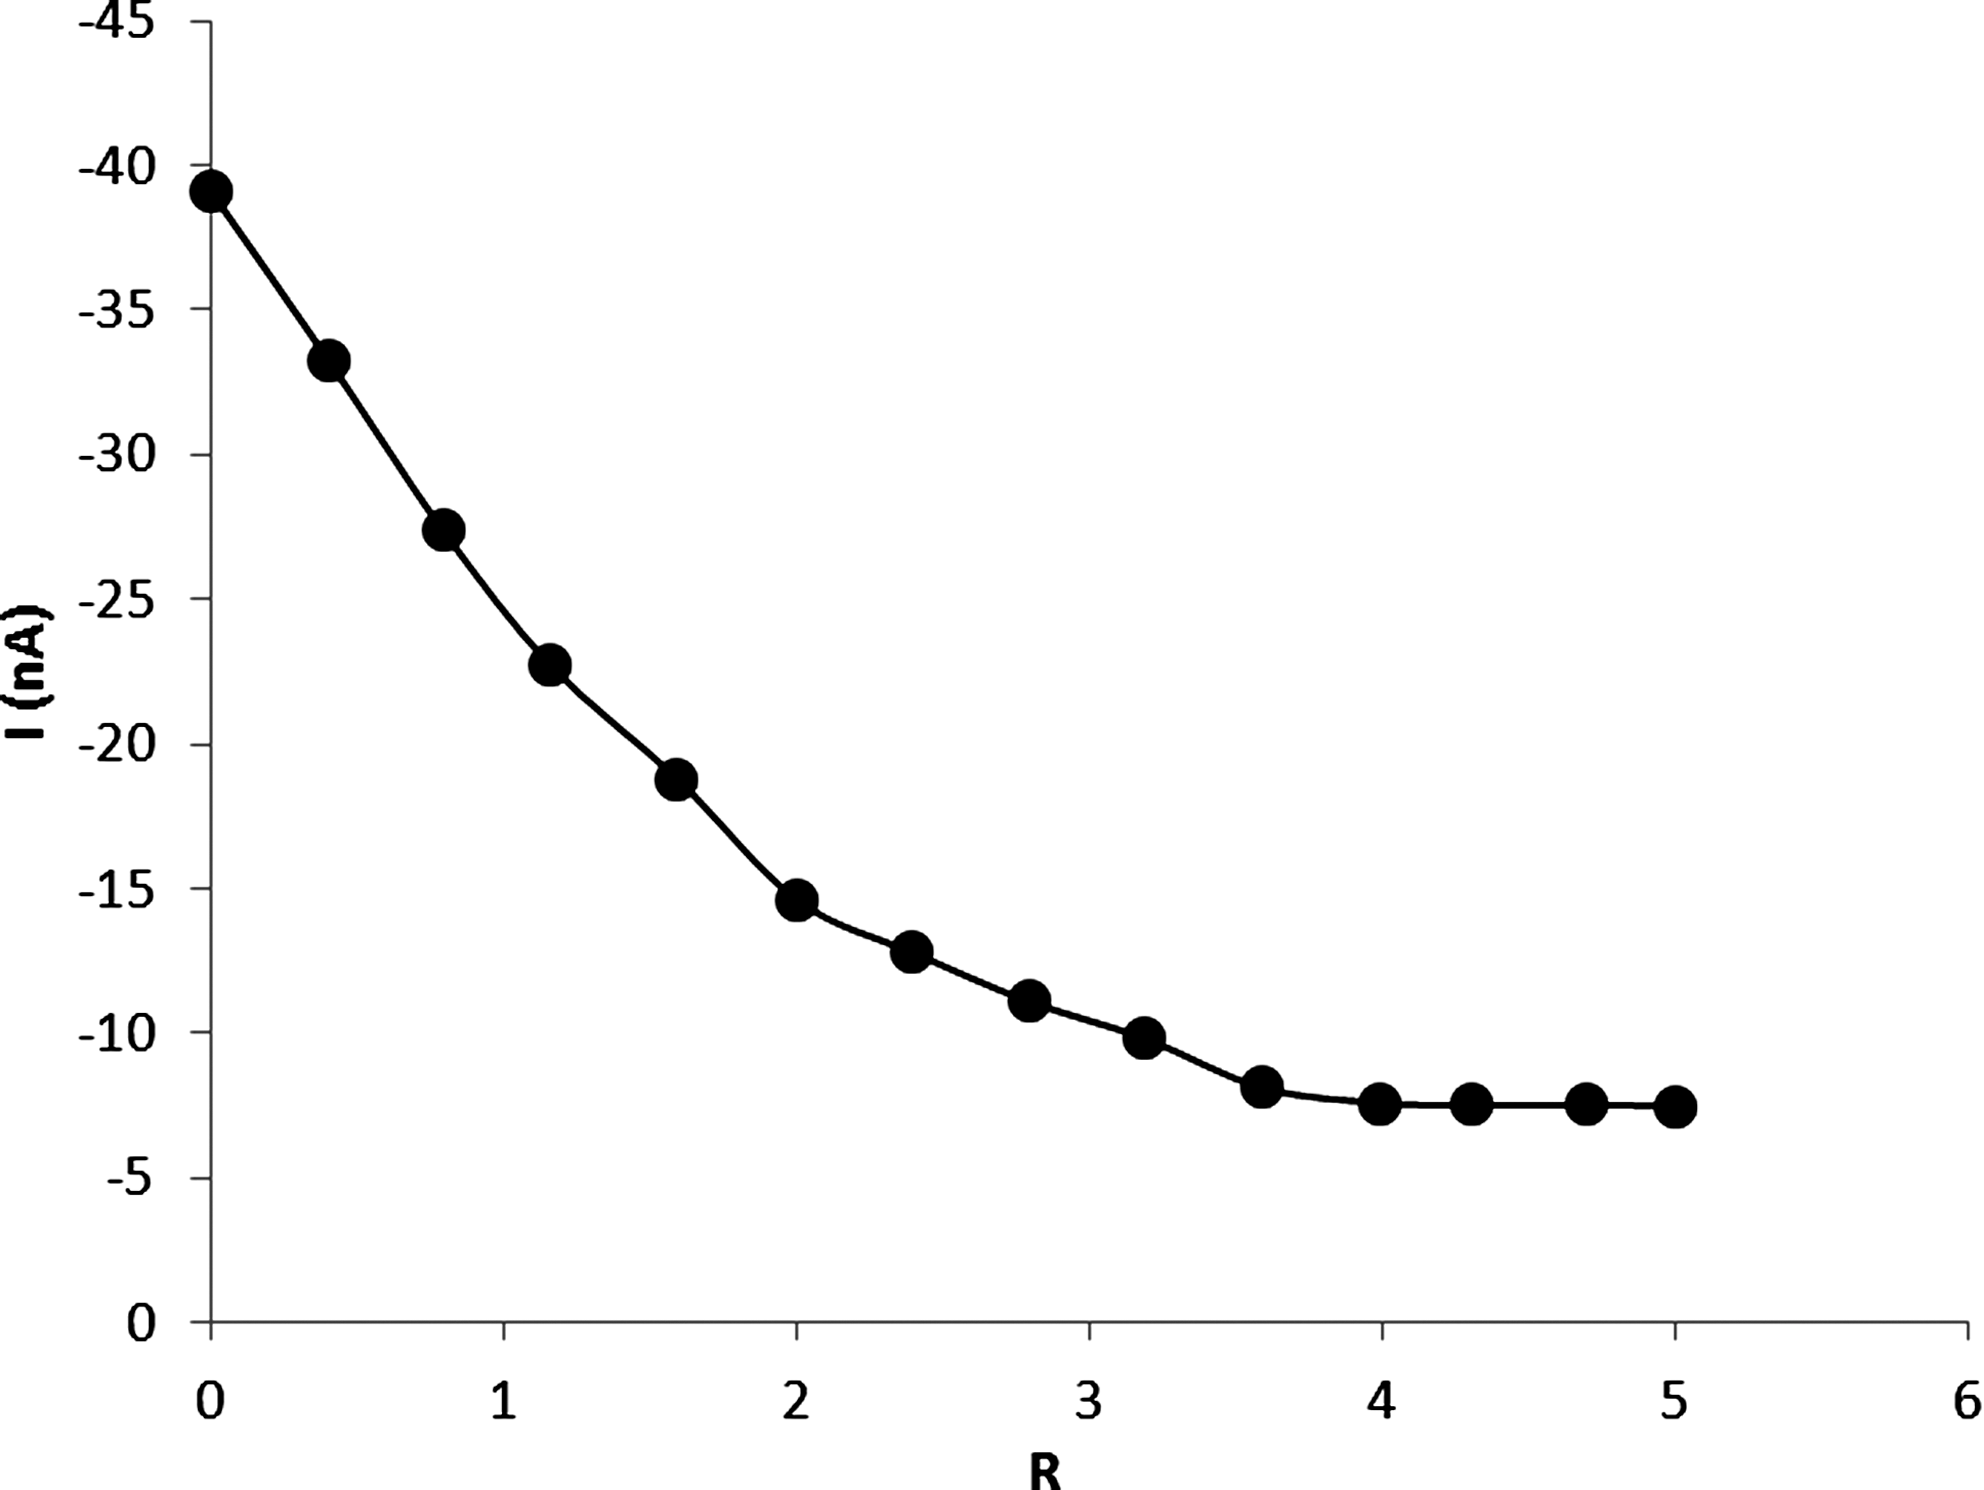
Dependence of ipca of 5.0×10⁻⁵ M DM on the concentration of added DNA by cyclic voltammetry, scan rate=50 mVs−1.
In previous works the k b of DNA with several pesticides at 25°C such as: fenitrothion (1.9×10⁴) (Ahmadi and Jafari, 2011), 2-imidazolidinethione (1.4×10³) (Ahmadi et al., 2010), 2,4-D (3.5×10³ and 5.0×10³) (Ahmadi and Bakhshandeh, 2009), clodinafop-propargyl (5.6×10³) (Askari et al., 2008), diazinon (1.6×10⁴) (Gholivand et al., 2008), and aminocarb (7.2×10³) (Zhang et al., 2010) have been reported. These carcinogenic compounds have a significant binding affinity to DNA in the range of 3.5×10³ to 1.6×10⁴. The Kb of DMis 2.6×10⁴ and is less than those observed for typical classical intercalators, ethidium–DNA, 7×10⁷ in 40 mM Tris–HCl buffer, pH 7.9 (Waring, 1965) and 1.4×10⁶ in 40 mM NaCl–25 mM Tris–HCl (Lepecq and Paoletti, 1967).
Competitive binding between ethidium bromide and DM for DNA
Ethidium bromide (EB) displays a dramatic enhancement of DNA fluorescence efficiency when intercalated into DNA. The mechanism for fluorescence enhancement of EB upon bonding with nucleic acids can be described with excited state quenching by solute-to-solvent proton transfer. According to this mechanism, the low fluorescence intensity of free EB in water is attributed to efficient quenching of excited state molecules by proton transfer to water molecules (quenching rate constant of 107 s−1 m−1), and the enhancement of the fluorescence intensity on going to nonaqueous solvents, deuterated EB, or binding to DNA is attributed to a reduction in the proton transfer rate. Intercalated EB is substantially less accessible to water molecules than is outside-bound EB. Hence, the lifetime in the intercalated sites is substantially longer than in electrostatically bound sites. Therefore, the popular strategy for monitoring DNA interaction with target molecules by fluorescence spectroscopy is based on the quenching of EB fluorescence via competition for binding sites (Wu et al., 2005). DM does not show any fluorescence at room temperature in solution or in the presence of CT DNA, so that the binding to DNA cannot be directly predicted through the emission spectra. The emission spectra of EB bound to CT DNA in the absence and presence of DM have been recorded for [EB]=1.0×10⁻⁵ M, [DNA]=5.0×10⁻⁵ M for increasing amounts of DM (Fig. 8). There is no significant displacement of EB by DM, reflecting the absence of an intercalative mode of binding.
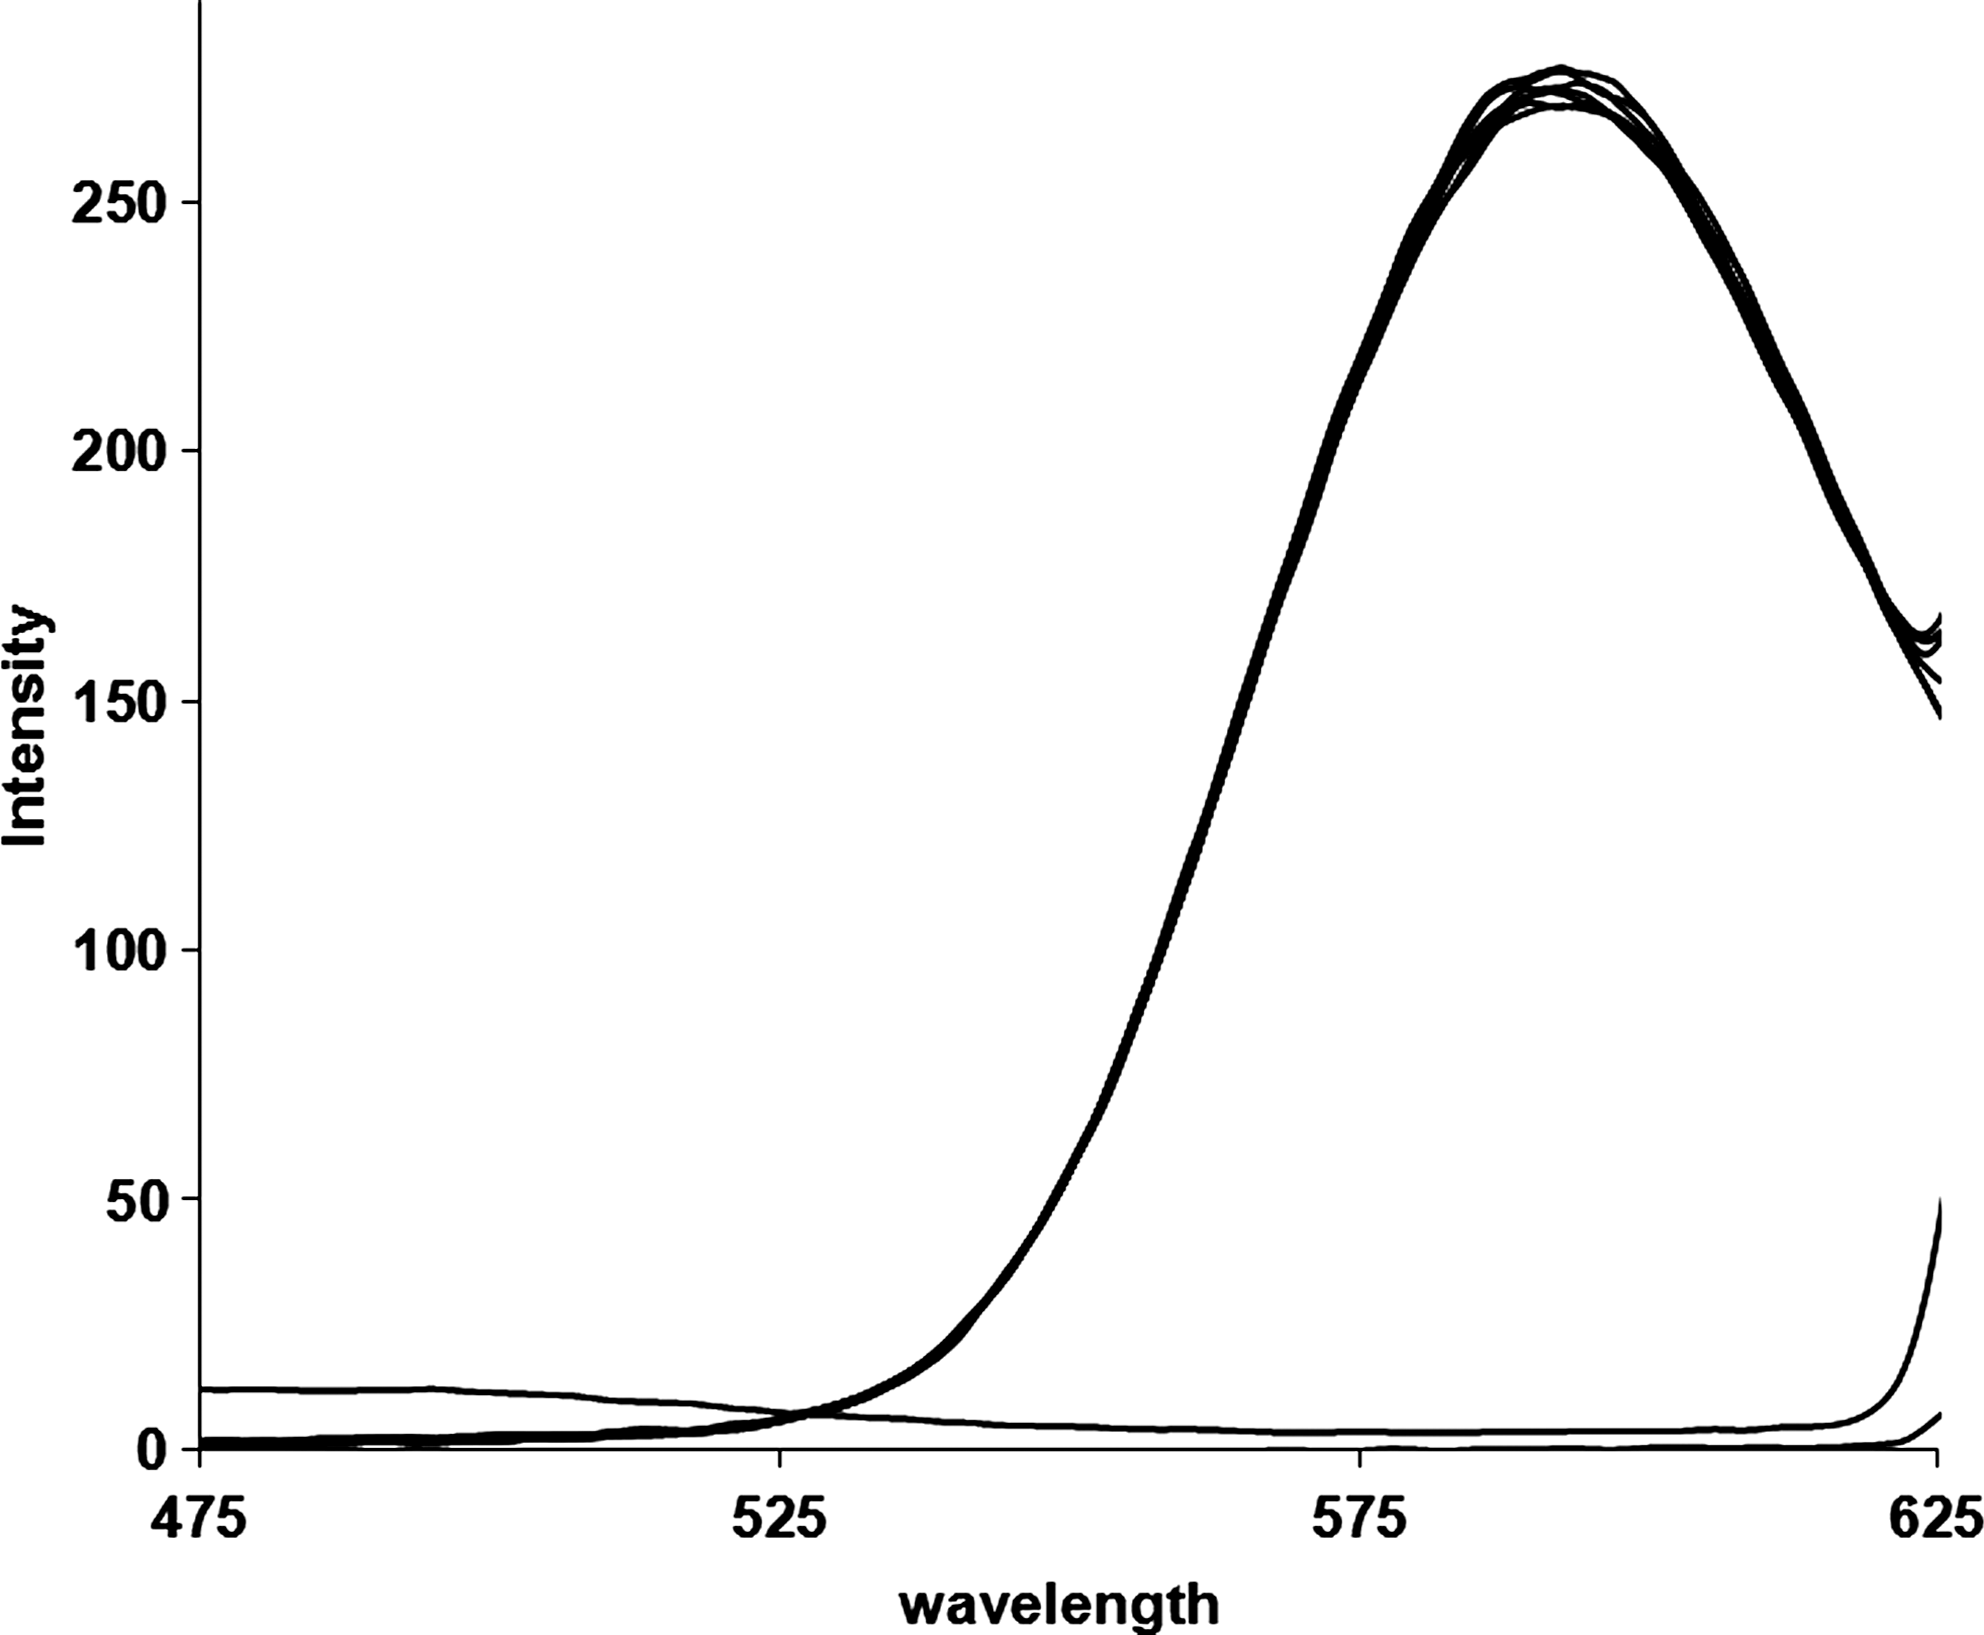
Emission spectra of
DNA thermal denaturation
To further characterize the DM-DNA complex, thermal denaturation of CT DNA in absence and presence of DM was investigated (Fig. 9). DM-DNA stoichiometries of r i=0.0, 0.5, and 1.0 were investigated. When the solution temperature increases, double-stranded DNA gradually dissociates into single strands; Tm is defined as the temperature where half of the total base pairs is unpaired. The DNA melting temperature (Tm) is strictly related to the stability of the double helix, and interaction of DM with DNA may alter Tm by stabilizing or destabilizing the final complex. The melting temperature of DNA 5.0×10⁻⁵ M in Tris–HCl buffer (70±0.5°C) increases about 4.0 and 7.0°C, at r i=0.5 and 1.0, respectively. These data are lower than that reported for intercalatores and indicated that DM stabilizes the native DNA conformation via nonintercalation mechanism.
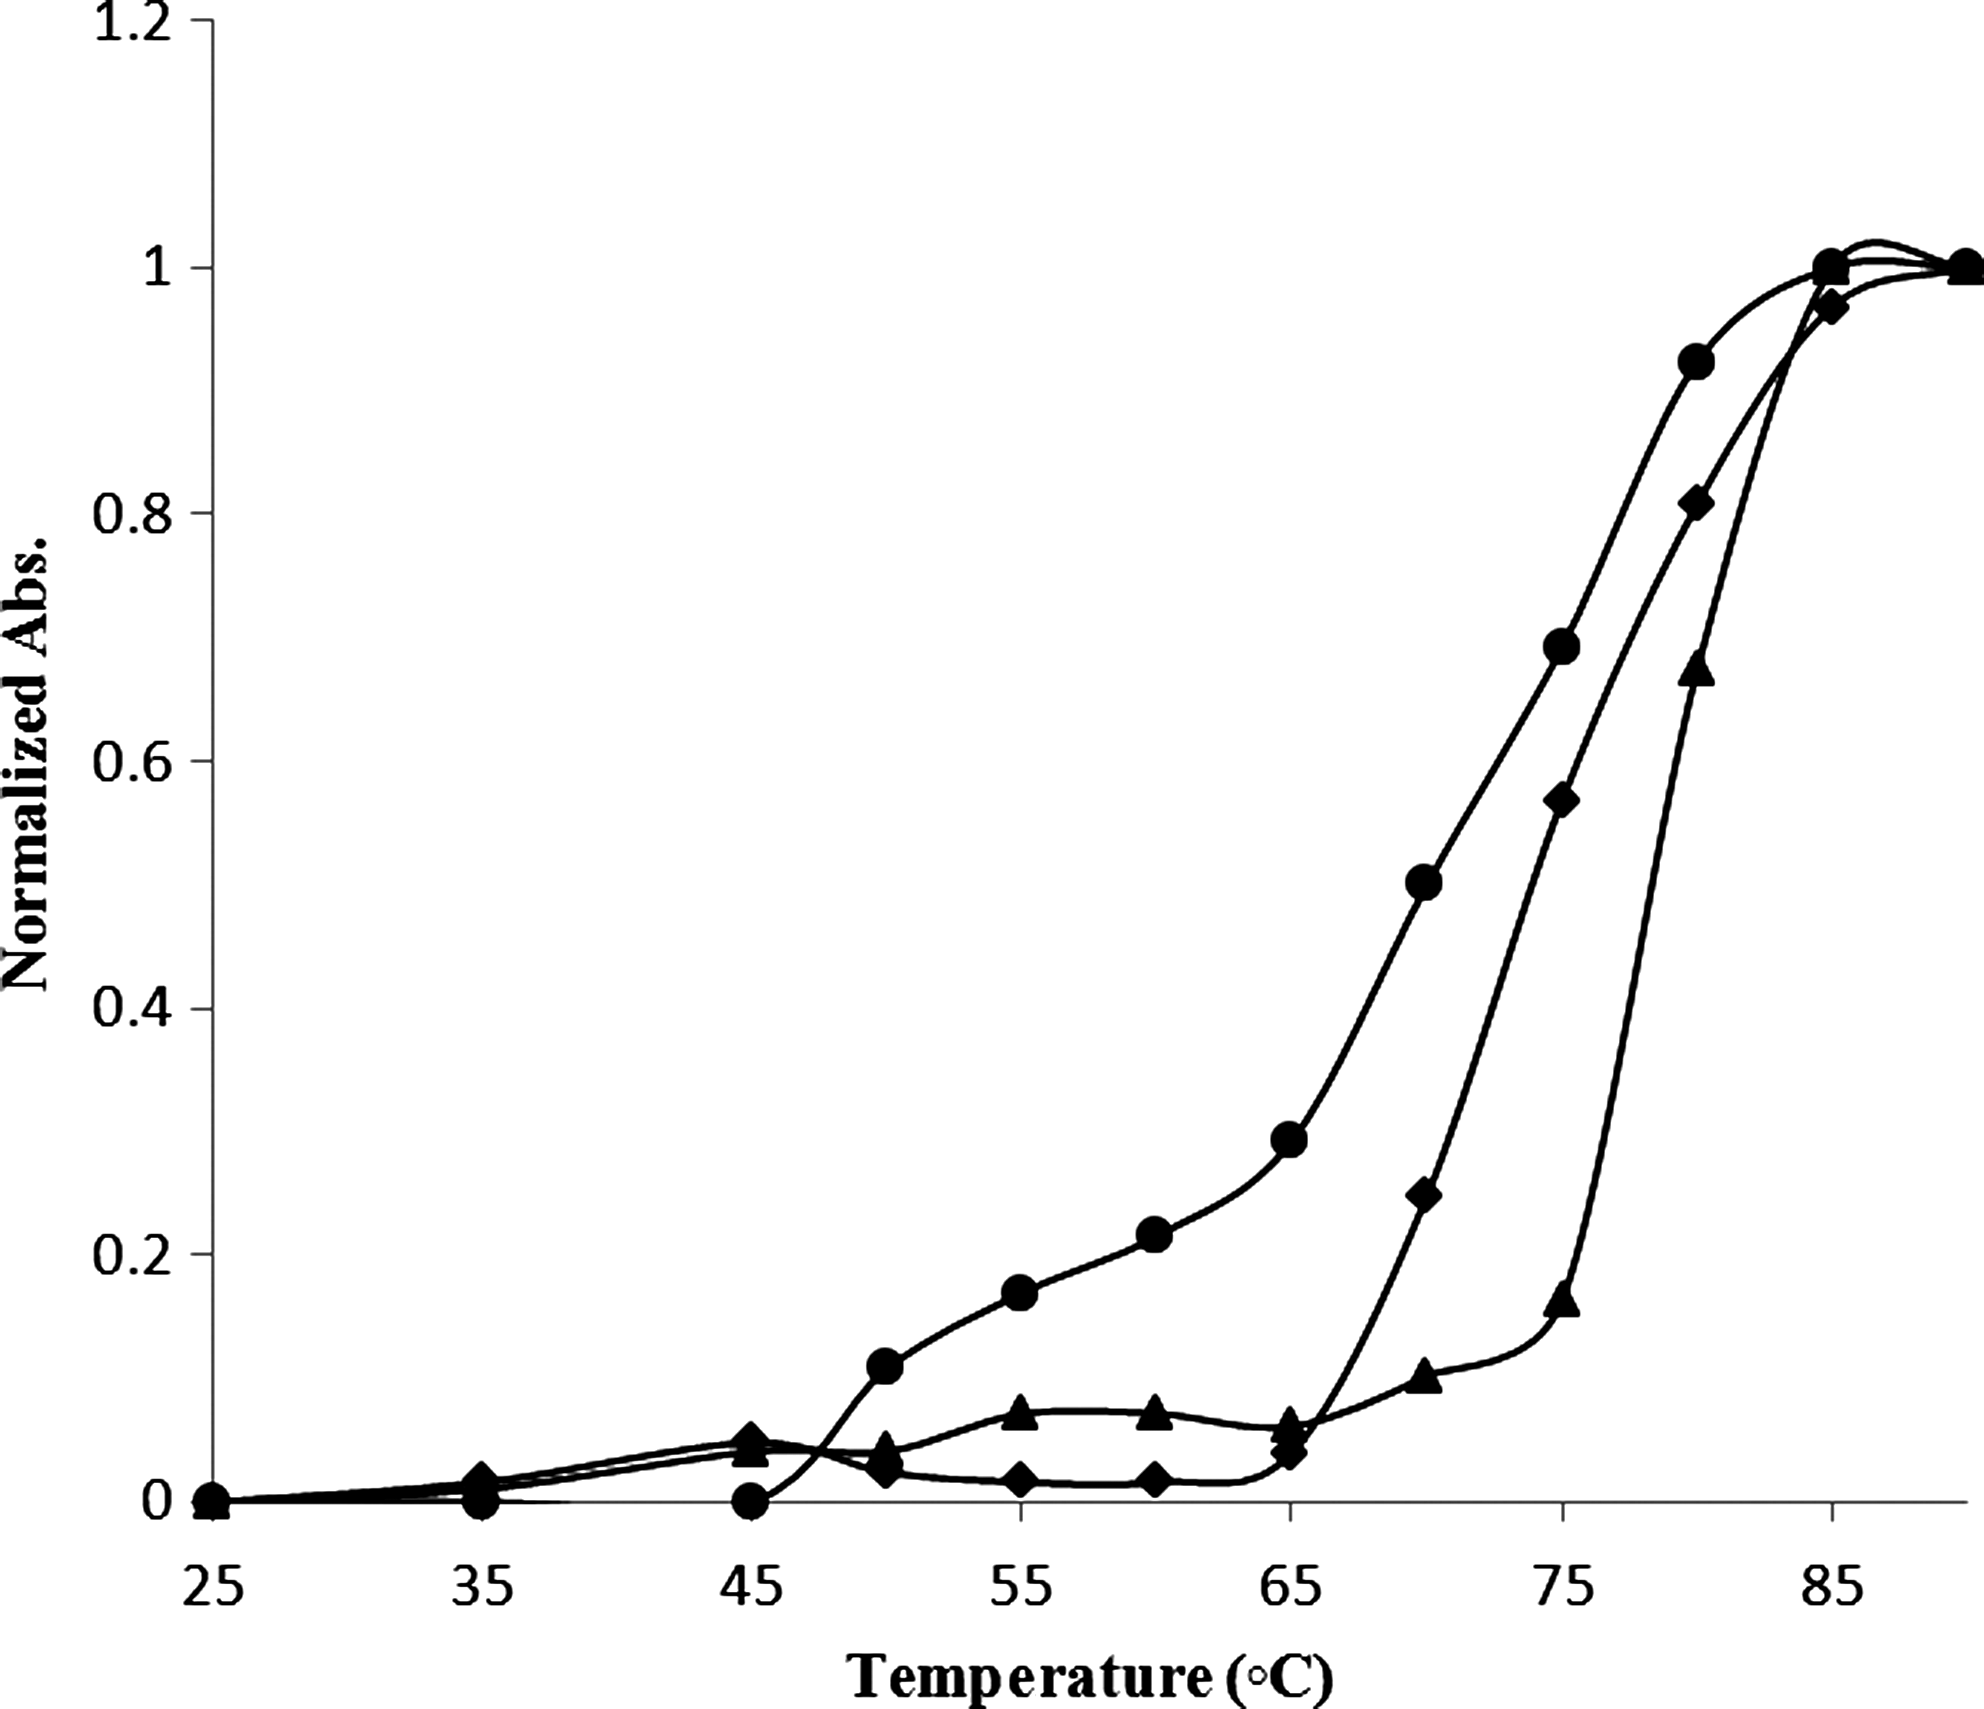
Melting plots, by ultraviolet–visible absorbance spectrophotometry, of calf thymus DNA 5×10⁻⁵ M in Tris-HCl in the presence of DM, at ri=[DM]/[DNA]=0.0 (•), 0.5(♦), and 1.0 (▴).
Atomic force microscopy
Recently, DNA molecules and their interactions with some small molecules have been studied by AFM (Liu et al., 2005; Ruiz et al., 2005; Sorel et al., 2006; Liu et al., 2010; Ahmadi et al., 2011c). AFM is capable of imaging nonconducting and conducting surfaces. However, the most practical limitation to the application of AFM to structural and conformational studies of DNA and its complexes with target macromolecules is the sample preparation. The macromolecules must be tethered to the substrate surface to avoid resolution-limiting motion caused by the sweeping tip during scanning. The free DNA and DM–DNA complexes at mole ratios of 1:1 and 2:1 at final DNA concentration of 0.1 mM were prepared in 2.0 mL Tris–HCl (pH 7.3). The samples were prepared on muscovite mica according to the methods of Marty et al. (2009). Figure 10a–e shows ultra structures of free DNA and DM–DNA complexes of 1:1 and 1:2 and their phase transition images, respectively. Figure 10a shows the free DNA structure which adhereto the surface of the mica. The worm-like structure in Figure 10a for free DNA is similar to that previously observed by Fang and Hoh (1998). In the 1:1 complex the DNA molecules coated with DM and formed a stable DNA adduct (Fig. 10b, arrow heads), whereas in 1:2 a grid shape was observed (Fig. 10c). As reported in previous studies, DNA can form many intermediates and finally change to the more compact structures such as the rods and toroids on the condensing process (Fang and Hoh, 1998; Hansma et al., 1998). This is because the dense DNA core is surrounded by a more deformable DM shell and condensed the DNA structure. The core of the 1:1 DNA-DM complex has an average size of 223 nm. The core of the 1:2 DNA-DM has an average size of 485 nm.
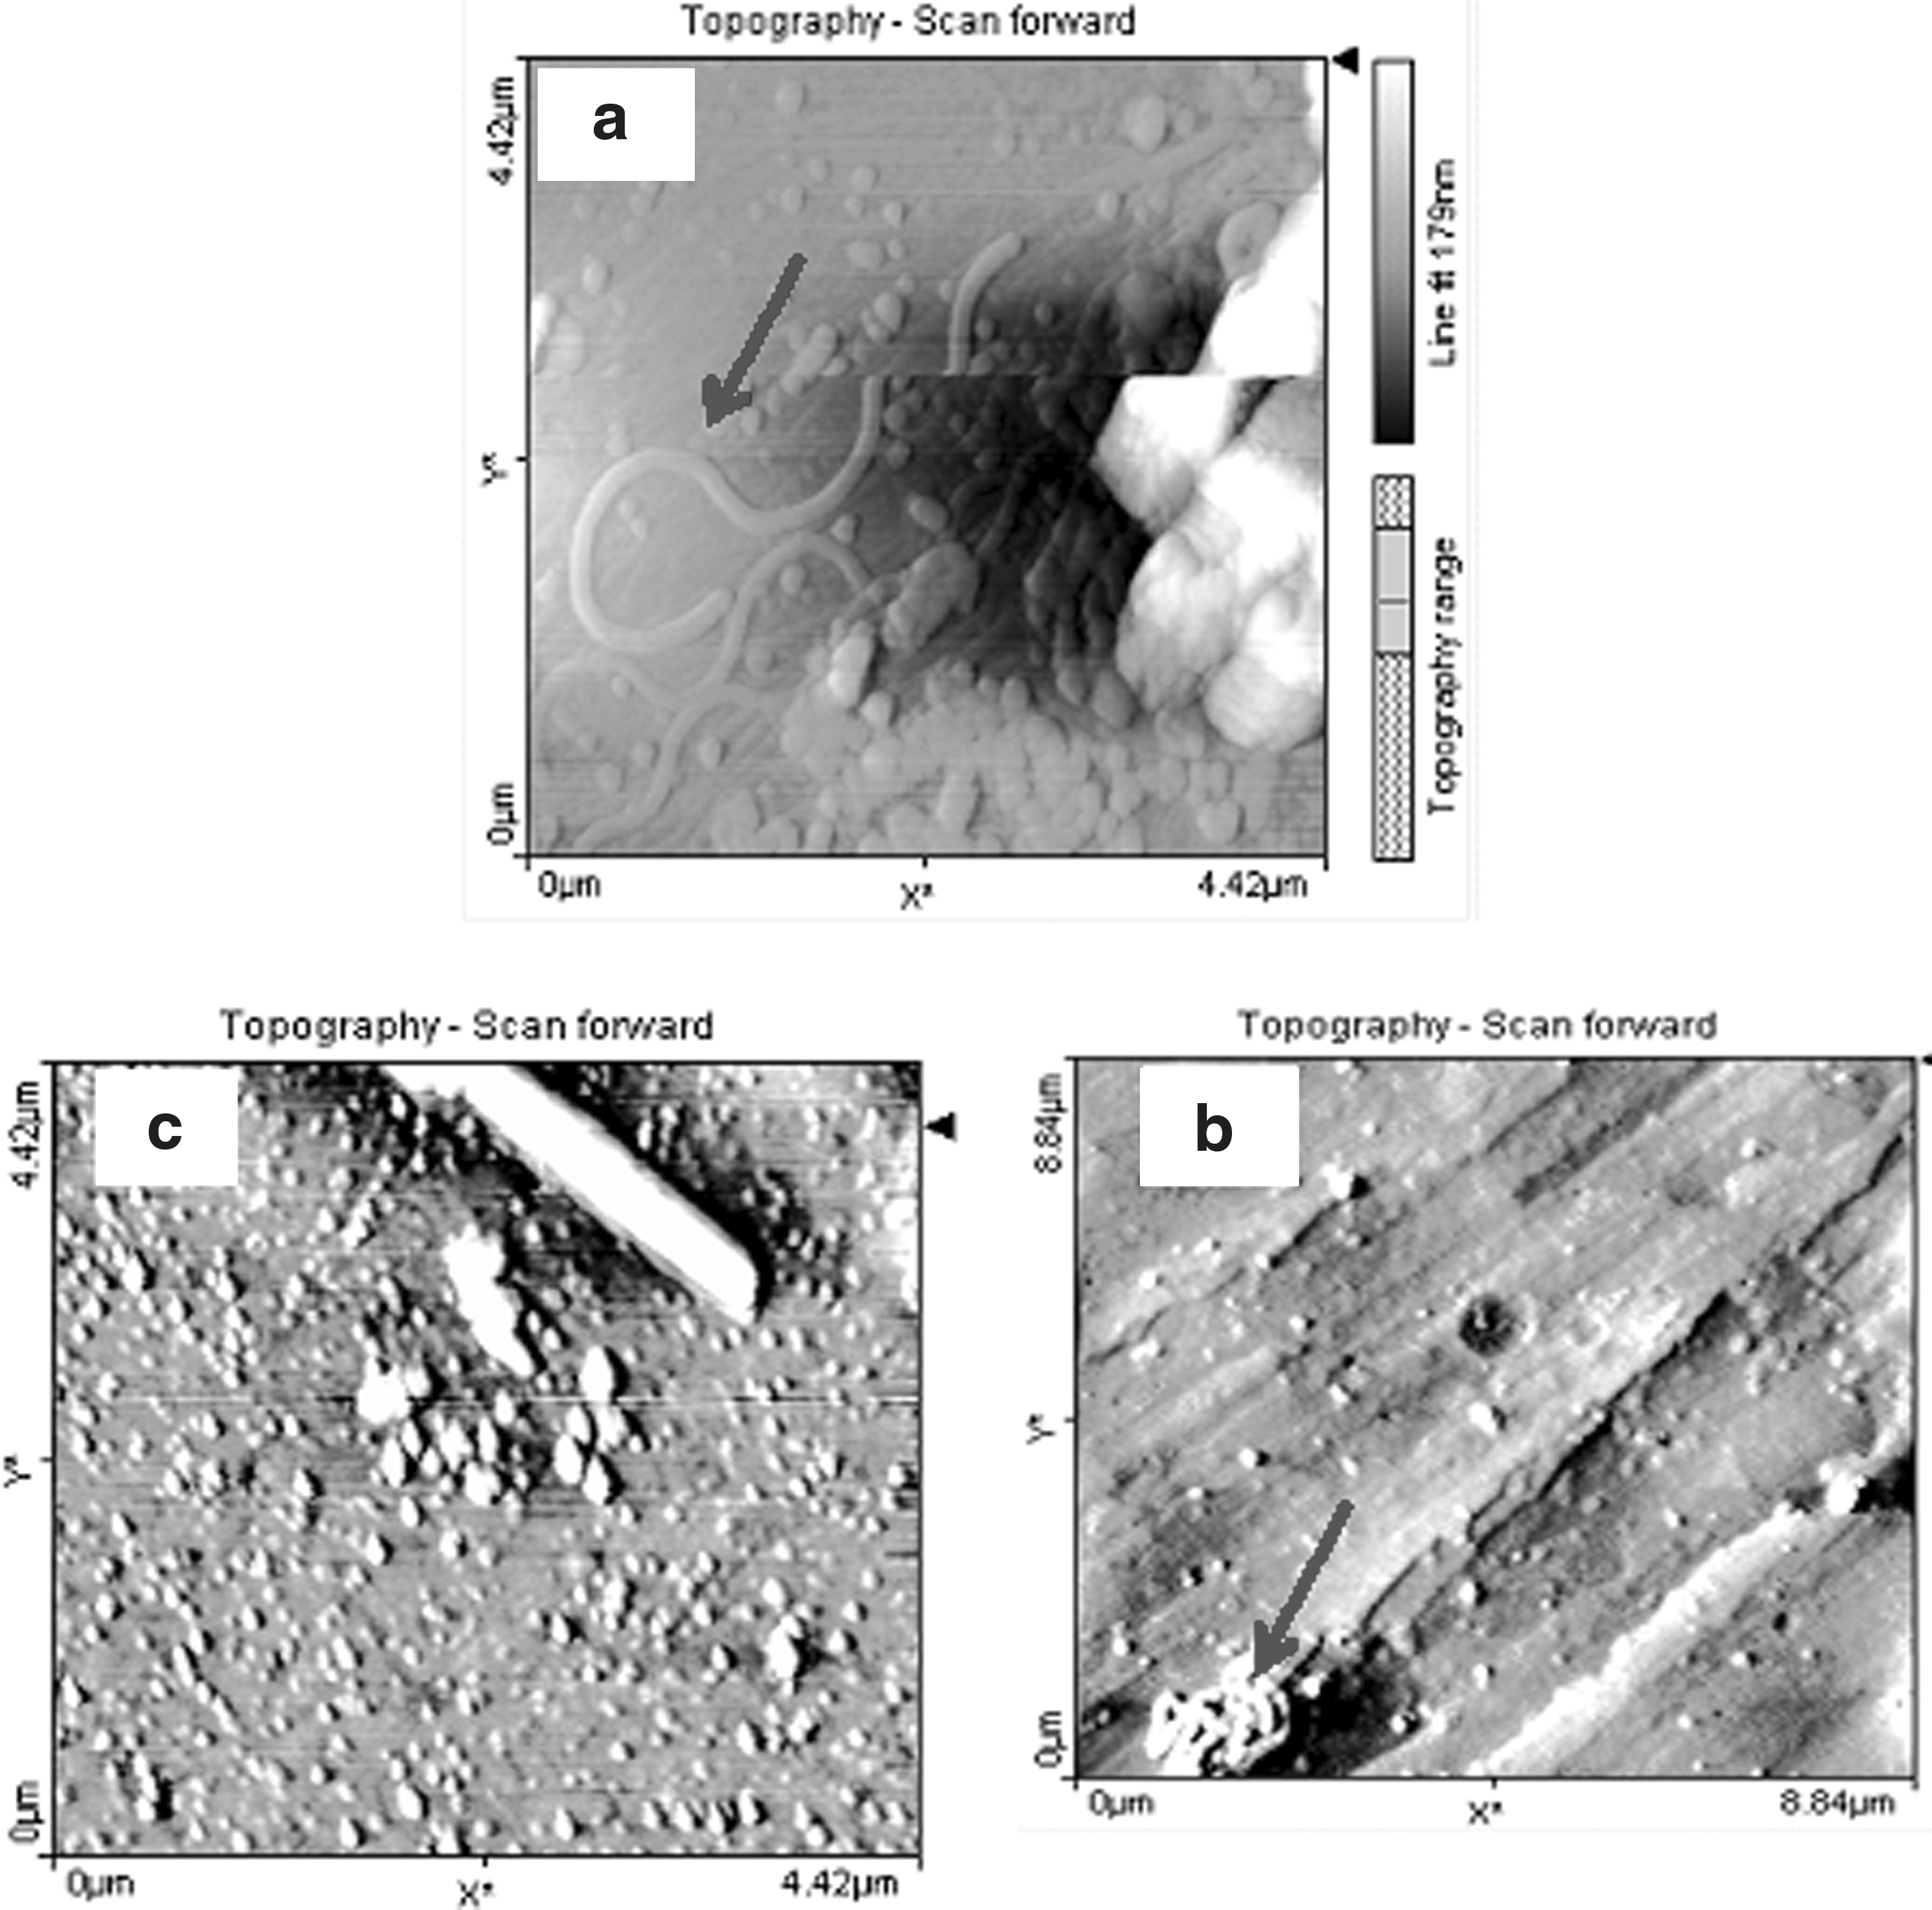
The atomic force microscopy images and transition phase of free DNA and DM-DNA complexes
Evaluation of streoselectivity interaction by CD
The effect of DM on DNA structure was evaluated by CD spectroscopy and the results are shown in Figure 11. The CD spectrum of free CT-DNA (dotted line) consists of a negative Cotton effect at 248 nm and a positive Cotton effect at 276 nm. The negative spectrum corresponds to the helical structure of DNA and the positive spectrum corresponds to stacking of the base-pairs that is characteristic of DNA in the right-handed B-form. The DM molecule do not exhibit any CD signal in the region of 220–320. Figure 11 illustrates how the spectra of dsDNA changed with the addition of DM to the DNA solution. The addition of DM has little effect on the positive peak, but increased the negative peak. With increasing DM, the height of the negative peak also increased, indicating a transition of the secondary DNA structure from B- to A-form. This effect was attributed to intrastrand linking of adjacent guanines so that the DNA conformation is modified and destacking of the adjacent guanines bases occurs.
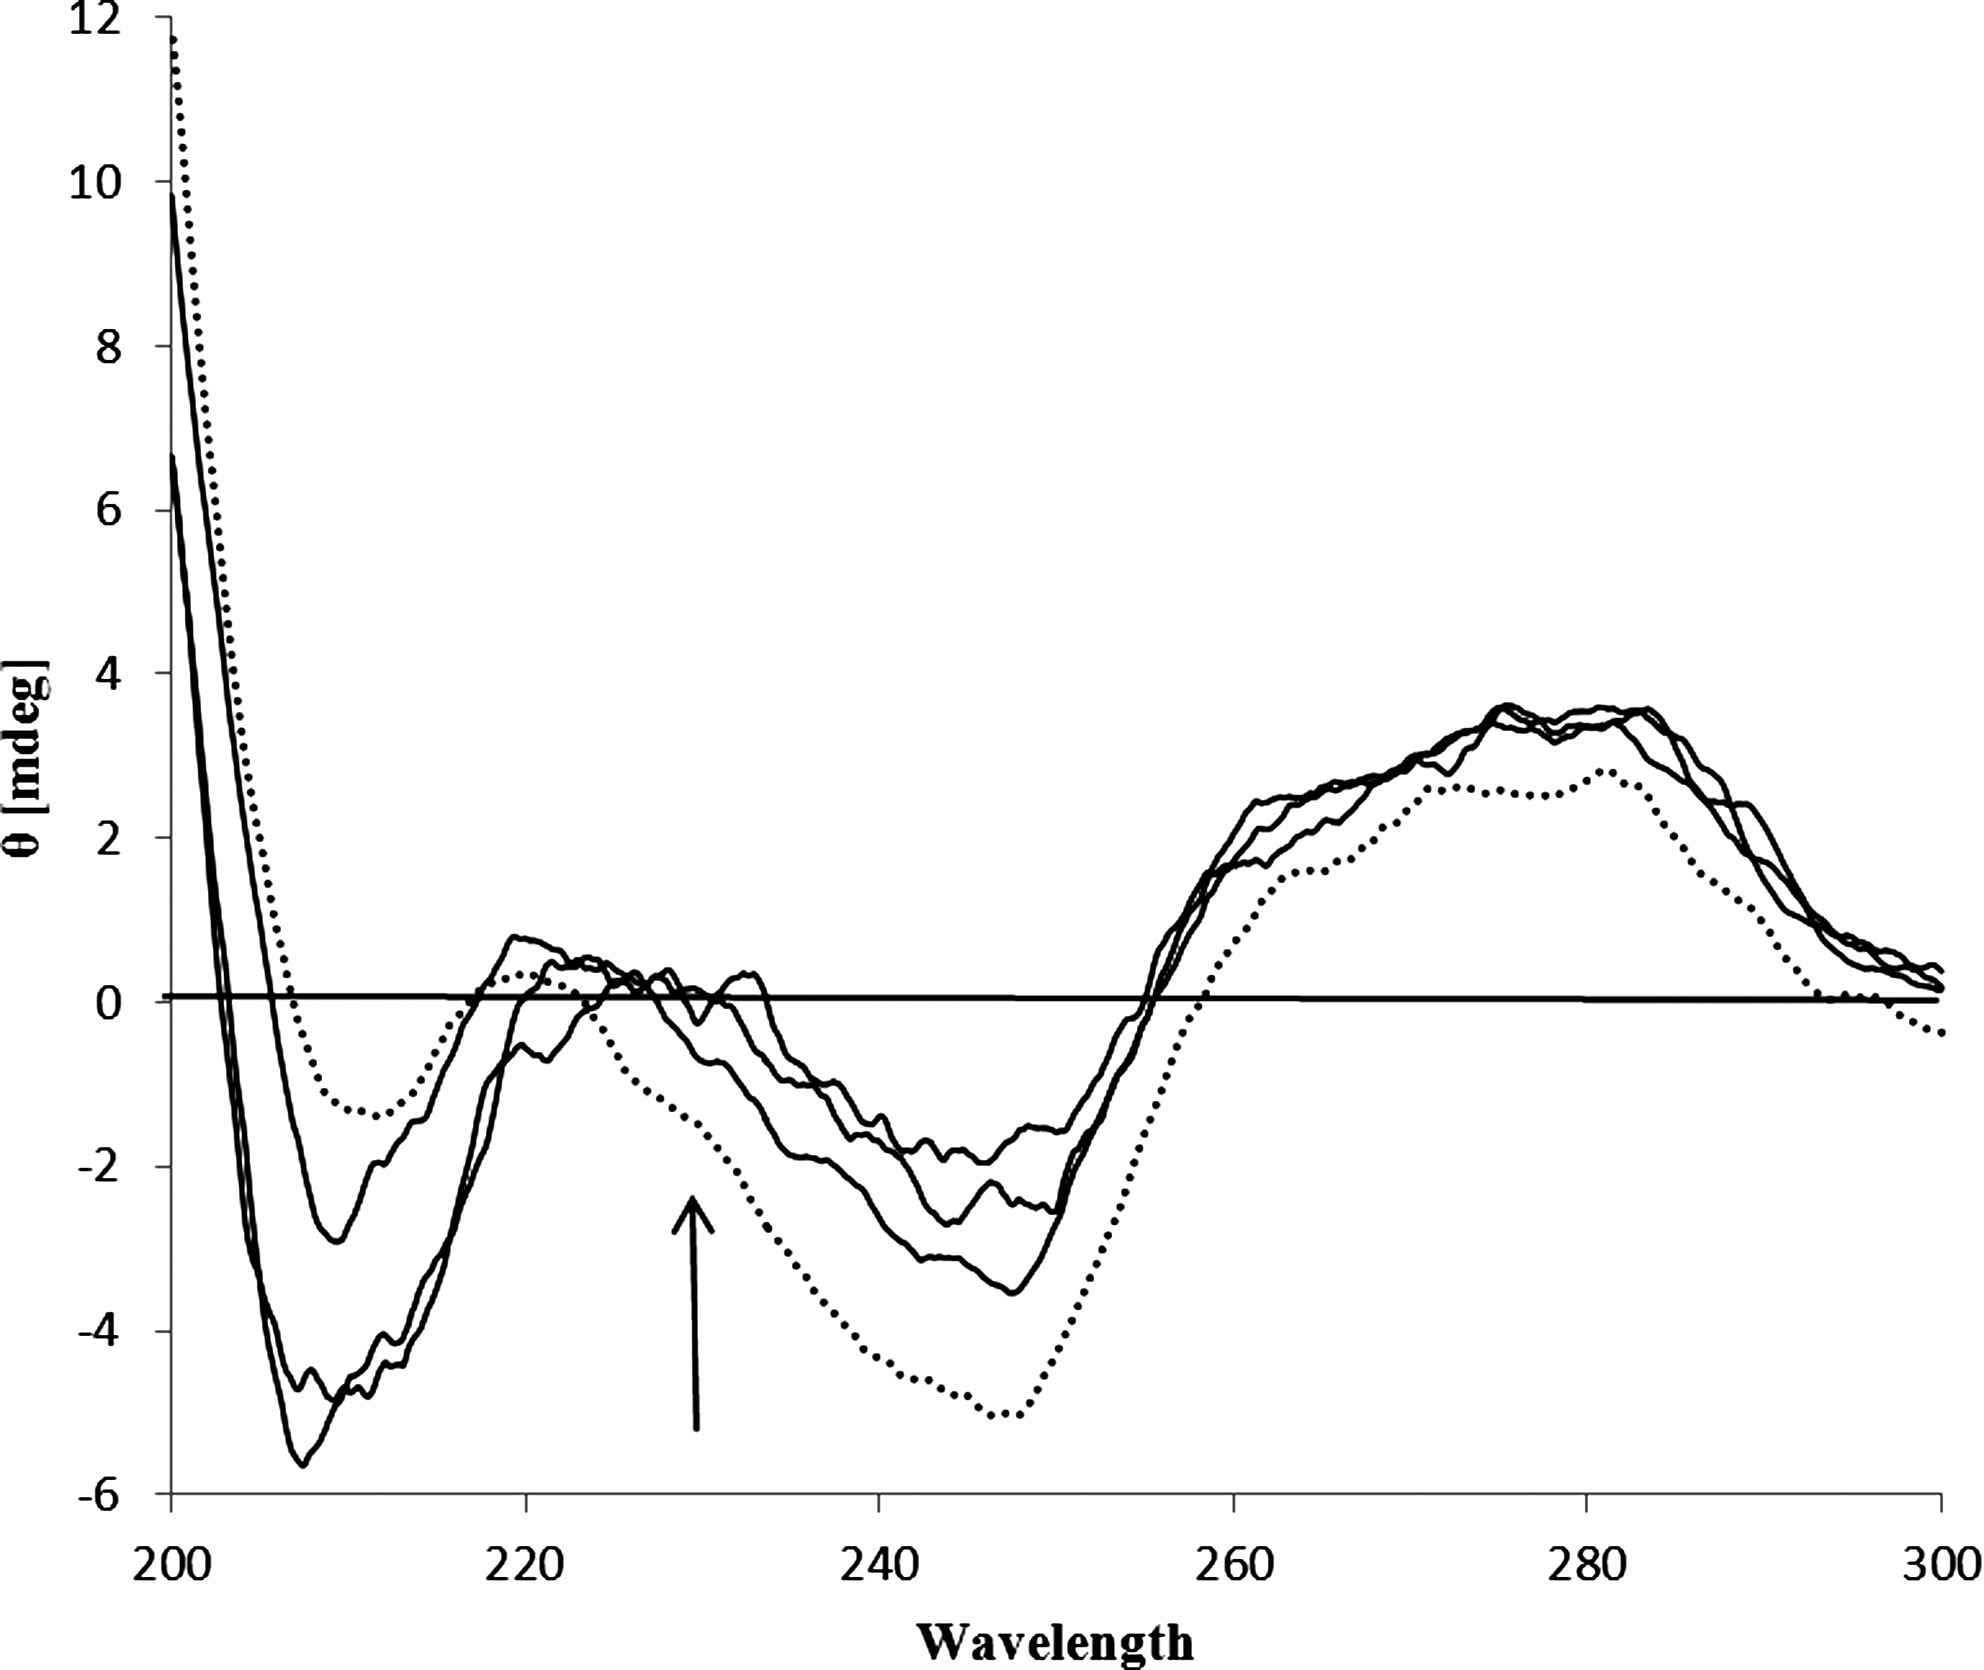
The circular dichroism spectrum of CT DNA (5.0×10⁻⁵ M) in absence (dot line) and presence of 1.5×10⁻⁵, 2.1×10⁻⁵, and 5.0×10⁻⁵ M of DM.
Conclusion
The electrochemical, thermal denaturation, and competitive fluorescence data revealed that DM interacted with DNA by the non-intercalation mode. The binding constant measured with cyclic voltammetry was 2.6×10⁴. The present AFM images provided further insights into the mechanism of interaction of DM with DNA.
Footnotes
Acknowledgments
We gratefully acknowledge Vice Chancellor for Research and Technology, Kermanshah University of Medical Sciences for financial support. This work was performed in partial fulfillment of the requirements for a Pharm. D by Nasibeh Jamali in Faculty of Pharmacy, Kermanshah University of Medical Sciences, Kermansha, Iran.