
Abstract
NSUN2, also known as SAKI or MISU, is a methyltransferase which catalyses (cytosine-5-)-methylation of tRNA. The human NSUN2 gene is located on chromosome 5p15.31–33. We show that NSUN2 gene copy number is increased in oral and colorectal cancers. Protein expression levels of NSUN2 were determined by immunoblot using novel polyclonal antibodies raised against a synthetic peptide corresponding to the C-terminal region of the protein. In most normal tissues, NSUN2 expression levels were extremely low. On the other hand, oral and colorectal cancers typically expressed high levels of NSUN2. The level of NSUN2 was similar in interphase and mitotic cells, and immunohistochemical analysis demonstrated strong staining for NSUN2 in oral and colon cancer tissues when compared with normal tissues, providing a distinct diagnostic significance for NSUN2 in comparison with Ki-67, a widely used marker of actively proliferating cells. In addition, elevated protein expression of NSUN2 was confirmed by immunohistochemical analysis of various cancers including esophageal, stomach, liver, pancreas, uterine cervix, prostate, kidney, bladder, thyroid, and breast cancers. NSUN2 is regulated by Aurora-B, a newly developed molecular target for cancer therapy, leading us to propose that NSUN2 might become a valuable target for cancer therapy and a cancer diagnostic marker.
Introduction
Chromosome 5p gain is also commonly observed in colorectal cancer (De Angelis et al., 1999; Parada et al., 1999; He et al., 2003). In lung metastases, gain at 5p is frequently observed in comparison with their corresponding primary tumors in addition to deletions of other chromosome regions (Knosel et al., 2005). This gain also appears to be important for the establishment of liver metastasis (Diep et al., 2004; Kleivi et al., 2007). It has been suggested that several genes that map to chromosome 5p, including those encoding the prostaglandin E receptor 4 (PTGER4), S-phase kinase-associated protein 2 gene (SKP2), and zinc finger protein 622 (ZNF622) are possible candidates for gain-of-function at 5p in colorectal cancer cells, due to their upregulation (Kleivi et al., 2007).
NSUN2, also known as substrate of AIM-1 kinase (SAKI) (Sakita-Suto et al., 2007), contains the NOL1/NOP2/SUN domain and is classified as the second member of the protein family defined by this domain. NSUN2 is a tRNA (cytosine-5-)-methyltransferase, and is predominantly localized in the nucleoli (Sakita-Suto et al., 2007). During mitosis, NSUN2 is phosphorylated by Aurora-B protein kinase at Ser 139 (Sakita-Suto et al., 2007). This mitotic phosphorylation is accompanied by nucleolus disassembly and is critical for the repression of NSUN2 enzymatic activity (Sakita-Suto et al., 2007). NSUN2 is released from the nucleolus to the cytoplasm at the onset of mitosis and participates in the stabilization of the mitotic spindle (Hussain et al., 2009). In addition, NSUN2 has been identified as a transcriptional target of MYC oncoproteins under the alternative name, MISU (Frye and Watt, 2006).
Since NSUN2 is located at 5p15.31–32, within chromosome 5p, a region frequently gained in oral, colorectal, and other cancers, we sought to explore the possibility that the gene copy number of NSUN2 is increased in oral and colorectal cancers. Using Southern blot and genomic polymerase chain reaction (PCR) analysis we demonstrated frequently increased NSUN2 gene copy number in both oral and colorectal cancers, suggesting that NSUN2 may be at least partly responsible for gain-in-function effects of chromosome 5p. Using a C-terminal antibody specific for the full-length 767 amino acid residue protein, we demonstrate that NSUN2 is overexpressed not only in oral and colorectal cancer but also in other cancer tissues, and that it represents a possible useful novel biomarker for cancer diagnostics. The properties of NUSN2 that make it a potential molecular target for cancer therapeutics are also discussed.
Materials and Methods
Cell culture
In this study, six oral cancer cell lines (HSC-2, HSC-3, HSC-4, HO-1-u-1, HO-1-N-1, and Ca9-22), eight colorectal cancer cell lines (HT-29, LoVo, SW480, HCT 116, DLD-1, SW48, SW620, and SW837), a breast cancer cell line (MCF-7), a fibrosarcoma cell line (HT1080), and a cervical carcinoma cell line (HeLa) were used. The oral cancer cell lines were procured from the Japanese Cancer Research Resources Bank, and the American Type Culture Collection provided the rest of the cancer cell lines. Normal human oral keratinocytes (NHOKs) and normal human embryonic diploid fibroblasts (NHDFs) were also used. NHOK and NHDF were obtained from Kurabo Co. All cell lines with the exception of NHDF were cultured in Dulbecco's modified Eagle's minimum essential medium supplemented with 10% fetal bovine serum in a humidified 5% CO2 incubator at 37°C. NHOK was cultured as described by Dickson et al. (2000).
Patients and tissue samples
A total of 206 tumor samples encompassing 13 different tissues, including oral (n=37), colon (n=19), esophagus (n=21), stomach (n=10), liver (n=25), pancreas (n=20), uterine cervix (n=9), prostate (n=18), kidney (n=5), bladder (n=2), thyroid (n=10), breast (n=19), and skin (n=11) were examined. The samples were initially obtained from surgical resection, endoscopic resection, or biopsy between 2000 and 2004 at Tsuchiya General Hospital in Hiroshima. Tissue lysates from normal tissues including esophagus, stomach, duodenum, small intestine, colon, liver, kidney, lung, artery, trachea, tongue epithelium, tongue muscle, adrenal gland, thyroid gland, bladder, spleen, left ventricle, right ventricle, and testis were obtained from Hiroshima University Dental Hospital. The study protocol followed the ethical guidelines of Tsuchiya General Hospital, Hiroshima University Dental Hospital, and Prefectural University of Hiroshima. Informed consent was obtained from all subjects.
Southern blot
Genomic DNA was extracted and quantified as previously described (Tatsuka et al., 2005). The resultant genomic DNA was digested with HindIII, loaded onto agarose gels (10 μg per lane), and then transferred to a Nylon membrane (Bio-Rad). Southern blot hybridization was performed using a SAKI-ΔN3/KpnI-XhoI cDNA fragment of human NSUN2 cDNA (SAKI): DDBJ/EMBL/GenBank accession number AB255451) as indicated in Figure 1a. The full-length cDNA of human AURKB cDNA (aurora and IPL1-like midbody-associated protein kinase-1 (AIM-1): DDBJ/EMBL/GenBank accession number AB011450) was used as the control probe. The AURKB gene product, Aurora-B, which is essential for mitosis, is overexpressed in cancer cells, including oral and colorectal cancers (Tatsuka et al., 1998; Qi et al., 2007), although the gene copy number is not highly increased (Tatsuka et al., 1998; Smith et al., 2005). AURKB is located at the same band (17p13.1) as the TP53 tumor suppressor gene. Although loss of sequences on the short arm of chromosome 17 in the region of the TP53 gene is frequently observed, AURKB gene is present in two copies in many cancer cell lines. We therefore used AURKB as comparative control gene in this study. Quantification was performed using the lumino-imaging analyzer BAS-2000 (Fuji Film).
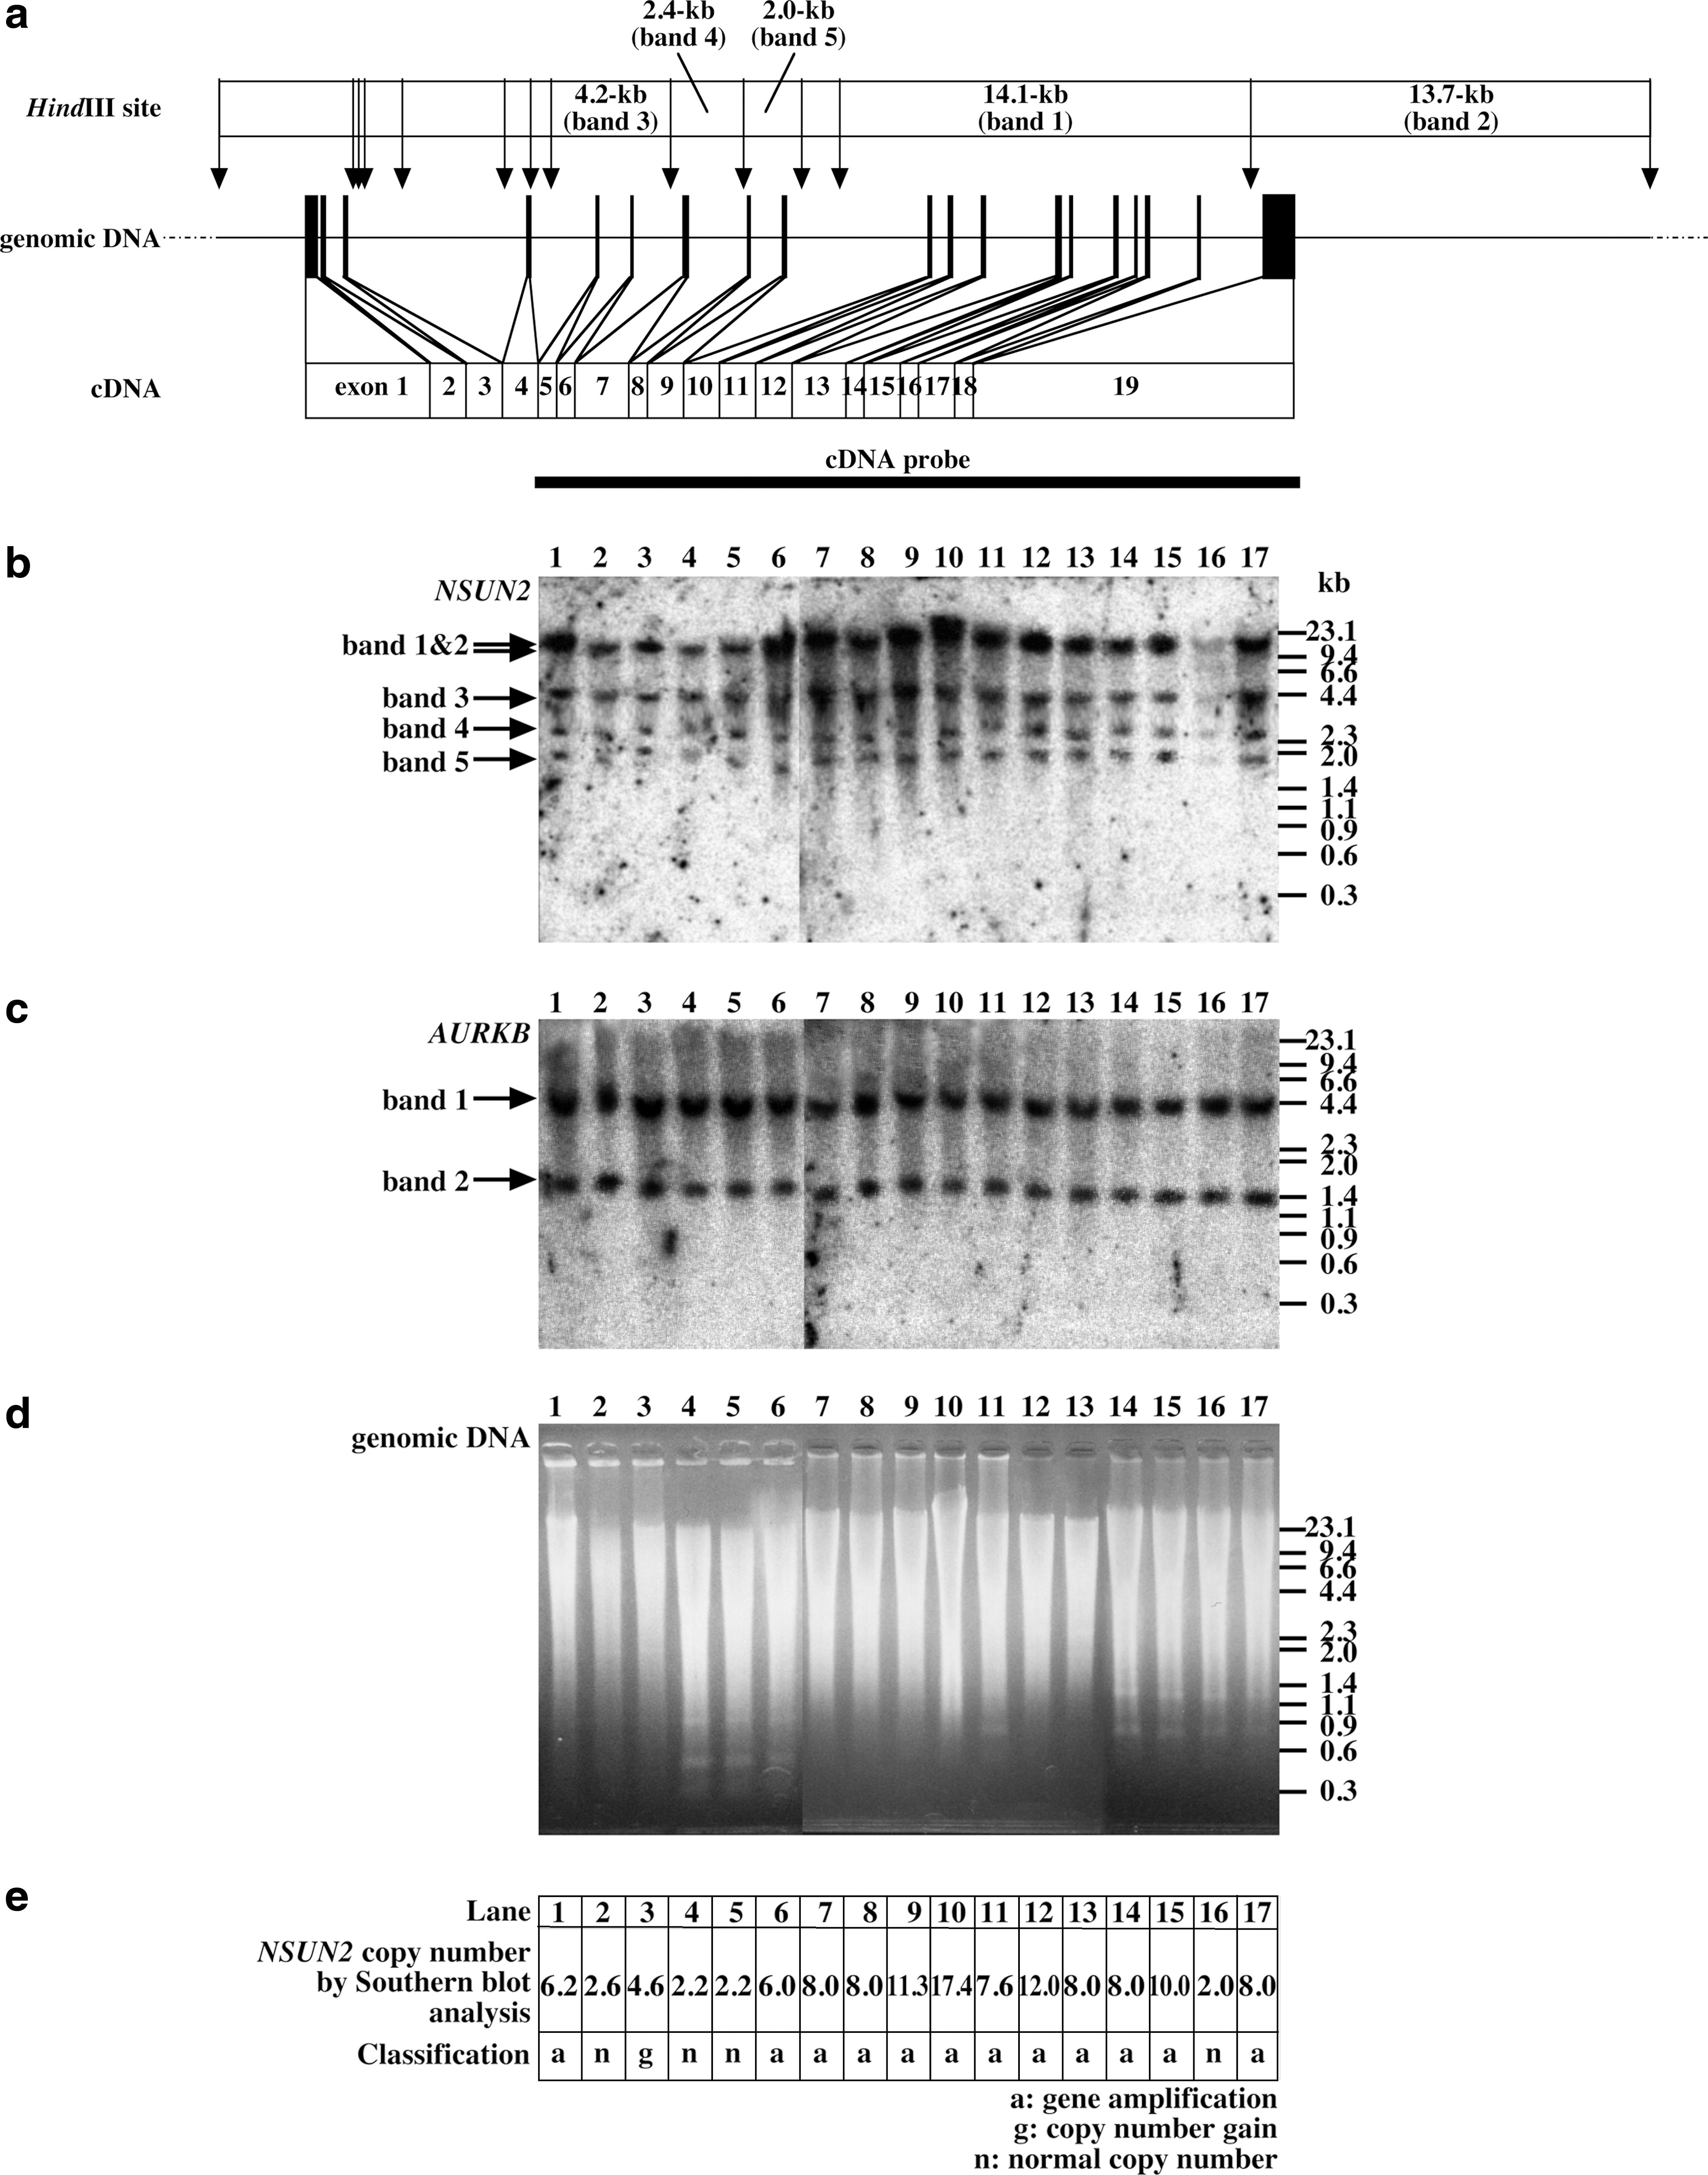
NSUN2 genomic organization and genomic Southern blot analysis.
NHDF cells have normal (2) copy numbers of the NSUN2 and AURKB genes, so the relative copy number of each gene for the examined cancer cells compared with the copy number for NHDF was calculated from the densitometrical data. Relative copy numbers were used to score the examined cancer cell lines as “gene amplification,” “copy number gain,” or “normal copy number” using the following formula: (estimated NSUN2 gene copy number on diploid background)=(relative copy number of NSUN2/relative copy number of AURKB)×2×(2/ploidy). The ploidy of each cell line was determined by karyotype (modal chromosome number). The accepted definition of gene amplification is five or more copies of a gene on a near-diploid background or disomic copy number of the chromosome of origin (in this case, chromosome 5; a ratio of 2.5, which distinguishes amplification from isochromosome formation or gene duplication followed by chromosomal missegregation), or ten copies on a near-tetraploid background or tetrasomic copy number of that particular chromosome. Here, therefore, an NSUN2 gene copy number of five or more was scored as “gene amplification”; three or four copies were scored as “copy number gain”; and two or three copies were scored as “normal copy number.”
Genomic PCR
For amplification of the 221-bp genomic fragment of NSUN2, a sense primer corresponding to the first exon (designated as Aw08-5′S: GTCGGCGGCTCCAGCAACAGCAGCGGCCGGAGGACGCGGAGGATG) and an antisense primer corresponding to the second intron and the second exon (designated as AS-SAKI-INT-1: TAGCCTCCTTCCCAGCCCTGAGGAAGGAAAGAGACGTCTACCCCG) were used. For amplification of the 180-bp genomic fragment of AURKB, a sense primer corresponding to the third exon (designated as AIM-1Genomic5′-S: GTCCTCATGAGCCGCTCCAATGTCCAGCCCACAG) and an antisense primer corresponding to the fourth exon (designated as AIM-1Genomic3′-AS: CTGCTATTCTCCATCACCTTCTGGCCAGGGGCAG) were used. PCR was carried out in 20 μL volume containing 10 ng of genomic DNA, 200 nM each primer (for both NSUN2 and AURKB, in independent reactions) and 1X Power SYBR Green PCR Master Mix (Applied Biosystems). Conditions for the PCR were as follows: one cycle of 95°C for 10 min, 40 cycles of 95°C for 15 s, 60°C for 1 min. Fluorescent signal was detected and recorded during the annealing/extension step (60°C) of each cycle. Each amplification reaction was checked for the absence of nonspecific PCR products by dissociation-curve analysis. PCRs for each primer set were performed in triplicate, and mean values were calculated. Quantification was based on the standard curve method. Normal human genomic DNA isolated from NHDF was run in every assay as a calibrator sample. The copy number of NSUN2 relative to the AURKB and the calibrator was determined using the formula (T NSUN2 /T AURKB )/(C NSUN2 /C AURKB ), where T NSUN2 and T AURKB were determined from sample DNA by using Aw08-5′S/AS-SAKI-INT-1 and AIM-1Genomic5′-S/AIM-1Genomic3′-AS, and C NSUN2 and C AURKB were determined from the calibrator sample by using Aw08-5′S/AS-SAKI-INT-1 and AIM-1Genomic5′-S/AIM-1Genomic3′-AS. Standard deviation of triplicate reactions were used to propagate error using the square root of the sum of squares method. The PCR product size was confirmed by gel analysis and DNA sequencing of the products was carried out to confirm product identities. The estimated NSUN2 gene copy number in a diploid background based on genomic PCR was also calculated using the formula shown above.
Fluorescence in situ hybridization
Metaphase chromosome spread slides were prepared by hypotonic (75 mM) potassium chloride solution treatment and Carnoy's fixation protocol. The chromosome spread slides were denatured in 2X SSC/70% formamide, pH 7, at 75°C for 5 min and dehydrated in graded ethanol. The hybridization was performed by using fluorescein-labeled NSUN2 probe (two different BAC clones; RP11-572D16 and RP11-114M17) with 4′,6-diamidino-2-phenylindole nuclear counterstain on metaphases from colorectal cancer cells and oral cancer cells. We also performed dual labeling hybridization by using fluorescein-labeled NSUN2 probe and Aquarius™ Painting Probe 5 (Cytocell Technologies) on metaphases from colorectal and oral cancer cells. As previously described (Ohta et al., 2001), a normal value study was done and the following criteria were applied for interpretation of the fluorescence in situ hybridization results. (A) NSUN2 gene amplification is more NSUN2 signals than Probe 5 signals in>17% of cells and NSUN2:Probe 5 ratio=or>4.0. (B) Relative increase in NSUN2 gene copy number (including NSUN2 gene amplification) is more NSUN2 signals than Probe 5 signals in>17% of cells and NSUN2:Probe 5 ratio=or>1.04. (C) Gain of chromosome 5 is=or>42% nuclei with three or more signals for Probe 5.
Immunoblot
Cultured cell samples or tissue samples were lysed with ice-cold Laemmli sodium dodecyl sulfate (SDS)-sample buffer (pH 6.8), consisting of 25 mM Tris-HCl, 5% glycerol, 2.5% 2-mercaptoethanol, and 1% SDS, containing protease inhibitor cocktail (Sigma). The resultant solution was sonicated three times for 10 s on ice and centrifuged at 15,000 rpm for 1 min at 4°C. The supernatant was collected and the protein concentration was determined using a Bio-Rad protein assay kit and equal amounts of protein (typically 20 μg per lane) were loaded on a 10% SDS-polyacrylamide gel. Cell lysates were resolved by electrophoresis and transferred to Immobilon-P membranes (Millipore). Membranes were probed with primary antibodies, washed, and incubated with secondary antibodies. Anti-NSUN2 rabbit antibodies, αNSUN2 and αNSUN2-full [raised against a synthetic polypeptide representing NSUN2 C-terminal region (GCDPAGVHPPR) and bacterially expressed full-length His-NSUN2 respectively (Sakita-Suto et al., 2007)], and an anti-α-tubulin monoclonal antibody (CLT9002, Cedarlane Laboratories) were used as primary antibodies. To check quality of affinity-purified αNSUN2, an immunizing peptide blocking experiment was performed. The neutralized αNSUN2 that was incubated with an excess of immunizing peptide was no longer available to bind to the epitope present in the protein on immunoblot or in the cell by immunostaining. Horseradish peroxidase-conjugated anti-rabbit or anti-mouse donkey antibodies (Amersham Biosciences) were used as secondary antibodies. Proteins were visualized on X-ray film using ECL Western Blotting Detection Reagent (Amersham Biosciences).
For mitotic inhibition of cultured cells, exponentially growing cells were treated with 200-ng/mL nocodazole for 18 h. For mitotic inhibition and release experiments, nocodazole-treated cells were washed twice with phosphate buffered saline without Ca2+ and Mg2+, and cultured in normal culture medium for 1 h. To verify mitotic inhibition and release, anticyclin B1 rabbit antibody (sc-752, Santa Cruz Biotechnology) was used for immunoblot. It is widely assumed that chromosome instability (CIN) cells have a defective or weakened spindle assembly checkpoint. CIN cells do in fact arrest in response to spindle damage induced by nocodazole although the response is rather weak compared with microsatellite instability (MIN) cells (Tighe et al., 2007; Gascoigne and Taylor, 2008). Here, we used six oral and seven colorectal cancer cell lines, six of which (HSC-2, HSC-3, Ca9-22, DLD-1, SW48, and HCT 116) display MIN and seven of which (HSC-4, HO-1-u-1, HO-1-N-1, SW837, SW480, LoVo, and HT-29) display CIN.
Quantitative determination of NSUN2 expression was done from triplicate independent immunoblot analysis. The data were analyzed by densitometry, and the relative NSUN2 levels were calculated by using the following formula: (relative NSUN2 level)=(densitometric value for NSUN2 band)/(densitometric value for α-tubulin band). The NSUN2 levels between exponentially growing cells and nocodazole-treated or its released cells were compared, and statistical analysis was performed by the Student's paired t-test.
Immunohistochemical analysis
Immunohistochemical staining was carried out with ENVISION+/HRP kit (DAKO Cytomation) using formalin-fixed, paraffin-embedded tissues. Briefly, deparaffinized sections were treated with 0.3% H2O2 in methanol to block the endogenous peroxidase activity. After antigen retrieval treatment using microwave and heating to higher than 95°C in 10 mM citrate buffer (pH 6.0), sections were incubated with nonserum protein block solution for 15 min at room temperature. Afterward, sections were treated with anti-NSUN2 rabbit antibody (diluted 1:500) overnight at 4°C. Peroxidase-conjugated polymer reagent was applied and the color was developed using 3,3′-diaminobenzidine. To determine the proliferative cell compartment on consecutive sections and to compare this with NSUN2 expression, we examined Ki-67 expression using mouse-monoclonal antibody (MIB-1, diluted 1:50, DAKO Cytomation). For semiquantitative evaluation of NSUN2 expression, we assigned a percentage of NSUN2 positive cells to one of the four following categories: –, at most no positive cells; +, 5%–20% of tumor cells showed weak immunoreactivity; ++, 20%–50% of tumor cells showed moderate immunoreactivity; +++, over 50% of tumor cells showed intense immunoreactivity. Cases with grade ++ and +++ were regarded as positive cases.
Statistical analysis
The Statcel software package was used for analysis. The χ 2 test and Fisher's test were used for comparison of data among groups. A p-value<0.05 was considered to indicate statistical significance.
Results
NSUN2 gene copy number in oral, colorectal, and other cancer cells
NSUN2 gene copy number was analyzed using Southern blot hybridization of HindIII-digested genomic DNA from six oral cancer cell lines (HSC-2, HSC-3, HSC-4, HO-1-u-1, HO-1-N-1, and Ca9-22), seven colorectal cancer cell lines (HT-29, LoVo, SW480, HCT 116, DLD-1, SW48, and SW620), a breast cancer cell line (MCF-7), and a fibrosarcoma cell line (HT1080). In previous experiments, we found that HeLa cells exhibited extremely high expression levels of NSUN2 in comparison with NHDF cells (Sakita-Suto et al., 2007). Accordingly, genomic DNAs from HeLa and NHDF cell lines were included in this study. Using a cDNA probe containing the coding regions of exons 5–19 of NSUN2, four genomic bands were observed as anticipated (Fig. 1a, b). To determine whether the gene copy number of NSUN2 was increased, filters were rehybridized with the full-length AURKB cDNA probe. A 4.1-kb band (indicated as band 1 in Fig. 1c, AURKB) for the AURKB gene and a 1.3-kb band (band 2) for the AURKB (LOC644233 located on 8q23.1) were observed. The hybridization signal intensities of the 4.1-kb band for AURKB did not vary among the cancer cell lines (Fig. 1c, lanes 1–15 and 17) and were similar to the intensities for the NHDF cell line. Moreover, the hybridization signal intensities of the 4.1-kb AURKB band were similar to the hybridization signal intensities of the 1.3-kb LOC644233 AURKB pseudogene band. These observations confirmed that AURKB was not amplified in various cancer cells (Tatsuka et al., 1998; Smith et al., 2005), and that the hybridization signal intensity of the 4.1-kb AURKB band was an appropriate normal copy number control. The appropriate DNA loading for each lane was confirmed by DNA gel staining with ethidium bromide (Fig. 1d). Our data indicated that the NSUN2 gene copy number was increased in three oral cancer cell lines (HSC-2, HSC-4, Ca-9–22) and all colorectal cell lines examined, in addition to the MCF-7, HT1080, and HeLa cell lines (Fig. 1e).
We performed genomic PCR analysis to verify the above observations in these cell lines. Quantitative PCR data indicated that NSUN2 was increased in four oral cancer cell lines (HSC-2, HSC-3, HSC-4, Ca-9–22) and all colorectal cell lines examined, in addition to the MCF-7, HT1080, and HeLa cell lines (Fig. 2a). The PCR products of NUSN2 and AURKB were checked by agarose gel electrophoresis and DNA sequence analysis (Fig. 2b). In addition, we confirmed the increased gene copy number of NUSN2 by fluorescence in situ hybridization (Fig. 3 and Table 1).
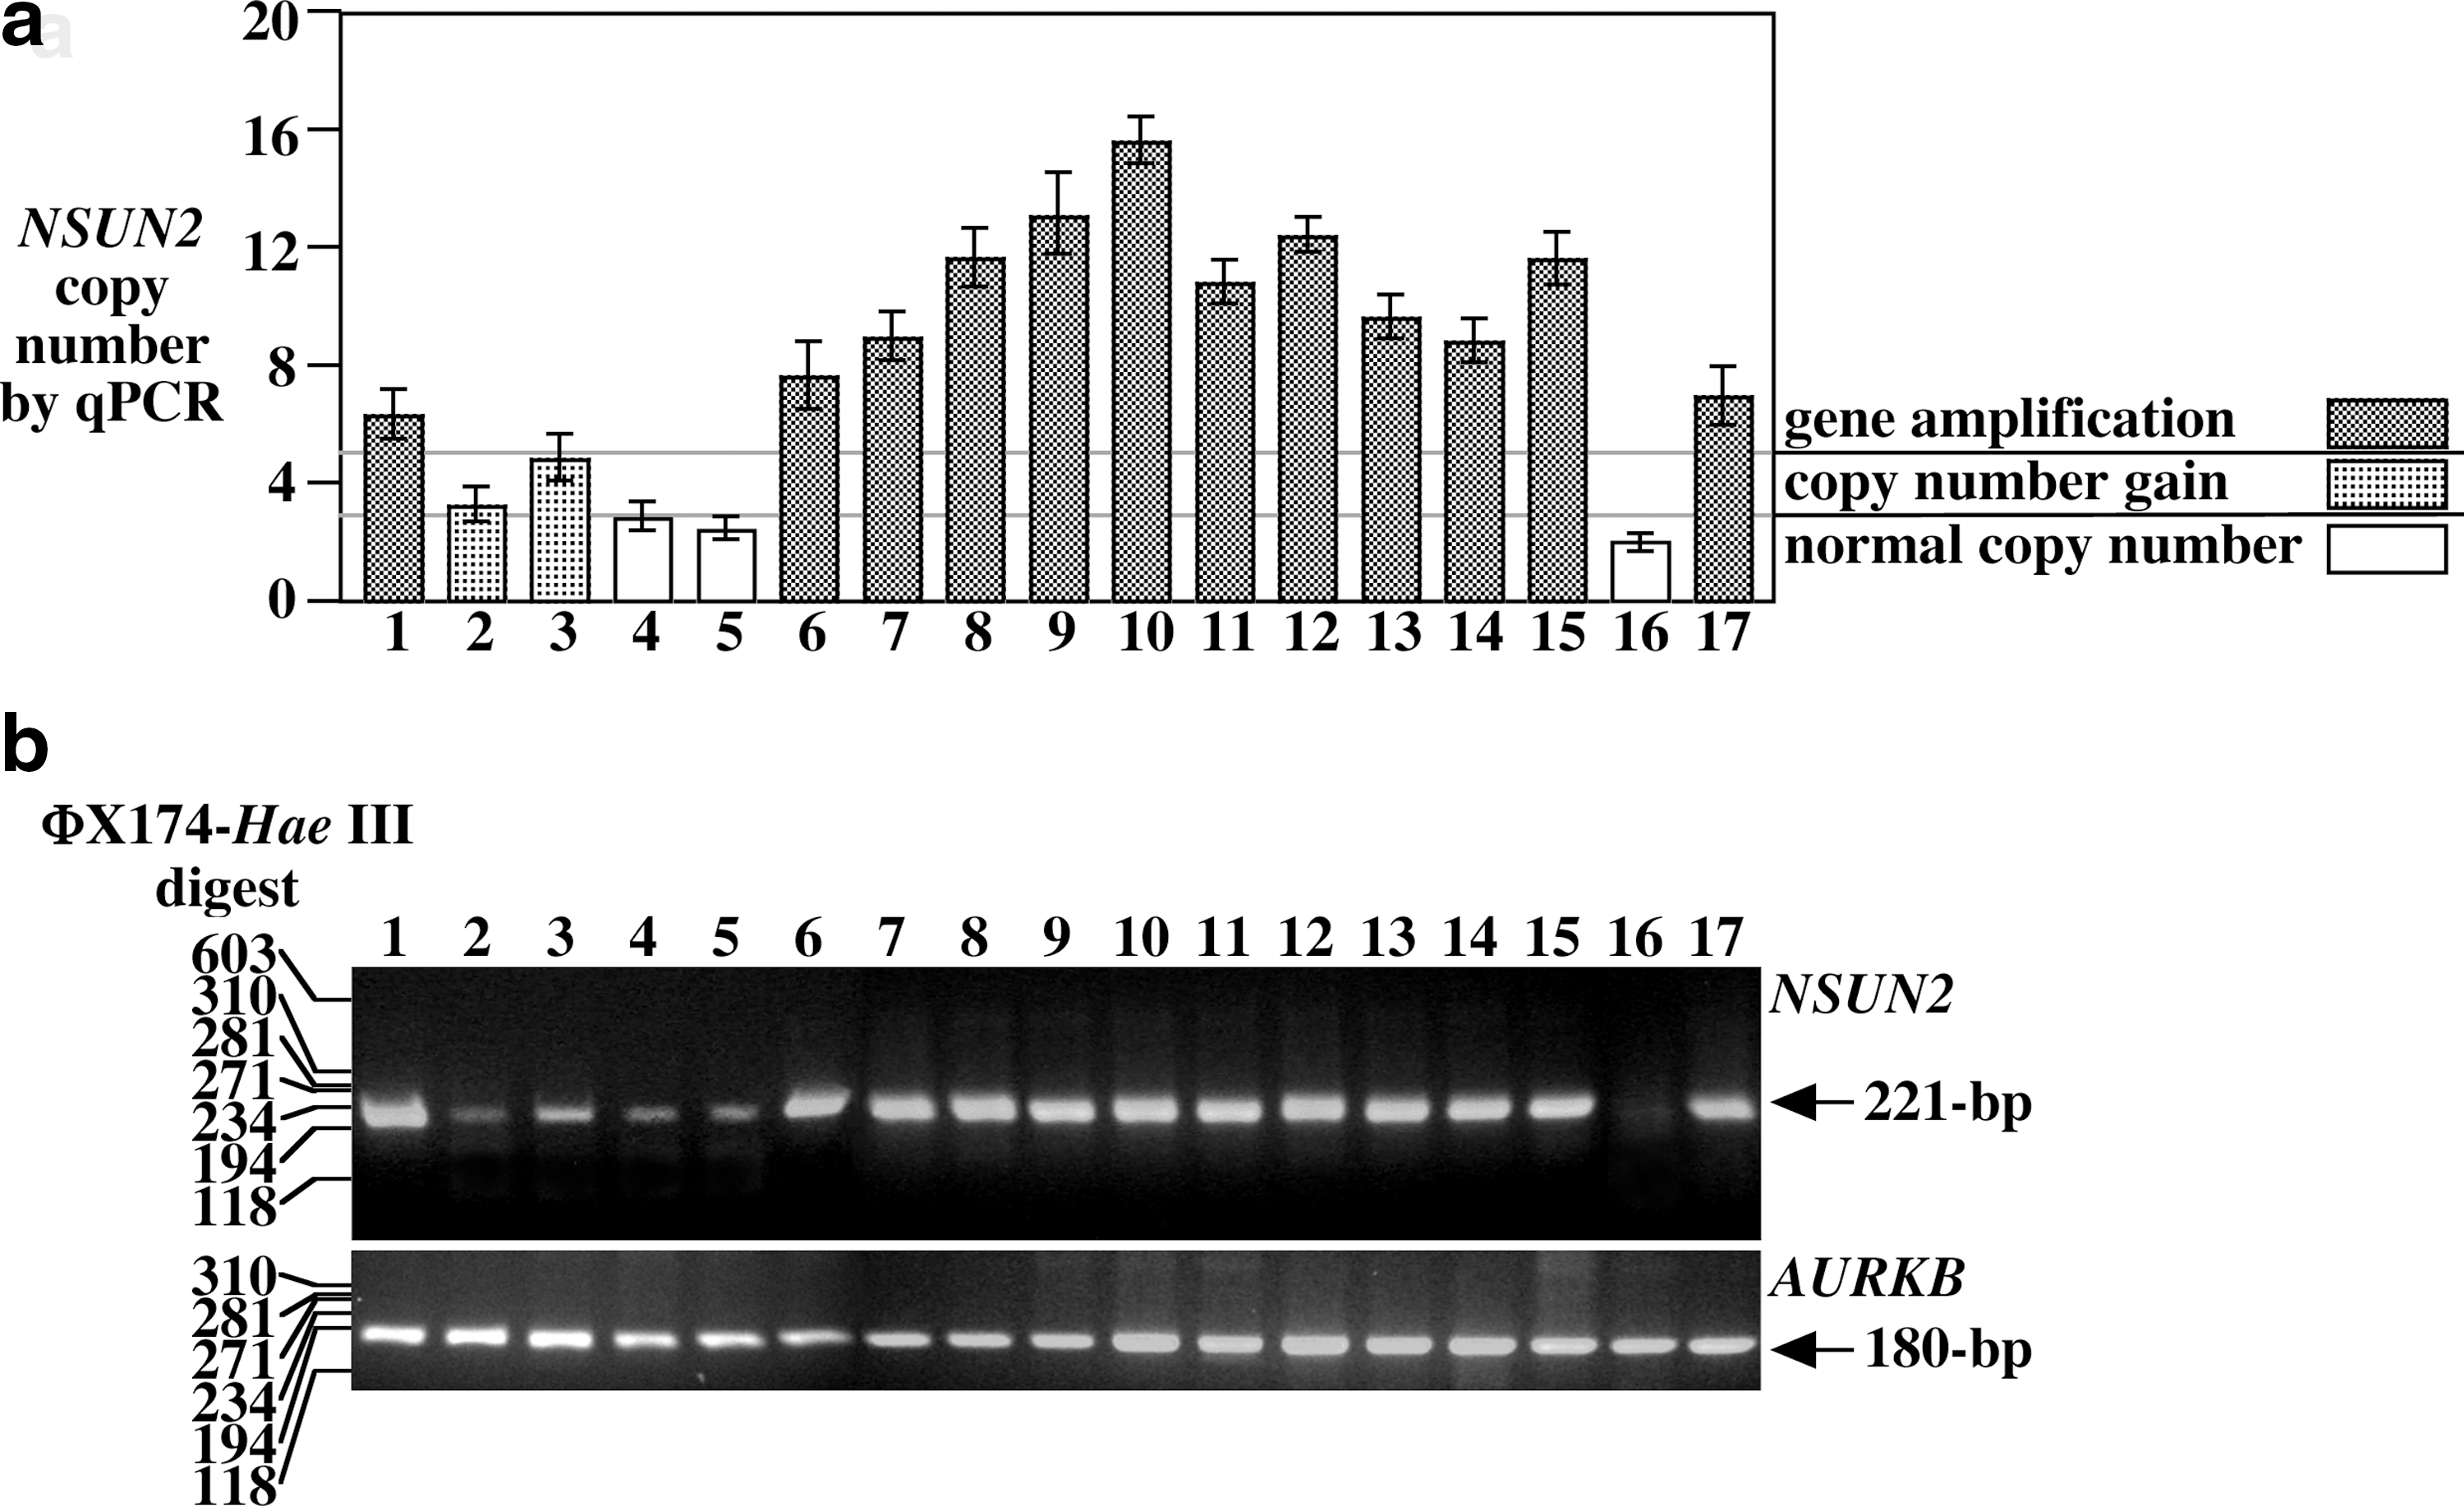
Quantitative genomic polymerase chain reaction (PCR) analysis of NSUN2 in various cell lines.
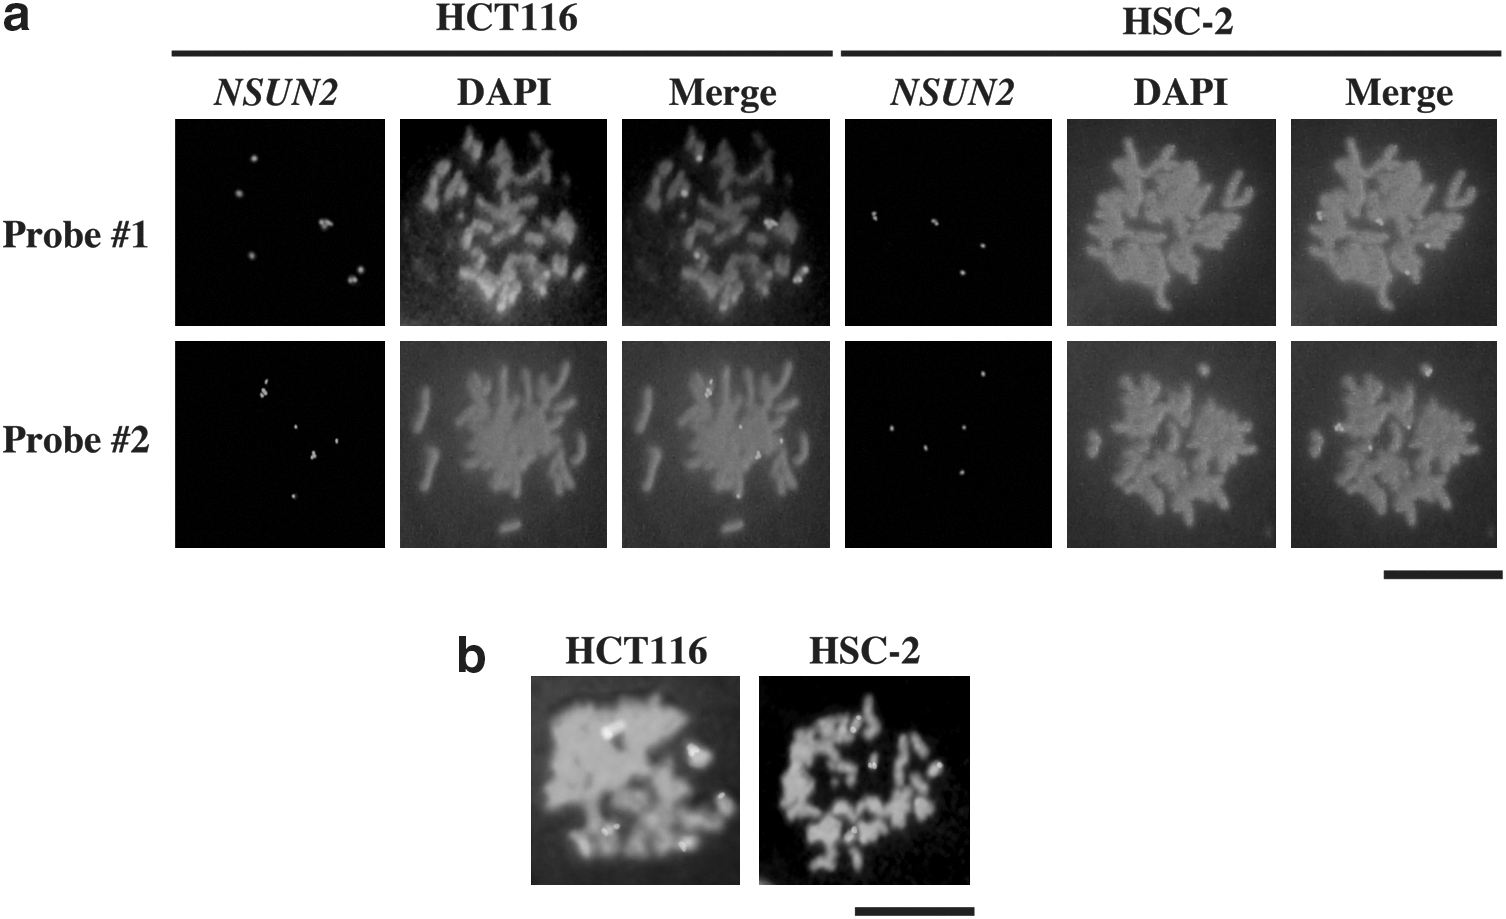
NSUN2 gene amplification demonstrated by fluorescence in situ hybridization (FISH).
Expression of NSUN2 proteins in normal human tissues
Using an affinity-purified αNSUN2 antibody, lysates from a panel of normal human tissues were immunoblotted. Unexpectedly, the 100-kDa band corresponding to full-length NSUN2 protein was not detectable in most cases (Fig. 4a). A very weak 100-kDa band was detectable in trachea and testis (Fig. 4a). Low levels of full-length NSUN2 expression in normal tissues were confirmed using another antibody, αNSUN2-full. To rule out the possibility that the NSUN2 signal in testis was due to signal leaking from the HeLa lane (Fig. 4a), cell lysates were reloaded and blotted. Again, with a short exposure time (Fig. 4b), we found that NUSN2 was expressed in testis at a very low level. In agreement with previous data (Sakita-Suto et al., 2007), NSUN2 was expressed in in vitro cultured normal human fibroblasts (NHDF) and highly expressed in HeLa cells, although NSUN2 expression was not observed in in vitro cultured NHOKs (NHOK; Fig. 4b).
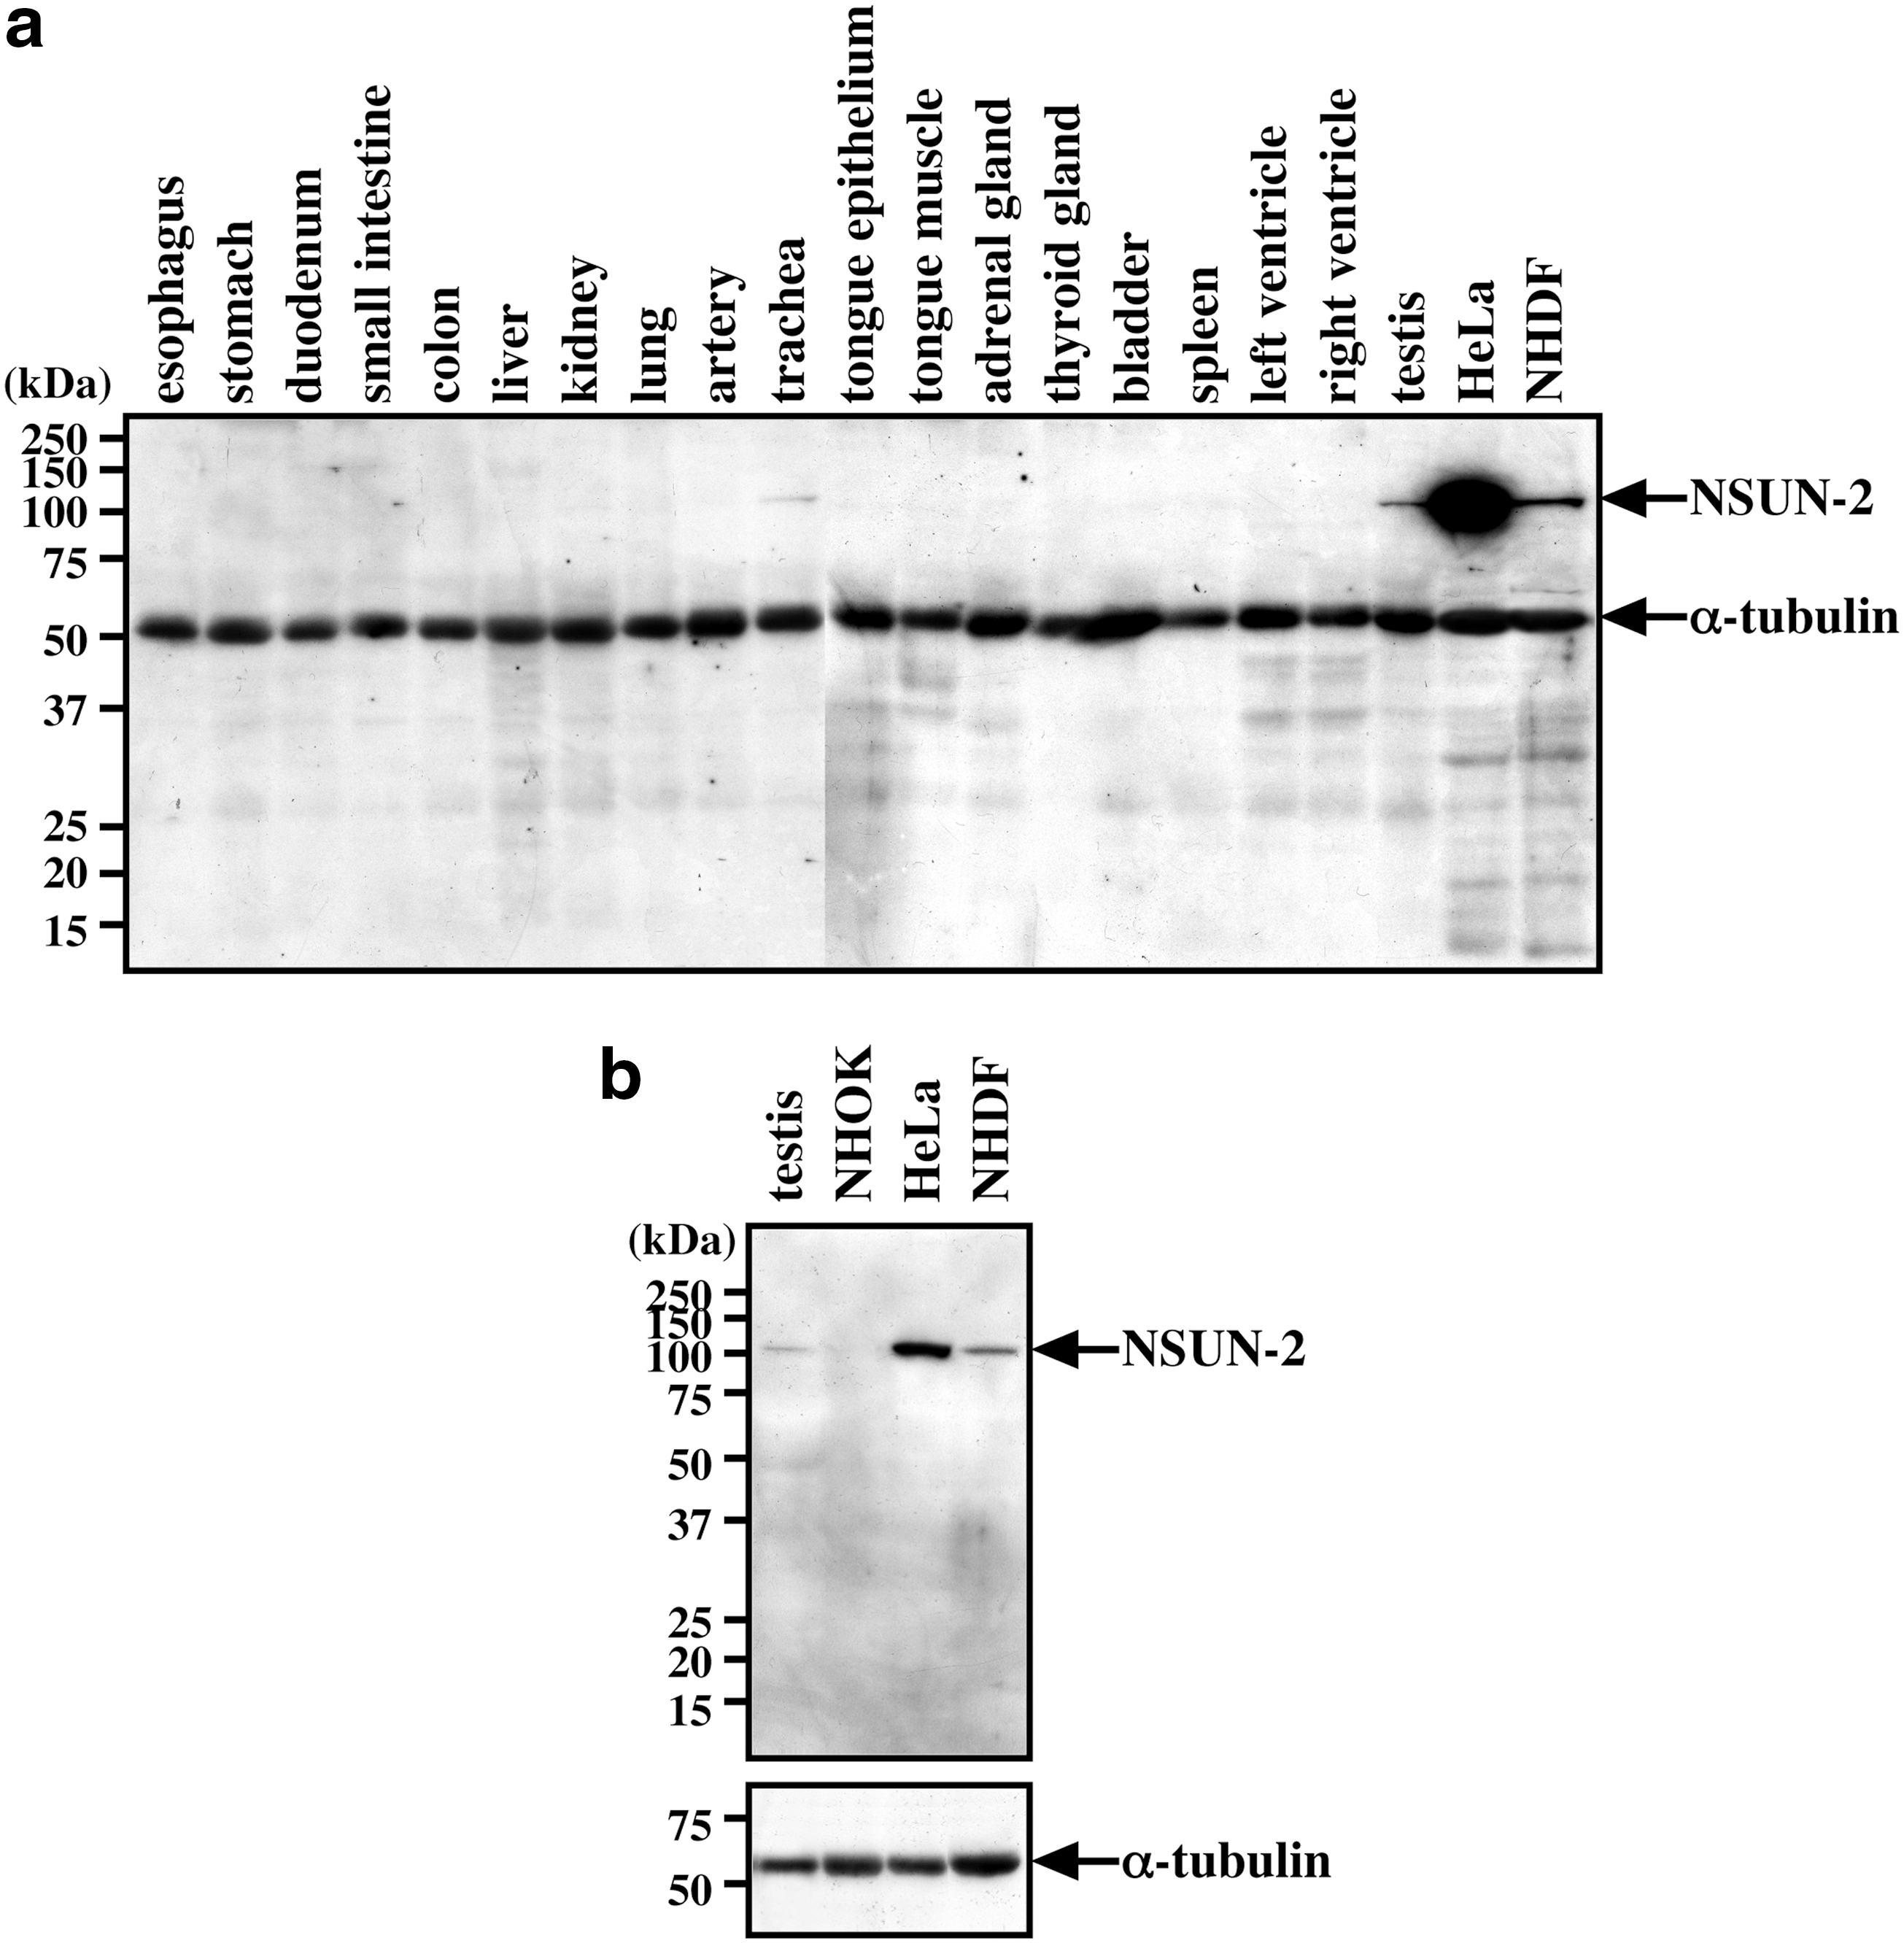
Immunoblot analysis of normal human various tissues.
Elevated expression level of NSUN2 in oral and colorectal cancer cells
Based on our combined Southern blot, genomic PCR, and immunoblot data, HeLa cells exhibited NSUN2 gene amplification and elevated expression levels of NSUN2. Consequently, we examined NSUN2 expression in other cancer cell lines with established NSUN2 amplification. In comparison with NHOK cells derived from normal adult oral keratinocytes, NSUN2 was expressed at extremely high levels in all oral cancer cell lines examined (Fig. 5a). As shown previously in HeLa cells (Sakita-Suto et al., 2007), NSUN2 expression levels were not altered during mitosis (Fig. 5a, lane N), in comparison with interphase (Fig. 5a, lane E). Similar results were obtained in colorectal cancer cell lines. NHDF cells derived from normal embryonic diploid fibroblasts expressed NSUN2 at a relatively low level (Fig. 5b, NHDF). The level of NSUN2 expression in NHDF cells (fibroblasts) was higher than in NHOK cells (keratinocytes; Fig. 4b). However, all colorectal cancer cell lines examined exhibited higher levels of NSUN2 than NHDF cells (Fig. 5b). In addition, NSUN2 protein levels between exponentially growing cells and nocodazole-treated or its released cells were compared. There were no statistically significant differences between these cultures in the expression levels of NSUN2 in colorectal cancer (including MIN cells such as HCT 116, DLD-1, and SW48 and CIN cells such as HT-29, LoVo, SW480, SW620, and SW837) and oral cancer cells (including MIN cells such as HSC-2, HSC-3, and Ca9-22 and CIN cells such as HSC-4, HO-1-u-1, and HO-1-N-1; Fig. 5a, b).
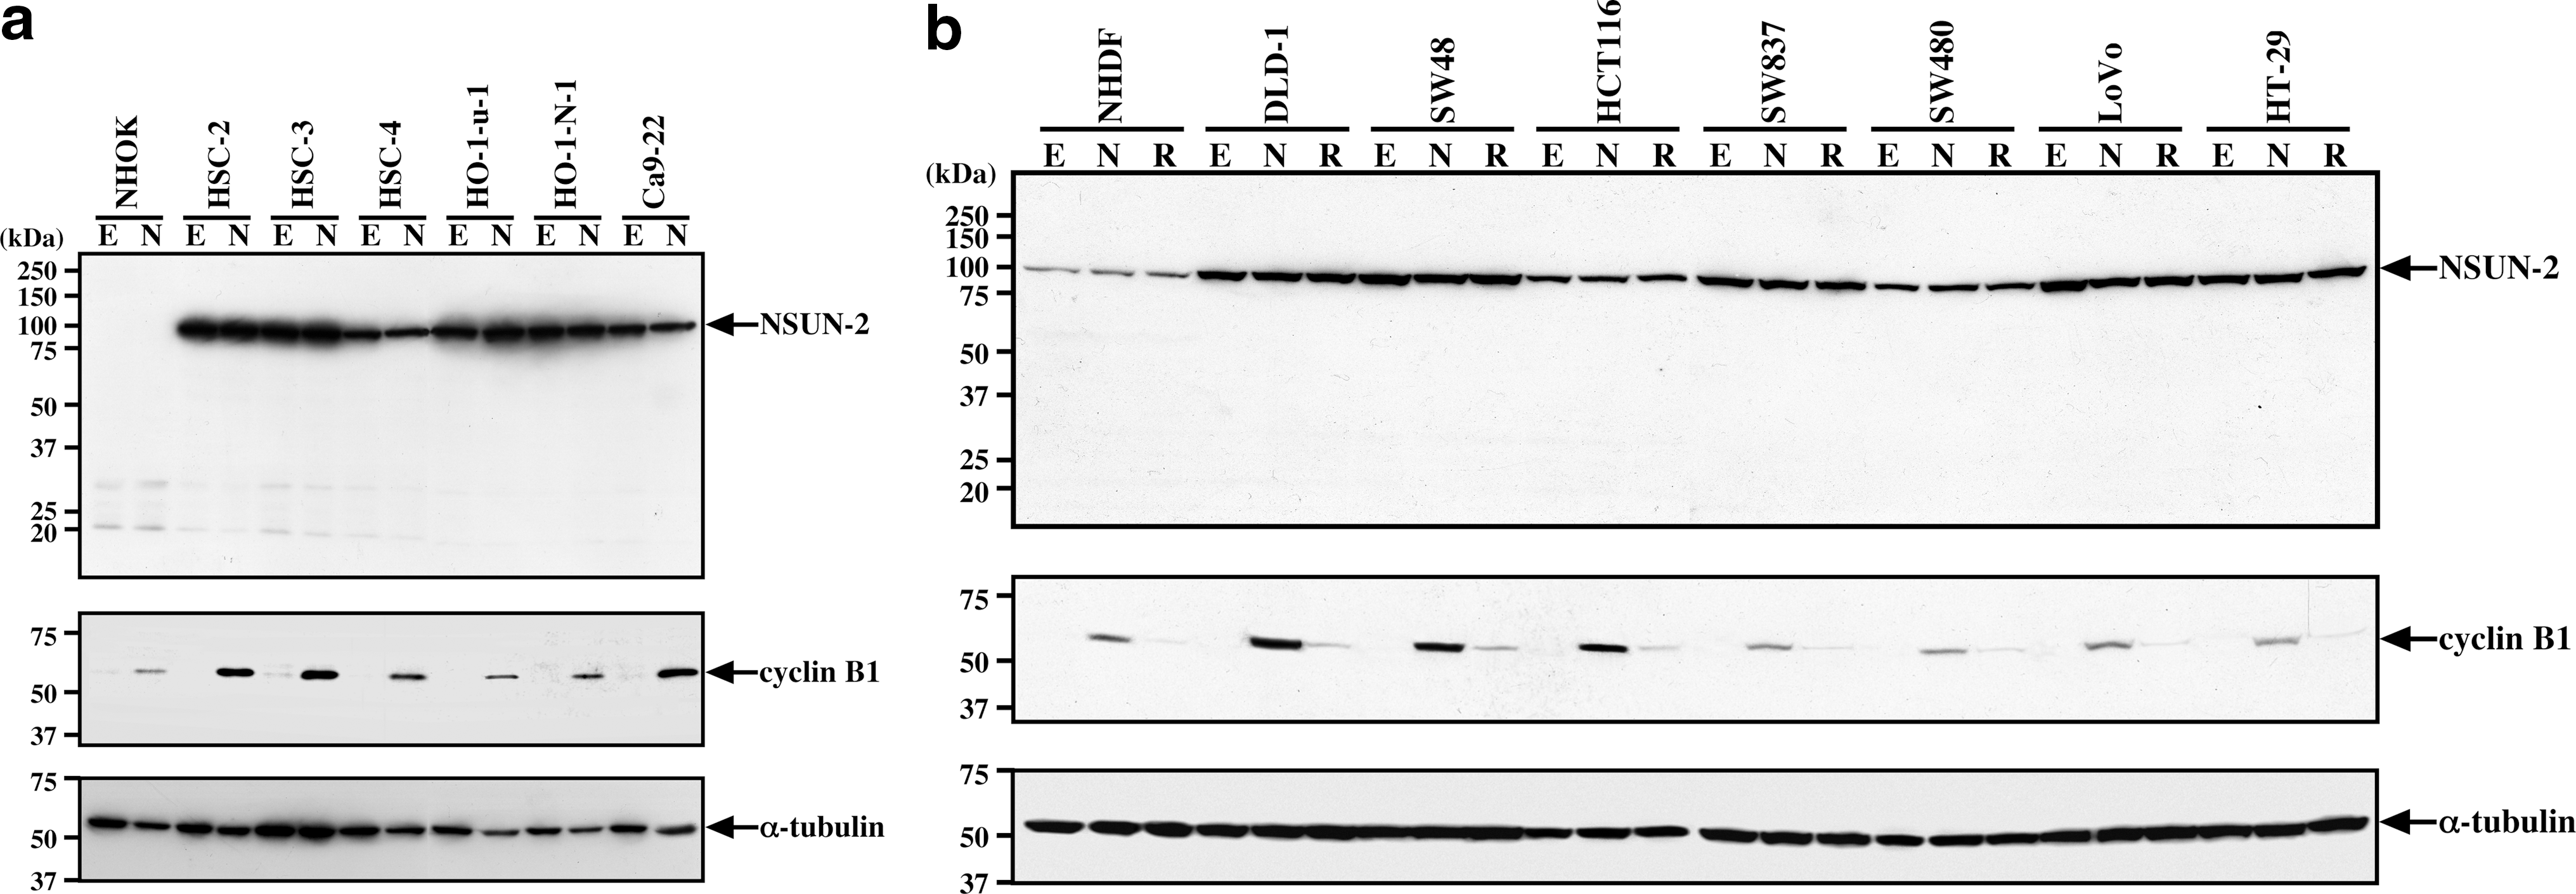
Immunoblot analysis of various cancer cell lines.
Immunohistochemical analysis of NSUN2 in oral and colon cancers
The elevated expression levels of NSUN2 in oral and colorectal cancer cell lines suggest its potential usefulness for cancer diagnosis by immunohistochemical analysis using αNSUN2. As a result, we immunohistochemically examined NSUN2 expression in formalin-fixed, paraffin-embedded oral and colon cancer tissues.
Negative or only weakly positive NSUN2 expression was observed in normal oral mucosal epithelium (Fig. 6a and Table 2, row oral). In contrast, in all cases of oral cancer we saw significant NSUN2 expression independent of the degree of histological differentiation (Fig. 6b, c). NSUN2 is a nucleolar protein (Sakita-Suto et al., 2007), and we confirmed nucleolar NSUN2 staining under higher magnification (Fig. 6d). NSUN2 expression was also positive in some cases of dysplastic or hyperplastic epithelial cells adjacent to cancer tissue, but stromal cells were completely negative. Among 27 oral cancer cases, highly positive NSUN2 staining was observed (Table 2, row oral).
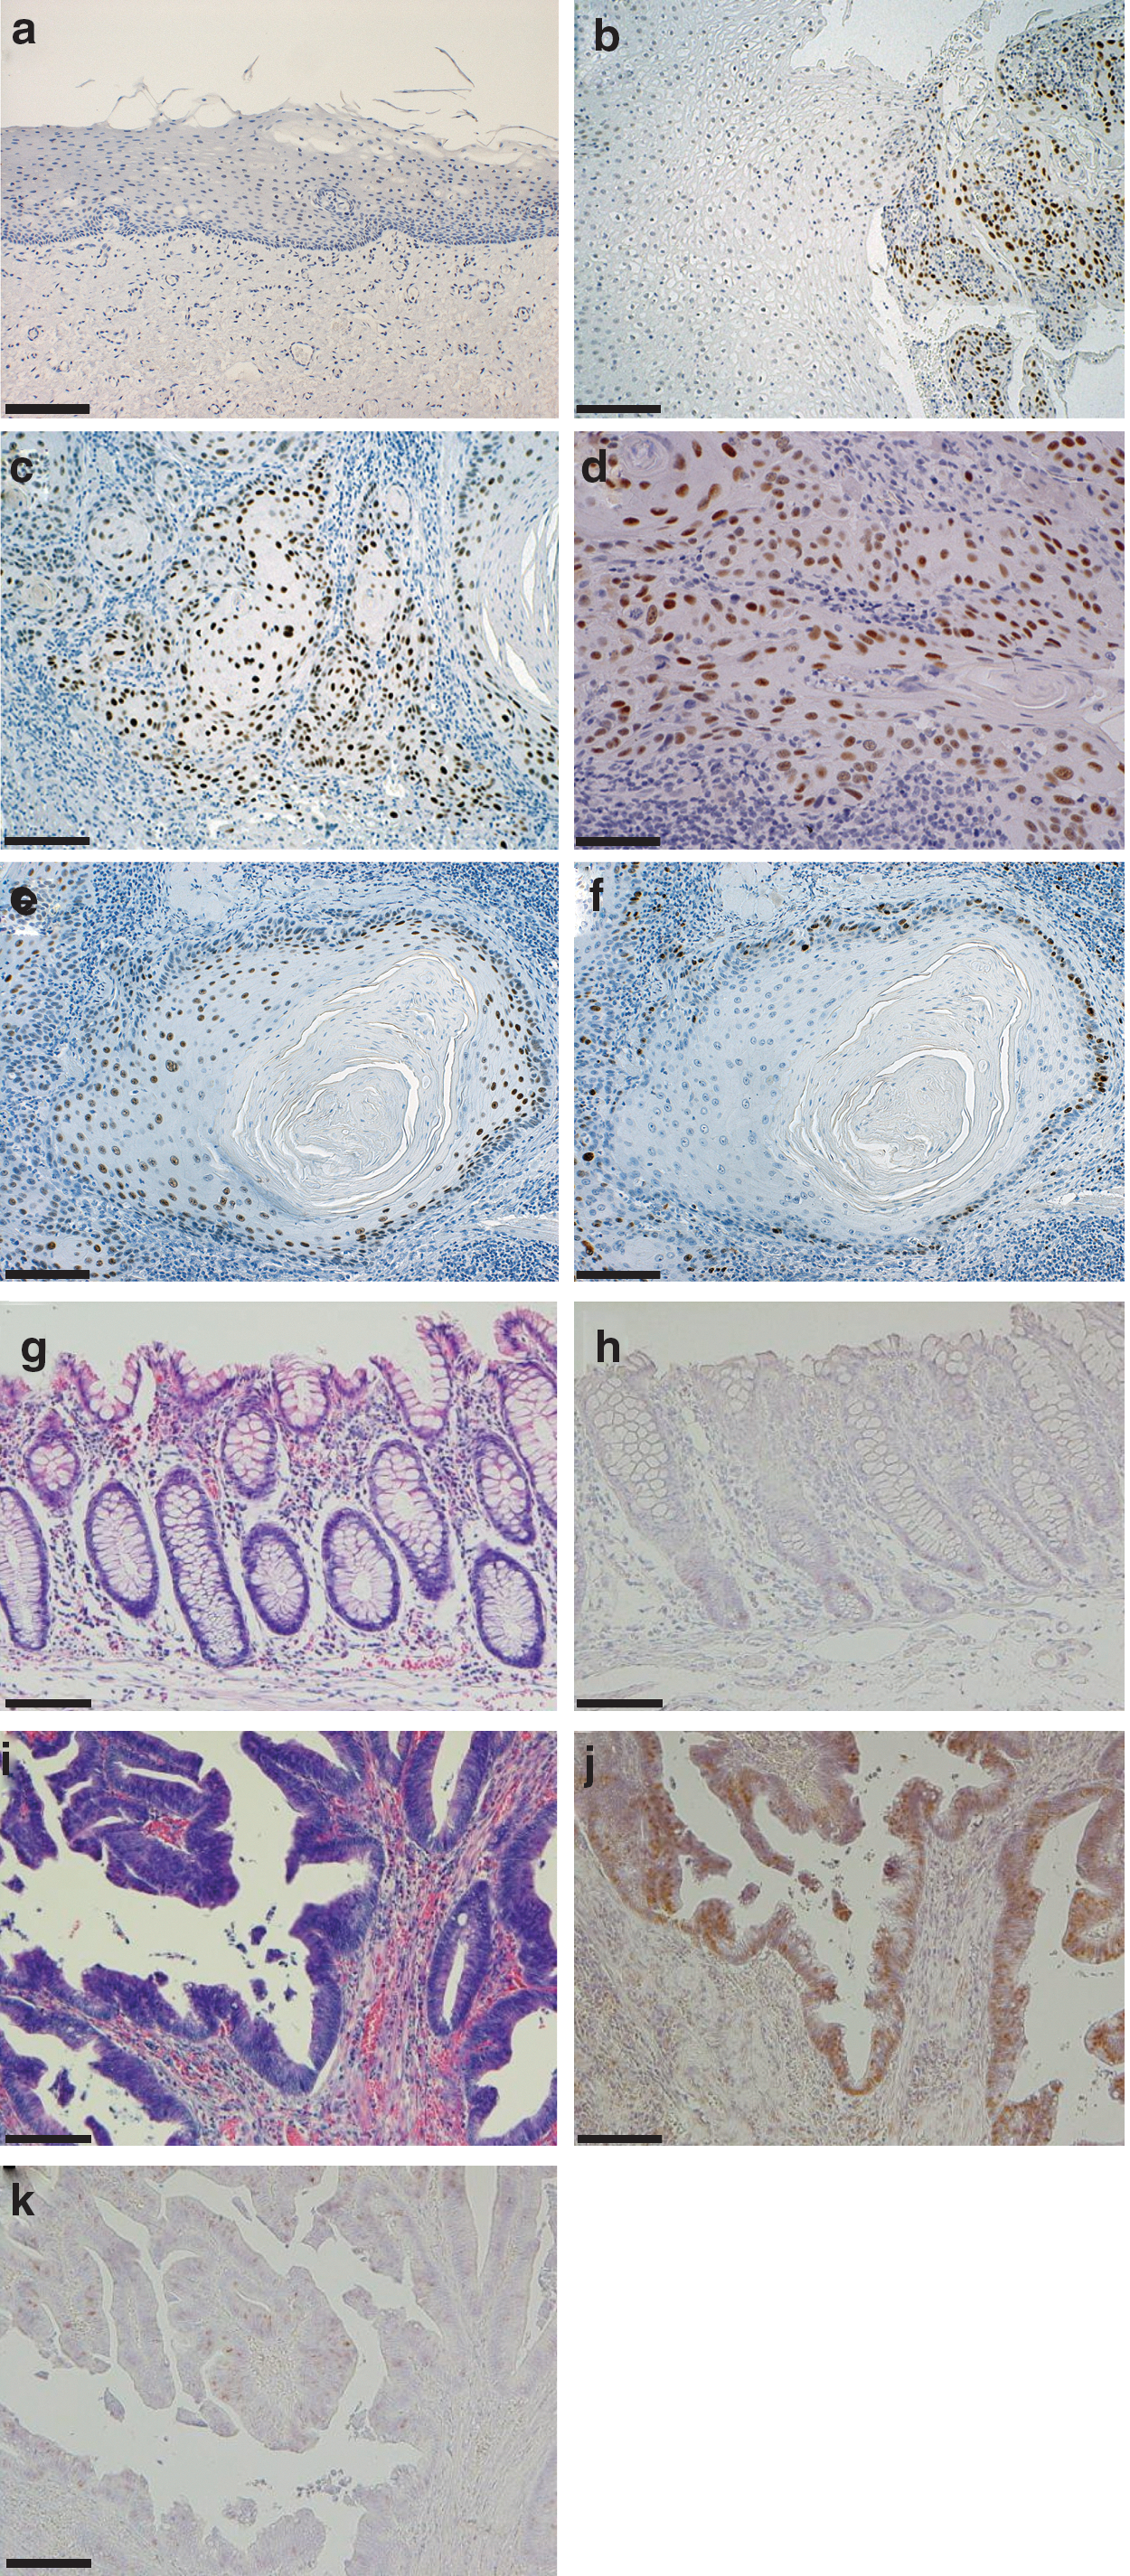
Immunohistochemistry for NSUN2 in normal tissue and cancer tissue.
SCC, squamous cell carcinoma; TCC, transitional cell carcinoma.
NSUN2 expression is independent of cell cycle progression (Fig. 5). We next simultaneously examined the expression of Ki-67, a cell proliferative marker, and NSUN2, in oral cancer tissues. As shown in Figure 6e and f, Ki-67 expression was primarily detectable in the peripheral cells of tumor nests, whereas most tumor cells were positive for NSUN2, as evaluated in paired serial sections (Fig.6e, f). On the other hand, in non-neoplastic epithelia within oral cancer tissue sections, Ki-67 expression was occasionally observed, but staining for NSUN2 was negative.
Similarly, in oral cancer cases, negative or only weakly positive NSUN2 staining was observed in normal colon epithelium (Fig. 6g, h). In contrast, in colon cancer tissues, a strongly positive signal for NSUN2 expression was observed (Fig. 6i, j). Among 19 colon cancer cases, cancer tissues showed high positivity of NSUN2 staining independent of the degree of histological differentiation. When compared with Ki-67 staining (Fig. 6k), NSUN2 staining was found in a wide region of cancer tissue (Fig. 6j).
Immunohistochemical analysis of NSUN2 in other cancers
Immunohistochemical data obtained from oral and colon cancers indicated that NSUN2 expression was elevated in cancer cells. Accordingly, we examined other cancers including esophagus, stomach, liver, pancreas, uterine cervix, prostate, kidney, bladder, thyroid, breast, and skin cancers. The results are summarized in Table 2 and Supplementary Table S1 (Supplementary Data are available online at
Discussion
We have demonstrated that NSUN2 gene copy number is increased in oral and colorectal cancer cells. NSUN2 is located on chromosome 5p (specifically 5p15.31–32), a region in which copy number gain has been frequently found in oral, colorectal, and other cancers. Moreover, NSUN2 protein is consistently overexpressed in these cancer cells. Upregulation of NSUN2 was found in various cancer tissues by immunohistochemical analysis. Indeed, a recent report also shows NSUN2 gene copy number gain in breast cancer (Frye et al., 2010).
In normal tissues, apart from testis, NSUN2 protein expression is extremely low (Fig. 4). On the other hand, cancer cells express NSUN2 at high levels. The NSUN2 expression is likely to be related to cell growth. This idea is supported by the report that NSUN2 is a direct transcriptional target of the MYC oncoprotein (Frye and Watt, 2006). It has been previously reported that NSUN2 is most highly expressed in the S phase of SZ95 sebaceous gland cells (Frye and Watt, 2006). However, in our experiments, we observed that NSUN2 protein expression was constantly expressed in interphase and mitosis in HeLa cells after double-thymidine block synchronization and normal NHDF cells after serum starvation (Sakita-Suto et al., 2007). Moreover, NSUN2 expression is elevated in fibroblast-derived NHDF cells compared with keratinocyte-derived NHOK cells (Fig. 4b). Even in synchronized cultured HeLa cells, NSUN2 expression was unaltered throughout the cell cycle. Also, as previously demonstrated by us, NSUN2 protein level did not change during the growing, quiescent or G0 states (Sakita-Suto et al., 2007). Therefore we focused our attention on mitosis and NSUN2 expression, and nocodazole was used as a cell cycle inhibitor. Consistently, in this paper, as shown in Figure 5, all oral and colorectal cancer cells examined showed a constant level of NSUN2 protein level during the mitotic cell cycle although MYC was overexpressed in all cancer cells used here. During mitosis, NSUN2 is phosphorylated by Aurora-B and its nucleolar localization is altered and spread within nucleoplasm (Sakita-Suto et al., 2007), but NSUN2 is not proteolysed in mitosis/G1 phase. The fact that NSUN2 expression is not influenced by cell cycle may serve as an advantage for detecting cancer cells within normal tissue. Indeed, immunohistochemical analysis showed that a positive signal for NSUN2 was not limited to actively growing cells within the cancer mass (Fig. 6). In contrast with the positive signal for the cell proliferative marker Ki-67, NSUN2 staining was found throughout cancer tissue. These data suggest that NSUN2 is cancer-related rather than growth-related although fuctional role of overexpressed NSUN2 remain to be elucidated. In various cancer tissues including oral, colon, esophageal, stomach, liver, pancreas, uterine cervix, prostate, kidney, bladder, thyroid, and breast cancers, NSUN2 positivity is significantly higher than the surrounding normal tissues (Table 2 and Supplementary Table S1). We confirmed the different NSUN2 staining pattern compared with Ki-67 in all cases, providing a distinct diagnostic significance for NSUN2 in comparison with Ki-67 (data not shown).
Using a rabbit polyclonal antibody, αNSUN2-full (Sakita-Suto et al., 2007), which was raised against the bacterially expressed full-length His-NSUN2, additional isoforms could be detected in HeLa cells and other cancer cells by immunoblot analysis. Frye and Watt (2006) showed that antibodies that recognized different NSUN2 epitopes could detect different isoforms. A total of eight known alternative splicing forms exist for the NSUN2 gene (
NSUN2 and its related NOP2/Sun domain family genes are widely conserved among eukaryotes and even among prokaryotes (Sakita-Suto et al., 2007). These genes encode tRNA/rRNA (cytosine-5-)-methyltransferases (Sakita-Suto et al., 2007). Saccharomyces cerevisiae NSUN2-like protein NCL1/Trm4, the yeast ortholog of human NSUN2, methylates tRNAs (Wu et al., 1998; Motorin and Grosjean, 1999), and is nonessential for yeast growth (Wu et al., 1998). From the results of gene-knockout experiments in yeast, however, Ncl1/Trm4 contributes to the stability of tRNA under exposure to stresses via tRNA (cytosine-5-)-methylation in cooperation with Trm8, tRNA (guanine-N7-)-methyltransferase (Alexandrov et al., 2006). Mature tRNAs lacking 5-methycytidine and 7-methylguanosine undergo a quality control check by a rapid tRNA decay pathway (Chernyakov et al., 2008). The components required for the tRNA degradation pathway are implicated in cell growth/survival controls under various conditions (Alexandrov et al., 2006; Chernyakov et al., 2008; Gustavsson and Ronne, 2008). Analogous to the situation in yeast, we speculate that NSUN2 contributes to stress resistance in tumor development, possibly linking to the antineoplastic drug resistance. The constitutive overexpression of NSUN2 in cancer cells suggests that this protein may also contribute to the “cancer state” in not only proliferating but also dormant cells.
NSUN2 is a nucleolar protein with tRNA (cytosine-5-)-methyltransferase activity. During mitosis, NSUN2 is phosphorylated by Aurora-B (Sakita-Suto et al., 2007). After disassembly of the nucleolus during mitosis, the phosphorylated form of NSUN2 is distributed to the cytoplasm. The enzymatic activity of NSUN2 is inhibited by this phosphorylation, and the phosphorylation form has no detectable tRNA (cytosine-5-)-methyltransferase activity (Sakita-Suto et al., 2007). Additionally, it has been proposed that cytoplasmic NSUN2 has a role in stabilizing the mitotic spindle by recruiting nucleolar and spindle-associated proteins (Hussain et al., 2009). NSUN2 overexpression may have a specific role in mitosis during cancer cell growth by impeding tRNA modification and stabilizing microtubules. Further experiments are required to elucidate the precise roles of NSUN2 overexpression in cancer cells, but NSUN2 might become an important novel target for cancer diagnosis and molecular therapeutics.
Footnotes
Acknowledgment
We thank Yuki Takeshita, Miyako Urayama, and Mami Ueda for their assistance and Takahide Ota for his encouragement.
Disclosure Statement
No competing financial interests exist.
References
Supplementary Material
Please find the following supplemental material available below.
For Open Access articles published under a Creative Commons License, all supplemental material carries the same license as the article it is associated with.
For non-Open Access articles published, all supplemental material carries a non-exclusive license, and permission requests for re-use of supplemental material or any part of supplemental material shall be sent directly to the copyright owner as specified in the copyright notice associated with the article.