




Abstract
Interaction of ribavirin with CT-DNA was investigated by emission, absorption, circular dichroism, and viscosity studies to determine the binding mode and binding constant of this drug with DNA. The calculated binding constant, Kb , obtained from UV-vis absorption studies was 4.6×10³ M −1. In fluorimetric studies, the enthalpy (ΔH<0) and entropy (ΔS>0) of the reaction between ribavirin and CT-DNA showed a hydrophobic interaction. In addition, in the circular dichroism spectrum, the drug induces a B→A structural transition of CT-DNA. These results demonstrate that ribavirin interacts with CT-DNA via the groove binding mode. It was observed that the drug has ability to cleave supercoiled plasmid DNA.
Introduction
Ribavirin (l-b-D-ribofuranosy-l,2,4-triazole-3-carboxamide) (Fig. 1), discovered over 30 years ago, is the first synthetic, broad-spectrum antiviral nucleoside (Sidwell et al., 1972) that exerts antiviral activity against a wide range of DNA and RNA viruses (Snell, 2001). It is currently used clinically as monotherapy to treat respiratory syncytial virus infection (Wyde, 1998; Krilov, 2001; Xu et al., 2004) as well as Lassa fever virus infection (Andrei and De Clercq, 1993; Shane and Raul, 2002; De Clercq, 2004) and in combination with interferon-a to treat hepatitis C virus (HCV) infection (Cummings et al., 2001; Di Bisceglie et al., 2001; Maag et al., 2001).
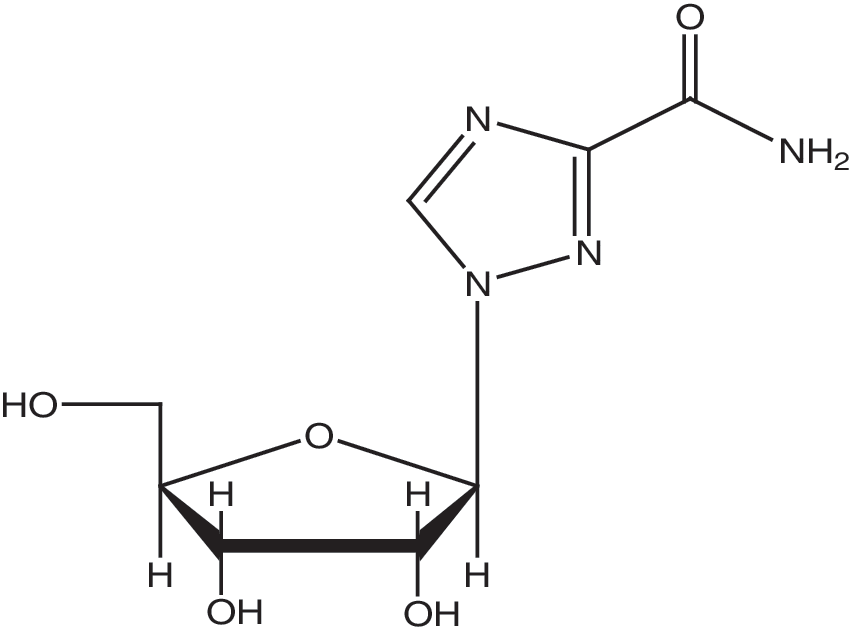
The structure of ribavirin.
Information obtained from this study will be helpful to the understanding of the mechanism of interaction of ribavirin with nucleic acid, and should be useful in the development of potential probes of DNA structure and conformation and new therapeutic regents for some diseases. Binding studies of this drug with calf thymus DNA (CT-DNA) were studied by electronic absorption spectroscopy, fluorescence spectroscopy, and circular dichroic spectral and viscosity measurements.
Materials and Methods
Materials
All chemicals including Hochest 33258 and calf thymus DNA (CT-DNA) were purchased from Sigma Co., Tris-HCl was purchased from Merck, and ribavirin was purchased from Archimica of Italy. Plasmid DNA (pUC18) was extracted from Escherichia coli.
Experiments were carried out in Tris-HCl buffer at pH 7.4. A solution of calf thymus DNA gave a ratio of UV absorbance at 260 and 280 nm more than 1.8, indicating that DNA was sufficiently free from protein.
The stock solution of CT-DNA was prepared by dissolving of DNA in 50 mM of the Tris-HCl buffer at pH 7.4. The DNA concentration (monomer units) of the stock solution (1×10⁻² M per nucleotide) was determined by UV spectrophotometer, in properly diluted samples, using the molar absorption coefficient 6600 M−1 cm−1 at 258 nm (Kennedy and Bryant, 1986).The stock solution was stored at 4°C and used over no more than 4 days.
Instrumentation
Absorbance spectra were recorded using a NORDANTEC T80 UV-vis double-beam spectrophotometer. The absorbance measurements were performed by keeping the concentration of the drug constant (5×10⁻⁵ M) while varying the DNA concentrations from 0 to 4×10⁻⁵ M (r i=[DNA]/[ribavirin]=0.0, 0.05, 0.15, 0.3, 0.4, 0.5, 0.7, and 0.8). Absorbance values were recorded after each successive addition of DNA solution, followed by an incubation period (2 h).
Viscosity measurements were made using a viscosimeter (SCHOT AVS 450) that was maintained at 25°C±0.5°C using a constant temperature bath. The DNA concentration was fixed at 5×10⁻⁵ M, and flow time was measured with a digital stopwatch. The mean values of three replicated measurements (after 2h incubation) were used to evaluate the viscosity, η, of the samples. The values for relative specific viscosity (η/ηo)1/3, where ηo and η are the specific viscosity contributions of DNA in the absence (ηo) and in the presence of ribavirin (η), were plotted against 1/R (R=[ribavirin]/[DNA]=0.0, 0.2, 0.4, 0.6, 0.8, and 1).
Fluorescence intensities were measured using a Cary luminescence spectrometer. In the competitive binding studies, concentrations of DNA and Hoechst 33258 were kept constant (5×10⁻⁵ and 5×10⁻⁵ M, respectively), while varying the ribavirin concentration from 0 to 11.1×10⁻⁵ M at three different temperatures (288, 298, and 310 K). The settings were: 380 nm as excitation wavelength and emission was observed between 400 and 600 nm.
CD measurements were recorded on a JASCO (J-810) spectropolarimeter by keeping the concentration of DNA constant (5×10⁻⁵ M) while varying the ribavirin concentration from 0 to 3×10⁻⁵ M (r i=[ribavirin]/[DNA]=0, 0.3, 0.5, and 0.6).
Cleavage activity
The DNA cleavage activity of the drug was studied by using agarose gel electrophoresis. Supercoiled plasmid pUC18 DNA (50 μmol) was dissolved in a 0.050 mol Tris-(hydroxymethyl) methane-HCl (Tris-HCl) buffer (pH 7.2) containing 0.050 mol NaCl and the different concentrations of ribavirin. The mixtures were incubated at 37°C for 24 h and then mixed with the loading buffer (2 μL) containing 25% bromophenol blue, 0.25% xylene cyanol, and 30% glycerol. Each sample (5 μL) was loaded into 0.8% w/v agarose gel. Electrophoresis was undertaken for 1 h at 50 V in Tris-acetate-EDTA (TAE) buffer. The gel was stained with ethidium bromide for 5 min after electrophoresis, and then photographed under UV light.
Results and Discussions
Electronic absorption spectral studies
The extent of hypochromism generally indicates the intercalative binding strength (Barton et al., 1993). The hypochromicity characteristic of intercalation is attributed to the interaction between the electronic states of the compound and those of the DNA bases (Wang et al., 2007), while the red shift is associated with the decrease in the energy gap between HOMO and LUMO molecular orbitals after binding of the compound to DNA (Arjmand and Aziz, 2009). Hyperchromism has been observed for the interaction of many drugs with DNA (Cox et al., 2009). The hyperchromic effect might be ascribed to external contact (electrostatic binding) (Pasternack et al., 1983) or to partial uncoiling of the helix structure of DNA, exposing more bases of the DNA (Pratviel et al., 1998).
Figure 2 shows the UV absorption spectra of ribavirin in the absence and presence of CT-DNA. Upon addition of CT-DNA, the absorption band at about 210 nm shows hyperchromism, and is accompanied by a small shift of 2 nm in λmax, from 210 to 212 nm, that is consistent with groove binding, leading to small perturbations. Since our drug does not contain any fused aromatic ring to facilitate intercalation, classical intercalative interaction is precluded. The hyperchromism of the absorption spectra of ribavirin, on addition of calf thymus DNA, implies that the binding mode is nonintercalative in nature. This hyperchromism can be attributed to external contact (surface binding) with duplex (Pasternack et al., 1983; Mahadevan and Palaniandavar, 1998; Kashanian et al., 2007). Since DNA possesses several hydrogen bonding sites in the minor as well as major grooves, and ribavirin contains NH group, there could be hydrogen bonding between the ribavirin and the base pairs in DNA (Carter et al., 1989; Liu et al., 1999; Liu et al., 2002; Zhang et al., 2004).
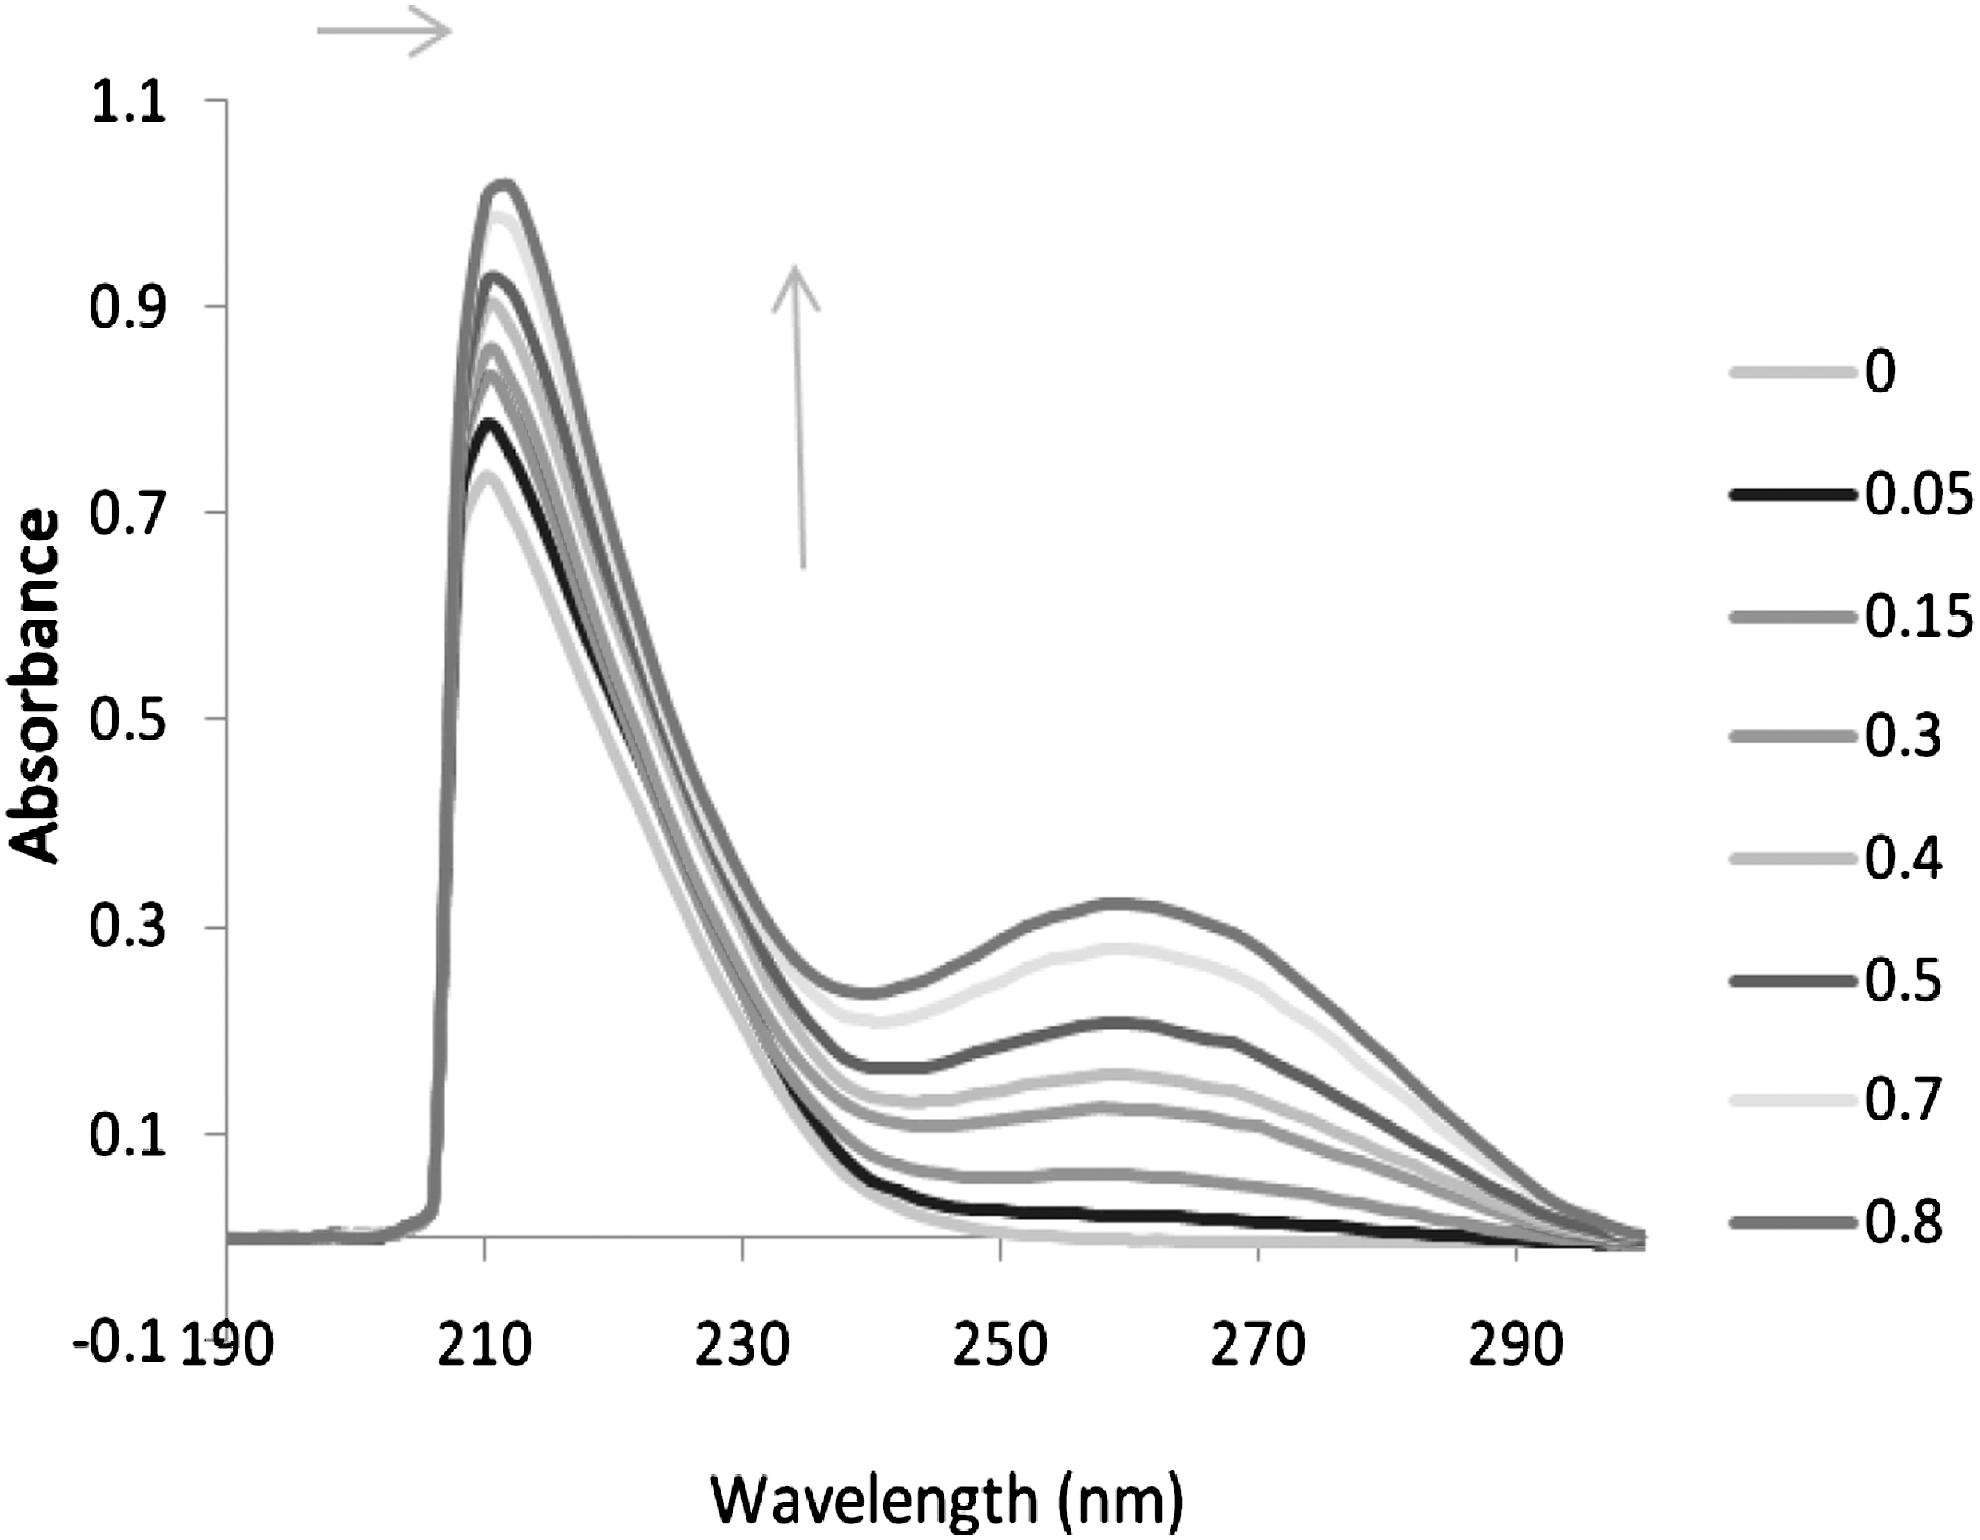
Absorption spectra of ribavirin (5×10⁻⁵ M) in the absence and presence of increasing amounts of CT-DNA: r i=0.0, 0.05, 0.15, 0.3, 0.4, 0.5, 0.7, and 0.8.
To determine the binding constant, absorbance values were recorded after each successive addition of DNA solution, followed by an equilibration period. The data were then fitted to Equation (1) to obtain intrinsic binding constant, Kb
(Nair et al., 1998):
where ɛa is the extinction coefficient observed for ribavirin absorption band at a given DNA concentration, ɛf is the extinction coefficient of the free ribavirin in solution, ɛb is the extinction coefficient of the ribavirin when fully bound to DNA (it is assumed when further addition of DNA does not change the absorbance, all ribavirin is bound and ɛb can be calculated from Beer's Law), Kb is the equilibrium binding constant, Ct is the total ribavirin concentration in nucleotide, and s is the binding site size. The plots of (ɛa−ɛf)/(ɛb−ɛf) versus [DNA] are shown in Figure 3. The calculated Kb value was 4.6±0.4×10³ M−1. The Kb value obtained is lower than that of classical intercalators, whose binding constants are on the order of 106–107 M−1 (Xu et al., 2008; Arjmand and Sayeed, 2010). By comparing the intrinsic binding constant (Kb ) of ribavirin with some known DNA groove binders (Arjmand and Sayeed, 2010; Sharma et al., 2005; Zhang et al., 2001; Wang et al., 2004; Shahabadi et al., 2010b), we deduced that this molecule binds to CT-DNA via groove binding mode.
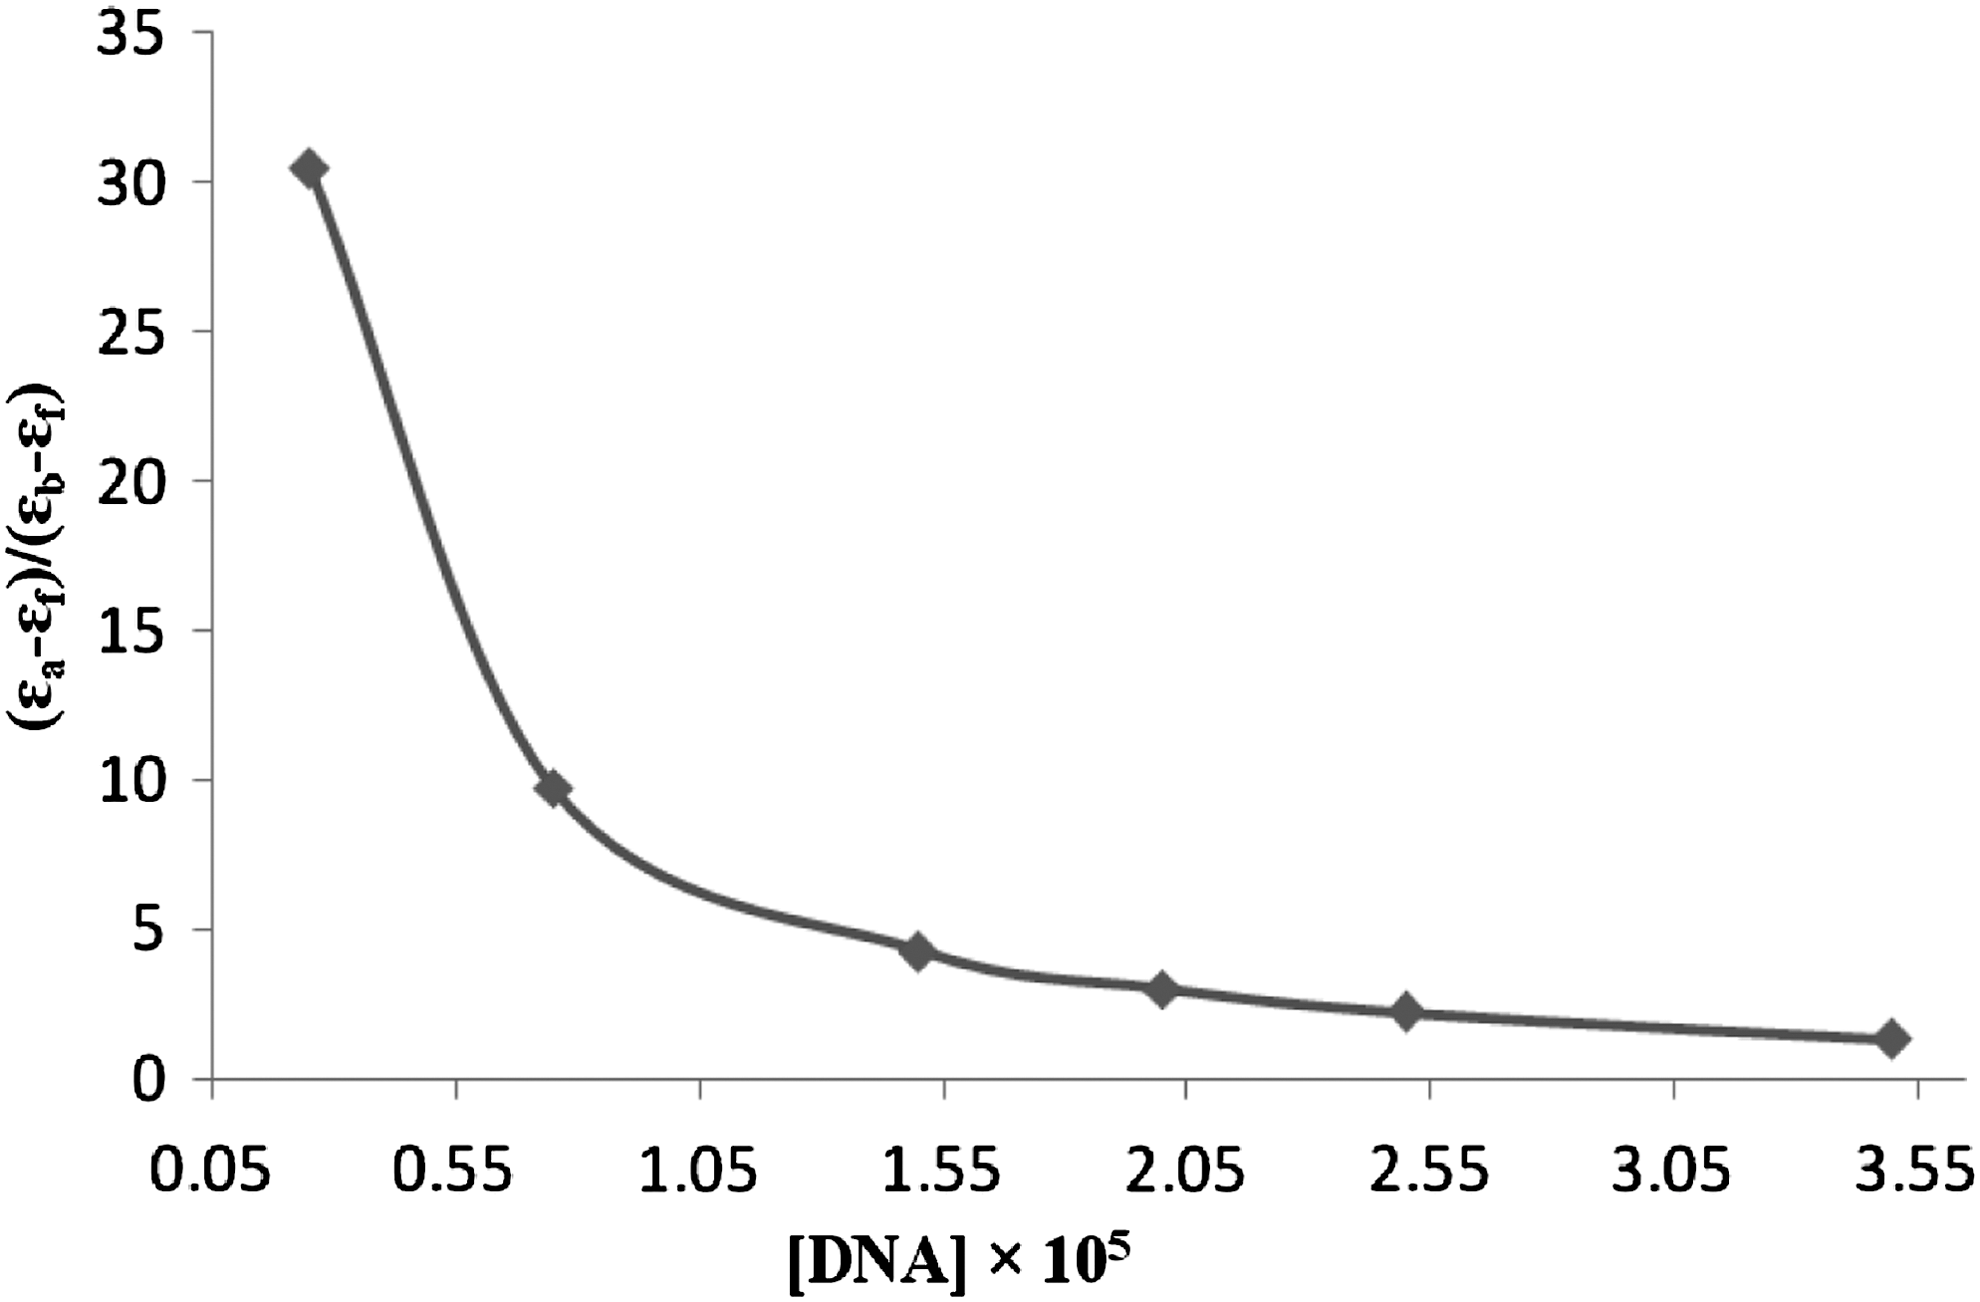
Plots of (ɛa−ɛf)/(ɛb−ɛf) versus [DNA] for the titration of DNA with ribavirin.
Viscosity studies
To clarify further the interaction between the complex and DNA, viscosity measurements were carried out. Hydrodynamic measurements that are sensitive to length change (i.e., viscosity and sedimentation) are regarded as the least ambiguous test of a binding model in solution in the absence of crystallographic structural data. A classical intercalation model demands that the DNA helix must lengthen as base pairs are separated to accommodate the binding compound, leading to an increase in DNA viscosity (Eichhorn and Shin, 1968). In contrast, a partial and/or nonclassical intercalating agents could bend (or kink) the DNA helix, reduce its effective length, and concomitantly its viscosity, and compounds that bind exclusively in the DNA grooves (e.g., netropsin and distamycin), under the same conditions, typically cause less pronounced changes (positive or negative) or no changes in DNA solution viscosity (Sambrook et al., 1989).
The values of relative specific viscosity (η/η0)1/3 versus 1/R (1/R=[DNA]/[ribavirin]), in the absence and presence of different concentrations of ribavirin, were plotted (Fig. 4). The viscosity data show that there are at least two phases of binding between the drug and CT-DNA. At lower concentrations of ribavirin, the viscosity increases and then decreases at higher concentrations. In principle, this could be explained by changes in conformation, flexibility, or solvation of the DNA molecule. Effects due to change of conformation can, however, be ruled out in the present case, since our CD spectrum does not indicate any major conformational changes in the presence of ribavirin (Vijayalakshmi et al., 2000; Shahabadi et al., 2010a).
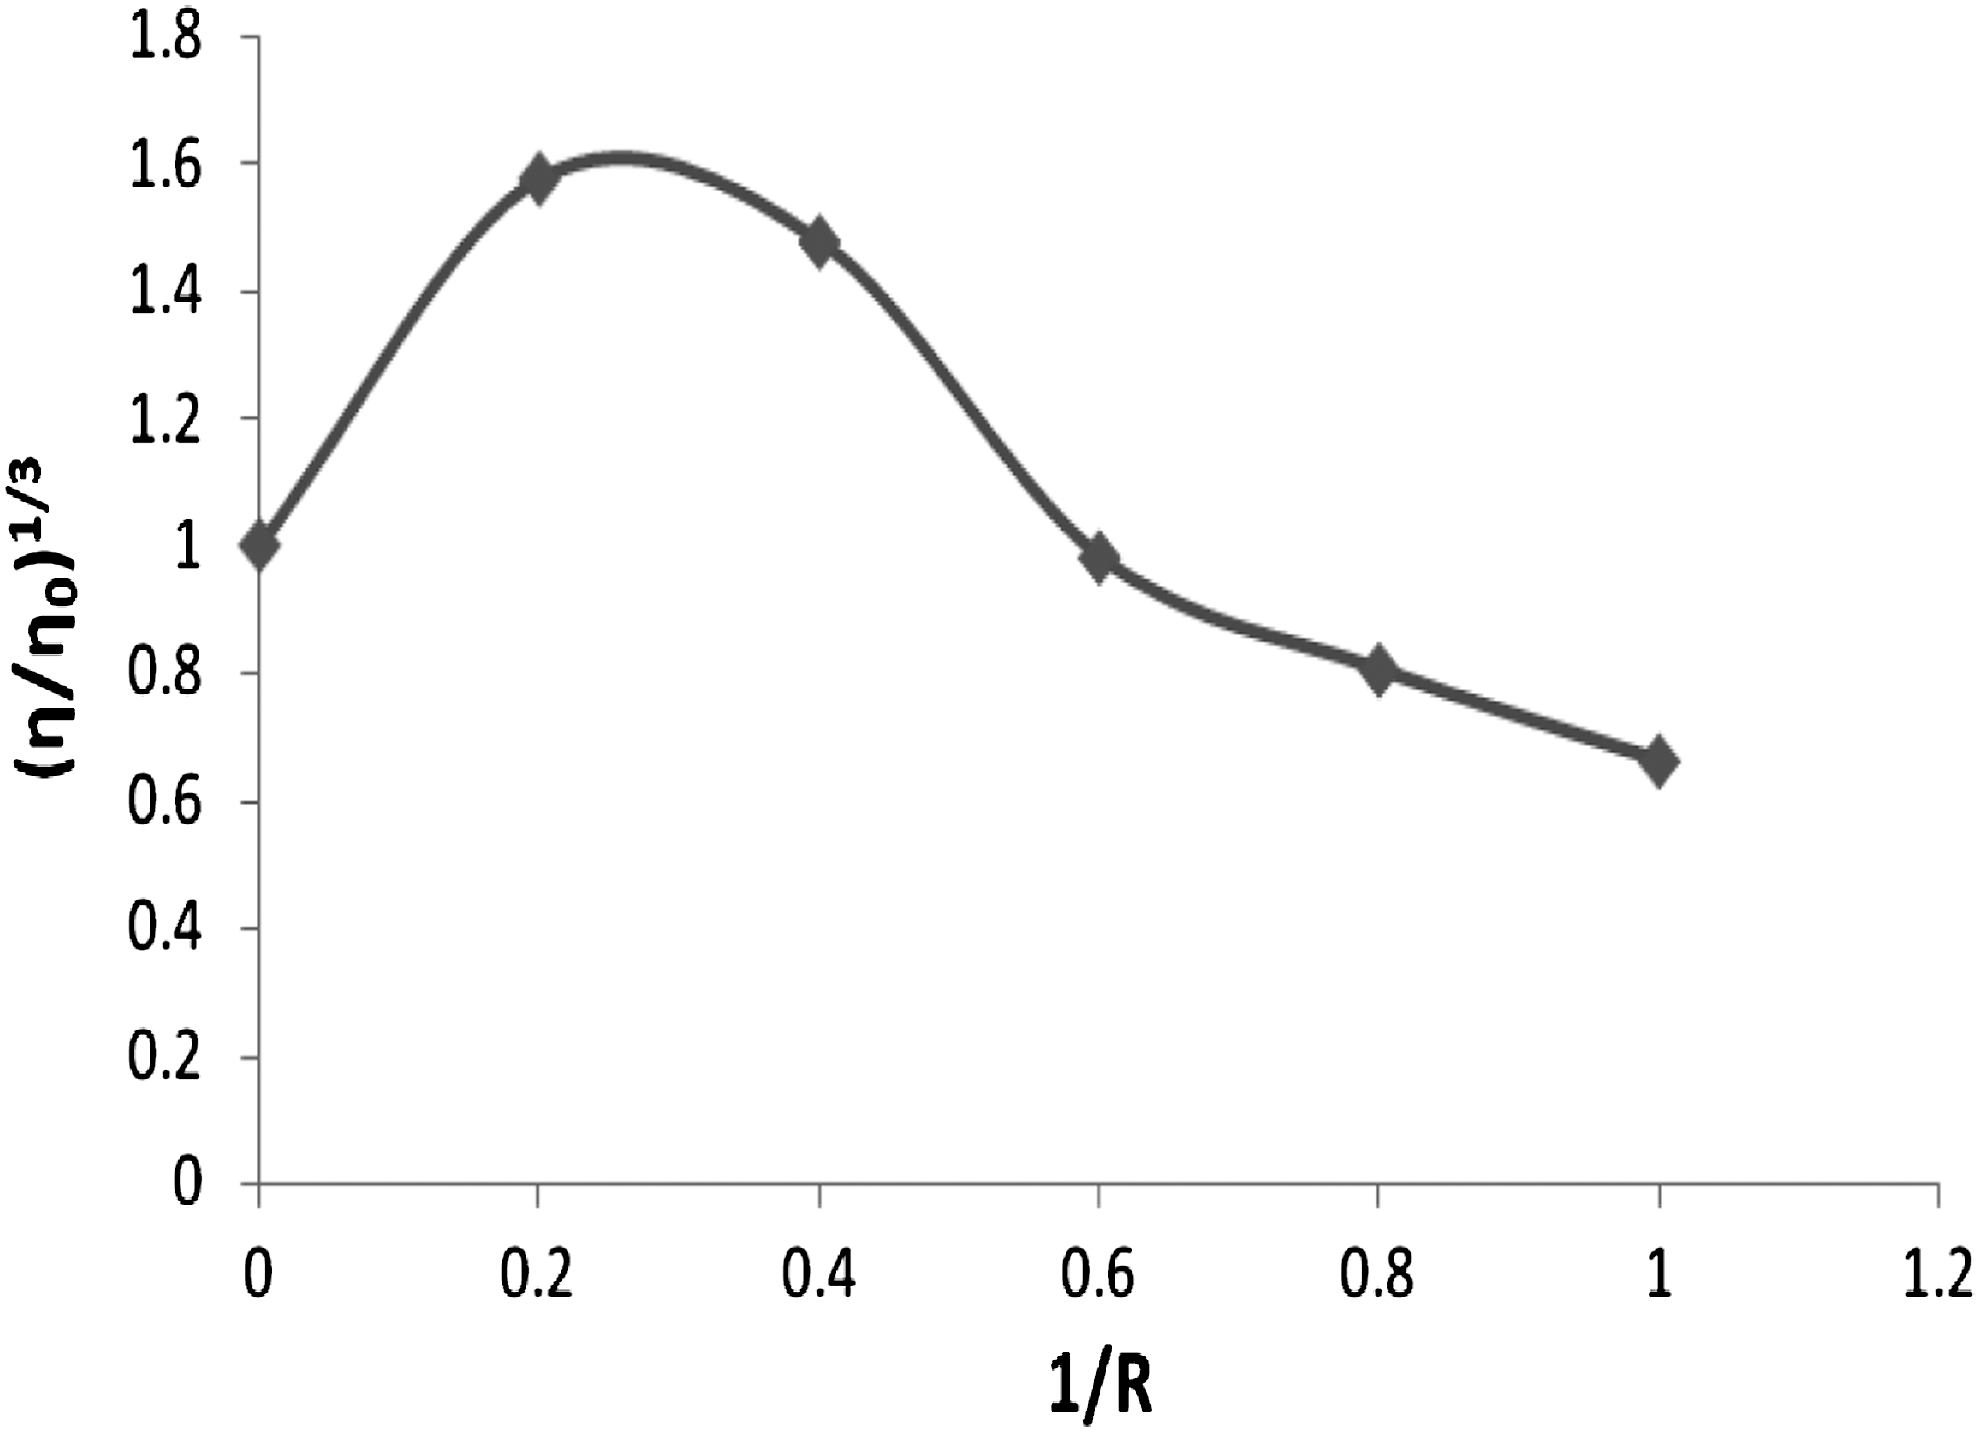
Effect of increasing amounts of ribavirin on the viscosity of CT-DNA (5×10⁻⁵ M) in 50 mM Tris-HCl buffer (1/R=[DNA]/[ribavirin]=0.0, 0.2, 0.4, 0.6, 0.8, and 1).
Circular dichroic spectral studies
CD spectroscopic technique is useful in monitoring the conformational variations of DNA in solution. The observed CD spectrum of CT-DNA consists of a positive band at 275 nm (UV; λmax, 258 nm) due to base stacking and a negative band at 245 nm due to helicity, which are characteristic of DNA in right-handed B form (Collins et al., 1994; Xiao and Zhan, 2002). The CD spectra of DNA taken after 2h incubation of ribavirin with CT-DNA are shown in Figure 5. The positive band of CT-DNA increases and at the same time the negative band decreases, which indicate that the conformation of CT-DNA transitions to A from B. Also the shape of CD spectra is not dependent on the concentration of the drug added in the reaction system. Our results showed that hydroxyl group of the drug can be placed in the major groove (Liu et al., 1999) leading to the conversion of B form to A form of DNA.
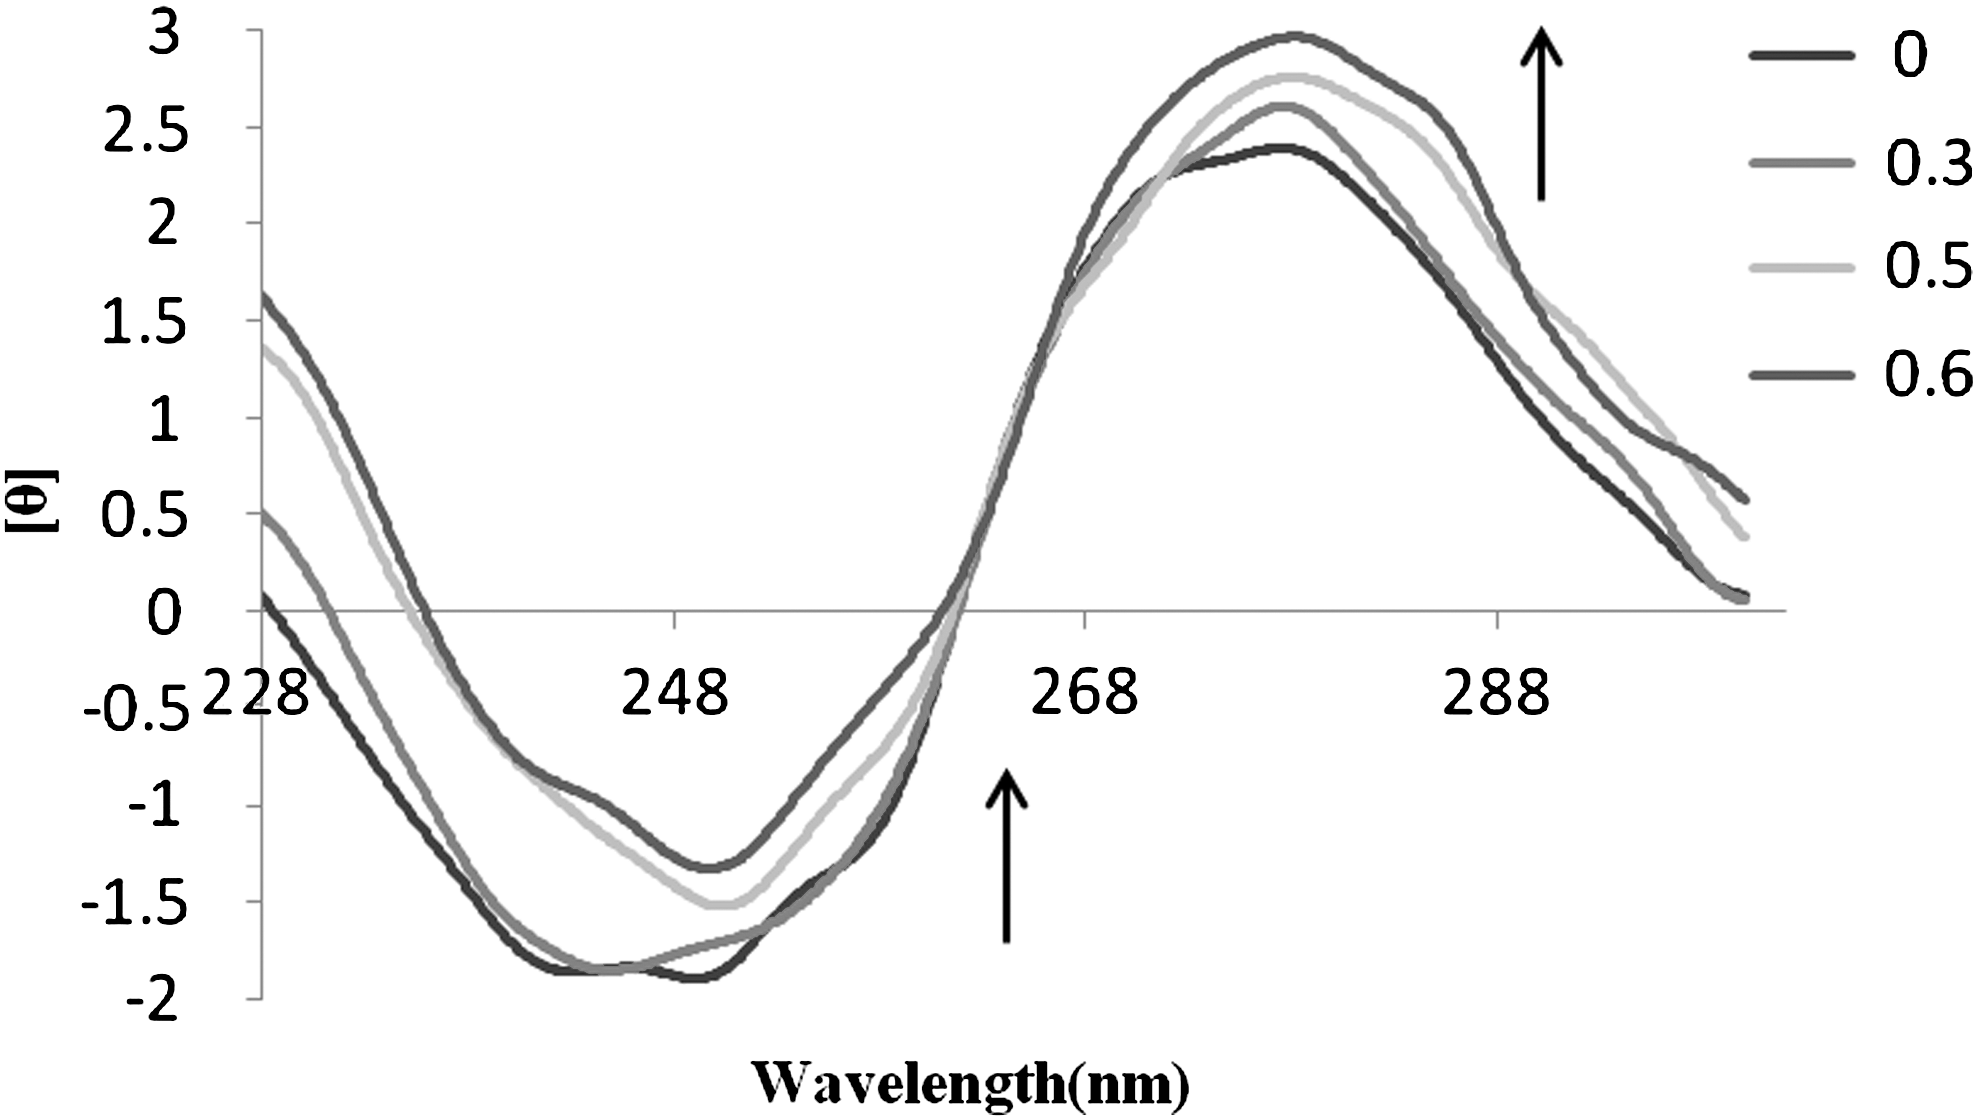
Circular dichroism spectra of CT-DNA (5.0×10⁻⁵) in Tris-HCl buffer (50 mM) in the presence of increasing amounts of ribavirin (r i=[ribavirin]/[DNA]=0.0, 0.3, 0.5, and 0.6).
Fluorescence studies
Fluorescence quenching refers to any process, which is a decrease of the fluorescence intensity from a fluorophore due to a variety of molecular interactions. These include excited-state reactions, molecular rearrangements, energy transfer ground state complex formation, and collisional quenching. Quenching can occur by different mechanisms, which are usually classified as dynamic quenching and static quenching: (a) dynamic quenching refers to a process that the fluorophore and the quencher come into contact during the transient existence of the exited state; (b) static quenching refers to fluorophore–quencher complex formation. In general, dynamic and static quenching can be distinguished by their differing dependence on temperature and excited state lifetime (Eftink and Ghiron, 1976). In both cases, the fluorescence intensity is related to the concentration of the quencher. Therefore, the quenched fluorophore can serve as an indicator for quenching agent (Eftink and Ghiron, 1981).
To further investigate the interaction mode between ribavirin and CT-DNA, fluorescence titration experiments were performed. Ribavirin is nonfluorescent in the visible region and it is hard to monitor the interaction of this drug with DNA by employing direct fluorescence emission methods but is possible by using a molecular probe. Hoechst 33258 binds strongly to the minor groove of double-stranded B-DNA with specificity for AT-rich sequences (Kakkar et al., 2002). The decrease in Hoechst-DNA solution fluorescence by the addition of increasing amounts of ribavirin was observed (Fig. 6). The competitive binding experiment in the presence of drug and Hoechst 33258 indicated that ribavirin could interact as a groove binder. Although Hoechst interacts to DNA with a high affinity (Strekowski and Wilson, 2007), it can be replaced by ribavirin.
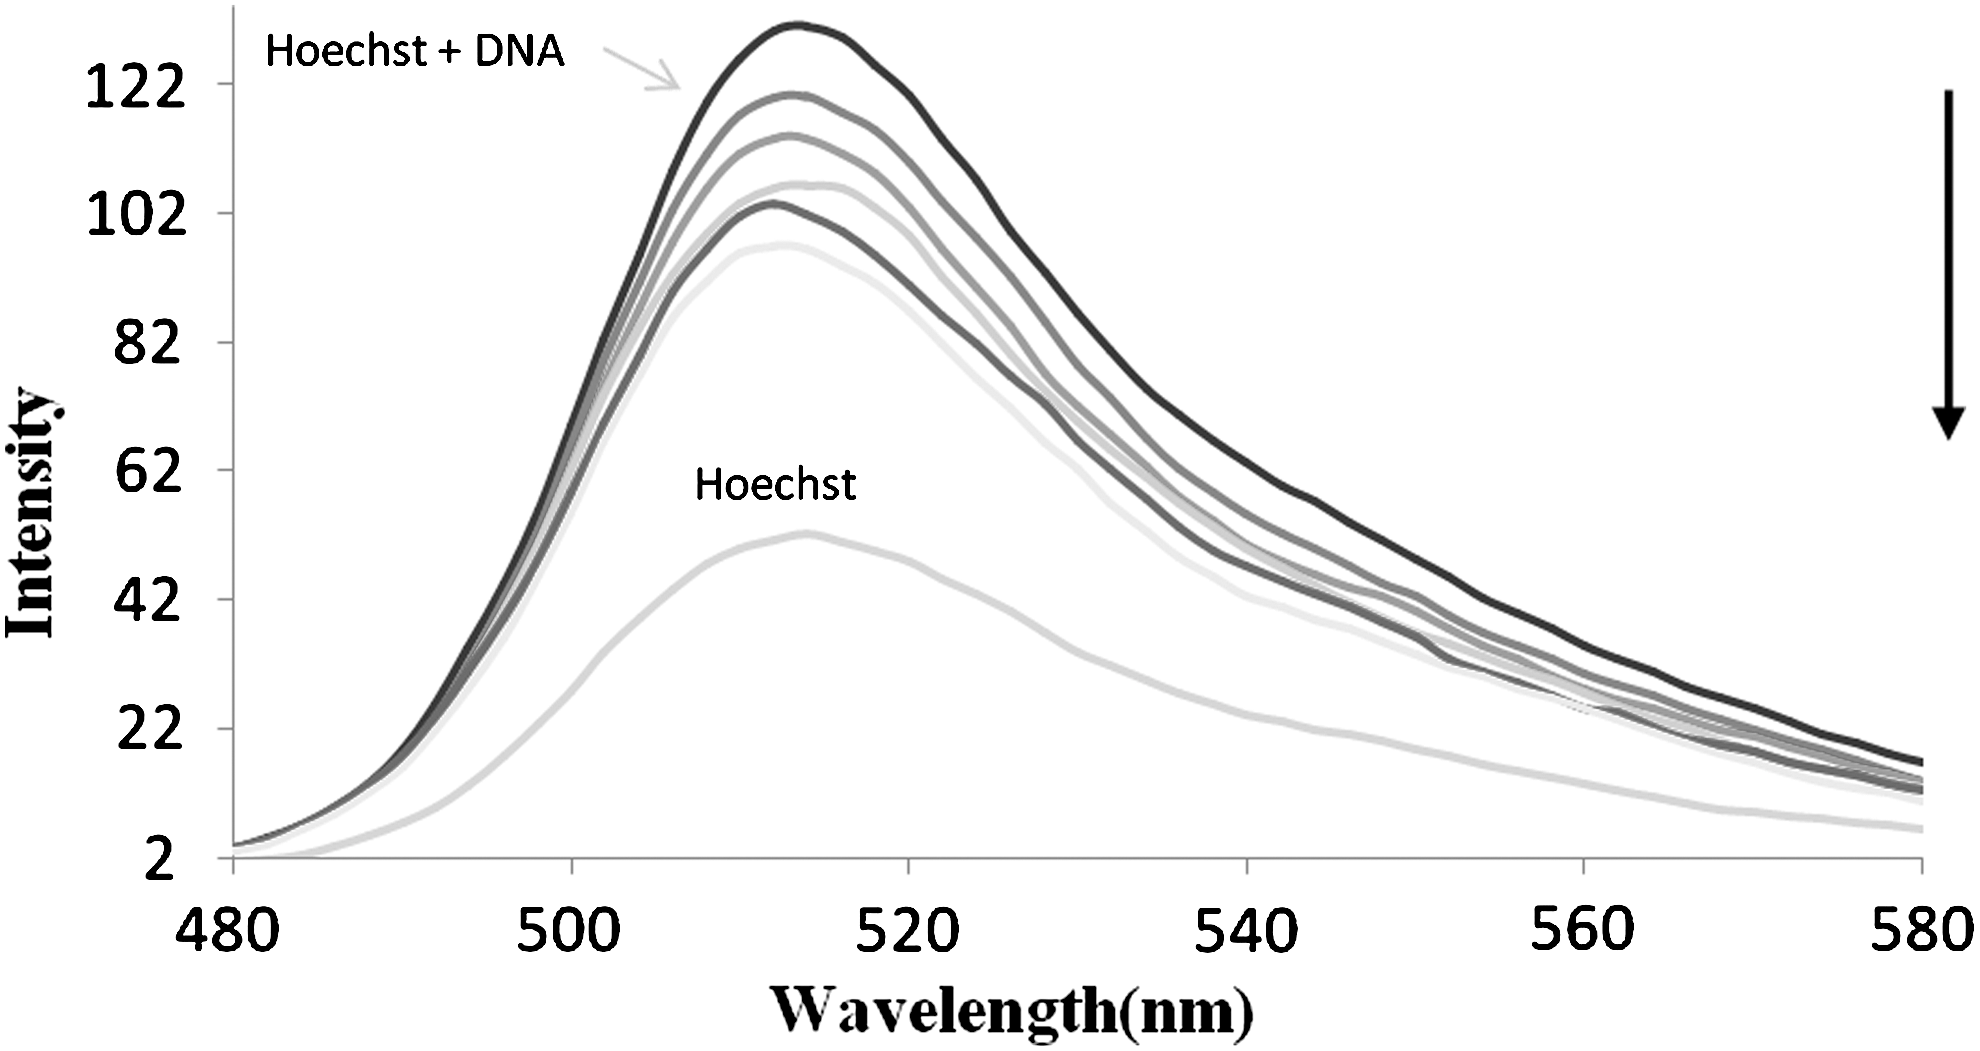
Emission spectra of the Hoechst–DNA complex in the presence of the increasing amounts of ribavirin in aqueous solution (298 K).
Fluorescence quenching studies
Stern–Volmer constant (Ksv
) is used to evaluate the fluorescence quenching efficiency. According to the classical Stern–Volmer equation:
Where F 0 and F represent the fluorescence intensities in the absence and in the presence of quencher, respectively. Kq is the quenching rate constant of biomolecule, Ksv is the dynamic quenching constant, τ 0 is the lifetime of the biomolecule without quencher (τ 0=10−8), and [Q]=[ribavirin] is the concentration of quencher. Plots of F0 /F versus [ribavirin] at different temperatures are shown in Figure 7. As mentioned previously, dynamic quenching or collisional quenching requires contact between the excited lumophore and the quencher. The rate of quenching is diffusion controlled and depends on temperature and viscosity of the solution. The quencher concentration must be high enough such that the probability of collision between the analyte and quencher is significant during the lifetime of the excited species. The other form of quenching is static quenching in which the quencher and the fluorophore in ground state form a stable complex. Fluorescence is only observed from the unbound fluorophore (Cui et al., 2004). Dynamic quenching depends upon diffusion. Since higher temperatures lead to larger diffusion coefficients, the Ksv can be increased by rising the temperature. In contrast, increasing of temperature is likely the result of decrease in complex stability, and thus lower values of the static quenching constants resulted.
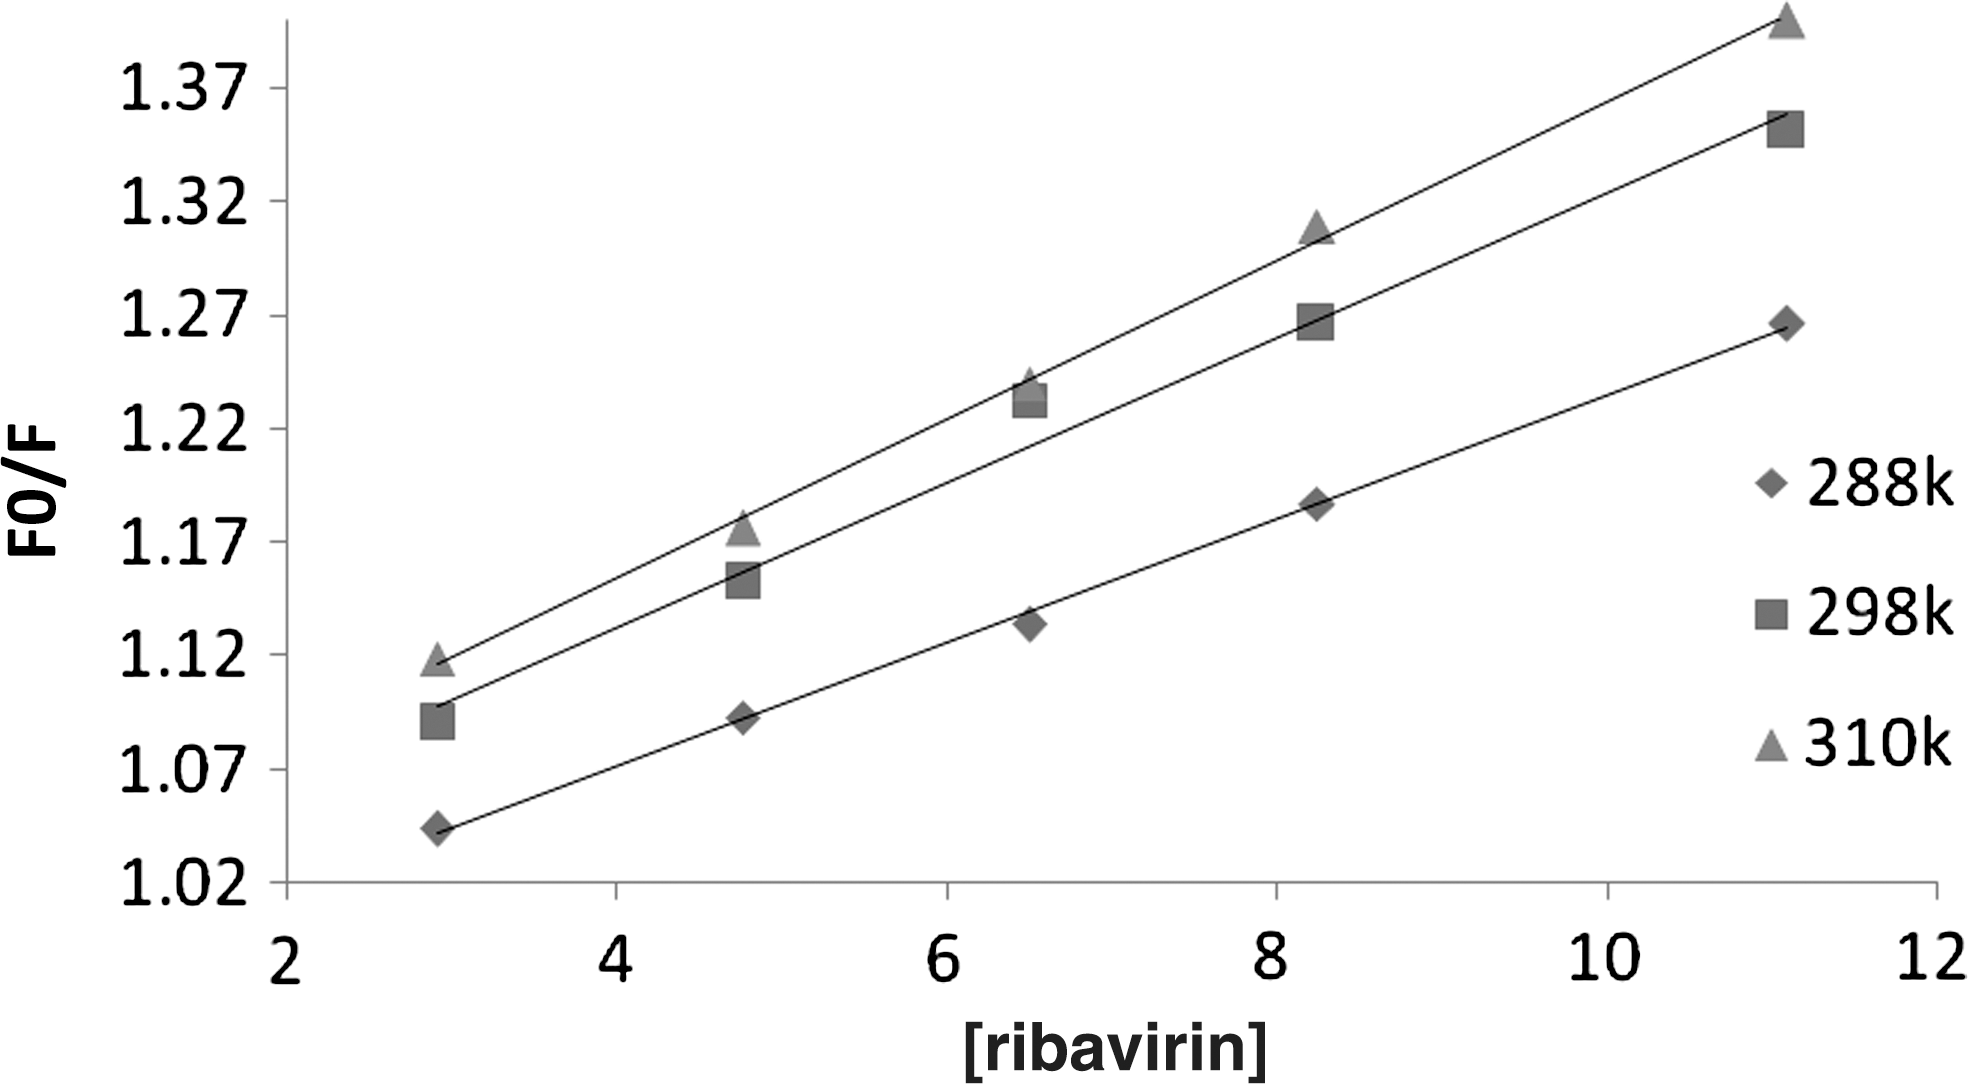
Plots of F 0/F versus [ribavirin] for the binding of the drug with CT-DNA.
By using Equation (2), the Ksv at different temperatures (288, 298, and 310 K) was obtained and the results are shown in Table 1. These results show that the probable quenching mechanism is a dynamic quenching procedure, because the Ksv increased with higher temperatures (Kashanian et al., 2007).
Binding constants and binding sites
The binding constant (Kf
) and the binding stoichiometry (n) for the complex formation between ribavirin and DNA were measured using Equation 3 (Jiang et al., 2004).
Here F0 and F are the fluorescence intensities of the fluorophore in the absence and in the presence of different concentrations of ribavirin, respectively. The linear equations of log (F−F0 )/F versus log [ribavirin] at different temperatures are shown in Table 2. The values of Kf underscore the high affinity of ribavirin for DNA.
Thermodynamic studies
The interaction between drug and biomolecule may involve hydrophobic forces, electrostatic interactions, van der Waals interactions, and hydrogen bonds (Ross and Subramanian, 1981; Zhang et al., 2008). The model of interaction between the drug and biomolecule can be deduced according to the data of enthalpy changes (ΔH) and entropy changes (ΔS) (Naik et al., 1990): (a) ΔH>0 and ΔS>0, hydrophobic forces; (b) ΔH<0 and ΔS<0, van der Waals interactions and hydrogen bonds; (c) ΔH<0 and ΔS>0, electrostatic interactions (Shahabadi and Fatahi, 2010). To elucidate the mode of the interaction of ribavirin with DNA, the thermodynamic parameters were calculated. The plot of ln K versus 1/T (Fig. 8; Equation 4) allows the determination of enthalpy change (ΔH) and entropy change (ΔS). If the temperature does not vary significantly, the enthalpy change (ΔH) can be regarded as a constant. Based on the binding constants at different temperatures, the free energy change (ΔG) can be estimated (Table 3; Equation 5) by the following equations.
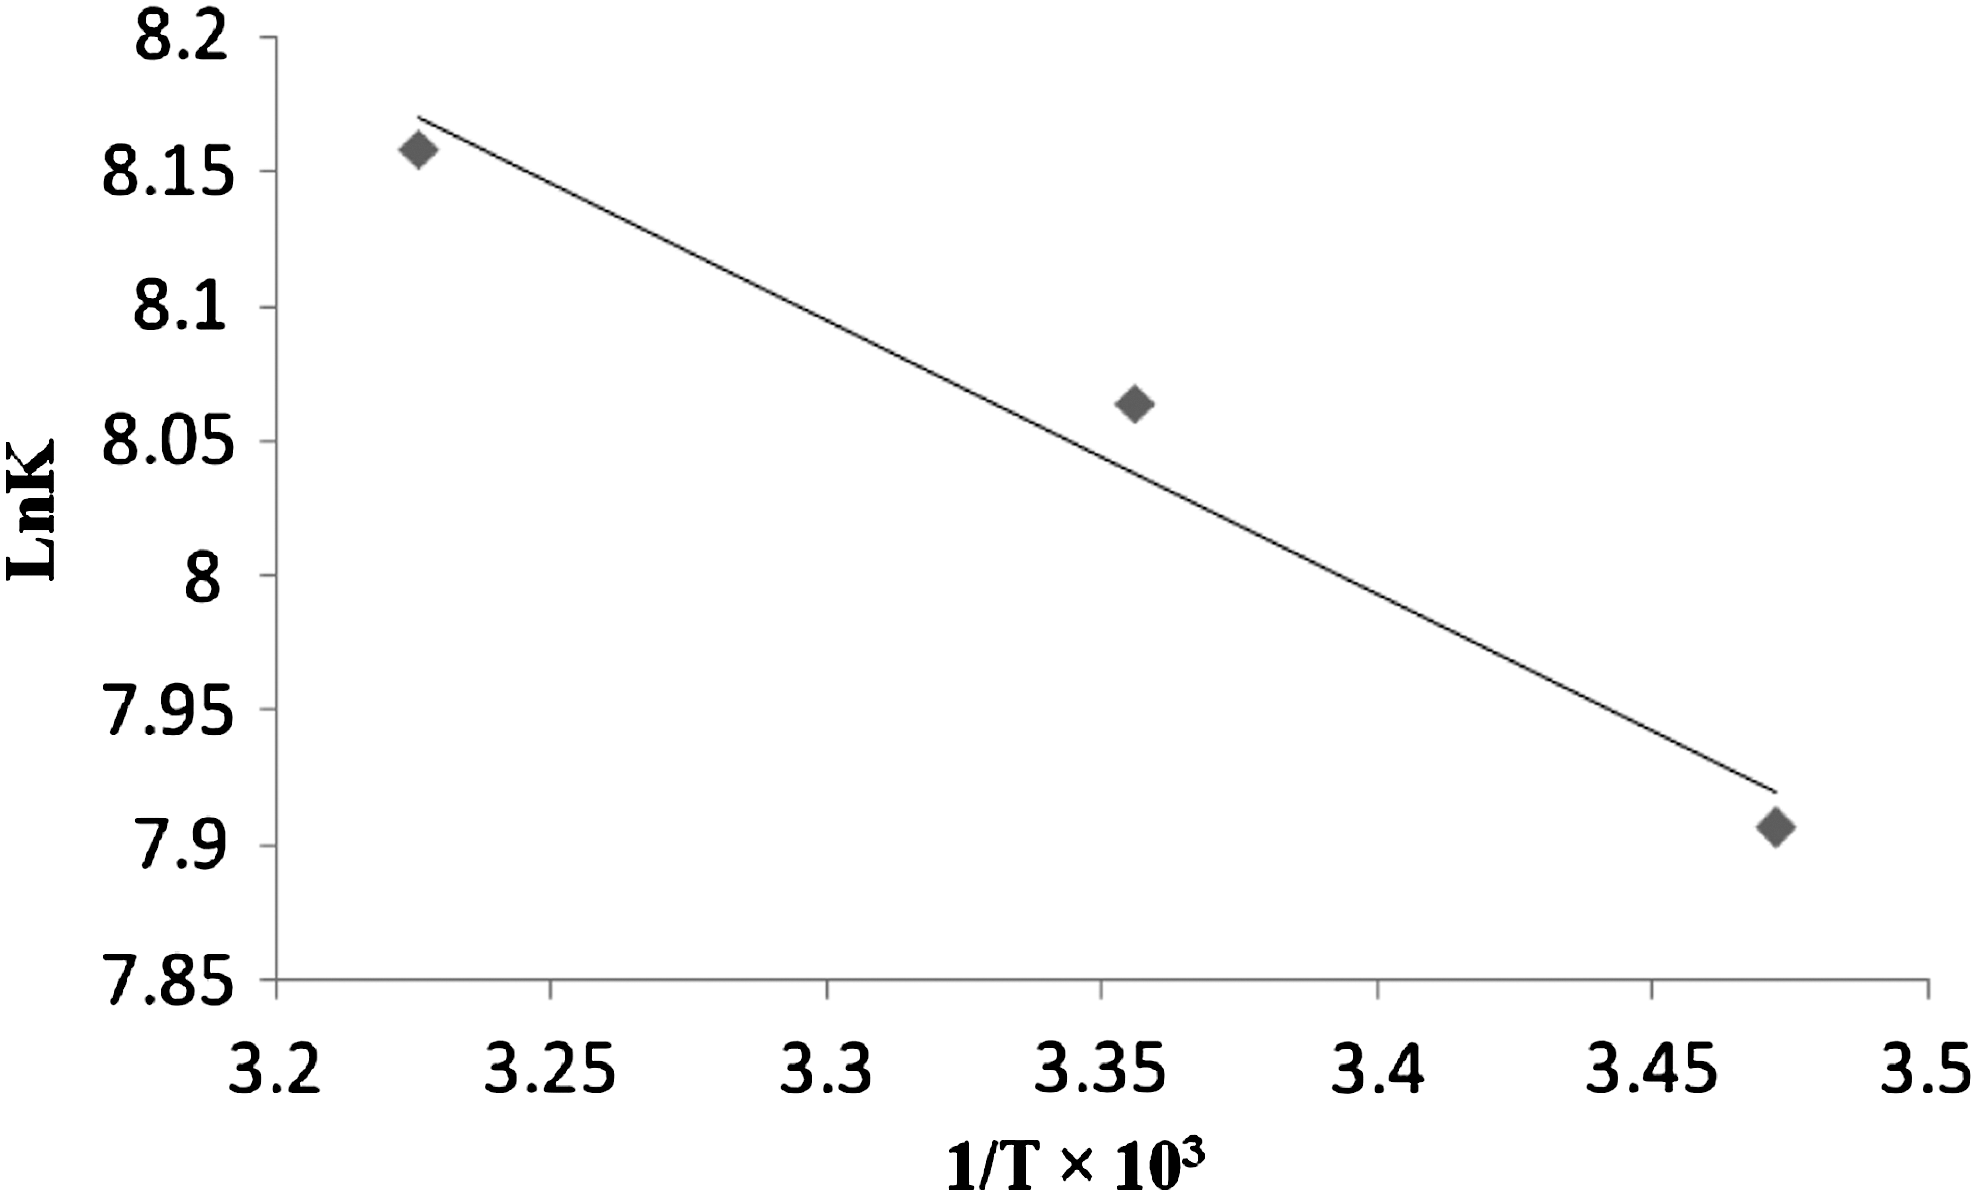
Van't Hoff plot for the interaction of ribavirin and CT-DNA at pH 7.4.
Where K is the Stern–Volmer quenching constant at the corresponding temperatures and R is the gas constant. When we apply this analysis to the binding system of ribavirin and CT-DNA, we find that ΔH<0 and ΔS>0. The changes in enthalpy and entropy, negative and positive, respectively, indicate that this binding is an exothermic and entropy increasing process (Dezhi et al., 2010). To understand this phenomenon, we consider the direct attraction between the ribavirin molecules and DNA. This kind of interaction should lead to exothermic effect. On the other hand, the drug molecules must release some water molecules from their hydration layers when they are approaching to the DNA molecules. Furthermore, owing ΔH<0 and ΔS>0, the hydrophobic interaction between the DNA and the drug plays a major role in this binding process. The negative value of ΔG reveals that the interaction process is spontaneous.
DNA cleavage activity
The ability of ribavirin to cleave pUC18 plasmid DNA was monitored by agarose gel electrophoresis (Figure 9). As shown in this figure, two clear bands were observed for the controls in which the drug is absent (lane 0). The relatively fast migration is the intact supercoiled form (Form I), and the slower moving migration is the open circular form (Form II), which was generated from supercoiled form when scission occurred on one strand (Parta et al., 2005; Gao et al., 2006). The drug at different concentrations is able to cleave pUC18 plasmid DNA (lanes 3–5) (Fig. 9). The amount of Form I diminished gradually, partly converted to Form II, whereas the intensity of the Form II band increased as the concentration of the drug is increased.
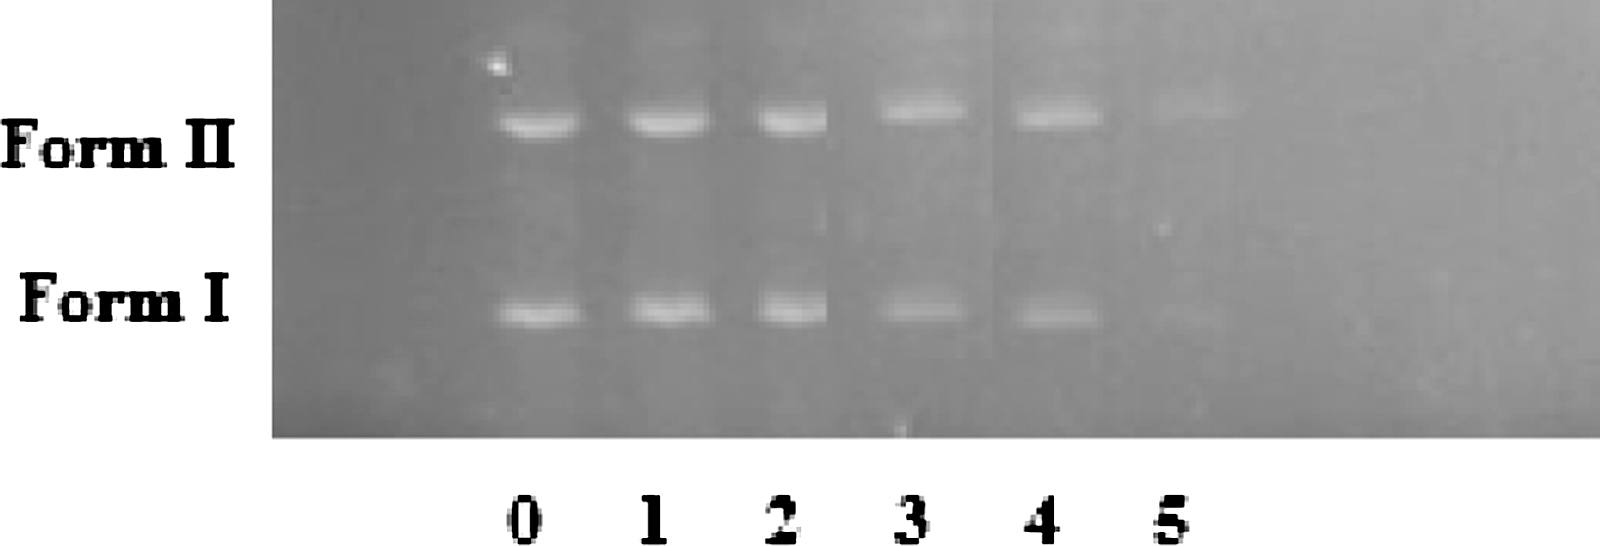
Cleavage of pUC18 DNA in the presence of increasing amounts of ribavirin (r i=[ribavirin]/[DNA]=0.00, 0.01, 0.05, 0.02, 0.1, and 1.02): lane 0 was DNA alone (r i=0.00), lane 1 (r i=0.01), lane 2 (r i=0.02), lane 3 (r i=0.05), lane 4 (r i=0.1), lane 5 (r i=1.02).
Conclusion
In summary, we have studied the binding of CT-DNA with an antiviral drug, ribavirin. The results suggest that the ribavirin binds to DNA via a groove binding mode. The intrinsic binding constant (K b =4.6×10³ M−1) is similar to groove binders. The thermodynamic parameters (ΔH<0 and ΔS>0) indicate that complexation between CT-DNA and ribavirin occurs through hydrophobic interaction. The negative ΔG values for interaction of CT-DNA with ribavirin indicate spontaneity of the complexation. Further, circular dichroism changes of CT-DNA are characteristic of transition of B-DNA to A-DNA.
Footnotes
Acknowledgment
The authors gratefully acknowledge the Razi University Research Center for its financial support.
Disclosure Statement
No competing financial interests exist.