
Abstract
The aim of this study was developing coordination complexes that can be used as inorganic medicinal agents. The water soluble [Pt(phen)(His)]NO3·3H2O complex in which phen=1,10-phenantheroline and His=
Introduction
The structure of the [Pt(1,10-phenanthroline)(Histidine)]NO3·3H2O complex.
Materials and Methods
Materials
Commercial pure chemicals such as 1,10-phenanthroline, methanol, silver nitrate, diethyl ether, acetone, histidine, hydrazine dihydro chloride, KCl, HCl, HNO3, K2PtCl4, DMF, NaOH, and Tris-HCl buffer were purchased from Merck. The experiments were carried out in Tris-HCl buffer (50 mM, pH 7.4). Solutions were prepared with distilled water. CT-DNA was purchased from Sigma. The stock solution of DNA was prepared by dissolving DNA in 50 mM Tris-HCl buffer (pH 7.4). The solution of CT-DNA had a ratio of ultraviolet (UV) absorbance at 260 and 280 nm of more than 1.8, indicating that the DNA was sufficiently free from protein (Sambrook et al., 1989).
The DNA concentration (monomeric units) of the stock solution was determined by UV spectrophotometry, in properly diluted samples, using the molar absorption coefficient 6600 M–1 cm–1 at 260 nm (Kennedy and Bryant, 1986). The stock solution was stored at 4°C and used within 4 days. To study the interaction of platinum complex with DNA, stock solutions were prepared by dissolving the complex in Tris-HCl buffer (to a final concentration of 1 mg/mL). Stock solutions were freshly prepared before use (24 h).
Synthesis of [Pt(phen)Cl2]
The [Pt(LL)Cl2] was prepared by modification of the method reported by Nakabayashi et al. (2009) and Roy et al. (2009). Yield: 82%.
Synthesis of [Pt(phen)(His)]NO3·3H2O
[Pt(phen)(His)]NO3·3H2O was synthesized by a modification of the procedure reported by Jin and Ranford (2000). Anal. Calcd. for PtC18H22N6O8: C, 34.21; H, 3.1; N, 10.8. Found: C, 34.9; H, 3.6; N, 11.3. Selected 1H Nucleic Magnetic Resonance (1HNMR) (200 MHz, D2O): δ 3.74 (dd, H), 3.26 (q, 2H), 7.00 (s, H), 7.24 (s, H), (t, 1H)7.7(d, H), 7.9 (q, 2H), 8.3 (d, H), 8.7(d, H), 9.13 (d, 2H), Yield: 53%.
Instrumentation
The complex was characterized by elemental analysis, UV-Vis, and 1HNMR spectroscopy. The elemental analysis was performed using a Heraeus CHN elemental analyzer. The NMR spectra were recorded with a Bruker Avance DPX 200 MHz (4.7 Tesla) spectrometer using D2O solvent. Absorbance spectra were recorded using an HP spectrophotometer (Agilent 8453) equipped with a thermostated bath (Huber polysat cc1). The absorbance measurements were performed by keeping the Pt(II) complex concentration constant (5×10⁻⁵M) while varying the DNA concentration from 0 to 1.75×10⁻⁴ M (r i=[DNA]/[complex]=0.0–3.5). The samples were incubated at 37°C for 24 h, and the spectra were recorded in the range of 200–800 nm.
Circular dichroism (CD) measurements were recorded on a JASCO (J-810) spectropolarimeter, keeping the concentration of DNA constant (8×10⁻⁵ M) while varying the complex concentration from 0 to 8×10⁻⁵ M (r i=[complex]/[DNA]=0.0, 0.2, 0.4, 0.6, 0.8). After an incubation of 24 h at 37°C, the CD spectra of CT-DNA were recorded in the range of 200–300 nm.
Viscosity measurements were made using a viscosimeter (SCHOT AVS 450) maintained at 25°C±0.5°C in a constant temperature bath. The DNA concentration was fixed at 5×10⁻⁵ M and flow time was measured with a digital stopwatch; the mean values of two measurements were used to evaluate the viscosity (η) of the samples. The values for relative specific viscosity (η/η0)1/3, where η0 and η are the specific viscosity contributions of DNA in the absence (η0) and in the presence of the Pt(II) complex (η), were plotted against 1/R (R=[complex]/[DNA]=0.0–1).
Fluorescence measurements were carried out with a JASCO spectrofluorimeter (FP 6200) by keeping the concentration of the complex constant (5×10⁻⁵ M) while varying the DNA concentration from 0 to 5×10⁻⁵ M (r i=[DNA]/[complex]=0.0–1) at three different temperatures (283, 299, and 318 K).
Results and Discussion
Electronic spectral studies
Electronic absorption spectroscopy is one of the most useful techniques for DNA binding studies of metal complexes. A complex binding to DNA through intercalation usually results in hypochromism and bathochromism, due to the intercalation mode involving a strong π–π* stacking interaction between an aromatic chromophore and the base pairs of DNA. The extent of the hypochromism in the UV band is consistent with the strength of intercalative interaction (Liu et al., 2001; Chen et al., 2008a). The binding affinity of Pt(II) complex depends on several structural factors, including (1) size and steric effects, (2) hydrogen-bonding capability, and (3) complex charge. Direct comparisons of binding equilibrium constants from different studies are complicated by the fact that K values are very sensitive to solution ionic strength and DNA base composition as well as pH and temperature. Comparing a set of [Pt(terpy)X]n+ complex cations with various Pt(II) bipyridine and phenanthroline complex cations suggests that a balance of structural factors affects binding constants (Howe-Grant et al., 1976; Howe-Grant and Lippard, 1979). In general, binding appears to be enhanced by (1) an increase in the positive charge of the complex cation, (2) a greater number of coplanar aromatic rings, and (3) the presence of an X ligand having hydrogen-bonding capability (Cummings, 2009). The absorption spectrum of the platinum(II) complex displays an intense absorption band at λ=276 nm assigned to interligand π→π* transition of the phenanthroline ligand by analogy to other phenanthroline metal complexes (Zhong et al., 2009). In the presence of increasing concentrations of CT-DNA (Fig. 2), a marked hypochromism in the π→π* is apparent, with a 4-nm red shift (from 276 to 280 nm). The extent of the hypochromism in the spectrum at λ=276–280 nm was measured using the Equation (1) given below (H%=50%).
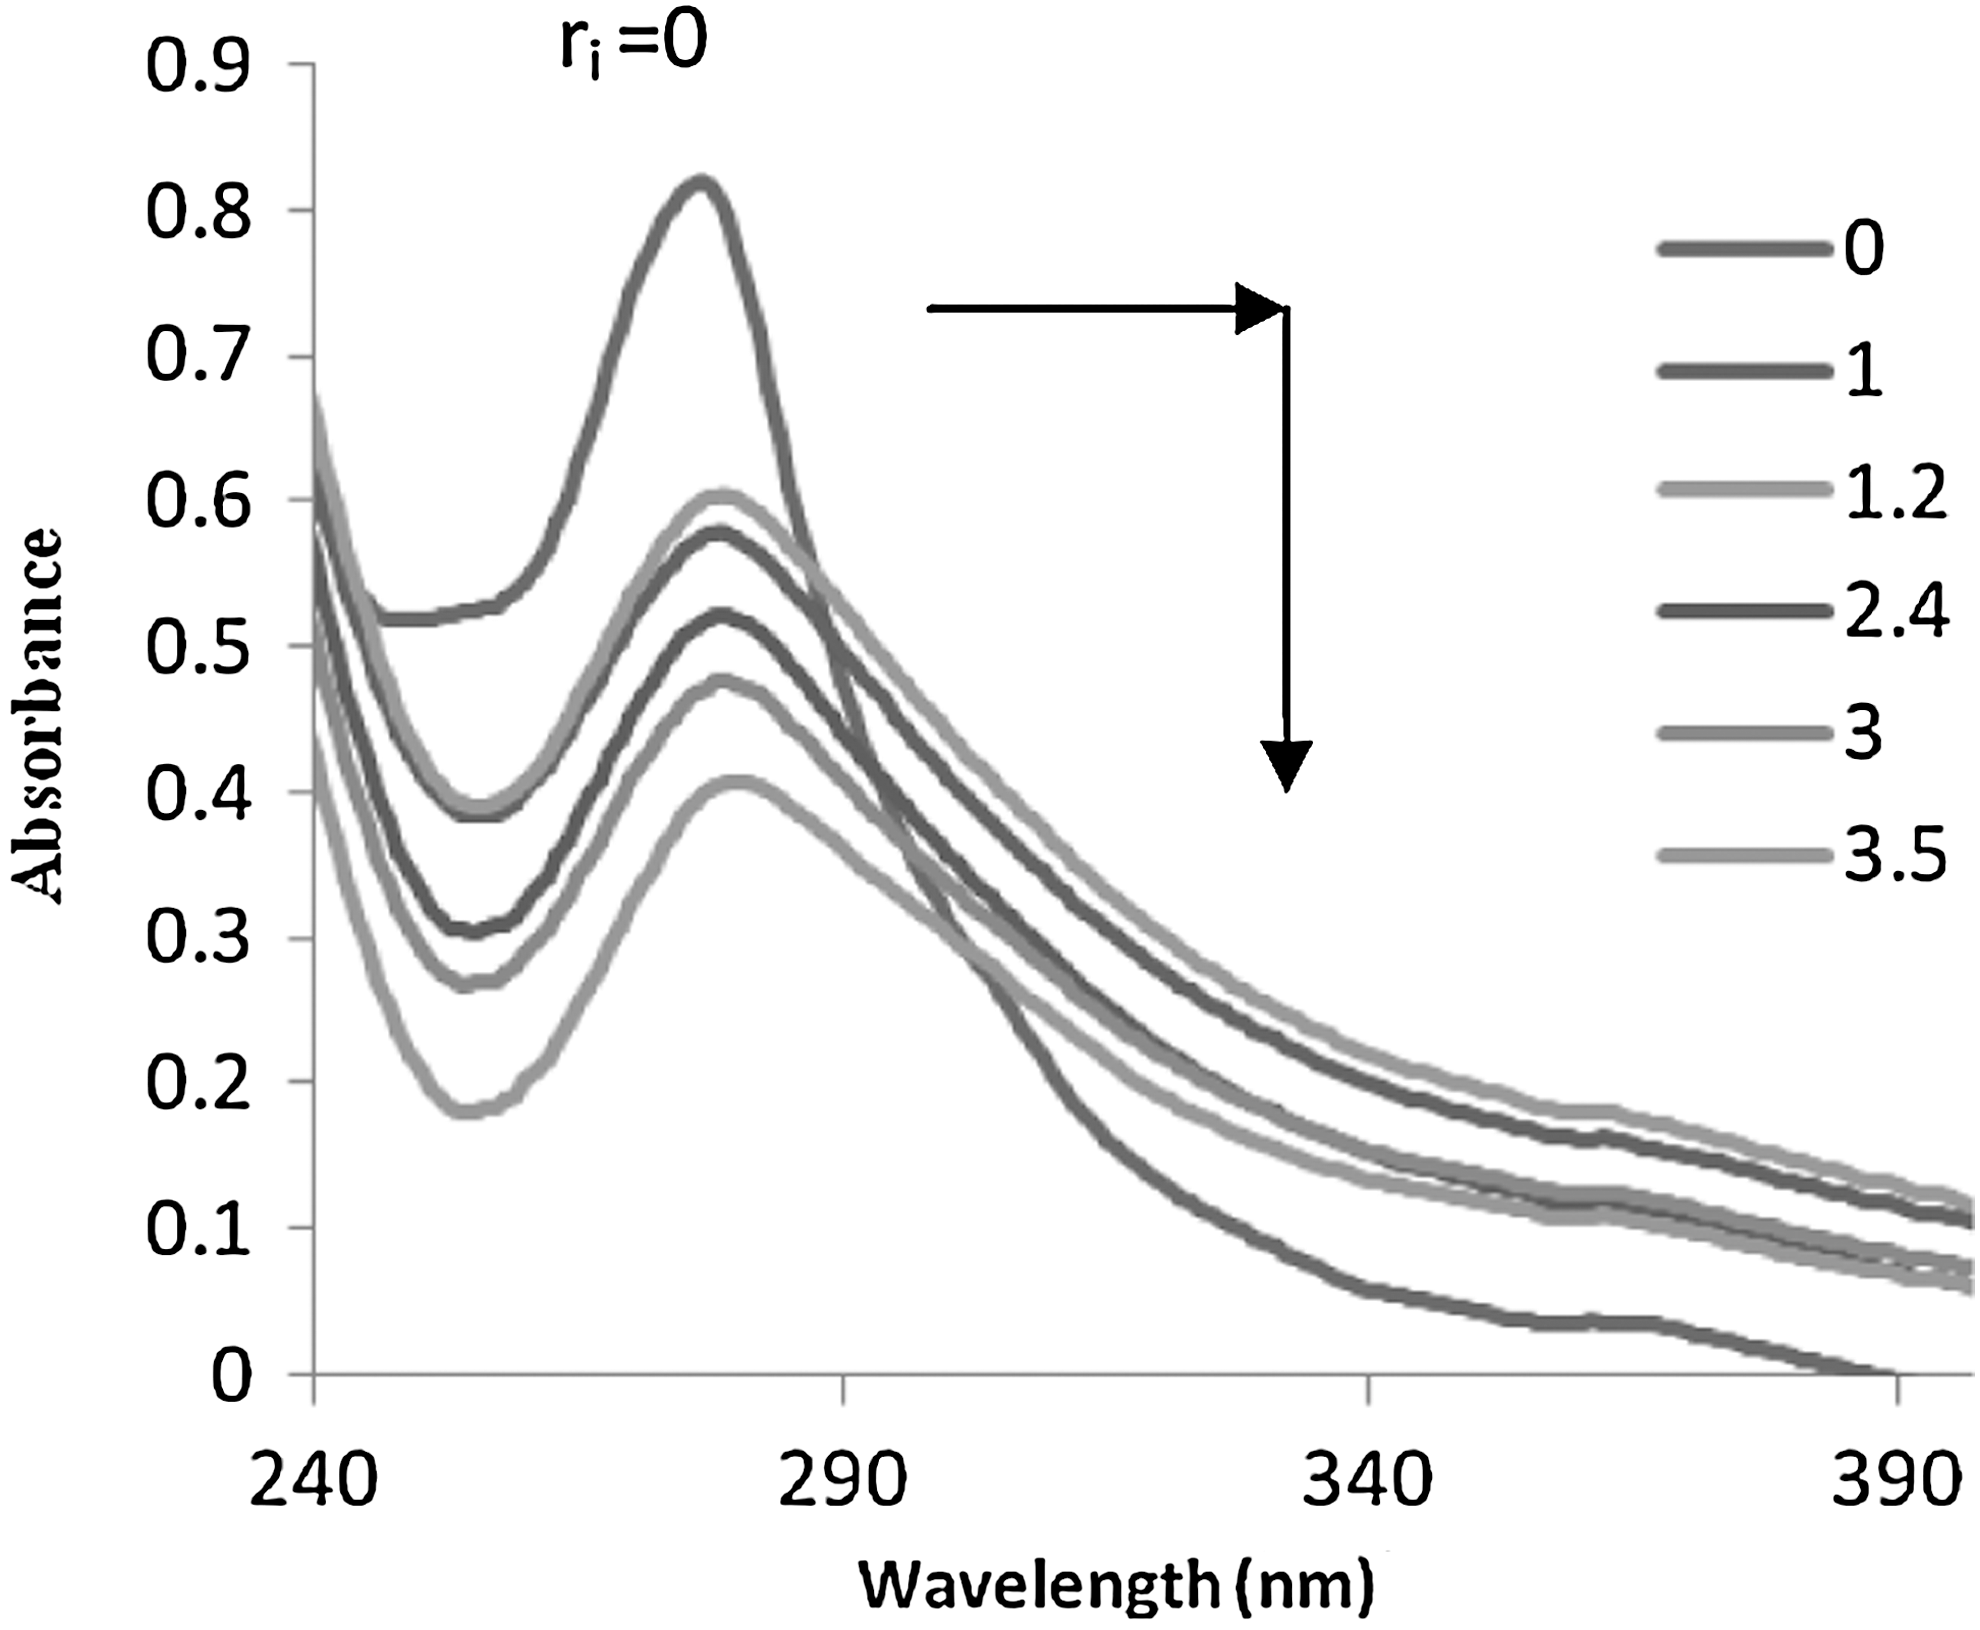
Absorption spectra of [Pt(phen)(His)]NO3·3H2O complex in Tris-HCl buffer upon addition of calf thymus (CT)-DNA.
The band shows a bathochromic shift of about 4 nm and hypochromism of 50% after adding DNA. Comparing the hypochromism of this complex with [Ni2(OAc)L]ClO4·H2O, where L=N, N-bis (3-aminopropyl)-4-methoxy benzylamine, shows a bathochromic shift of about 38 nm and hypochromism of 23.4% after adding DNA (Hu et al., 2011). [Zn(erx)2(bipy)] exhibits a less-pronounced hypochromism of ∼10% with a red shift of 4 nm; [Zn(erx)(phen)]4MeOH, (1), where phen=(1,10-phenanthroline) and erx=(enrofloxacinato), exhibits a significant hypochromism of 30% suggesting tight binding to CT DNA, which may be by intercalation (Tarushi et al., 2009). These findings support the hypothesis of a DNA intercalating interaction of the complex (Hu, 2011). The intrinsic binding constants, K
b, were measured by monitoring the changes of absorption in the metal to ligand charge transfer (MLCT) band with increasing concentration of DNA using the following equations (Shahabadi and Fatahi, 2010).
Where [DNA] is the concentration of CT-DNA in base pairs, and the apparent absorption coefficients ɛ a, ɛ f, and ɛ b correspond to A observed/[Pt], the absorbance for the free platinum complex, and the absorbance for the platinum complex in fully bound form, respectively. K b is the equilibrium binding constant, C t is the total metal complex concentration in nucleotides and s is the binding site size (Liu et al., 2008). In general, the extent of the hypochromism indicates the intercalative binding strength. To further investigate the intensity of the interaction between Pt(II) complex and CT- DNA, we calculated the intrinsic binding constant between them, as shown in Figure 3. The value obtained for K b was 8×10⁴ M−1. The values of K b in the literature for classical intercalators like ethidium–DNA (7×10⁷ M−1) (Waring, 1965) are at least 1000 orders of magnitude higher than that obtained for this Pt(II) complex. But the K b value for the complex is comparable to that observed for other intercalators like, [Zn(erx)2(phen)]·4MeOH, where phen=(1,10-phenanthroline) and erx=(enrofloxacinato) (8.03×10⁴ M−1); [Zn(erx)2(bipy)] (2.61±0.20×10⁴ M−1) (Tarushi et al., 2009). [Pt(terpy)(SC4H9)]+ (8.4×10³ M−1); [Pt(terpy)(OH)]+ (7×10⁴ M−1); [Pt(terpy)Cys]+ (1.0×10⁵ M−1) (Cummings, 2009). [Pt(dmphen)CO3]·H2O (1.8×10⁵ M−1); [Pd(dmphen)CO3]·H2O (1.6×10⁴ M−1) (Gao et al., 2010). These results suggest that intercalation between the base pairs is the main mode of interaction of the titled Pt(II) complex with DNA.
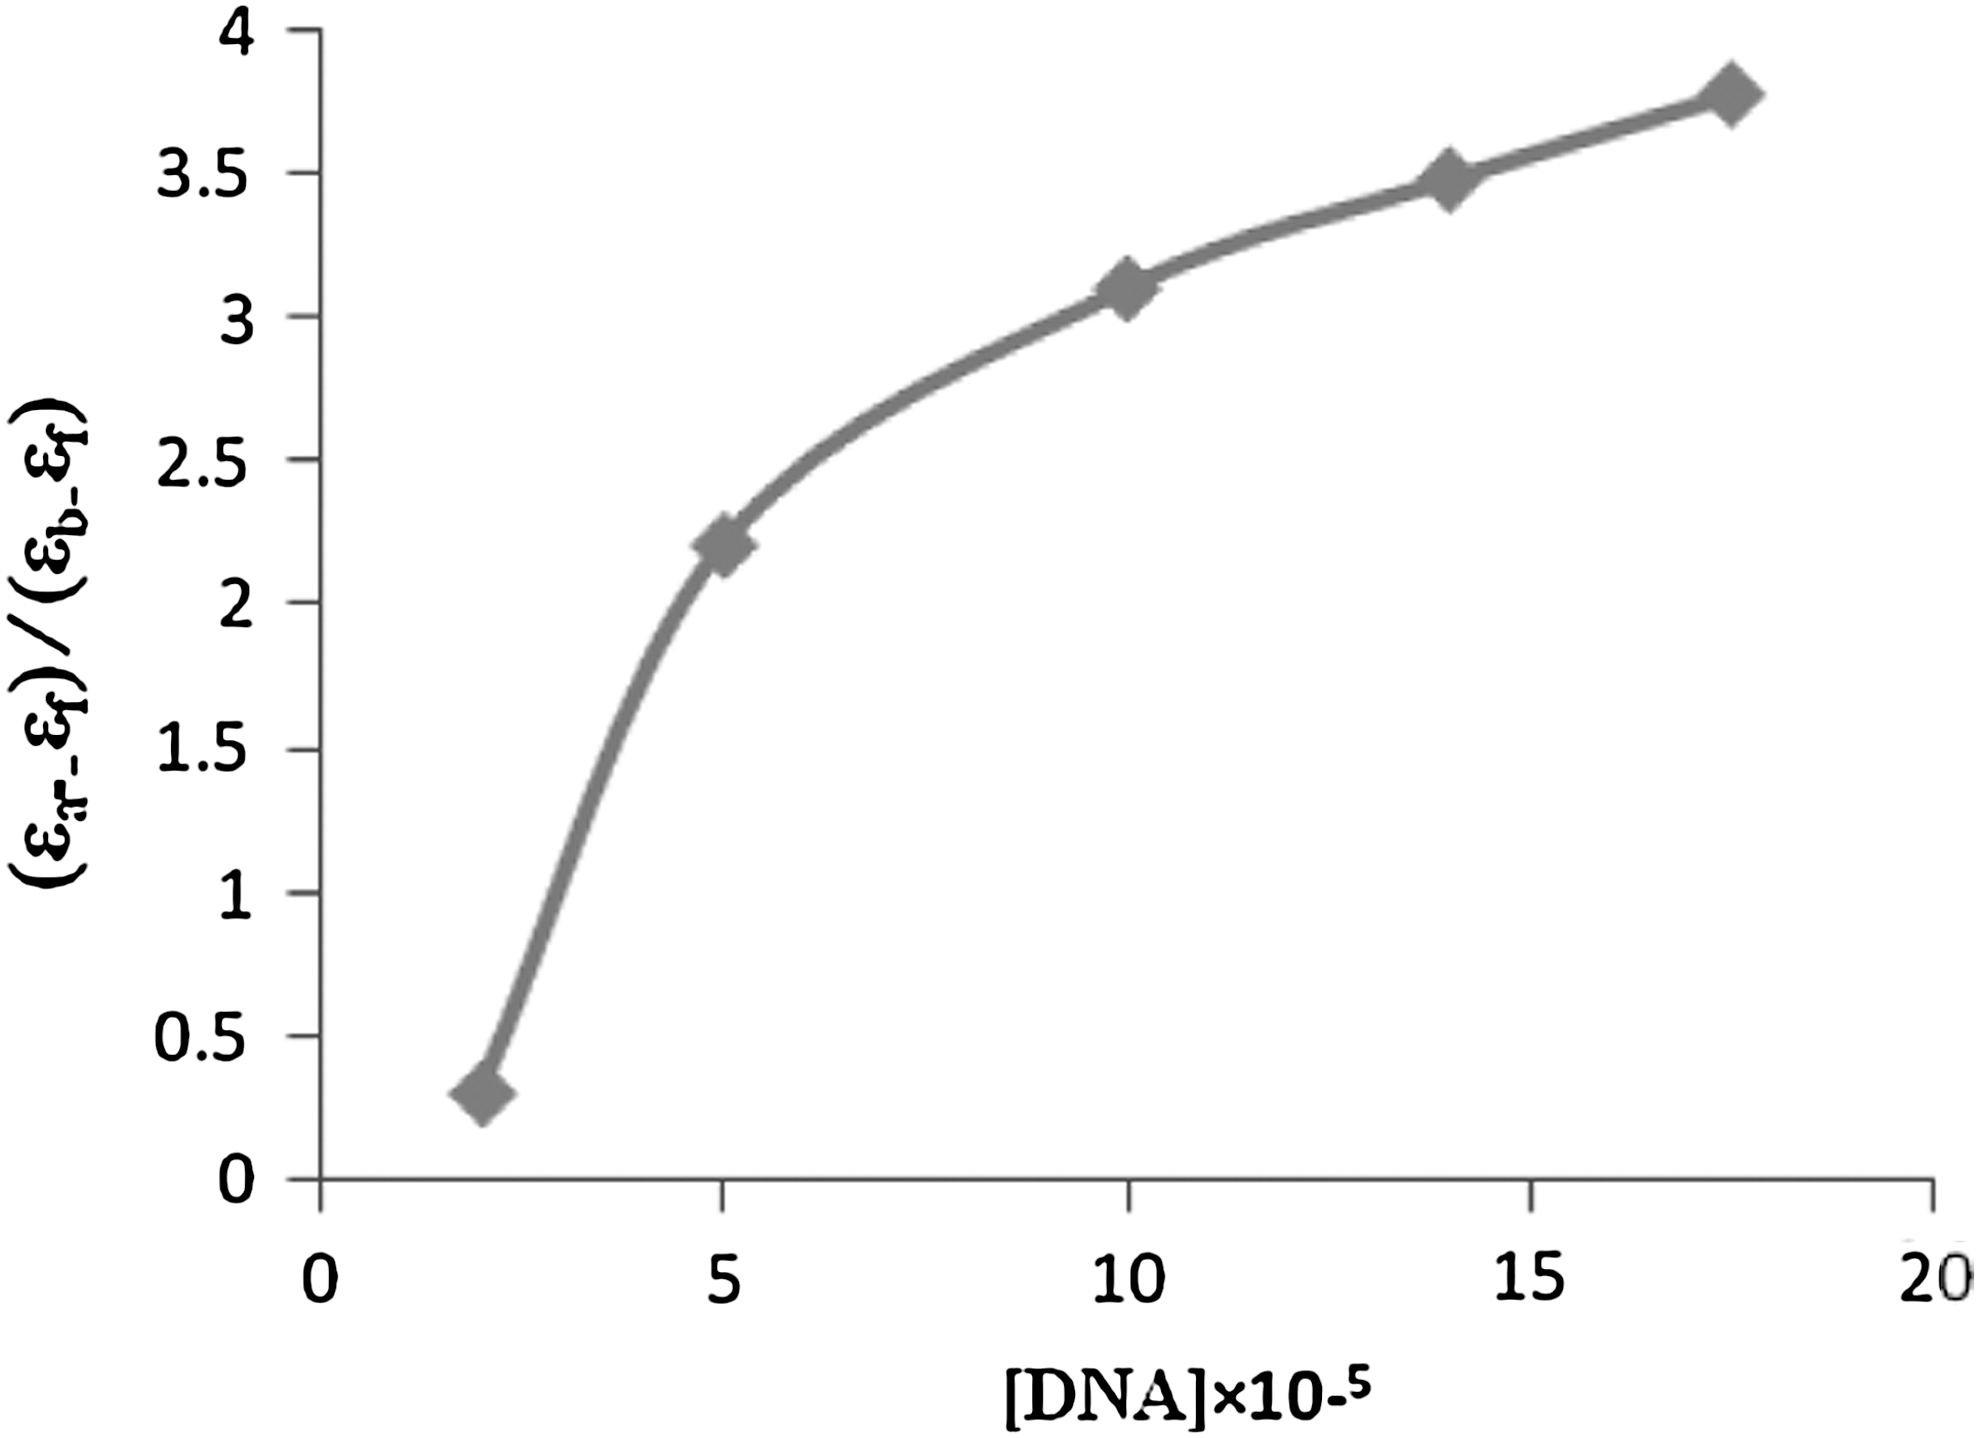
The plot of [DNA]/(ɛ a−ɛ f) versus [DNA].
Circular dichroism studies
The difference in absorption of polarized light gives rise to a CD spectrum, which can distinguish subtle changes in DNA conformational changes in solution (Roy et al., 2009). The CD spectrum of the CT-DNA exhibits a positive band at 270 nm due to base stacking and a negative band at 240 nm due to helixity of B-DNA (Fasman, 1996). Different platinum drugs react with DNA with different modes of binding; CD studies may support the prediction of the mode of interaction (Roy et al., 2009). In the presence of this platinum(II) complex, a red shift of nearly 4 nm of the positive band was observed at room temperature and the intensities of both the negative and positive bands decrease significantly (shifting to zero levels) (Fig. 4). This suggests that the DNA binding of the complex induces certain conformational changes, such as the conversion from a more B-like to a more C-like structure within the DNA molecule (Fasman, 1996; Mahadevan and Palaniandavar, 1998). In addition, the Pt(II) complex may have a more evident effect on base stacking than on the polynucleotide helicity of DNA (Shi et al., 2006). The complex interaction effectively screens the negative charge on N(7) base sites as well as phosphate oxygen atoms simultaneously, both along the deoxyribophosphate backbone and in the groove of the helix to promote a transconformational change from a more B-like to a more C-like structure (Shahabadi et al., 2009). Thus, the main interaction of this complex with DNA can be ascribed to the intercalation of the planar phenanthroline ligand into the DNA base pairs. The supporting spectral feature for this type of red shift of the positive ellipticity band is gold (III) complexes of terpyridine derivatives (Shi et al., 2006) and for two Pt(II) compounds such as [Pt(dpa)(NH3)2](NO3)2 and [Pt(dipm)(NH3)2](NO3)2, where dpa=bis(pyridine-2-yl)amine (Roy et al., 2009).
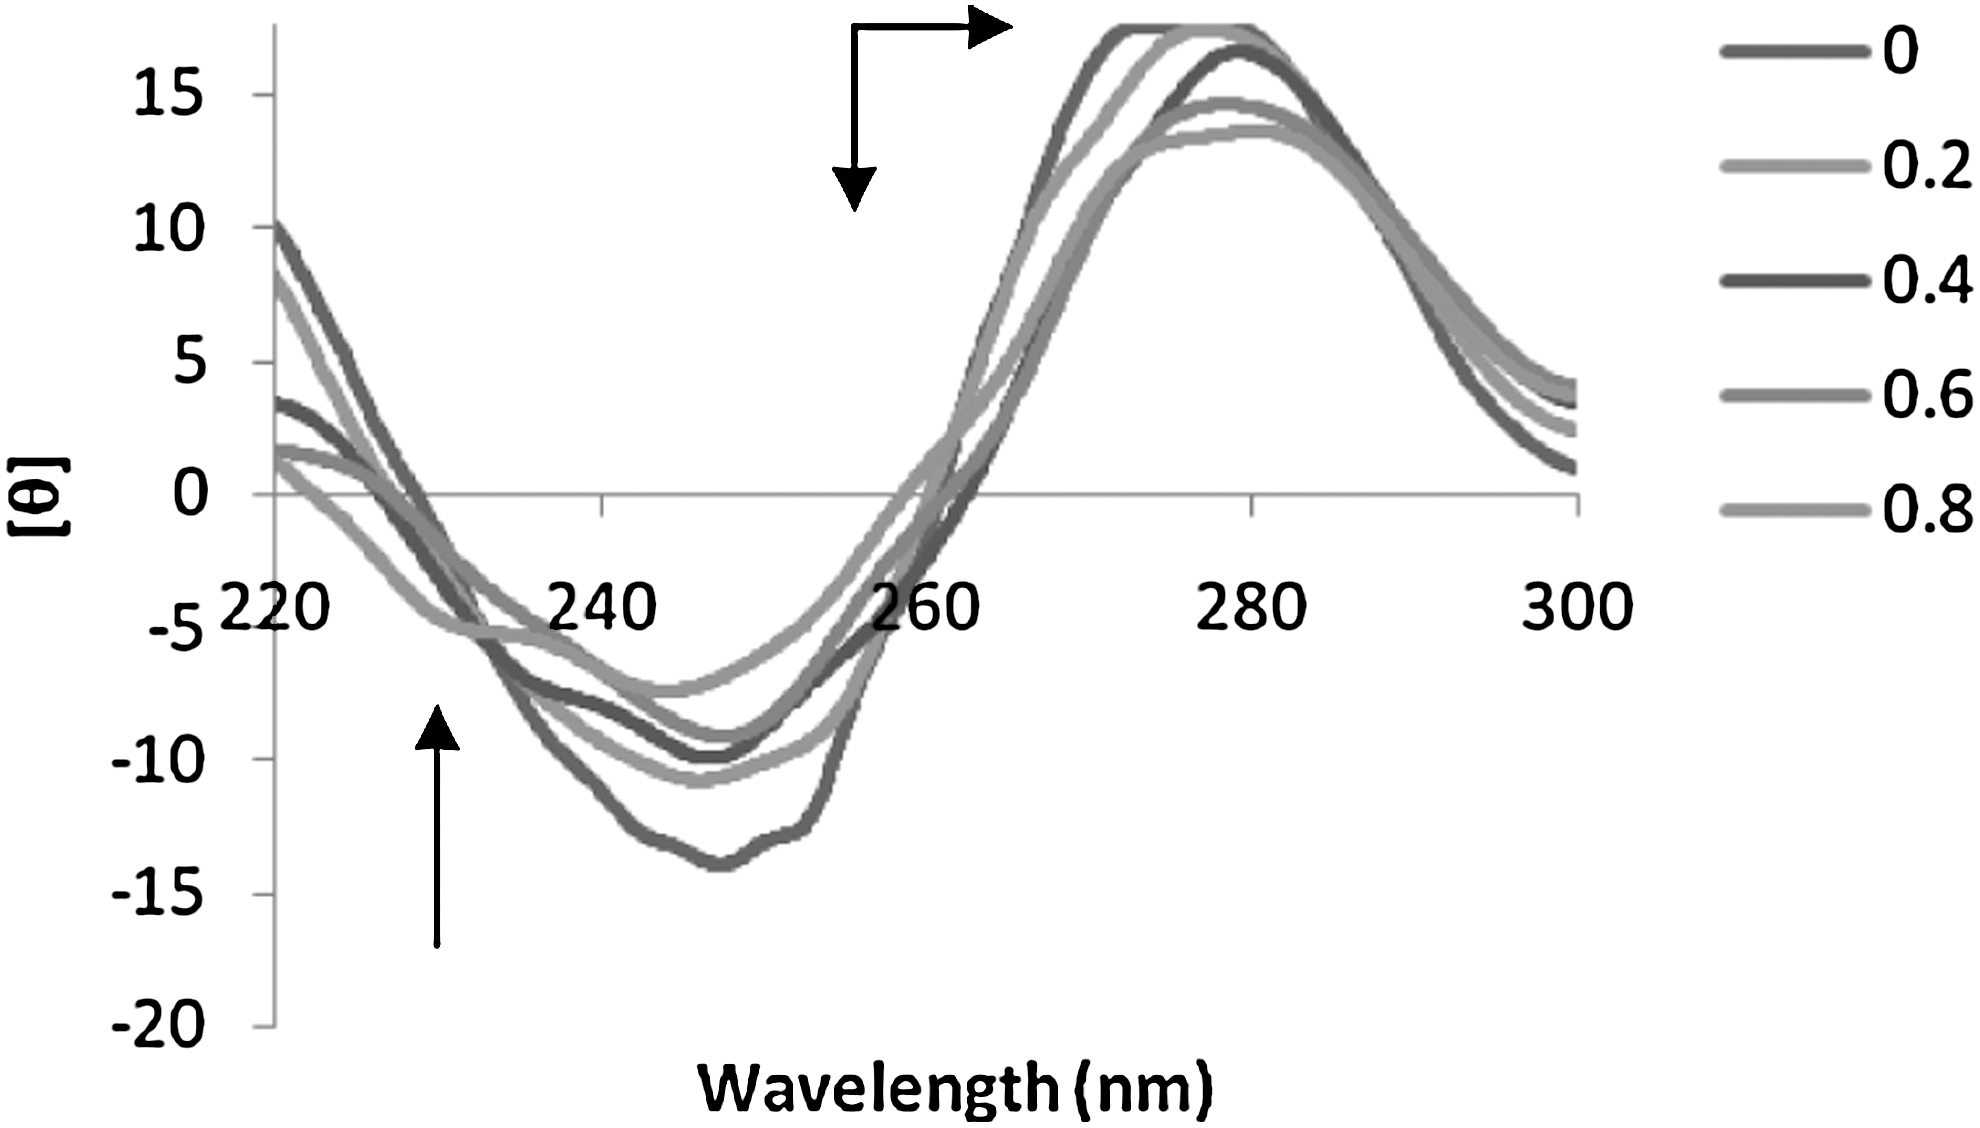
Circular dichroism spectra of DNA (8×10⁻⁵) in 50 mM Tris- HCl buffer in the presence of increasing amounts of Pt(II) complex (r i=[Pt(II) complex]/[DNA]=0.0, 0.2, 0.4, 0.6, 0.8).
Fluorescence spectroscopic studies
As the [Pt(phen)(His)]+ complex is luminescent in the absence of DNA, it does show appreciable increase in emission upon addition of CT-DNA (Fig. 5). This figure shows that a regular increase in the fluorescence intensity of the [Pt(phen)(His)]+ complex took place upon increasing the concentration of DNA. This marked increase in emission intensity also agrees with finding obtained with other intercalators (Wang et al., 2006; Li et al., 2008). These fluorescence enhancements indicate that the [Pt(phen)(His)]+ complex interacted with DNA and the quantum efficiency of [Pt(phen)(His)]+ was increased like to quenching process; the enhancement constant can be obtained by Equation (4) (Shahabadi et al., 2009).
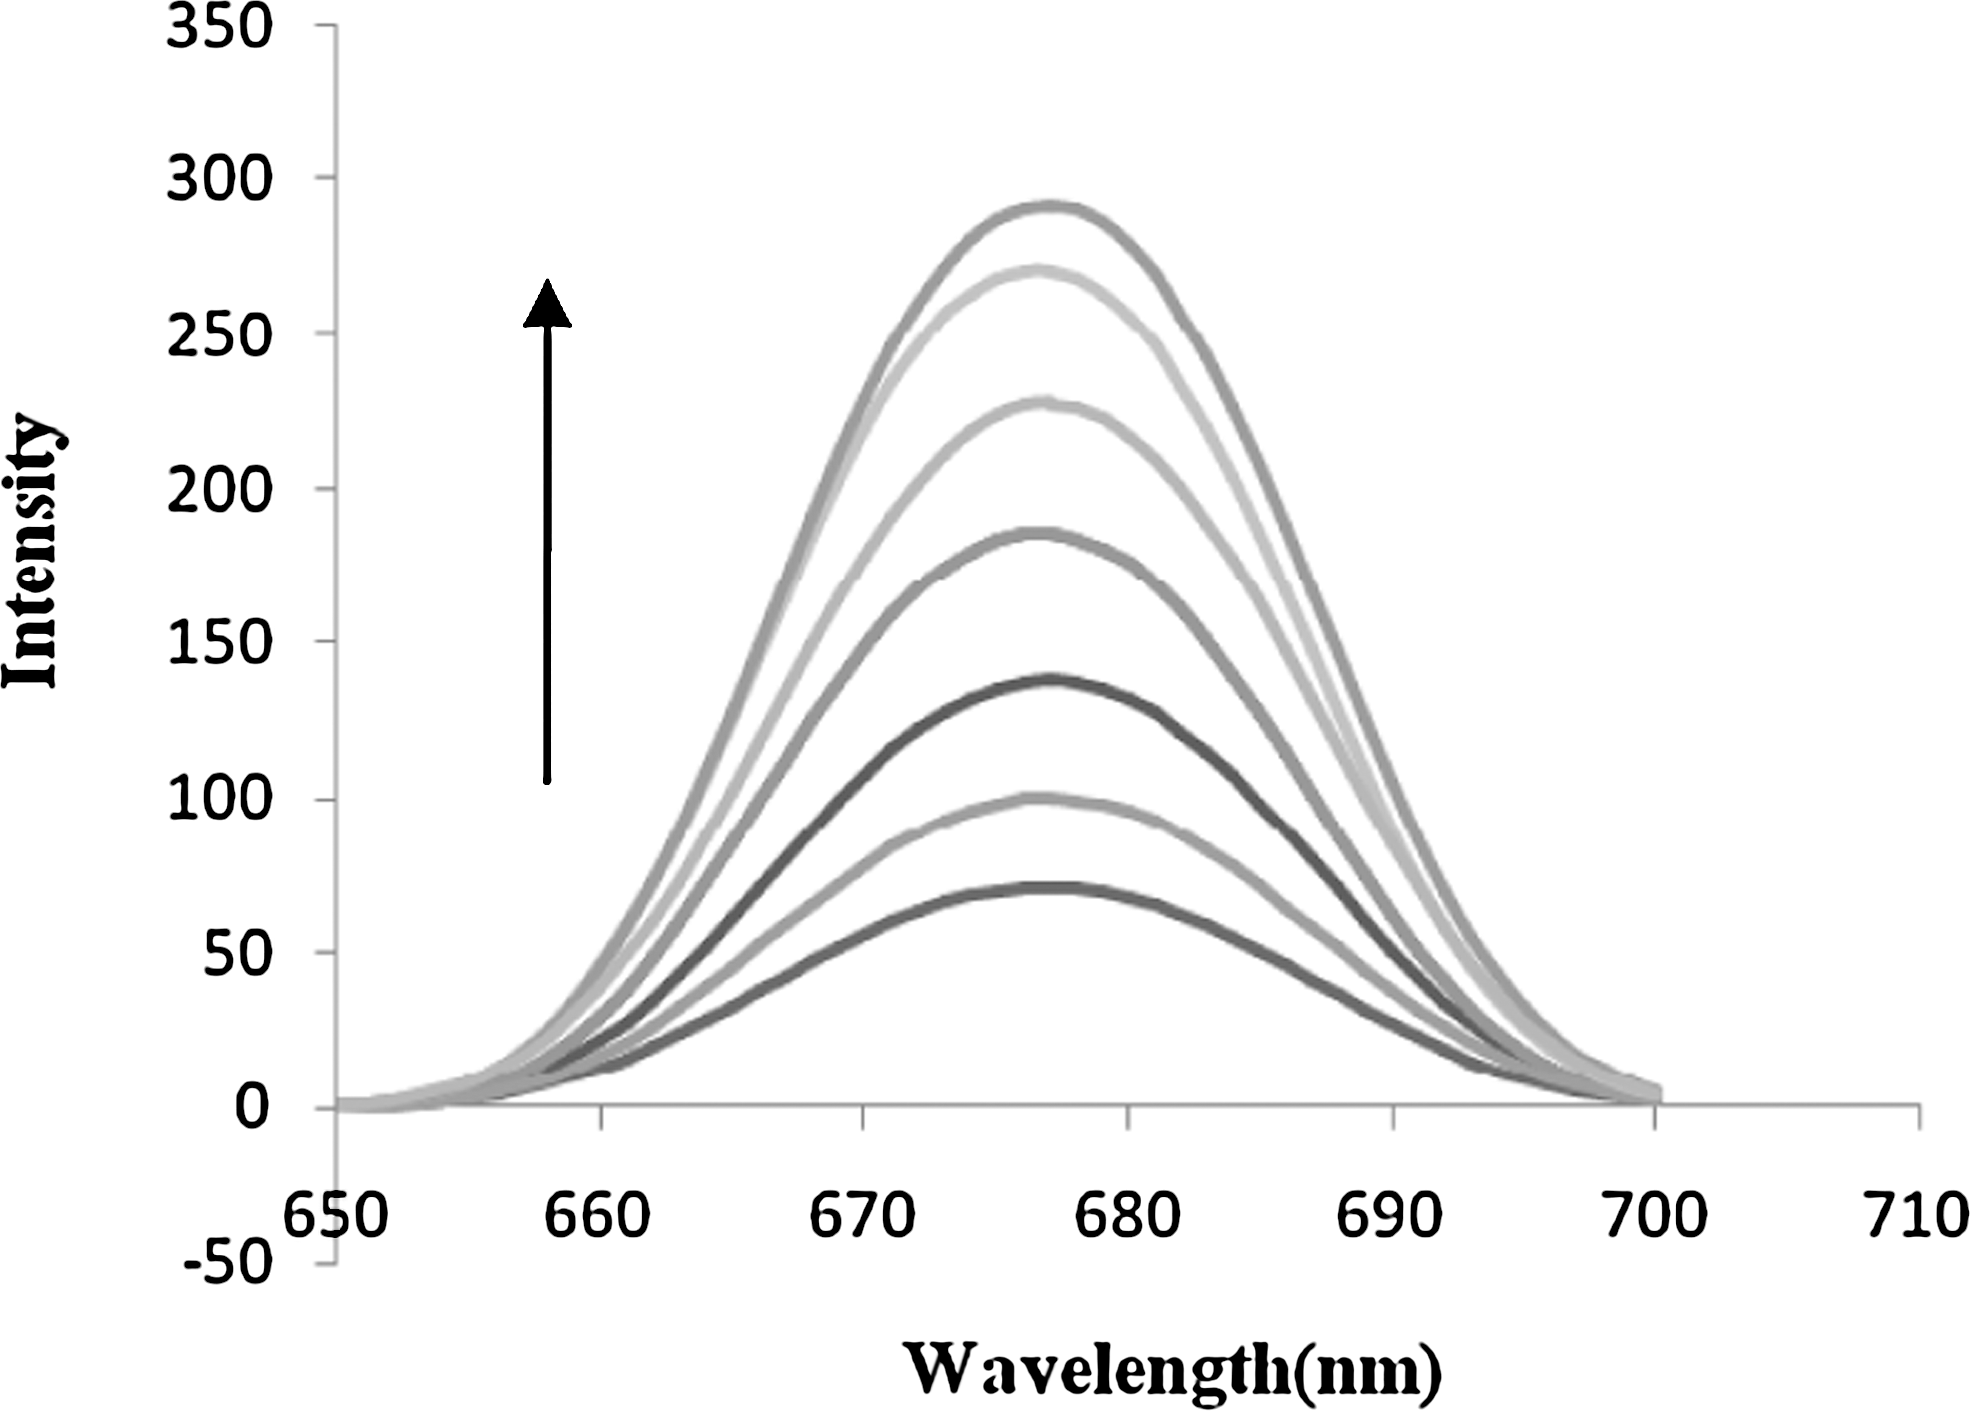
Fluorescence spectra of the Pt(II) complex in the absence and presence of increasing amounts of DNA at 37°C. r i= [DNA]/[complex]=0.0, 0.05, 0.1, 0.2, 0.3, 0.4, 0.45.
If dynamic process is a part of the enhancing mechanism, then Equation (4) can be written as follows (Shahabadi et al., 2009):
Where k
D is the dynamic enhancement constant (like to a dynamic quenching constant), k
B is the bimolecular enhancement constant (like to a bimolecular quenching constant), and τ
0 is the lifetime of the fluorophore in the absence of the enhancer. The dynamic enhancement constants of the Pt(II) complex at different temperatures were calculated using Equation (5) (Fig. 6; Table 1). By considering the equivalency of the bimolecular quenching and enhancement constants, it can be seen that the latter is greater than the largest possible value (1.0×10¹⁰ M−1 s−1) in aqueous solutions. Since fluorescence lifetimes are typically near 10−8 s, the bimolecular enhancement constant (k
B) was calculated from kD=kBτ0
(Table 1). The data show that the fluorescence intensity at 677 nm increases in the presence of CT-DNA. These changes in fluorescence intensity were used to estimate Kf
and n for the binding of the complex to CT-DNA from the following equation (Haq, 2002):
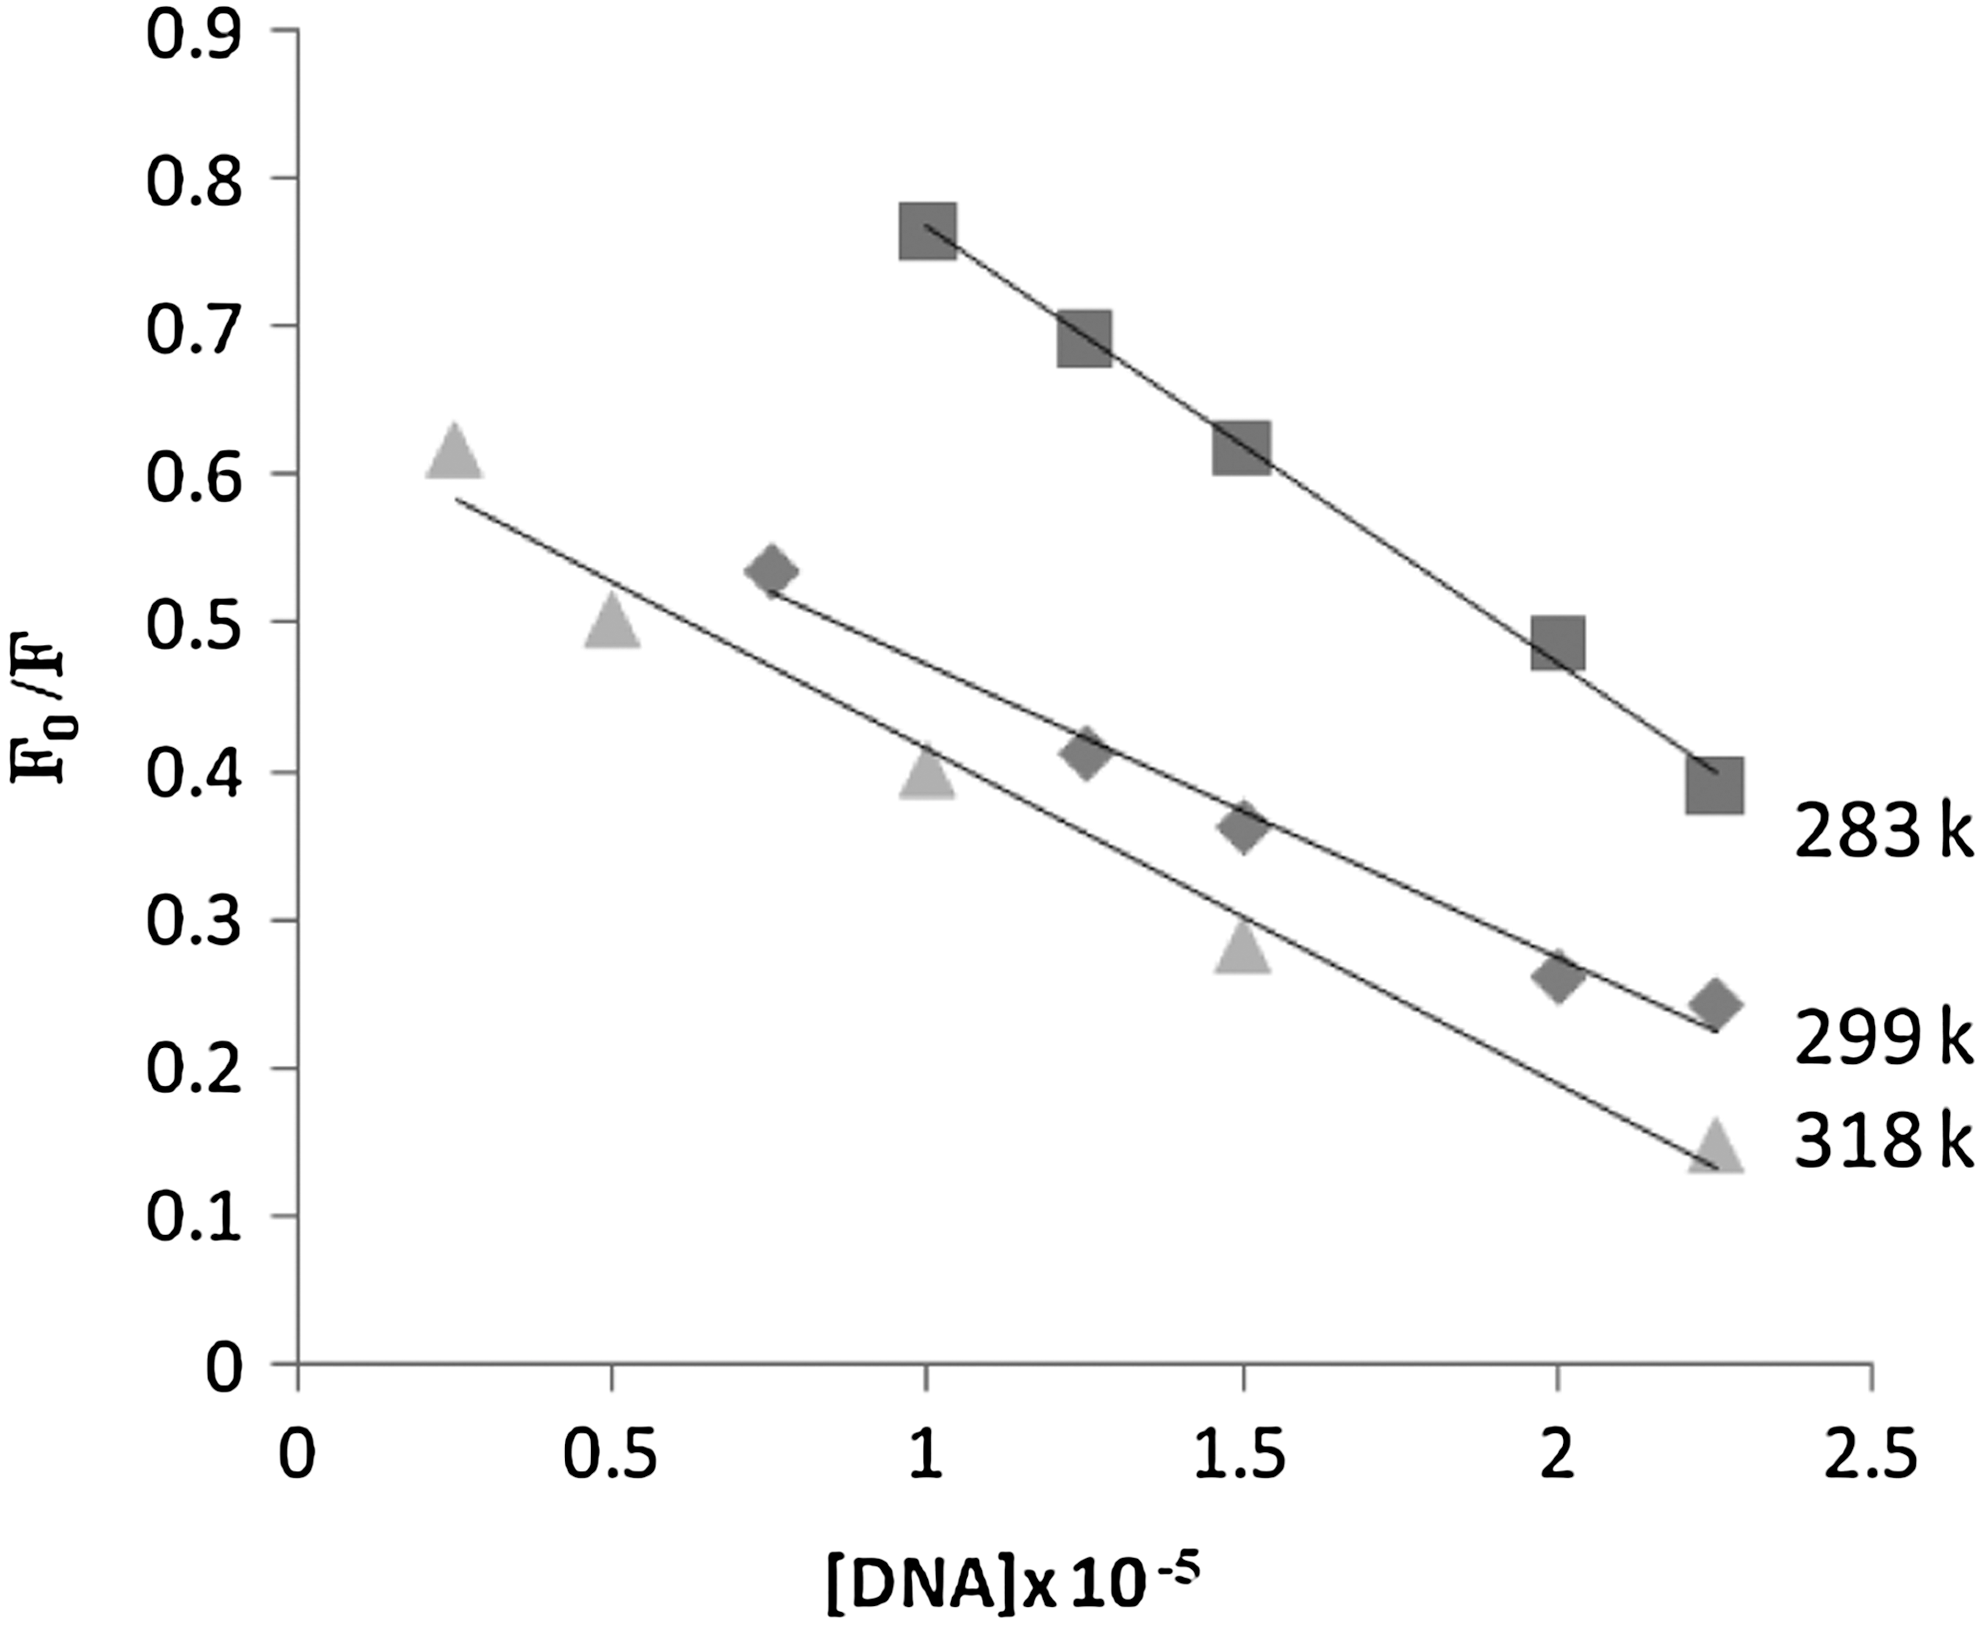
Stern–Volmer plots for the observed fluorescence enhancement of the Pt(II) complex upon addition of CT-DNA at different temperatures.
Here, F0
and F are the fluorescence intensities of the fluorophore in the absence and presence of different concentrations of CT-DNA, respectively. In the case of enhanced emission intensity, that is, F0
<F, Equation 6 becomes (Shahabadi et al., 2009):
From the number of binding sites, it is possible to distinguish between intercalating and nonintercalating binding agents (Krishna et al., 1998). The linear equations for log (F−F 0)/F versus log [DNA] at different temperature values are shown in Table 2. The number of binding sites (n) of the CT-DNA molecules is 0.49–1.15 and varies with variation of temperature, which indicates that with increase in temperature the accessibility of the fluorophore to the enhancer changes. The fluorescence enhancement is not initiated by a dynamic process; it is suggested that a static process involves complex formation in the ground state (Shahabadi et al., 2009).
Viscosity measurements
Viscosity measurements were used to clarify the interaction between the complex and DNA. Optical photophysical probes provide necessary but not sufficient clues to support the binding model. Hydrodynamic measurements that are sensitive to the length change (i.e., viscosity and sedimentation) are regarded as the least ambiguous tests of a binding model in solution in the absence of crystallographic structural data (Kashanian et al., 2008). The classical intercalation model demands that the DNA helix lengthens as base pairs are separated to accommodate the binding ligand, leading to increase in DNA viscosity (Mahadevan and Palaniandavar, 1998; Satyanarayana et al., 1992). In contrast, a partial and or nonclassical intercalation ligands could bend (or kink) the DNA helix, reduce its effective length, and concomitantly its viscosity, while ligands that bind exclusively in the DNA grooves (e.g., netropsin and distamycin), under the same conditions, typically cause less-pronounced changes (positive or negative) or no changes in DNA solution viscosity (Kelly et al., 1985). The classical organic intercalators such as ethidium bromide increase the axial length of the DNA and it becomes more rigid (Long and Barton, 1990) resulting in an increase in the relative viscosity. To further explore the binding mode of the complex, viscosity measurements were carried out on CT-DNA exposed to increasing concentrations of the complex. The values of relative specific viscosity (η/η0)1/3 (where η0 and η are the specific viscosity contributions of DNA in the absence and in the presence of the Pt complex, respectively) were plotted against [complex]. A series of solutions that contained a fixed concentration of DNA and various concentrations of [Pt(phen)(His)]+ complex were made. The changes in relative viscosity of DNA with increasing concentrations of Pt(II) complex are shown in Figure 7. Since the interaction of this platinum(II) complex with DNA can make DNA longer, we would expect that the relative viscosity of DNA increases with a slope between 0 and 0.96 (a value measured for ethidium bromide) (Li et al., 2006) if the intercalation of the Pt(II) complex was either only one interaction mode or much stronger than other interaction(s). However, the relative viscosity of DNA increases with a slope of 0.39 (Fig. 7); thus, there may be other interaction(s) between DNA and the Pt(II) complex occurring. In addition, the DNA binding constant measured for this Pt(II) complex is 10 orders of magnitude lower than that determined for ethidium bromide.
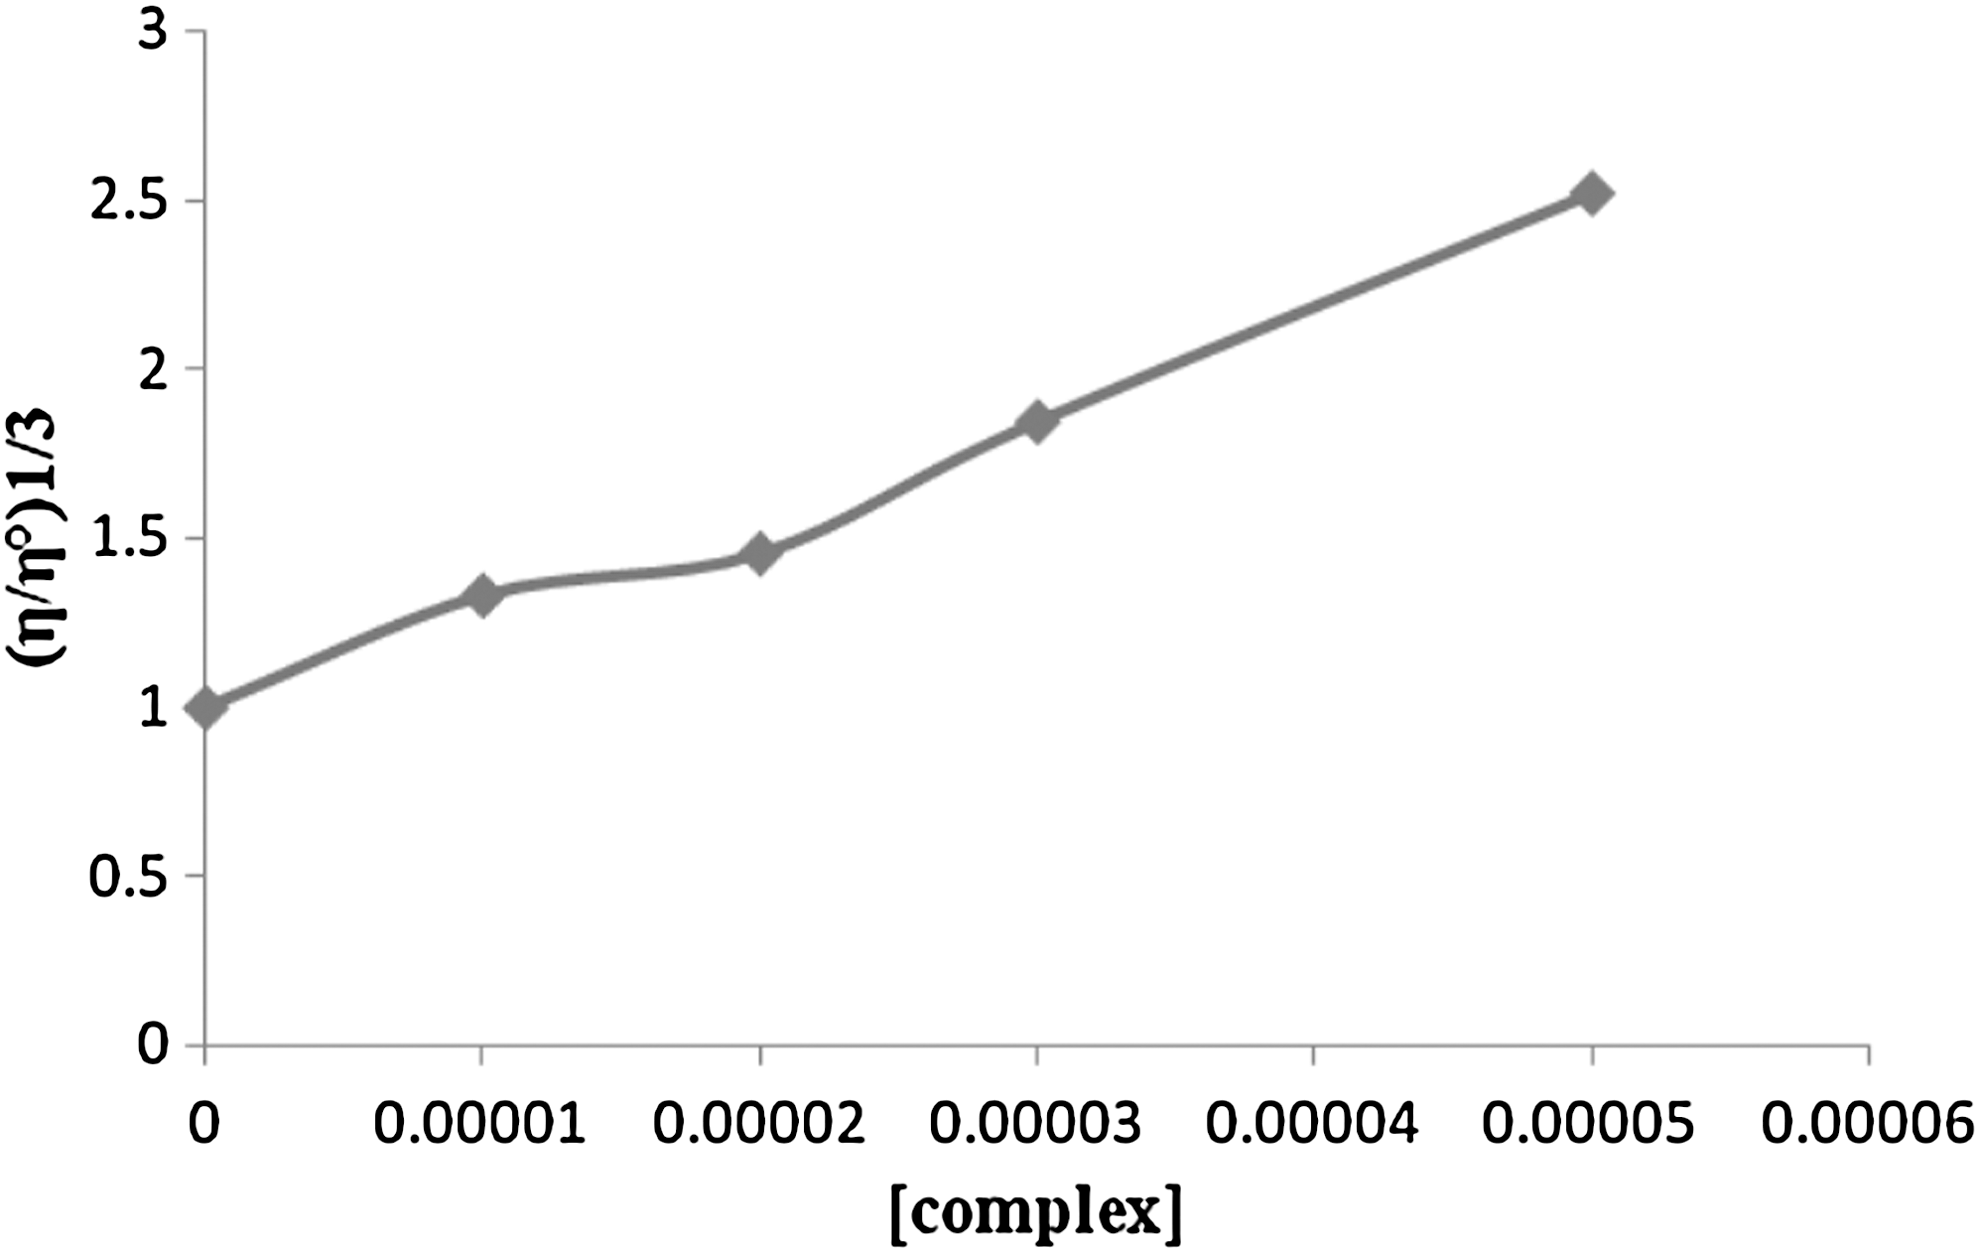
Effect of increasing amounts of Pt(II) complex on the viscosity of CT-DNA (5×10⁻⁵ M) in 50 mM Tris-HCl buffer (r i=0.0, 0.2, 0.4, 0.6, 0.8, 1).
Thermodynamic parameters of DNA binding
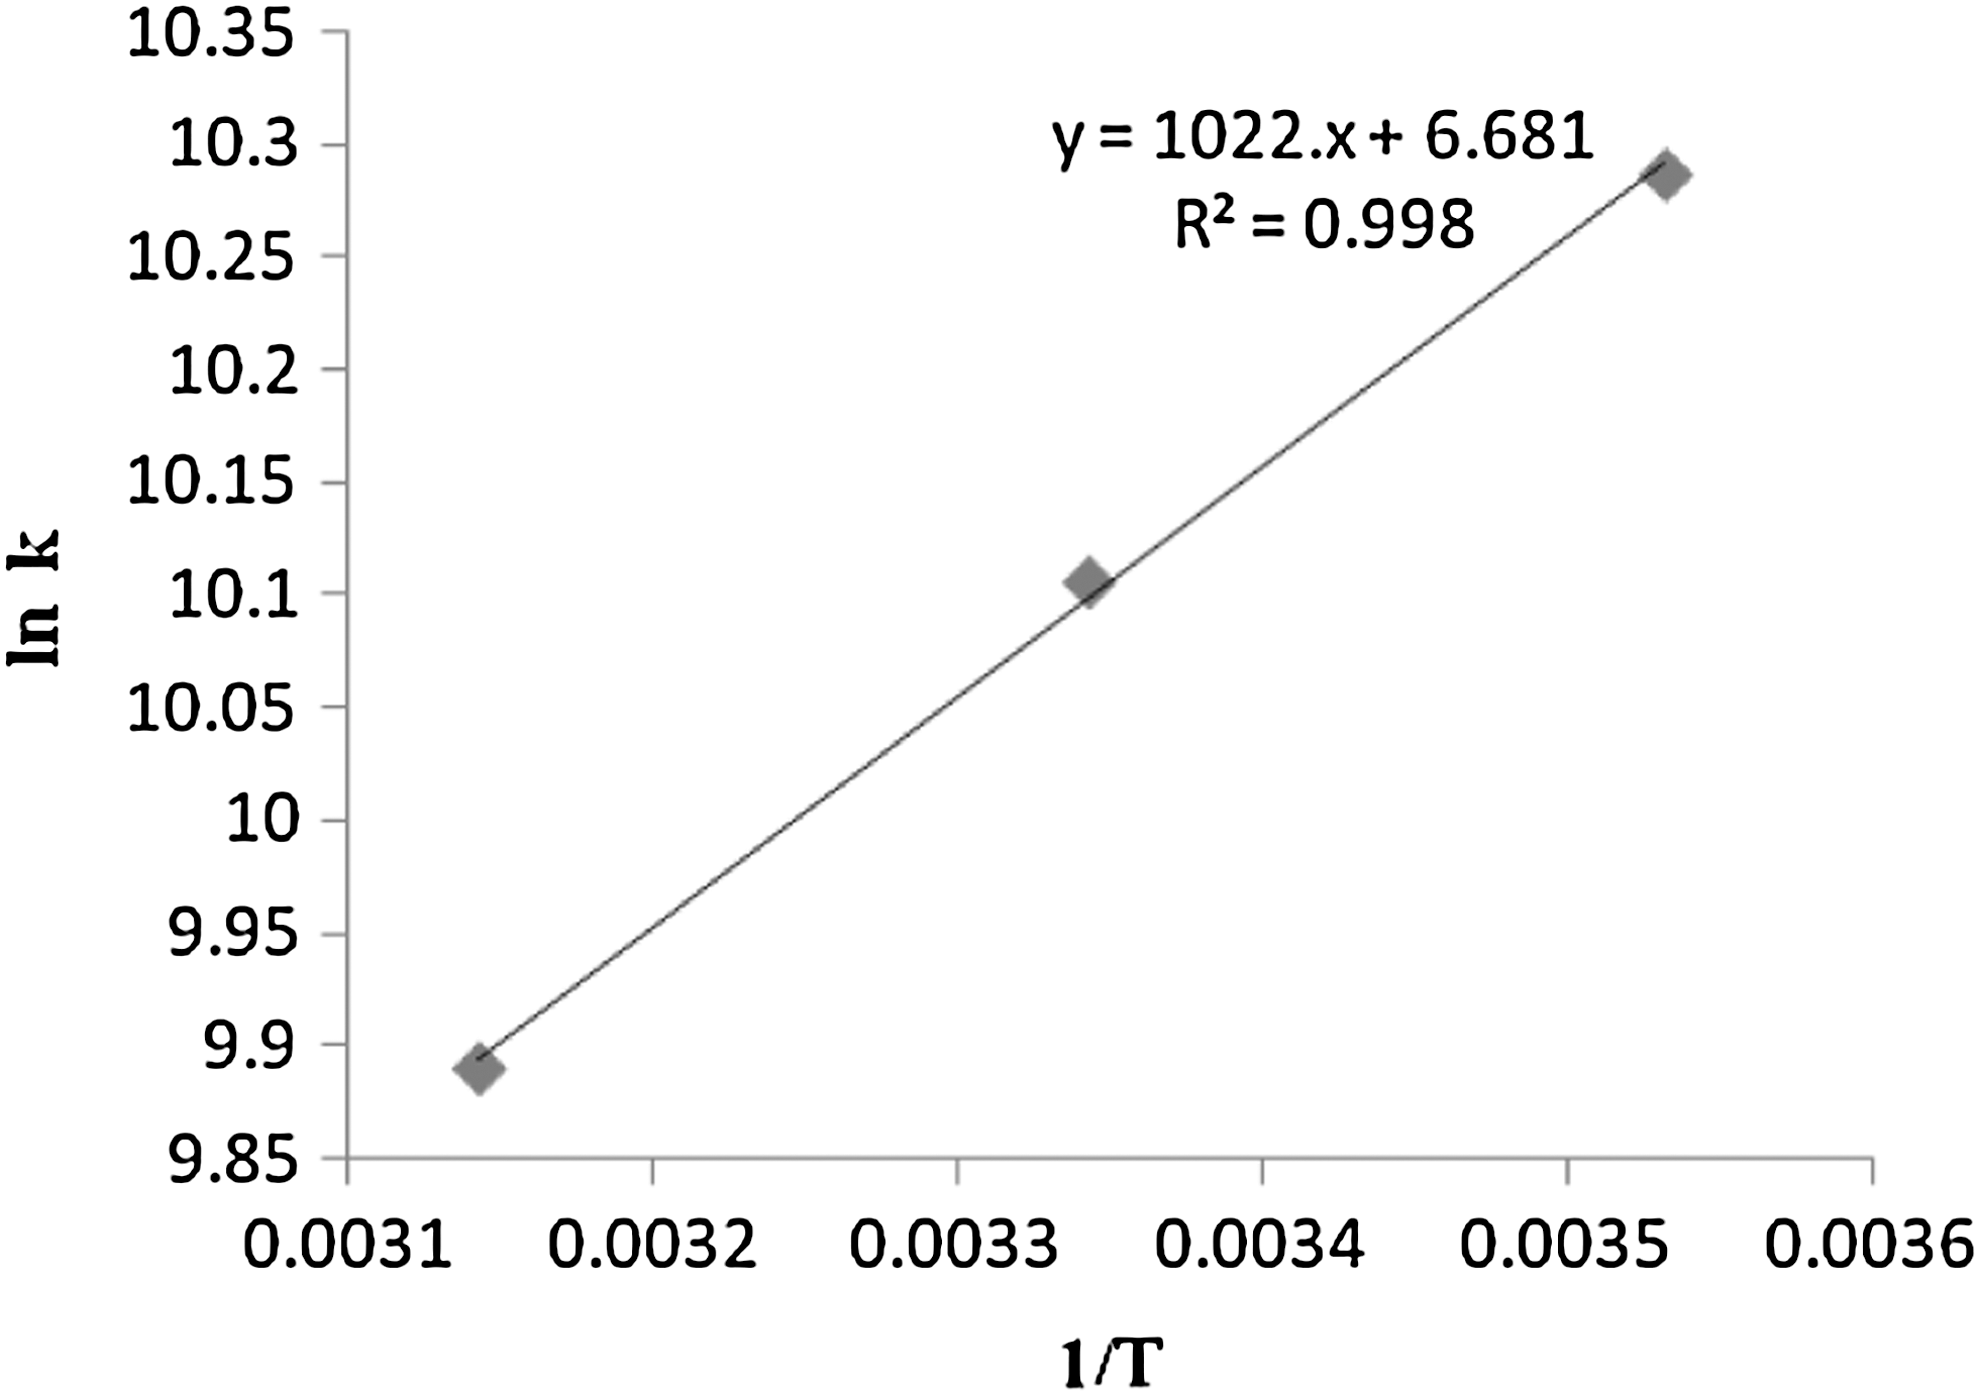
The evaluation of formation constant for the [Pt(phen)(His)]+–DNA complex at three different temperatures (283, 299, and 318 K) allows determination of thermodynamic parameters including enthalpy (ΔH) and entropy (ΔS) changes of [Pt(phen)(His)]+–DNA formation by van't Hoff equation and plotting ln K
f versus 1/T (Fig. 8). The positive slope of the plot (−ΔH/R, R is the gas constant) indicates that the reaction of DNA with [Pt(phen)(His)]+ complex is exothermic and enthalpy favored (Shahabad and Fatahi, 2010). The ΔH and ΔS values of the [Pt(phen)(His)]+–DNA complex were −3.57±0.6 kJ/mol and +55 J mol−1 K−1, respectively. In general, electrostatic interactions exhibit very small enthalpy and positive entropy changes. Hydrophobic interactions are generally indicated by positive enthalpy and entropy changes. Hydrogen bonding and van der Waals interactions are usually characterized by negative standard enthalpies of interaction (Eichhorn and Shin, 1968; Satyanarayana et al., 1993). The interaction model between complex and bimolecule can be determined from enthalpy changes (ΔH) and entropy changes (ΔS) (Yang et al., 2008): (1) ΔH>0 and ΔS>0, hydrophobic forces; (2) ΔH<0 and ΔS<0, van der Waals interactions and hydrogen bonds; (3) ΔH<0 and ΔS>0, electrostatic interactions (Shahabadi and Fatahi, 2010). Positive entropy change could be due to the π-stacking interactions of the planar phenanthroline (phen) and ring imidazole of histidine bases into the DNA base pair in an interior hydrophobic medium of DNA causing significant release of the counter ions, namely, Na+ into the bulk of the solvent (Roy et al., 2009). Based on the binding constants at different temperatures, the free energy change (ΔG) can be estimated by the following equation:
Van't Hoff plot for the interaction of DNA and Pt(II) complex at pH 7.4.
The temperatures used were 283, 299, and 318 K. Table 3 shows the values of ΔH and ΔS. The positive entropy change is evidence of a hydrophobic interaction (Tian et al., 2005) because the water molecules that are arranged in an orderly fashion around the drug and DNA acquire a more random configuration. The negative ΔH value observed cannot be attributed to electrostatic interactions since for electrostatic interactions ΔH is very small, almost zero (Ross and Subramanian, 1981; Chen et al., 2008b). A negative ΔH value will be obtained whenever there is a hydrogen bonding. Therefore, hydrophobic forces and hydrogen bonds may play main role in the binding of Pt(II) complex to DNA. Similar results were found by Cummings (2009). The negative values of standard Gibbs free energy (ΔG=−RT ln K) indicate the spontaneity of the binding interaction of this complex with DNA (Muhammad et al., 2009).
Conclusion
We have studied the binding of CT-DNA with a Pt(II) complex. The intrinsic binding constant (K b=8±0.2×10⁴ M−1) is similar to intercalators. The thermodynamic parameters (ΔH<0 and ΔS>0) showed that the increase in entropy caused by the reaction with the complex arises either from the release of water molecules and cation equivalent from the CT-DNA due to binding or due to intercalation, and these results indicate that complexation between CT-DNA and complex occurs primarily through hydrophobic interaction. The negative ΔG value for interaction of CT-DNA with the complex indicates spontaneity of the complexation. Further, increase in viscosity was explained by a model in which ligands were bound by a classical intercalation mode. Circular dichroism changes of CT-DNA are characteristic of transition of a B-form DNA to C-DNA. These results suggest that the complex binds to DNA via intercalative and hydrogen bonding mode.
Footnotes
Acknowledgments
The authors are grateful for the financial support of the Razi University Research Center of Iran.
Disclosure Statement
No competing financial interests exist.