
Abstract
Three new ruthenium(II) polypyridyl complexes [Ru(bpy)2(BHIP)]2+
Introduction
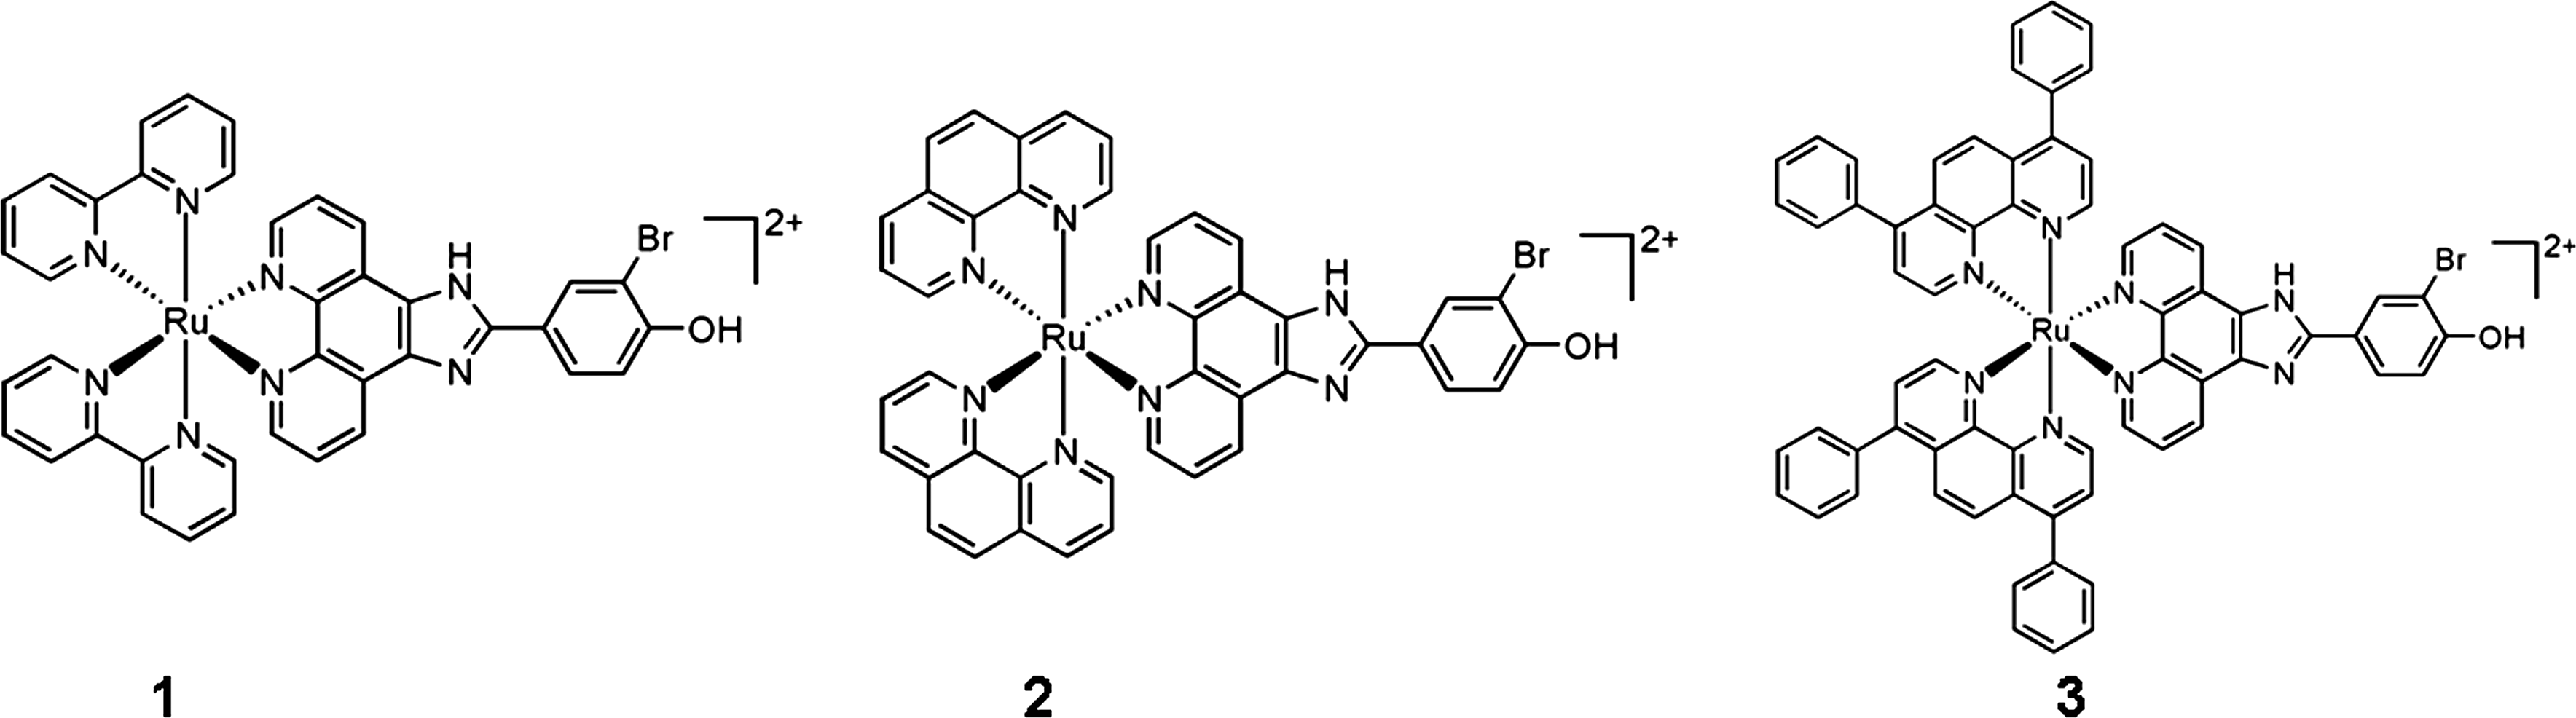
The structure of complexes
Materials and Methods
Synthesis of BHIP (2-(3-bromo-4-hydroxyphenyl)[4,5]imidazo[1,10]phenanthroline)
A mixture of 1,10-phenanthroline-5,6-dione (0.315 g, 1.5 mmol) (Yamada et al., 1992), 3-bromo-4-hydroxyphenylaldehyde (0.302 g, 1.5 mmol), ammonium acetate (2.31 g, 30 mmol), and glacial acetic acid (30 mL) was refluxed with stirring for 2 h. The cooled solution was diluted with water and neutralized with concentrated aqueous ammonia. The precipitate was collected and purified by column chromatography on silica gel (60–100 mesh) with ethanol as eluent to give the compound as yellow powder. Yield: 80%. Anal. Calcd. for C19H11N4BrO: C, 58.33; H, 2.83; N, 14.32; Found: C, 58.18; H, 2.95; N, 14.47%. Fast atom bombardment mass spectra (FAB-MS): m/z=392.3 [M+1]+. 1H NMR (500 MHz, dimethyl sulfoxide [DMSO]–d6 ): 9.92 (d, 2H, J=6.0 Hz), 8.89 (d, 2H, Hi, J=8.0 Hz), 8.41 (d, 1H, J=2.5 Hz), 7.22 (d, 1H, J=6.5 Hz), 7.82 (dd, 2H, J=4.5, J=4.5 Hz), 7.15 (d, 1H, J=8.0 Hz), 3.40 (s, 1H, HO-H).
Synthesis of [Ru(bpy)2(BHIP)](ClO4)2 (1 )
A mixture of cis-[Ru(bpy)2Cl2]·2H2O (0.260 g, 0.5 mmol) (Sullivan et al., 1978) and BHIP (0.196 g, 0.5 mmol) in ethanol (30 mL) was refluxed under argon for 8 h to give a clear red solution. Upon cooling, a red precipitate was obtained by dropwise addition of saturated aqueous NaClO4 solution. The crude product was purified by column chromatography on a neutral alumina oxide with a mixture of CH3CN-toluene (3:1, v/v) as eluent. The red band was collected. The solvent was removed under reduced pressure and a red powder was obtained. Yield: 70%. Anal. Calcd. for C39H27BrCl2N8O9Ru: C, 46.68; H, 2.71; N, 11.17; Found: C, 46.52; H, 2.55; N, 11.05%. ESI-MS [CH3CN, m/z]: 803.5 ([M–2ClO4–H]+), 402.3 ([M–2ClO4]2+). 1H NMR (500 MHz, DMSO-d6 ): δ 9.10 (d, 2H, J=8.1 Hz), 8.85 (dd, 4H, J=8.2, J=8.2 Hz), 8.50(d, 1H, J=5.5 Hz), 8.17–8.23 (m, 4H), 8.08 (t, 2H, J=6.64 Hz), 7.91 (d, 2H, J=4.6 Hz), 7.80–7.85 (m, 4H), 7.58 (d, 4H, J=5.6 Hz), 7.35 (t, 1H, J=6.0 Hz), 7.10 (d, 1H, J=8.5 Hz), 3.38 (s, 1H, HO-H).
Synthesis of [Ru(phen)2(BHIP)](ClO4)2 (2 )
This complex was synthesized in a manner identical to that described for complex
Synthesis of [Ru(dip)2(BHIP)](ClO4)2 (3 )
This complex was synthesized in a manner identical to that described for complex
Caution
Perchlorate salts of metal compounds with organic ligands are potentially explosive, and only small amounts of the material should be prepared and handled with great care.
Physical measurements
CT-DNA was obtained from the Sino-American Biotechnology Company. pBR322 DNA was obtained from Shanghai Sangon Biological Engineering & Services Co., Ltd. DMSO and RPMI 1640 were purchased from Sigma. Cell lines of hepatocellular origin (BEL-7402), Human epithelial carcinoma (Hela), breast cancer (MCF-7), and Human osteosarcoma (MG-63) were purchased from American Type Culture Collection, agarose and ethidium bromide (EB) were obtained from Aldrich. RuCl3·χH2O was purchased from Kunming Institution of Precious Metals. 1,10-phenanthroline was obtained from Guangzhou Chemical Reagent Factory. Double distilled water was used to prepare buffers (5 mM Tris(hydroxymethylaminomethane)-HCl, 50 mM NaCl, pH=7.2). A solution of CT-DNA in the buffer gave a ratio of UV absorbance at 260 and 280 nm of ca. 1.8–1.9:1, indicating that the DNA was sufficiently free of protein (Marmur, 1961). The DNA concentration per nucleotide was determined by absorption spectroscopy using the molar absorption coefficient (6600 M−1 cm−1) at 260 nm (Reichmann et al., 1954).
Microanalysis (C, H, and N) was carried out with a Perkin-Elmer 240Q elemental analyzer. FAB-MS were recorded on a VG ZAB-HS (fast atom bombardment) spectrometer in a 3-nitrobenzyl alcohol matrix. ESI-MS were recorded on a LCQ system (Finnigan MAT) using methanol as mobile phase. The spray voltage, tube lens offset, capillary voltage, and capillary temperature were set at 4.50 kV, 30.00 V, 23.00 V, and 200°C, respectively, and the quoted m/z values are for the major peaks in the isotope distribution. 1H NMR spectra were recorded on a Varian-500 spectrometer. All chemical shifts were given relative to tetramethylsilane. UV/Vis spectra were recorded on a Shimadzu UV-3101PC spectrophotometer and emission spectra were recorded on a Shimadzu RF-4500 luminescence spectrometer at room temperature.
DNA binding and photoactivated cleavage
The DNA-binding and photoactivated cleavage experiments were performed at room temperature. Buffer A (5 mM tris(hydroxymethyl)aminomethane (Tris) hydrochloride, 50 mM NaCl, pH 7.0) was used for absorption titration, luminescence titration, and viscosity measurements. Buffer B (50 mM Tris-HCl, 18 mM NaCl, pH 7.2) was used for DNA photocleavage experiments.
The absorption titrations of the complex in buffer were performed using a fixed concentration (20 μM) for complex to which increments of the DNA stock solution were added. Ru-DNA solutions were allowed to incubate for 5 min before the absorption spectra were recorded. The intrinsic binding constants K, based on the absorption titration, were measured by monitoring the changes in absorption at the metal-to-ligand charge transfer (MLCT) band with increasing concentration of DNA using the following equation (Carter et al., 1989).
where [DNA] is the concentration of CT-DNA in base pairs, the apparent absorption coefficients ɛ a, ɛ f, and ɛ b correspond to A obsed/[Ru], the absorbance for the free ruthenium complex, and the absorbance for the ruthenium complex in fully bound form, respectively. K is the equilibrium binding constant, C t is the total metal complex concentration and s is the binding site size.
For the gel electrophoresis experiment, supercoiled pBR322 DNA (0.1 μg) was treated with the Ru(II) complexes in buffer B, and the solution was then irradiated at room temperature with a UV lamp (365 nm, 10 W) for 45 min. The samples were analyzed by electrophoresis for 1.5 h at 80 V on a 0.8% agarose gel in TBE (89 mM Tris-borate acid, 2 mM EDTA, pH=8.3). The gel was stained with 1 μg/mL EB and photographed on an Alpha Innotech IS–5500 fluorescence chemiluminescence and visible imaging system.
Cytotoxicity assay
Standard MTT assay procedures were used (Mosmann, 1983). Cells were placed in 96-well microassay culture plates (8×10³ cells per well) and grown overnight at 37°C in a 5% CO2 incubator. The complexes tested were dissolved in DMSO and diluted with RPMI 1640 and then added to the wells to achieve final concentrations ranging from 10–6 to 10–4 M. Control wells were prepared by addition of culture medium (100 μL). Wells containing culture medium without cells were used as blanks. The plates were incubated at 37°C in a 5% CO2 incubator for 48 h. Upon completion of the incubation, stock MTT dye solution (20 μL, 5 mg mL–1) was added to each well. After 4 h incubation, buffer (100 μL) containing N,N-dimethylformamide (50%) and sodium dodecyl sulfate (20%) was added to solubilize the MTT formazan. The optical density of each well was then measured on a microplate spectrophotometer at a wavelength of 490 nm. The IC50 values were determined by plotting the percentage of viability versus concentration on a logarithmic graph and reading off the concentration at which 50% of cells remain viable relative to the control. Each experiment was repeated at least three times to get the mean values. Four different tumor cell lines were the subjects of this study: BEL-7402, Hela, MCF-7, and MG-63 (purchased from American Type Culture Collection).
Apoptosis assessment by morphology with acridine orange/EB staining
Apoptosis studies were performed with a staining method utilizing acridine orange (AO) and EB (Spector et al., 1998). According to the difference in membrane integrity between necrotic and apoptosis, AO can pass through cell membrane, but EB cannot. Under fluorescence microscope, live cells appear green. Necrotic cells stain red but have a nuclear morphology resembling that of viable cells. Apoptosis cells appear green, and morphological changes such as cell blebbing and formation of apoptotic bodies will be observed. A monolayer of BEL-7402 cells was incubated in the absence and presence of complex
Apoptotic assay by flow cytometry
After chemical treatment, 1×10⁶ cells were harvested, washed with phosphate-buffered saline (PBS), then fixed with 70% ethanol, and finally, maintained at 4°C for at least 12 h. Then, the pellets were stained with the fluorescent probe solution containing 50 μg/mL propidium iodide (PI) and 1 mg/mL annexin in PBS on ice in dark for 15 min. Then the fluorescence emission was measured at 530 nm and 575 nm (or equivalent) using 488 nm excitation by a FACS Calibur flow cytometer (Beckman Dickinson & Co.). A minimum of 10,000 cells were analyzed per sample.
Cellular uptake study
Cells were placed in 24-well microassay culture plates (4×10⁴ cells per well) and grown overnight at 37°C in a 5% CO2 incubator. Compounds tested were then added to the wells. The plates were incubated at 37°C in a 5% CO2 incubator for 24 h. Upon completion of the incubation, the wells were washed three times with phosphate buffered saline (PBS), after removing the culture media cells were visualized by fluorescent microscopy.
Cell cycle arrest
BEL-7402 cells were seeded into six-well plates (Costar; Corning Corp.) at a density of 2×10⁵ cells per well and incubated for 24 h. The cells were cultured in RPMI 1640 supplemented with 10% of fetal bovine serum (FBS) and incubated at 37°C and 5% CO2. The medium was removed and replaced with medium (final DMSO concentration, 1% v/v) containing the three complexes (25 μM). After incubation for 24 h, the cell layer was trypsinized, washed with cold PBS, and fixed with 70% ethanol. Twenty milliliters of RNAse (0.2 mg/mL) and 20 mL of PI (0.02 mg/mL) were added to the cell suspensions and incubated at 37°C for 30 min. Then the samples were analyzed by a FACS Calibur flow cytometer (Beckman Dickinson & Co.). The number of cells analyzed for each sample was more than 104 (Lo et al., 2008).
Results
Electronic absorption titration
The electronic absorption spectra of complexes
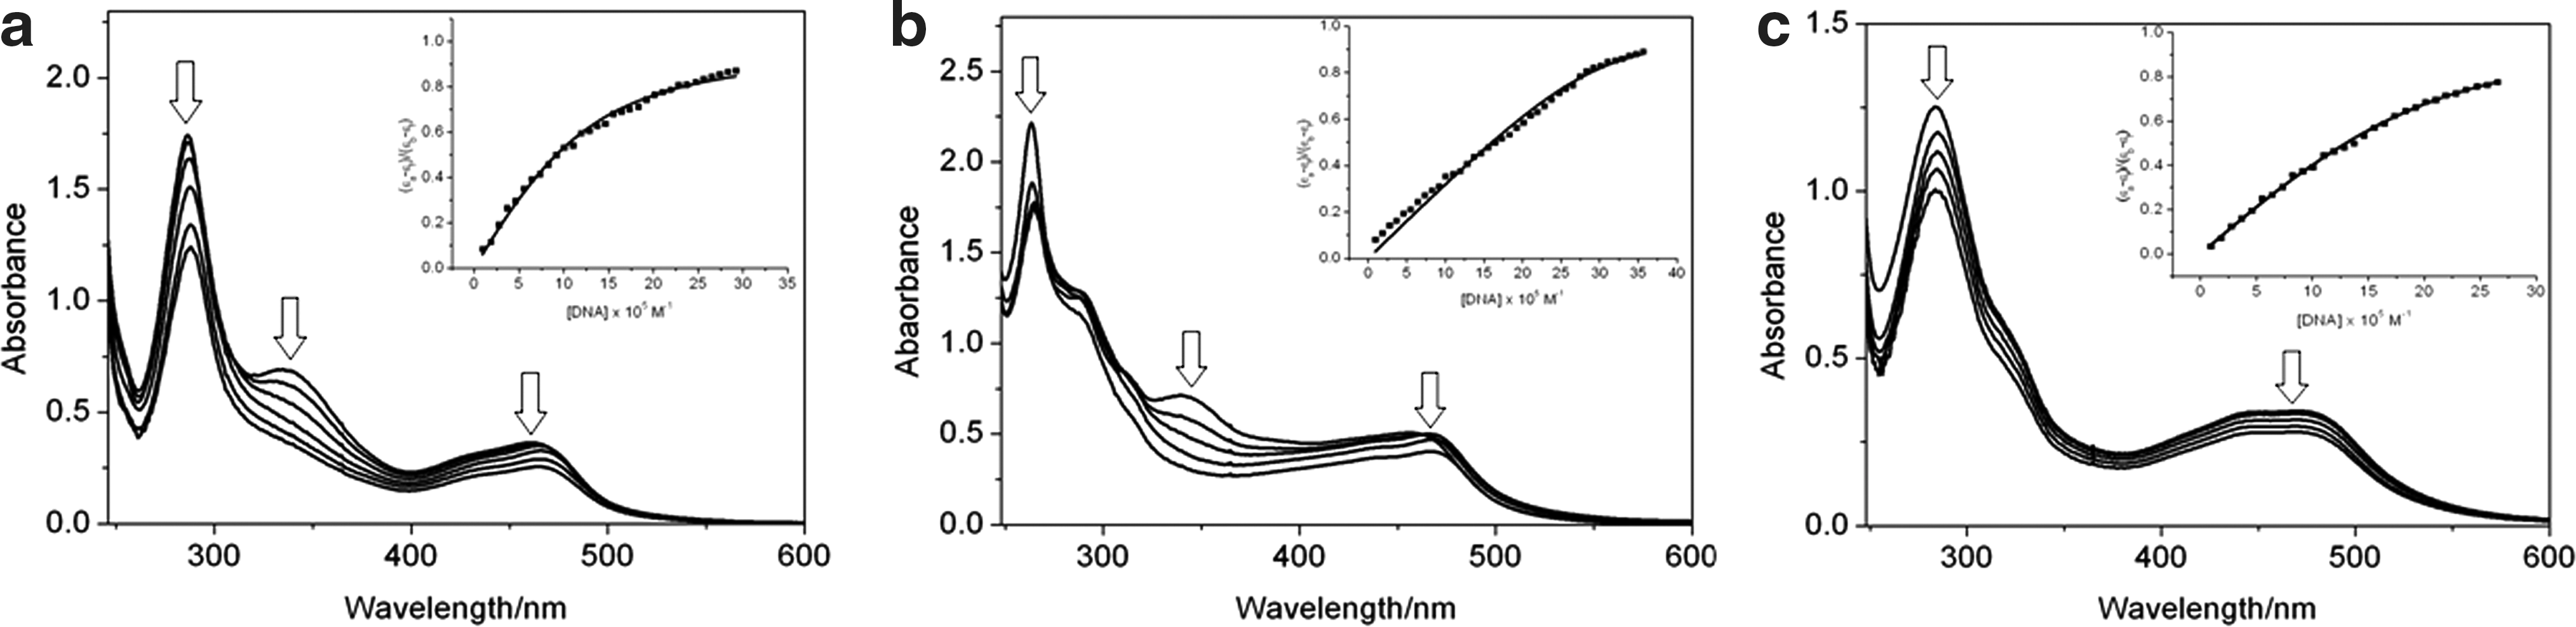
Absorption spectra of complexes in Tris-HCl buffer upon addition of calf thymus DNA (CT–DNA) in the presence of complexes
Luminescence of 1 , 2 , and 3 in the presence of DNA
Complexes
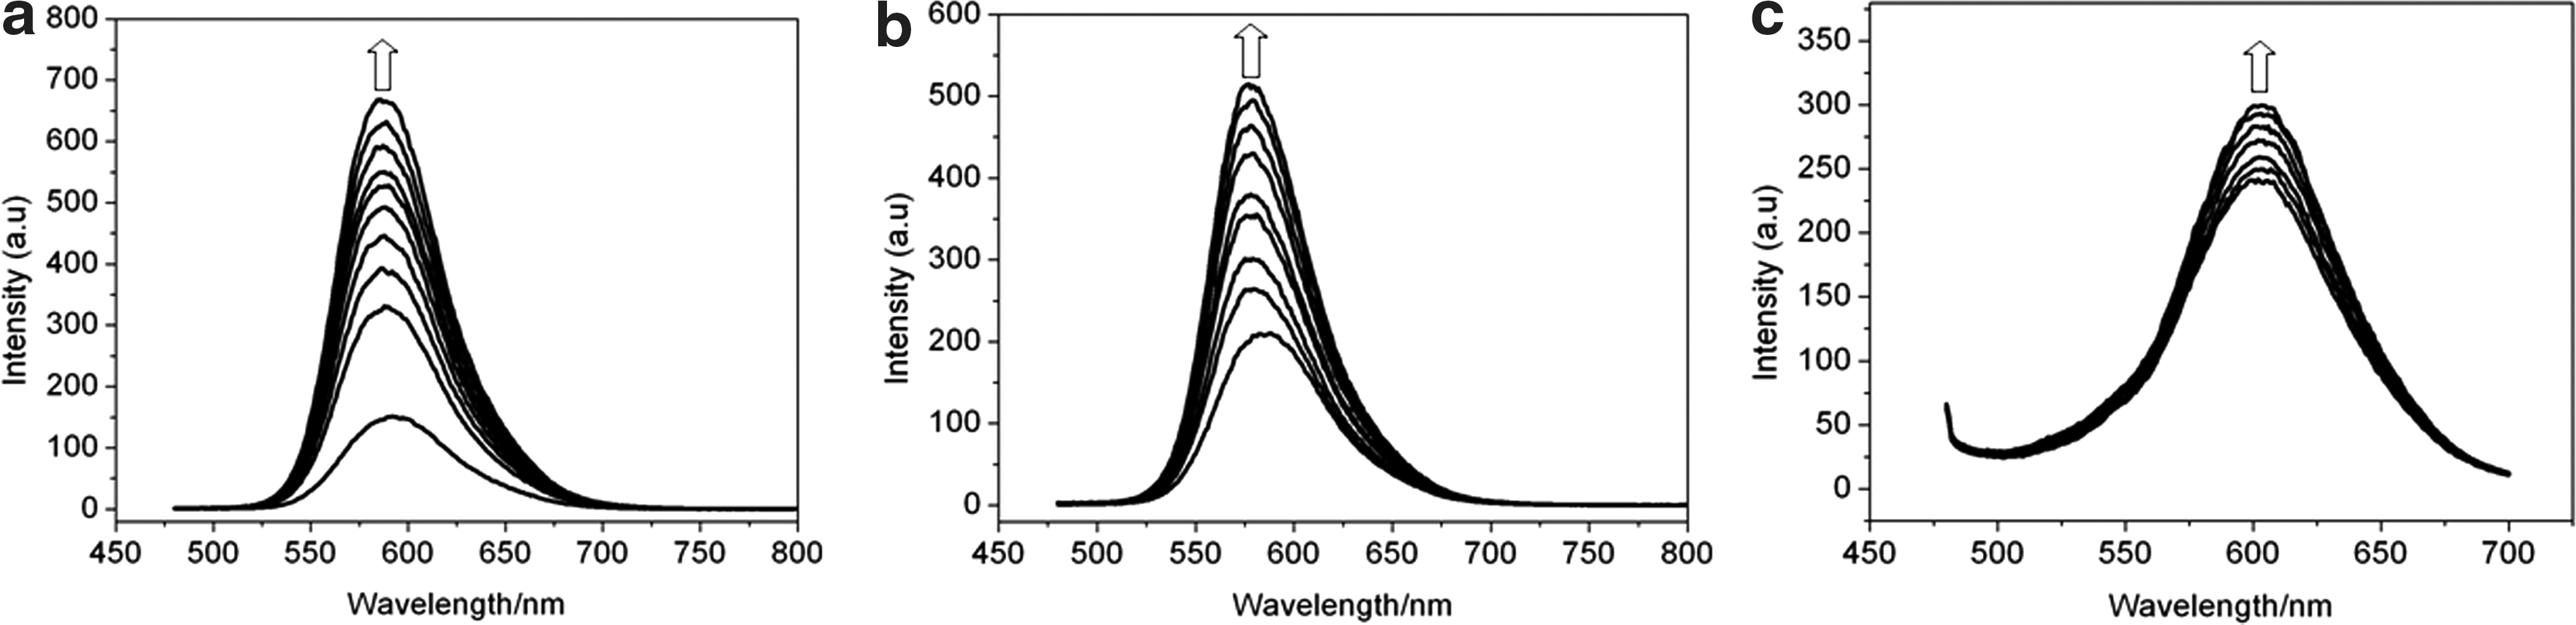
Emission spectra of complexes
Photoinduced cleavage of pBR322 DNA
The cleavage reaction on plasmid DNA induced by complexes
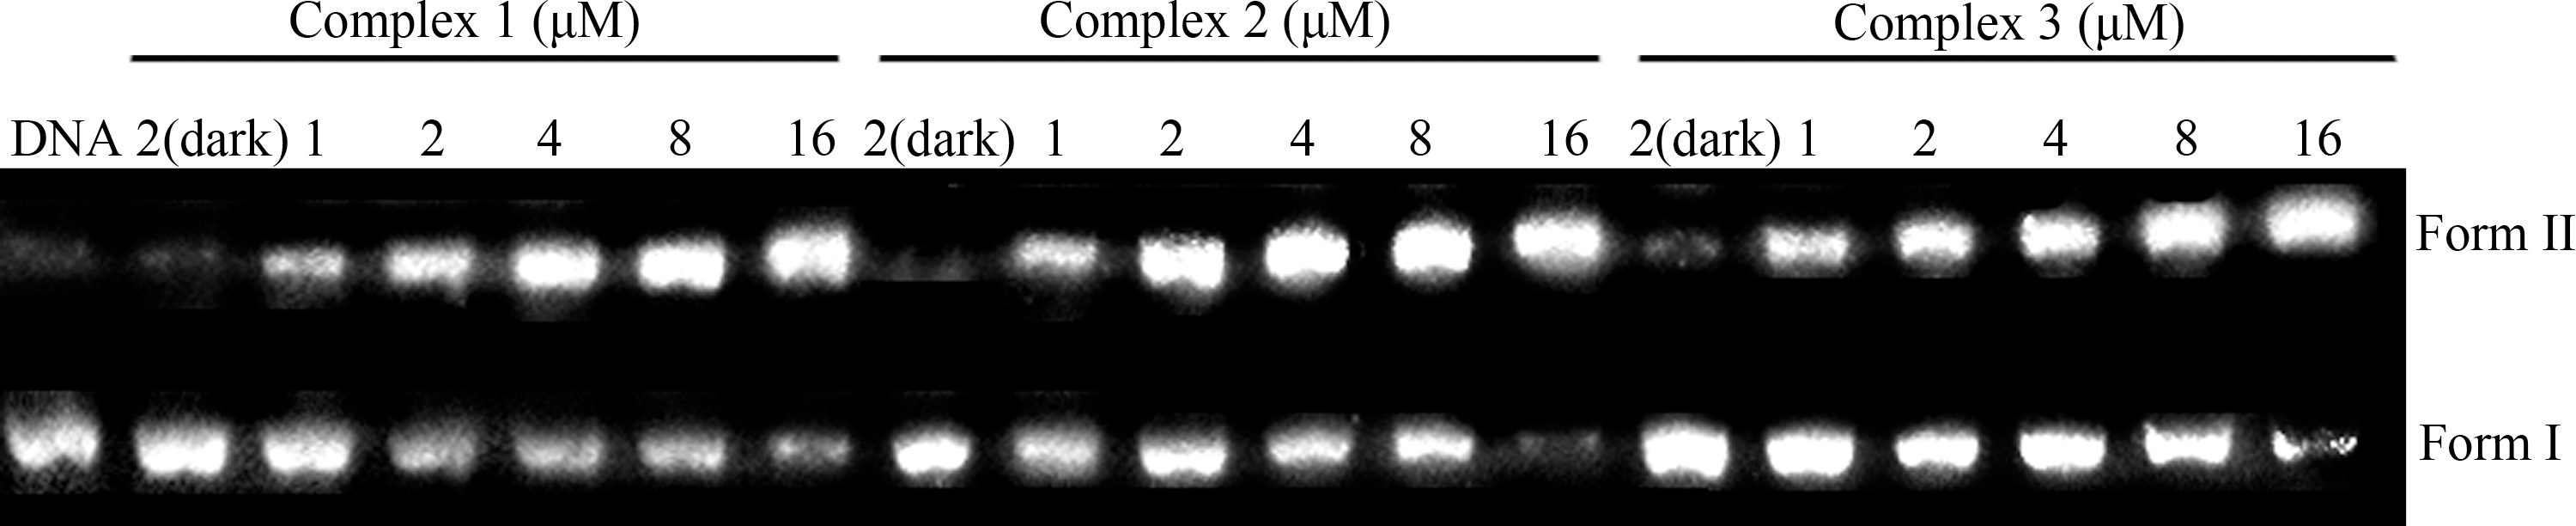
Photoactivated cleavage of pBR322 DNA in the presence of different complexes upon irradiation at 365 nm for 45 min.
Cytotoxicity in vitro assay
Cytotoxic effects of complexes
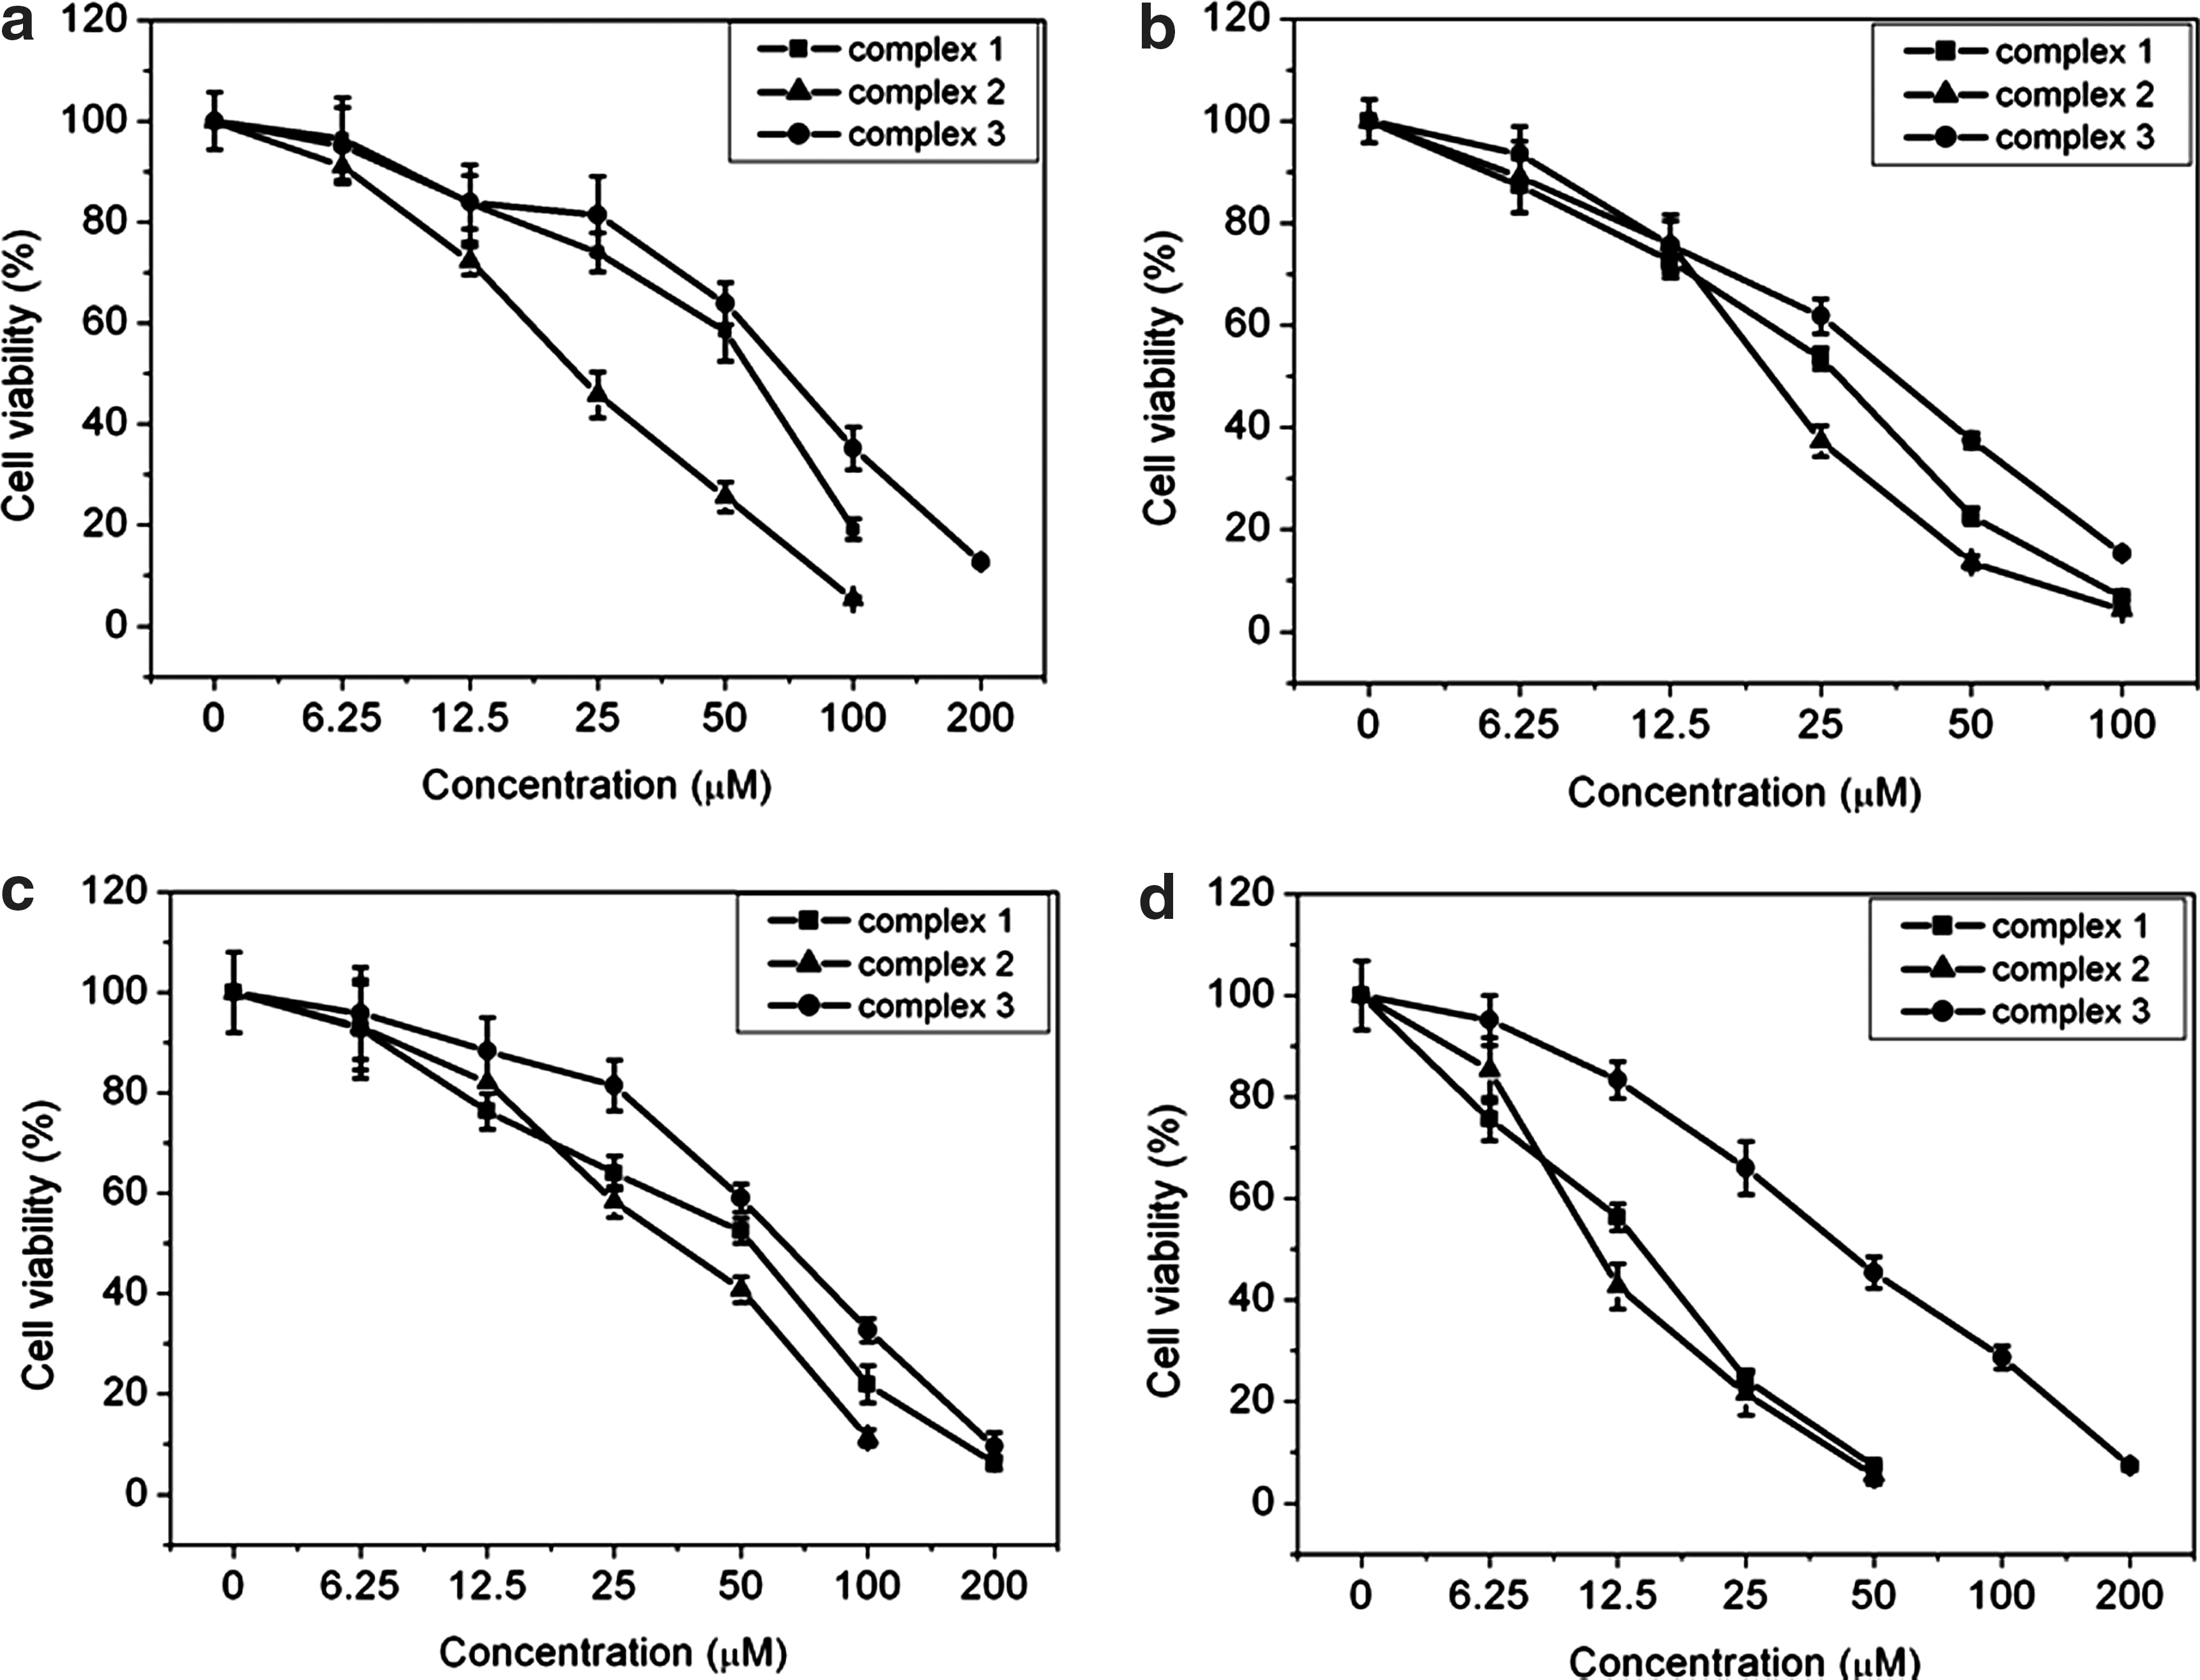
Cell viability of complexes
Complex-induced apoptotic cell death in BEL-7402 cells
To determine the percentage of the apoptosis and necrosis of BEL-7402 cells, the cells were treated with complexes
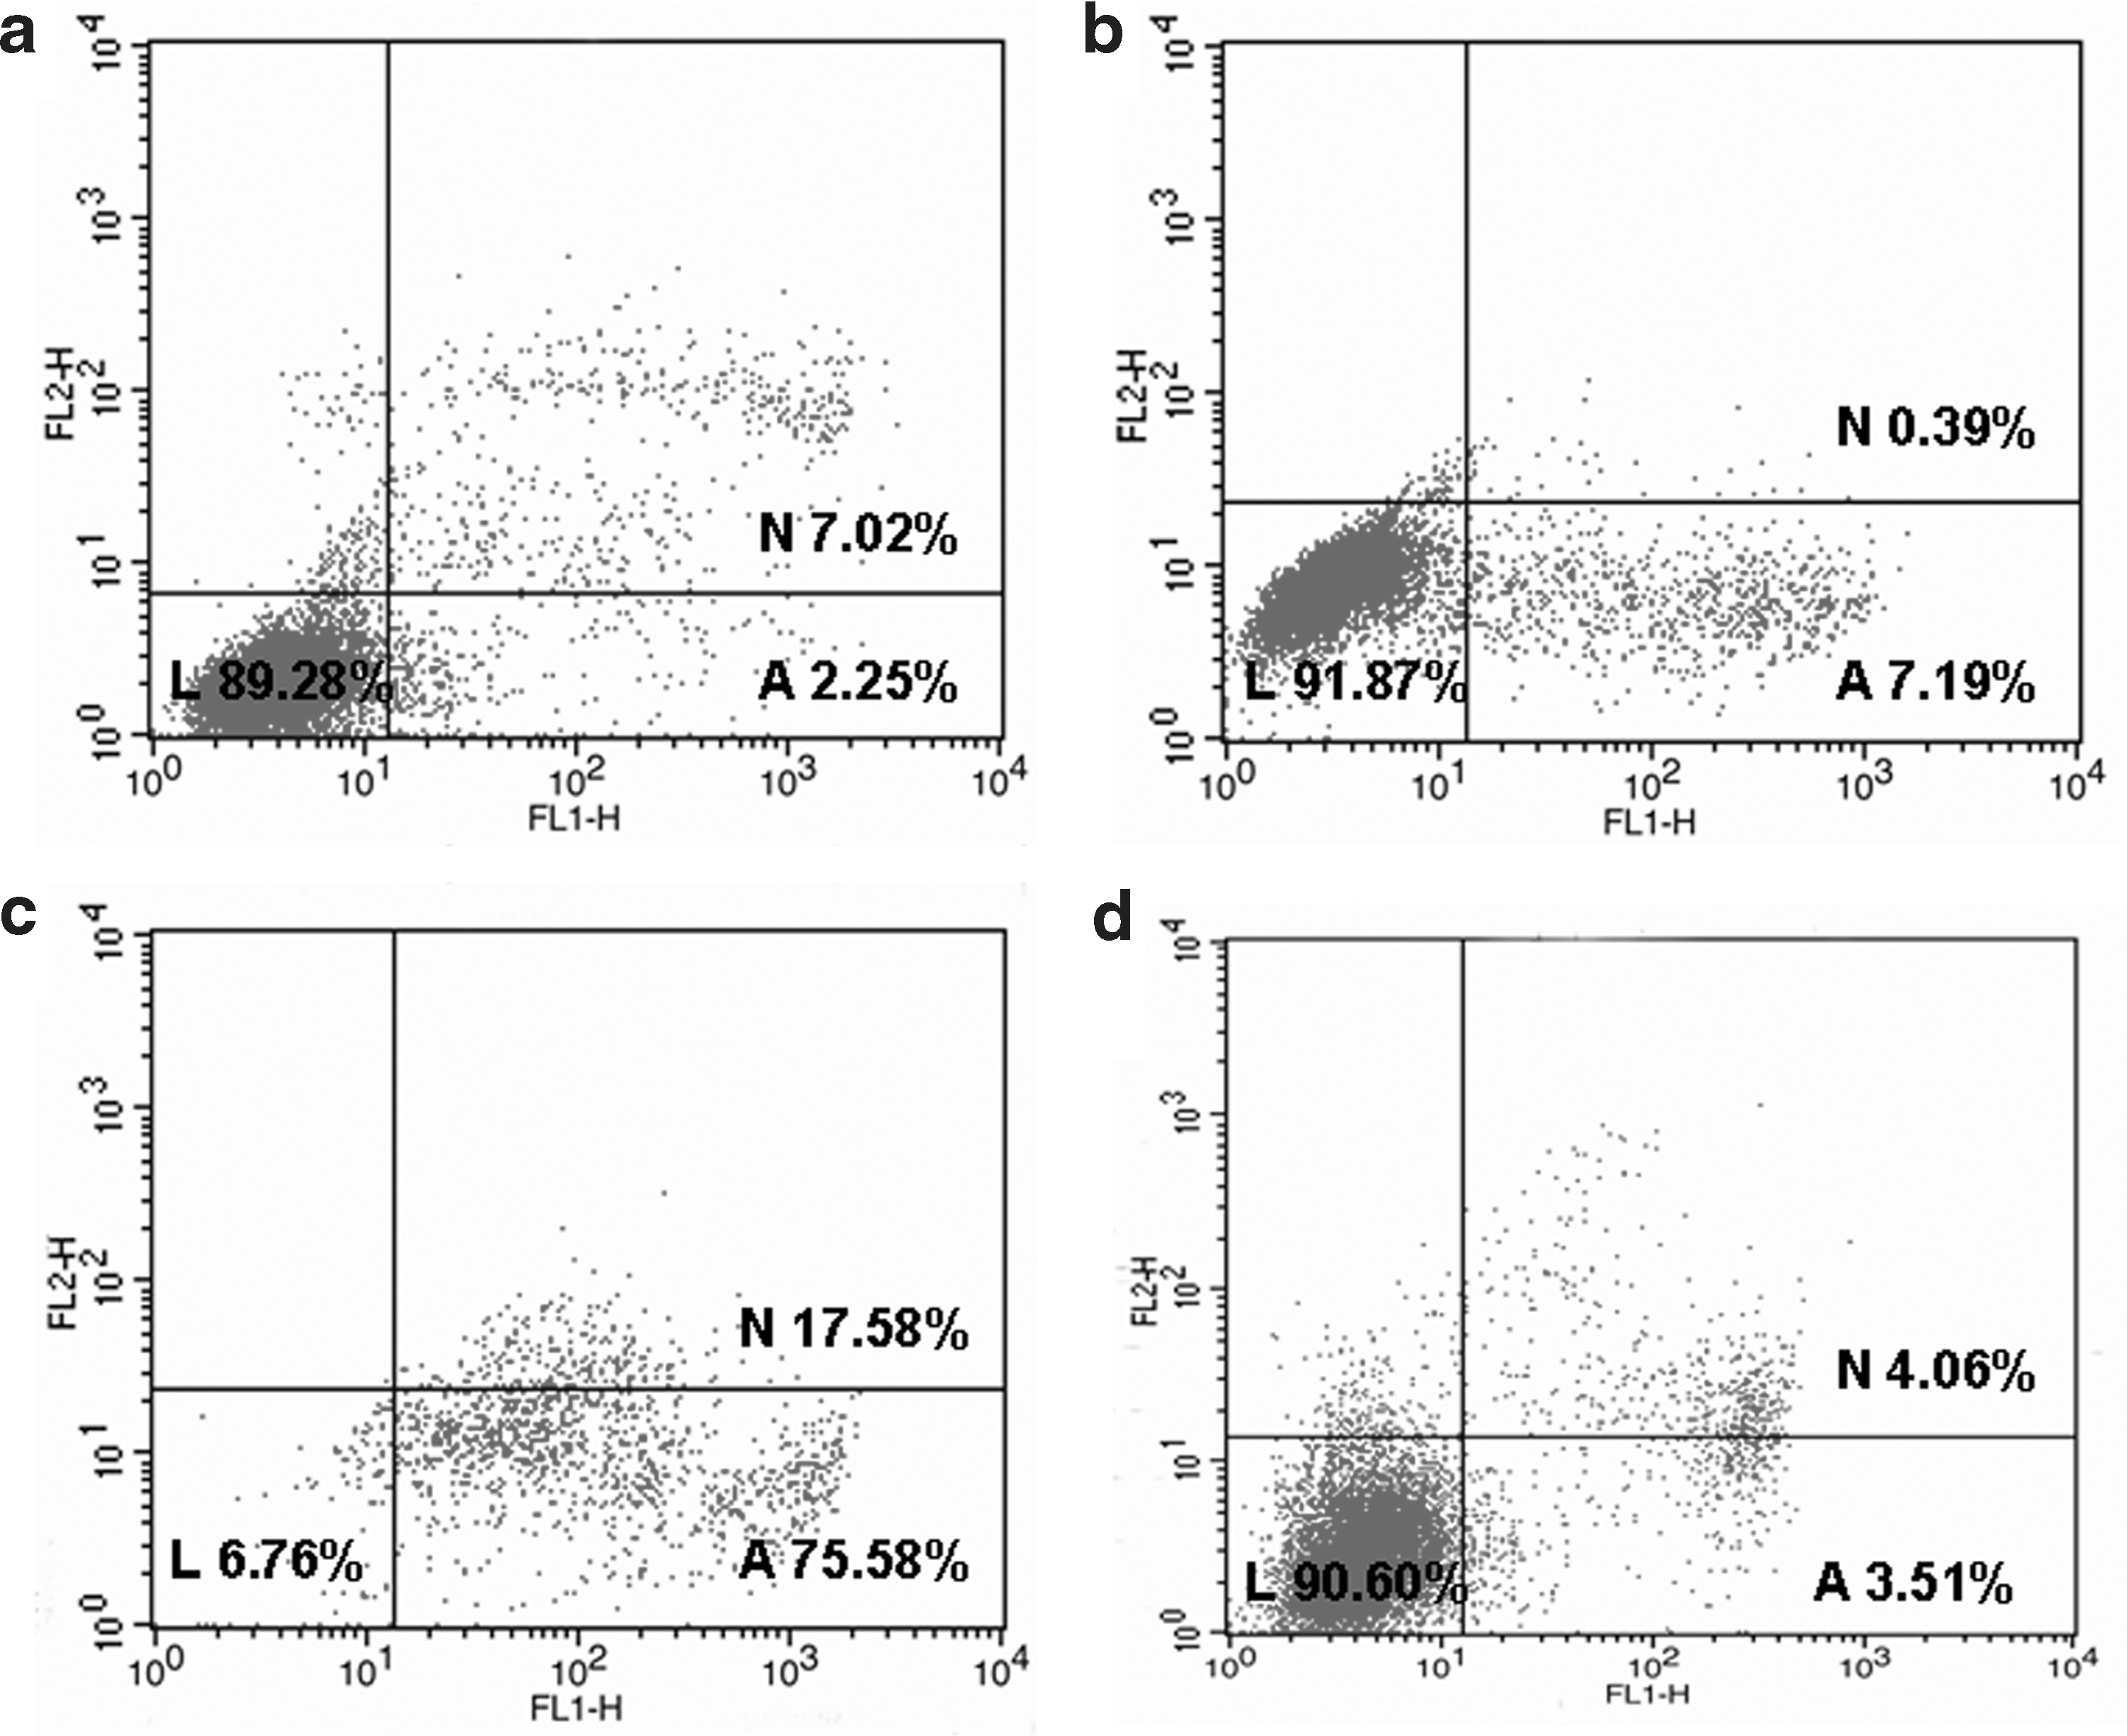
The percentage of living (L), necrotic (N), and apoptotic (A) ruthenium complex-treated BEL-7402 cells as analyzed by fluorescence-activated cell sorting (FACS) calibur flow cytometry. Control
To confirm whether treatment with complex
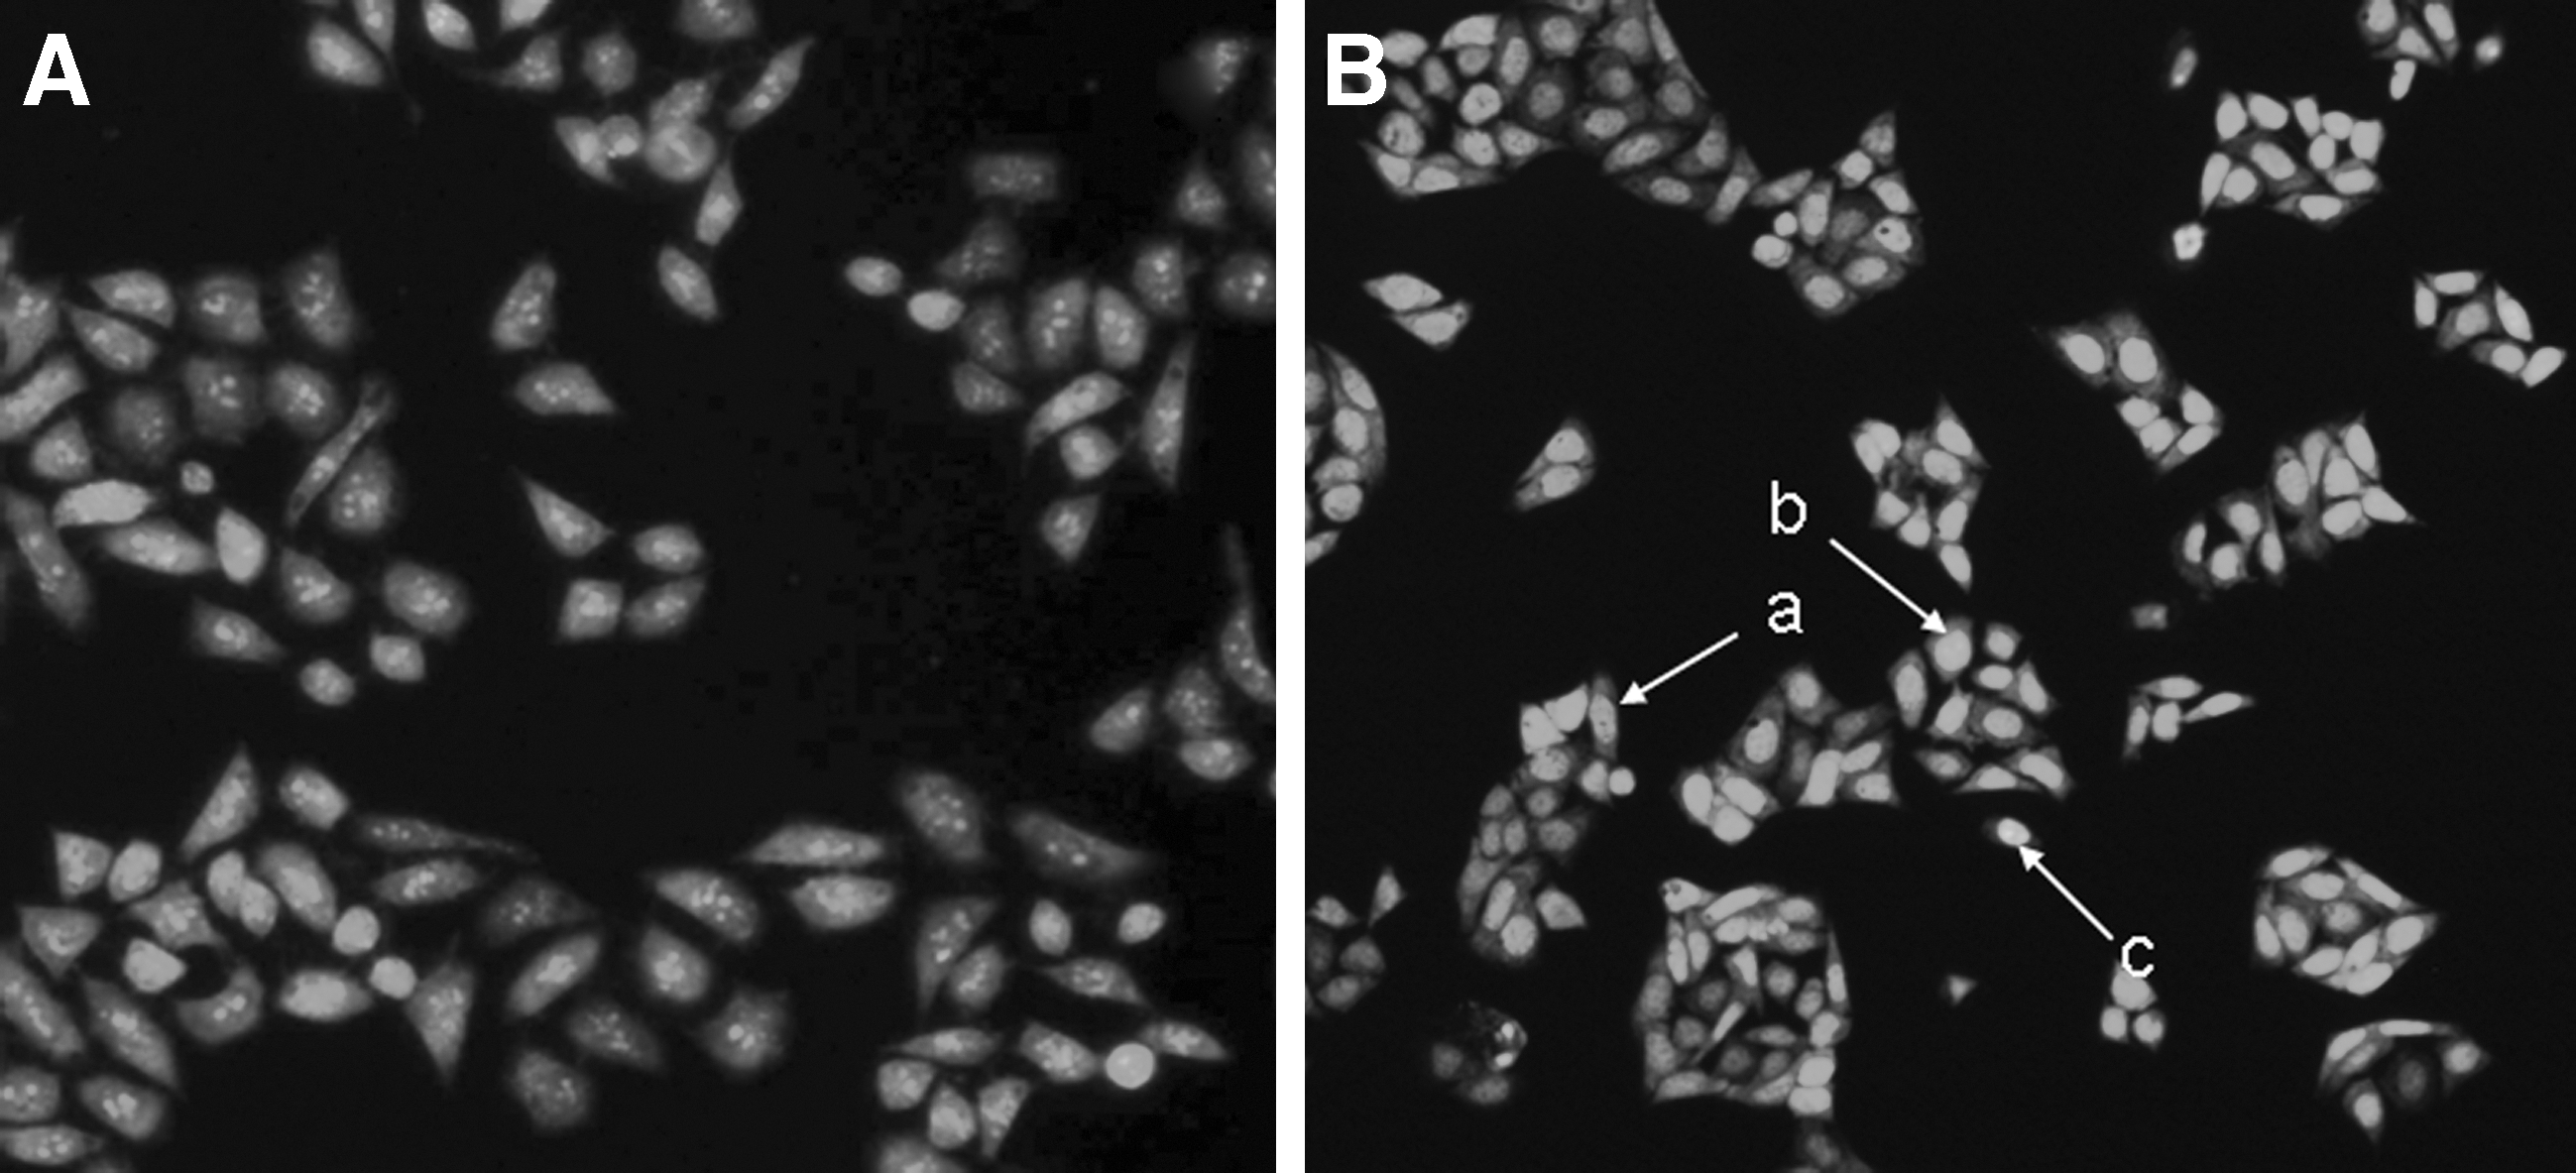
BEL-7402 cells incubated at 37°C and 5% CO2 and observed under fluorescence microscopy: Control
Cellular uptake studies
Complexes
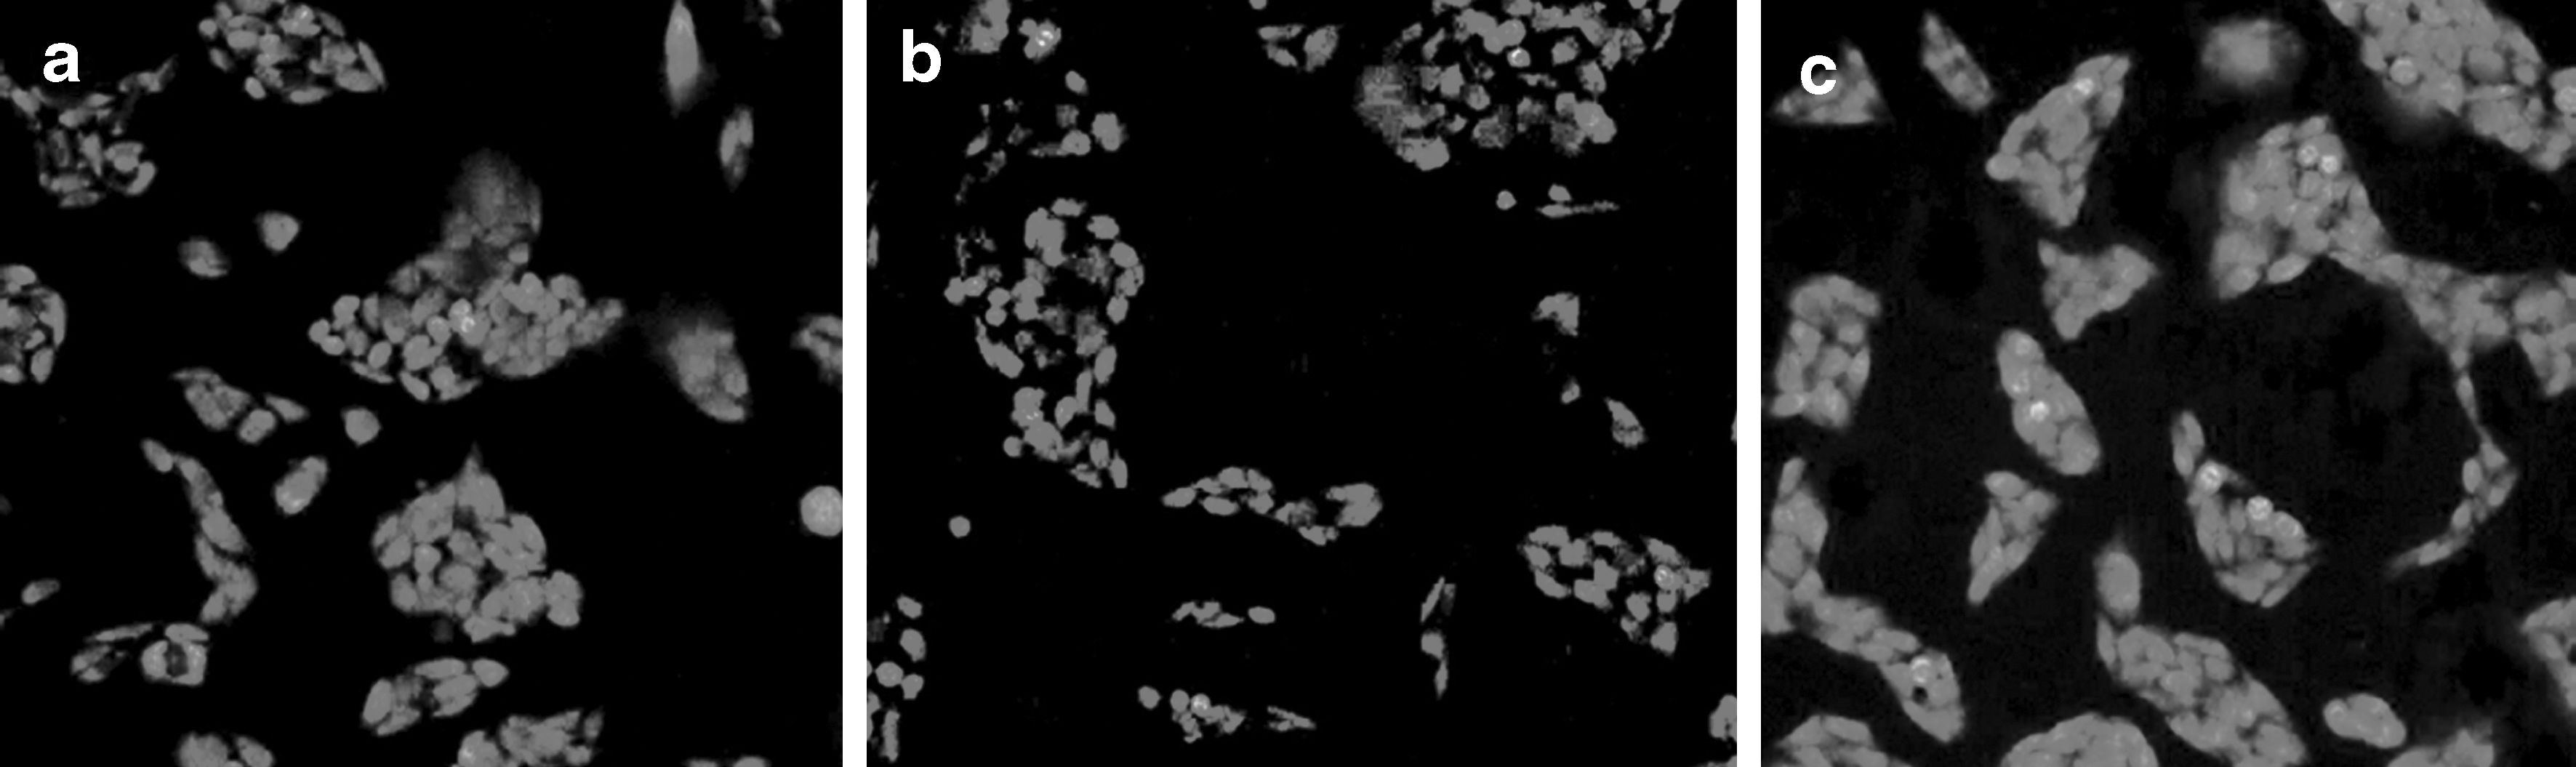
An image observed by fluoresecnce microscopy after BEL-7402 cells incubated with complexes
Cell cycle distribution
Complex
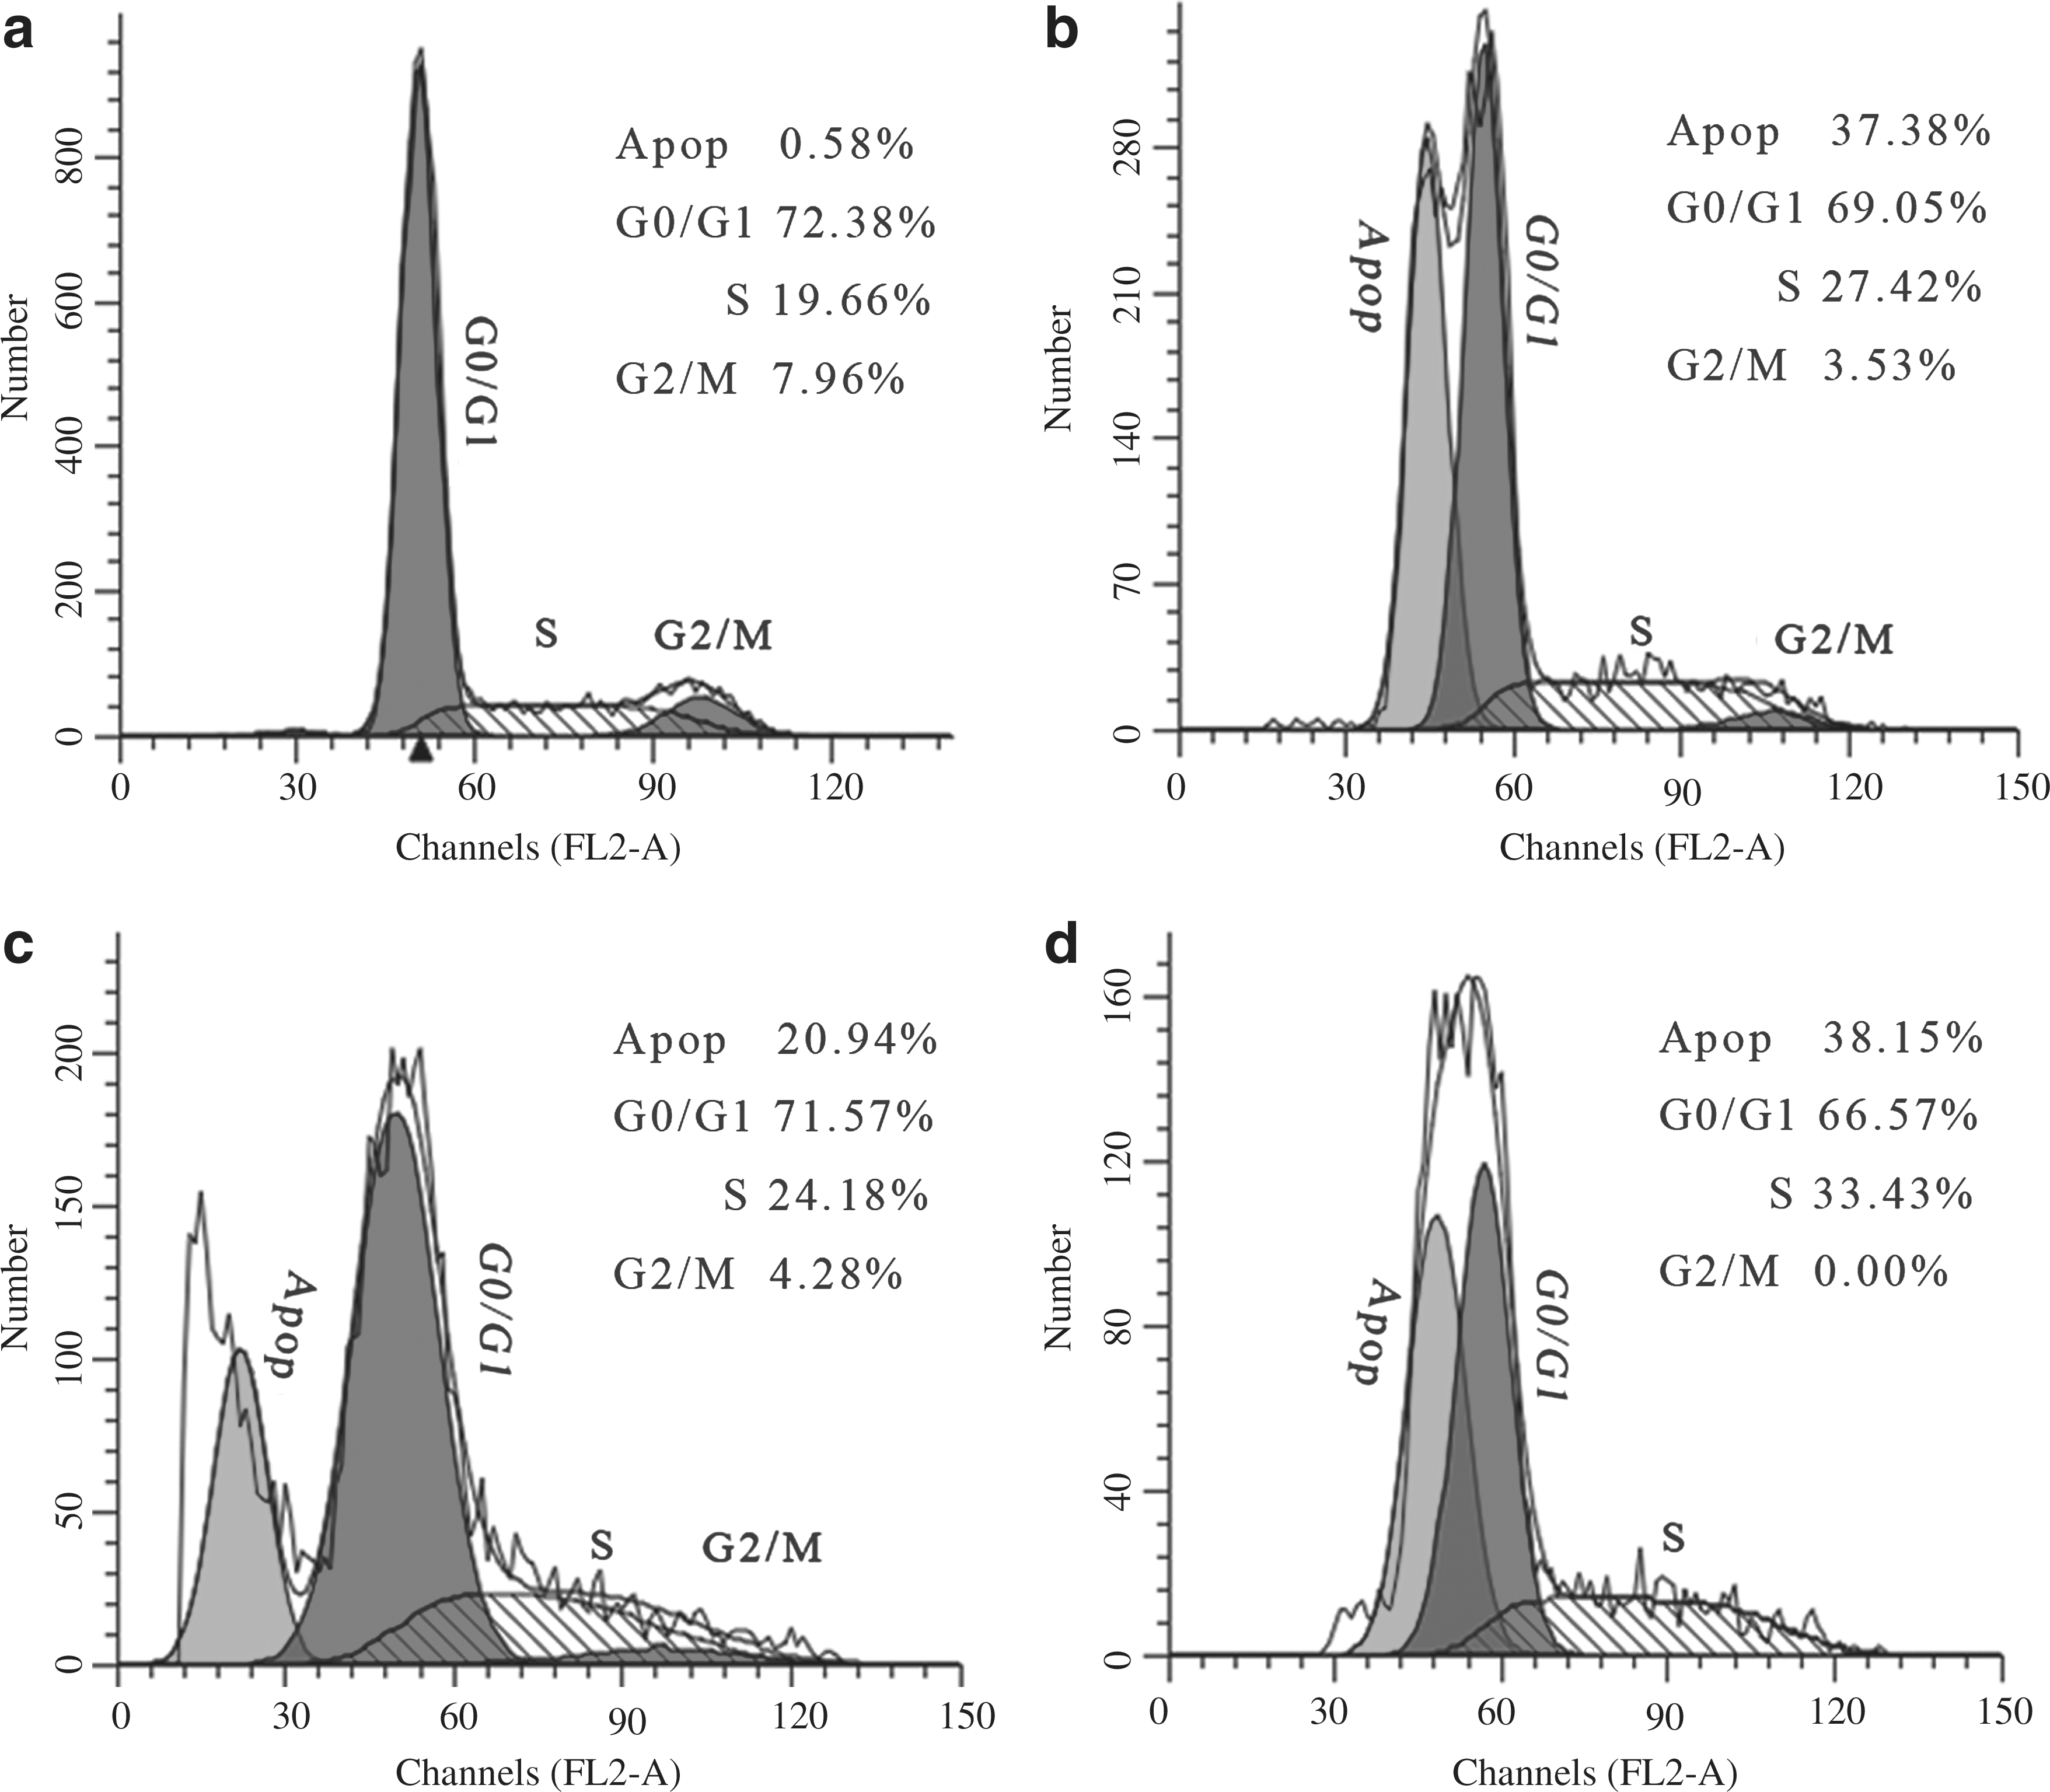
Cell cycle distribution of BEL-7402 cells as analyzed by FACS calibur flow cytometry. Control
Discussion
The DNA-binding constants Kb
were determined by monitoring the changes in absorbance at the MLCT band with increasing concentration of CT-DNA. The values of Kb
are derived to be 1.07 (±0.47)×105 M−1 (s=2.04), 1.21 (±0.32)×105 M−1 (s=1.88), and 2.75 (±0.27)×105 M−1 (s=2.17) for
At increasing concentrations of CT-DNA, the emission intensities obviously increase. Enhancement of emission intensity implies that complexes
Generally, the effect on photocleavage is closely related to the DNA-binding affinity. More effective DNA cleavage activity was observed for complexes
In the cytotoxicity assay the IC50 values for
The percentage of apoptotic and necrotic cells was determined by flow cytometry. In the control (a), the percentage of apoptotic (A) and necrotic (N) cells were 2.25% and 7.02%, respectively. In the presence of complexes
Complexes
Studies on ruthenium polypyridyl complexes-induced antiproliferative action on cancer cells have attracted much attention. Ruthenium complexes shows G2/M and S-phase arrest in BEL-7402 and HepG-2 cells, respectively (Huang et al., 2011). Figure 8 shows that treatment of BEL-7402 cells with complexes
Conclusions
A new ligand BHIP and its three complexes [Ru(bpy)2(BHIP)]2+ (
Footnotes
Acknowledgments
This work was supported by the Science and Technology Foundation of Guangdong Province (No. 2010B031500005), the Science and Technology Planning Project Pillar Program of Guangzhou Municipality (No. 2010J-E021-1), and the Medical Scientific Research Foundation of Guangzhou Municipality (201102A212029) of China.
Disclosure Statement
The authors declare that no competing financial interests exist.