
Abstract
The negative-sense asp open reading frame (ORF) positioned opposite to the human immunodeficiency virus type 1 (HIV-1) env gene encodes the 189 amino acid, membrane-associated ASP protein. Negative-sense transcription, regulated by long terminal repeat sequences, has been observed early in HIV-1 infection in vitro. All subtypes of HIV-1 were scanned to detect the negative-sense asp ORF and to identify potential regulatory sequences. A series of highly conserved upstream short open reading frames (sORFs) was identified. This potential control region from HIV-1NL4-3, containing six sORFs, was cloned upstream of the reporter gene EGFP. Expression by transfection of HEK293 cells indicated that the introduction of this sORF region inhibits EGFP reporter expression; analysis of transcripts revealed no significant changes in levels of EGFP mRNA. Reverse transcriptase–polymerase chain reaction analysis (RT-PCR) further demonstrated that the upstream sORF region undergoes alternative splicing in vitro. The most abundant product is spliced to remove sORFs I to V, leaving only the in-frame sORF VI upstream of asp. Sequence analysis revealed the presence of typical splice donor- and acceptor-site motifs. Mutation of the highly conserved splice donor and acceptor sites modulates, but does not fully relieve, inhibition of EGFP production. The strong conservation of asp and its sORFs across all HIV-1 subtypes suggests that the asp gene product may have a role in the pathogenesis of HIV-1. Alternative splicing of the upstream sORF region provides a potential mechanism for controlling expression of the asp gene.
Introduction
Negative-strand open reading frames (ORFs) opposite to the env gene have been described in human immunodeficiency virus type 1 (HIV-1) (Miller, 1988; Vanhee-Brossollet et al., 1996), human T-cell leukaemia virus type 1 (HTLV-1) (Larocca et al., 1989), HTLV-2 (Halin et al., 2009), and feline immunodeficiency virus (Briquet et al., 2001). The HTLV-I HBZ protein modulates viral transcription (Gaudray et al., 2002) and enhances viral persistence (Arnold et al., 2006). Two alternatively spliced variants of the HTLV-I HBZ RNA, which encode different HBZ isoforms, have been characterized (Cavanagh et al., 2006); both isoforms downregulate Tax-mediated viral transcription (Lamasson et al., 2007; Yoshida et al., 2008). The antisense protein of HTLV-2, APH-2, also suppresses Tax-mediated viral transcription (Halin et al., 2009).
A negative-sense ORF, asp, positioned opposite to the gp120/gp41 junction of the env gene in HIV-1 produces both RNA and protein products (Vanhee-Brossollet et al., 1996) (see Fig. 1). The asp ORF is highly conserved among all strains and subtypes of HIV-1 but absent from HIV-2 sequences (Miller, 1988; Bukrinsky and Etkin, 1990; Briquet and Vaquero, 2002) and encodes a highly hydrophobic protein with two transmembrane helices. In vitro studies indicate that the ASP protein is recognized by antibodies present in the sera of HIV+ individuals (Vanhee-Brossollet et al., 1996); however, the HIV-1 ASP protein has not yet been detected in vivo.
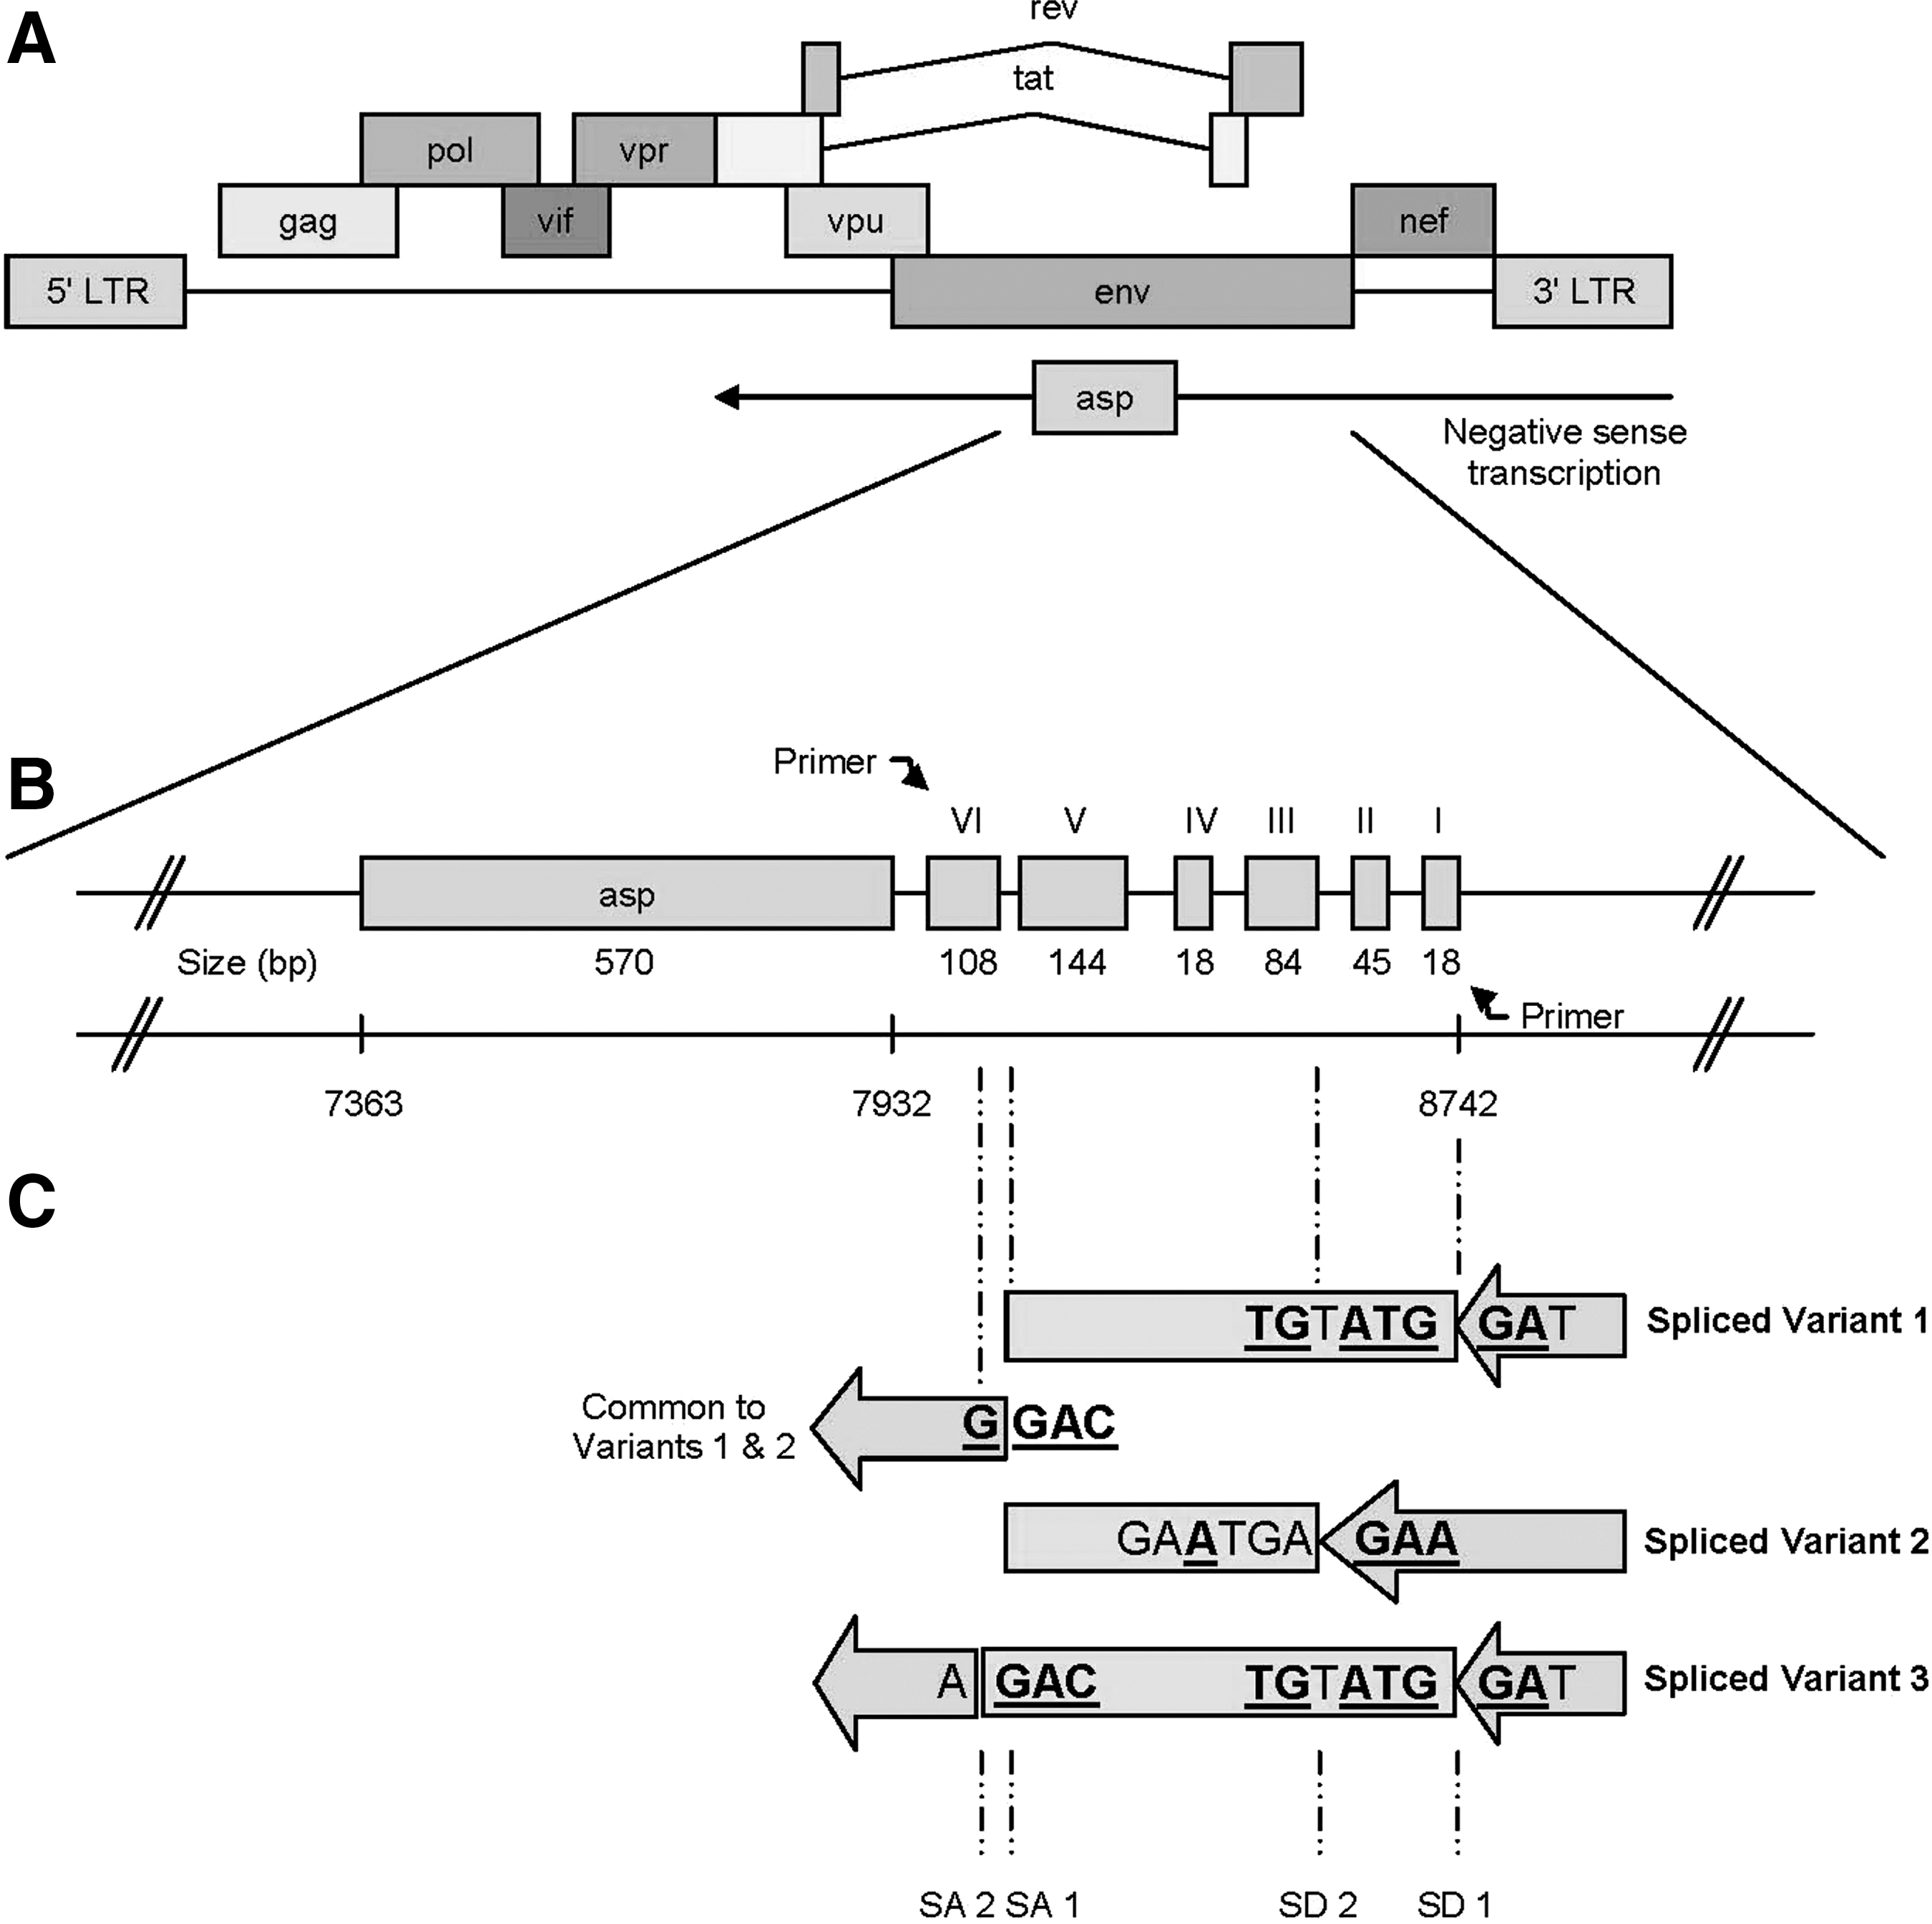
Location and organization of asp and its associated sORFs.
Endogenously expressed asp RNA has been shown to inhibit replication of HIV-1, but not HIV-2 (Tagieva and Vaquero, 1997). Recent in vitro studies confirm localization of ASP to the plasma membrane (Clerc et al., 2011), while earlier studies suggested that the ASP protein is also present in viral particles released from HIV-1-infected cells (Briquet and Vaquero, 2002). These data suggest that asp could play a pivotal role in the life cycle of the HIV-1 virus; however, a functional role for the ASP protein is yet to be established. The presence of a repeated (PxxP) amino acid sequence motif, which is associated with signaling kinase–SH3 domain interaction in HIV-1 Nef (Greenway et al., 2003) and Hepatitis E ORF-3 protein (Korkaya et al., 2001) may clue to the function of ASP.
Early studies conducted by Bukrinsky and Etkin (1990) detected three polyadenylated negative-sense RNA transcripts (1.6, 1.1, and 1.0 kb) in acutely infected H9 cells; these transcripts were present early in infection (day 3) but were not detected later (on days 5 or 7). Michael et al. (1994) confirmed the presence of a negative-sense transcript in tissue cultures and in peripheral blood mononuclear cells (PMBCs) isolated from infected patients; sequence analysis predicted a full-length transcript of 2.3 kb. More recently, Landry et al. (2007) provided further evidence for negative-sense transcription in HIV-1, identifying an alternative poly-A signal that would produce a 4.1-kb transcript; however, this longer negative-sense transcript was not detected by northern blot analysis.
The mechanism of regulation of asp expression remains unclear to date. In vitro studies have confirmed that transcription of the negative-sense ORF occurs early in infection, controlled by long terminal repeat (LTR) sequences (Peeters et al., 1996; Pereira et al., 2000; Bentley et al., 2004). The role of the transcriptional activator, Tat, in negative-sense transcription is yet to be fully elucidated. Both Michael et al. (1994) and Bentley et al. (2004) suggested that Tat simultaneously upregulates positive-sense transcription and downregulates negative-sense transcription, so it may switch off expression of negative-sense genes soon after infection. However, more recent studies by Landry et al. (2007) suggest that Tat acts to upregulate negative-sense transcription.
In this study, we report the strong conservation of a series of short open reading frames (sORFs) upstream of the asp gene and demonstrate the ability of this sORF region to regulate Asp expression in a reporter gene system. We detected alternative splicing of this sORF region, associated with varying levels of inhibition of the downstream reporter gene. Together, these data suggest that this upstream sORF region could play a role in regulating expression of HIV-1 asp.
Materials and Methods
Bioinformatic analyses
All sequences were scanned for large ORFs, opposite env, using DNAMAN® (Lynnon BioSoft). Sequences included 31 HIV-1 complete sequences spanning subtypes A (SE6594, UGO37), B (NL4-3, OYI, MN, ACH1, BRU, CAM1), C (92BR025, ETH2220), D (94UG114, ELI, NDK), E (92NG083, 93TH253), F1 (FIN9363, VI850), F2 (CM53657, MP257), G (DRCBL, HH8793, X558), H (V1991, V1997), J (SE9173, SE9280), K (MP535), N (DJO 0131, YBF30, YBF100), and U (83CD00323). Upstream DNA sequences equivalent to nts 8742 to 7932 of HIV-1 (NL4-3) were collected and subjected to multiple sequence alignment (Vector NTI Advance™; Invitrogen). The consensus sequence was assessed for the location and number of sORFs, sequence similarity to the consensus, and strength of initiation codon using DNAMAN.
A total of 27 HIV-1 subtype B sequences were collected to examine the conservation of splice acceptor and donor motifs. Sequences included MBC925, 1027-03, TWCYS, 01UYTRA1179, WC1PR, MBCC98, WC10P-6, WC10C-11, PCM034, S61G7, CANA1, CANB6, 85US Ba-L, HIVMCK1, HIV2132, BH10, NL4-3, 1058-11, 5157-86, US4, PCM013, 02HNsc11, 05AR163052, BZ167, 1001-09, PCM001, and HIVOYI.
Cell culture
HEK293 cells were maintained in Dulbecco's Modified Eagle Medium (DMEM) supplemented with 10% fetal bovine serum (Invitrogen), 2 mM L-glutamine, 100 U/mL penicillin G, and 100 μg/mL streptomycin at 5% CO2 and 37°C. For transfection, cells were seeded at a density of 1.6×10⁵ cells/mL in 2.0 cm2 culture dishes.
Reporter gene constructs
The pEGFP (sORF I-VI wt) construct was derived from pNL4-3 DNA by subcloning the sORF segment (position 8798 to 7980 comprising the start codon of sORF I to the stop codon of sORF VI, respectively) into the pGEM®-T Easy vector system (Promega) with the addition of an AgeI site by the polymerase chain reaction (PCR) primers—forward: 5′-CT
The parental plasmid, pEGFP-N1, was used as positive control in all transfection experiments. The negative control plasmid, pE-N1, was kindly provided by Dr. D. Purcell (Department of Microbiology and Immunology, The University of Melbourne, Australia) and is derived from pEGFP-N1 by excision of the reporter EGFP gene with AgeI and NotI, end filling by Klenow and recircularization.
Site-directed mutagenesis was used to knock out the ATG codon of each sORF sequentially, starting at sORF VI. Mutagenesis was carried out using the QuikChange® II Site-Directed Mutagenesis Kit (Stratagene) according to the manufacturer's instructions. The following primers (and their complementary primers) were used to mutate the ATG codons of each sORF with mutated sequence in bold—sORF I: 5′-GCTTATAGAGCTATTCGCCAC
Spliced variants 1, 2, and 3 were cloned individually into the parental plasmid, pEGFP-N1, using the In-Fusion™ Advantage PCR Cloning Kit (Clontech) according to the manufacturer's instructions. The following sets of primers were used to amplify and linearize the parental plasmid, pEGFP-N1, for variants 1 and 2: 5′-GATCCACCGGTCGCC-3′ and 5′-AATTCGAAGCTTGAGCTCG-3′, and for variant 3: 5′-GCTCGAGATGTGAGTCCGGTAGC-3′ and 5′-CCATGG TGAGCAAGGGCG-3′. The following primers were used to amplify the sequence unique to each spliced variant: for spliced variant 1: 5′-CTCAAGCTTCGAATTCCACCCATC TTATAGCAAAATCC-3′ and 5′-TTGGAATAACATGACA CCTAGAAGAATAAGACAGGCTTGG-3′, spliced variant 2: 5′-CTCAAGCTTCGAATTCCACCCATCTTATAGCAAA ATCC-3′ and 5′-TTGGAATAACATGACCTCTTGATTGT AACGAGGATTGTG-3′, and spliced variant 3: 5′-GCTACC GGACTCAGATCTCGAGC-3′ and 5′-CGCCCTTGCTCAC CATGG-3′. Individual reactions for variants 1 and 2 were in-fused with the common sequence, which was amplified with the following primers for splice variant 1: 5′-CTTATTCTTCT AGGTGTCATGTTATTCCAAATCTGTTCCAG-3′ and 5′-GG CGACCGGTGGATCGGATCAACAGCTCCTGGGG-3′ and for splice variant 2: 5′-CGTTACAATCAAGAGGTCATG TTATTCCAAATCTGTTCCAG-3′ and 5′-GGCGACCGGTG GATCGGATCAACAGCTCCTGGGG-3′. All plasmid constructs were sequenced to check integrity.
Transient transfections and reporter gene assays
HEK293 cells were transfected with 1 μg DNA using the calcium phosphate ProFection® transfection system (Promega) according to the manufacturer's instructions. In all transfection experiments, pEGFP-N1 and pE-N1 were used as positive and negative controls, respectively. Transfected cells were harvested 48 hours after transfection by lysis with 1× Reporter lysis buffer (Promega) and EGFP fluorescence read with the FLUOStar OPTIMA microplate reader (BMG Labtech) at excitation and emission wavelengths of 485 and 520 nm, respectively. For normalization, each sample was assayed for total protein using the Bradford method as described by the manufacturer (Sigma), and the absorbance was measured using the FluoStar FLUOStar OPTIMA microplate reader (BMG Labtech). EGFP was normalized according to total cell protein (EGFP fluorescence/mg of protein); each result represents the calculated mean±SE of six transfected samples.
Transcript analysis
Transfected HEK293 cells were harvested for total RNA at 48 hours after transfection using the SV Total RNA isolation system (Promega) according to the manufacturer's instructions. RNA samples were treated with DNAse I prior to cDNA synthesis with RQ1 RNase-free DNase (Promega) according to the manufacturer's instructions. cDNA was synthesized from total RNA (5 μg) using the Transcriptor first-strand cDNA synthesis kit (Roche) according to the manufacturer's instructions, primed by oligo (dT). Samples of the cDNA were then PCR-amplified using primers (forward: 5′-GCTACCGGACTCAGATCTCGAGC-3′ and reverse: 5′-CCTGGCTGTGGAAAGATACC-3′, except for spliced variants 1, 2, and 3, where the reverse primer was replaced with 5′-CGCCCTTGCTCACCATGG-3′). Reactions were established in the presence of 1.25 U Taq DNA polymerase (New England Biolabs), 1× ThermoPol buffer, 20 μM dNTP, and 20 μM of each primer. PCR conditions were as follows: initial denaturation of 94°C for 1 min followed by 30 cycles of denaturation (94°C for 30 s), annealing (62°C for 30 s), and extension (72°C for 1 min) with a final extension of 72°C for 5 min. RT-PCR amplification reactions were controlled for DNA contamination (RNA sample with no RT), auto-priming (cDNA synthesis in the presence of RT with no primer), and general transcript integrity with glyceraldehyde 3-phophate dehydrogenase (GAPDH)-specific primers (5′-TGCACCACCAACTGCTTAGC-3′ and 5′-GGCATGGACT GTGGTCATGAG-3′). Amplified products were cloned in pGEM-T Easy (Promega) prior to sequencing.
Northern analysis was conducted using 1 (g total RNA, blotted onto a nylon membrane, probed with DIG-labeled EGFP and GAPDH cDNA, and then detected by a luminescence assay according to the manufacturer's instructions (Roche). Message abundance was measured using the densitometry tool of the Dolphin-DOC image system (Wealtec), and the total EGFP message was normalized against total GAPDH message. EGFP message abundance is presented as transcript relative to GAPDH message and represents the calculated mean±SE of three samples.
Quantitative real-time PCR analysis
TaqMan® RT-PCR assays (Applied Biosystems) were carried out to determine the relative amounts of each spliced variant within the single mRNA pool. TaqMan probes were designed to span exon junctions, thus targeting each species. Primers and TaqMan probes for unspliced variant are forward: 5′-TCTCTCCACCTTCTTCTTCTATTCCTT-3′, reverse: 5′-CAGACCCACCTCCCAATCC-3′, and probe: 5′-CTGTCG GGTCCCCTC-3′; for spliced variant 1 are forward: 5′-GCG TCCCAGAAGTTCCACAAT-3′, reverse: 5′-GCCTTGGAAT GCTAGTTGGAGTAAT-3′, and probe: 5′-CAAGAGTCATG TTATTCC-3′; for spliced variant 2 are forward: 5′-CCCT GTCTTATTCTTCTAGGTCATGTT-3′, reverse: 5′-TGCCTTG GAATGCTAGTTGGA-3′, and probe: 5′-TCTGTTCCAGAG ATTTATTA-3′; and for spliced variant 3 are forward: 5′-AAATCCTTTCCAAGCCCTGTCT-3′, reverse: 5′-CCAC TGCTGTGCCTTGGAAT-3′, and probe: 5′-TCTAGAGAT TTATTACTCCAACTAG-3′. Individual reactions were established according to the TaqMan Fast Universal PCR Master Mix, without an AmpErase UNG (Applied Biosystems), along with the appropriate primer/probe set and cDNA template (as described previously) in a total volume of 20 μL. Isolated spliced variants, cloned into pGEM-T Easy (as described previously), were used as standards and used to check primer/probe specificity along with a –RT sample to ensure no DNA contamination. The concentrations of starting material were measured using the Quant-iT™ dsDNA HS assay with the Qubit™ fluorometer (Life Technologies) and copy number was calculated. The thermal cycling protocol consisted of an initial melt at 95°C for 20 s followed by 40 cycles of 95°C for 3 s and 60°C for 30 s using the ABI 7500 Fast Real-Time PCR System (Applied Biosystems). The Ct values were calculated using software SDS2.4 to generate calibration curves and calculate copy numbers of target transcripts.
Results
Asp and its sORFs are highly conserved
Multiple sequence alignment of the region upstream of the asp ORF (nts 8742 to 7932 in HIV-1 NL4-3) in 31 HIV-1 sequences, representing all subtypes, revealed a series of well-conserved sORFs that displayed nucleotide sequence conservation >80% with reference to the consensus sequence (Fig. 1B). The major infecting HIV-1 subtypes (B, C, and D) displayed 5–7 sORFs (typically 6 sORFs), while fewer sORFs (3–5) were observed in the rarer subtypes (H, K, and N).
The sequences of sORFs I, V, and VI were highly conserved among all subtypes, with strong conservation of the initiation codon (refer to supplementary data). Nucleotide changes in the sORF VI ATG initiation codon were observed in only 6 sequences of the 31 sequences examined: B (CAM1), G (X558), N (YBF30, YBF100, DJO 0131), and U (83CD00323). Three of these (CAM1, 83CD00323, and X558) displayed an alternate initiation codon further downstream, so they possessed a truncated sORF VI. The sequences of sORFs II, III, IV, and V were less well conserved (between 63% and 96%).
The translation initiation context of each sORF was assessed as weak, adequate, or strong by comparison to the Kozak consensus sequence (Kozak, 1986). The sequence context of sORFs I (26/31 sequences), V (21/31), and VI (25/31) are typically adequate, consistent with other sORF regulating systems, such as that of the yeast GCN4 (Hinnebusch, 1997). Interestingly, sORFs II and IV display a weak initiation codon context in most HIV subtypes, but a strong initiation context is observed in B and C clade strains (Table 1).
The percentage homology of the sORF sequence to the consensus sequence (generated from all 27 sequences) is indicated by the numerical value in each box. The presence of an initiation codon is indicated by numerical values in bold type. Kozak initiation strength of each sORF is indicated by shading; dark, medium, and unshaded boxes represent strong, adequate, and weak initiation codons, respectively.
Note that the strength of sORF initiation codons is typically adequate, whereas sORFS II and IV are typically strong in subtype B. sORFS, short open reading frames.
Asp sORFs inhibit expression of a downstream reporter gene
The region nt 8798 to 7980 from pNL4-3, containing six sORFs (sORF I–VI wt), was cloned upstream of the reporter gene EGFP in the plasmid pEGFP-N1 and transfected into HEK293 cells. EGFP expression in cells transfected with the pEGFP-(sORF I-VI wt) construct was compared to cells transfected with the base plasmid, pEGFP-N1, and pE-N1 (lacking the EGFP gene).
The presence of the upstream sORF region reduced EGFP expression by at least 95% (p≤0.01, n=6) (Fig. 2A) similar to levels of inhibition observed in CEM and HEK293T cell lines (unpublished data: N. Vardarli and S. Yap). Northern blot indicated no significant difference in abundance of the reporter EGFP transcript (normalized to GAPDH transcript) in pEGFP-N1 and pEGFP-(sORFs I-IV wt) transfected cells (p=0.345, n=3) (Fig. 2B).
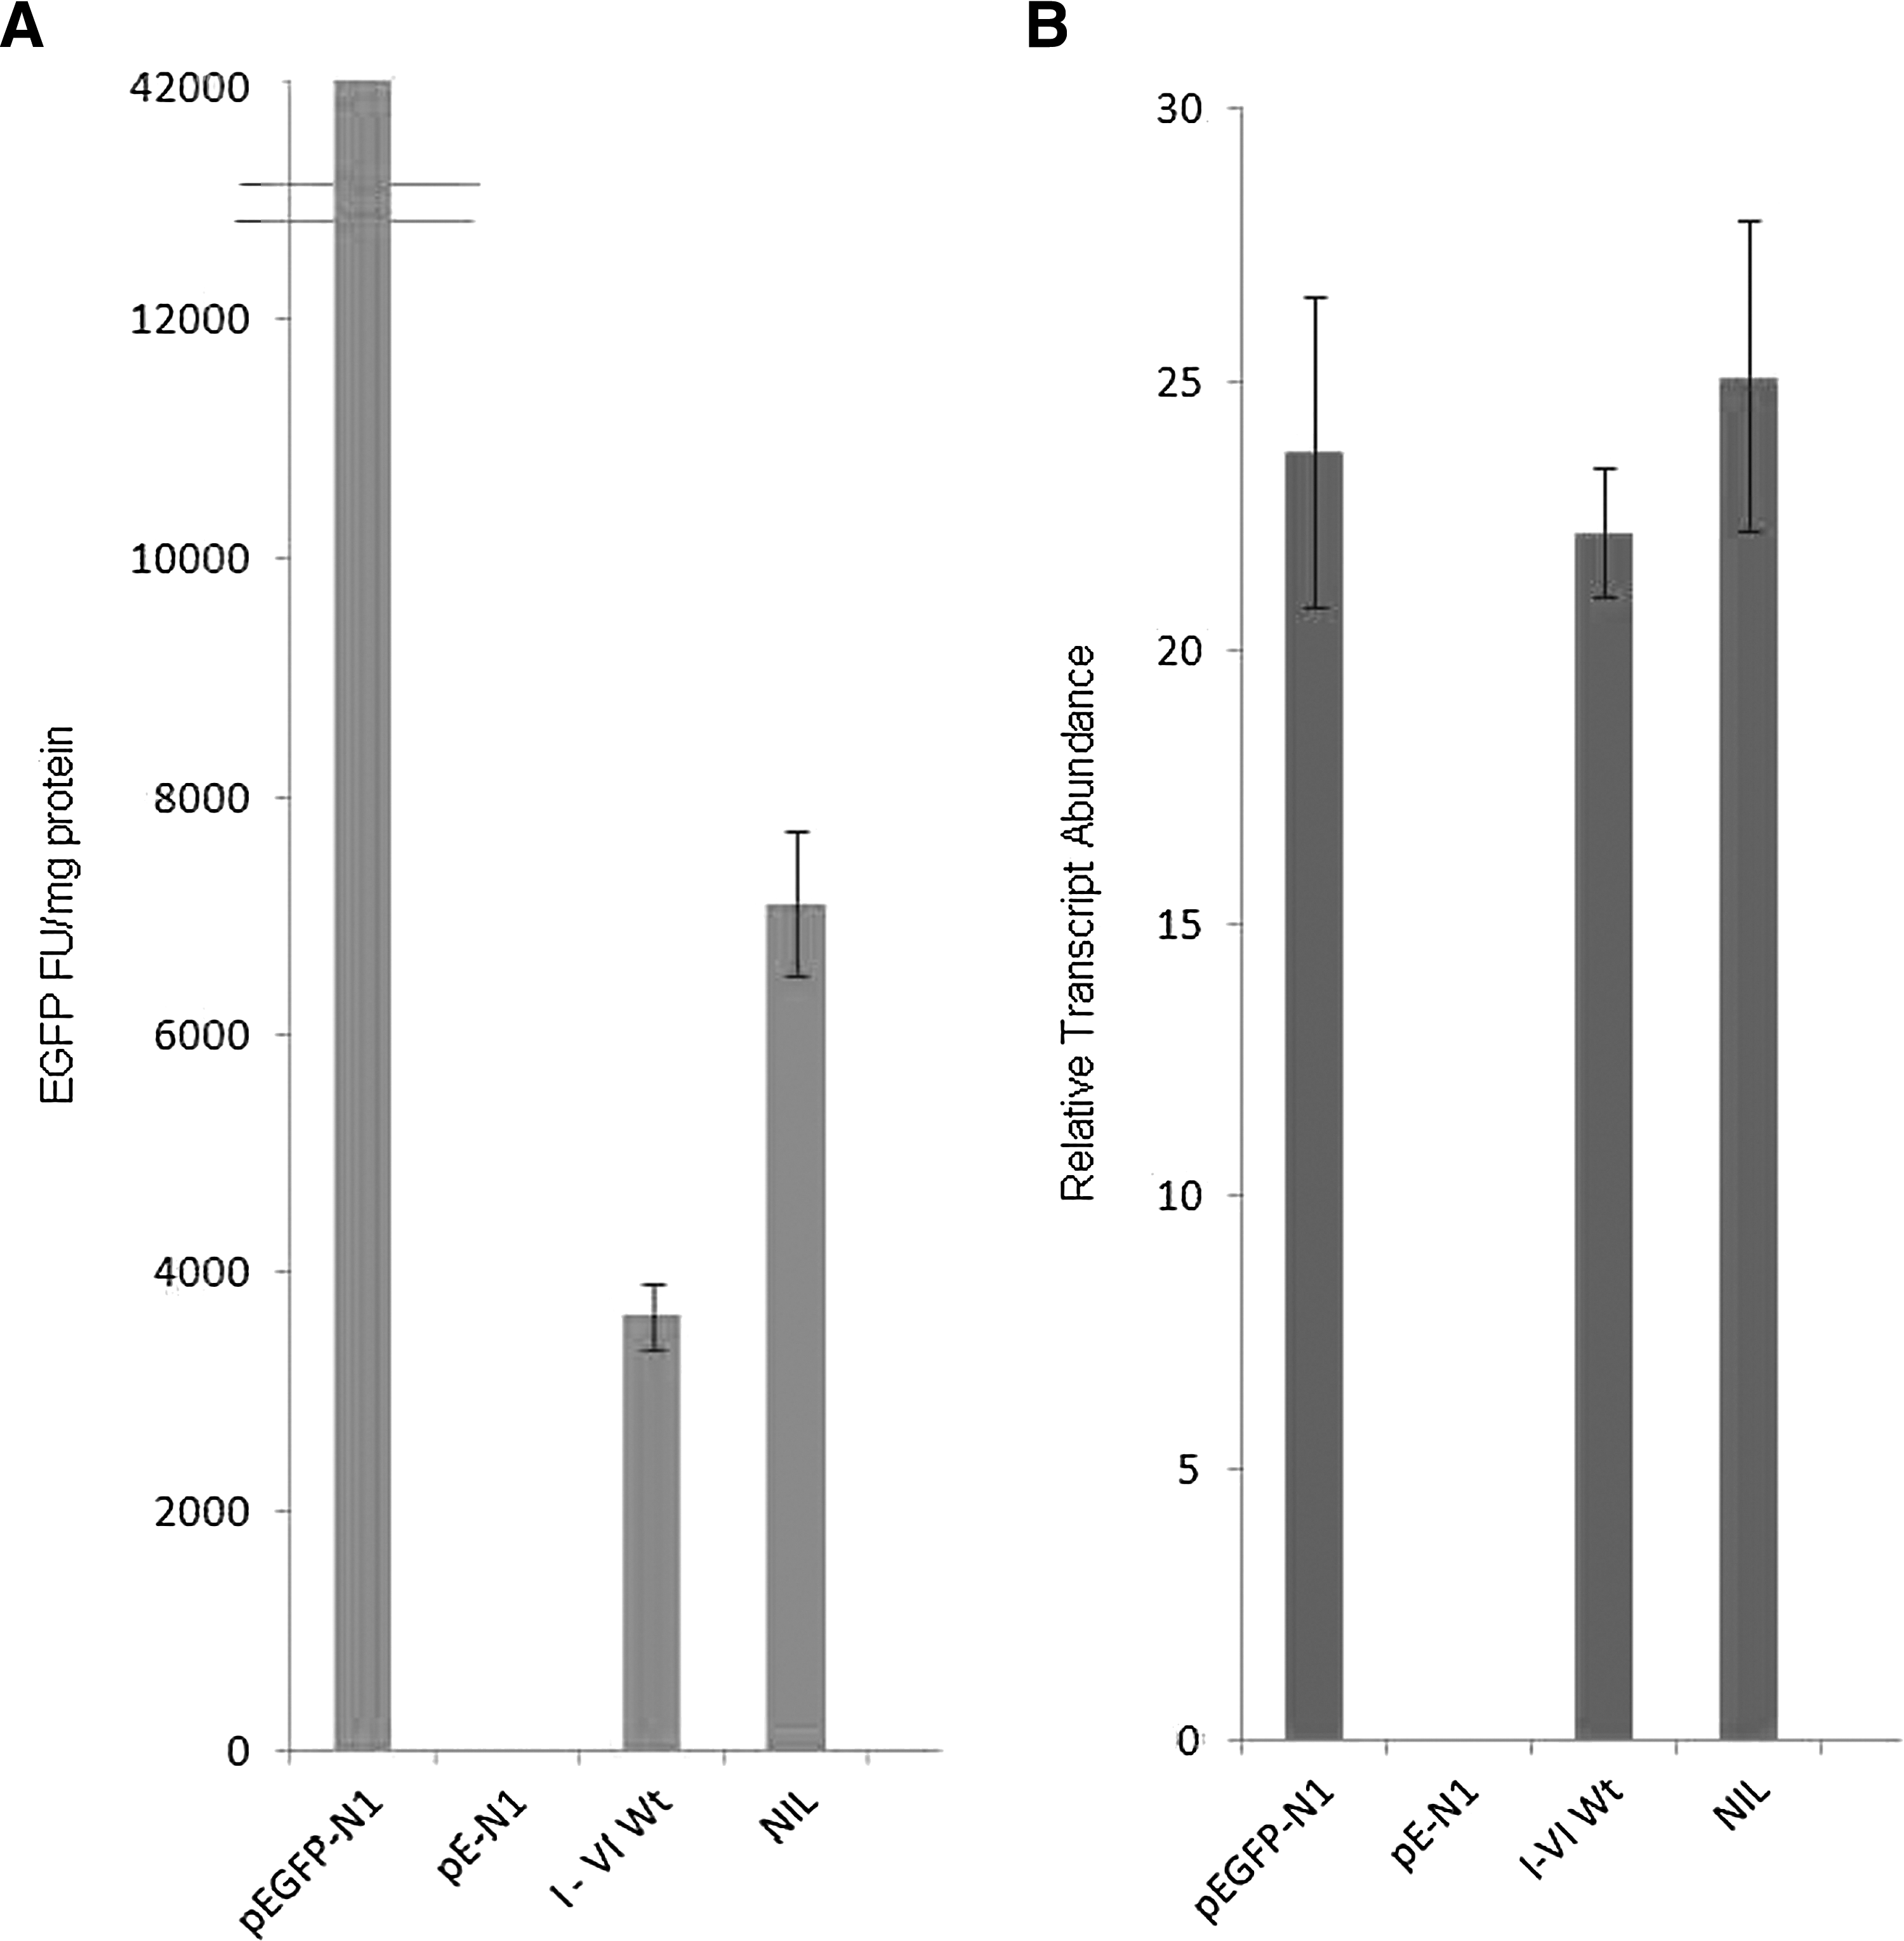
EGFP expression is affected by upstream sORFs. The presence of the upstream sORF region (construct I–VI wt) reduced EGFP expression by 95% in comparison to the parental plasmid. Mutation of all sORFs (construct NIL) results in a 45% increase in EGFP expression compared to the I-VI wt (p<0.01). There is no effect on the abundance of transcript.
The initiator AUG codon of each sORF was mutated, producing a construct without active sORFs (construct NIL). In the absence of active sORFs, a 45% increase in expression compared to the wild-type sORF construct (p<0.01, n=6) (Fig. 2A) was observed; however, transcript abundance was unaffected (Fig. 2B). This suggests that events occurring at the level of translation, rather than transcription, are associated with modulation of gene expression by the asp sORF region.
Alternative splicing of the sORF region and conservation of splice sites
Primers situated immediately up- and downstream of the sORF region (see Fig. 1B) were used to detect the sORF transcript in transfected HEK293 cells. The lack of nonspecific amplification was confirmed by the absence of product from cells transfected with the pEGFP-N1 and pE-N1 plasmids. An amplification product corresponding to the full-length construct transcript (890 bp) was amplified from the cDNA pool (Fig. 3E, fourth lane); however, it was not the most abundant product. At least, two shorter amplimers were also detected in the same cDNA pool: an abundant product (240 bp) and a less abundant product (480 bp). All amplified products were recovered, cloned, and sequenced.
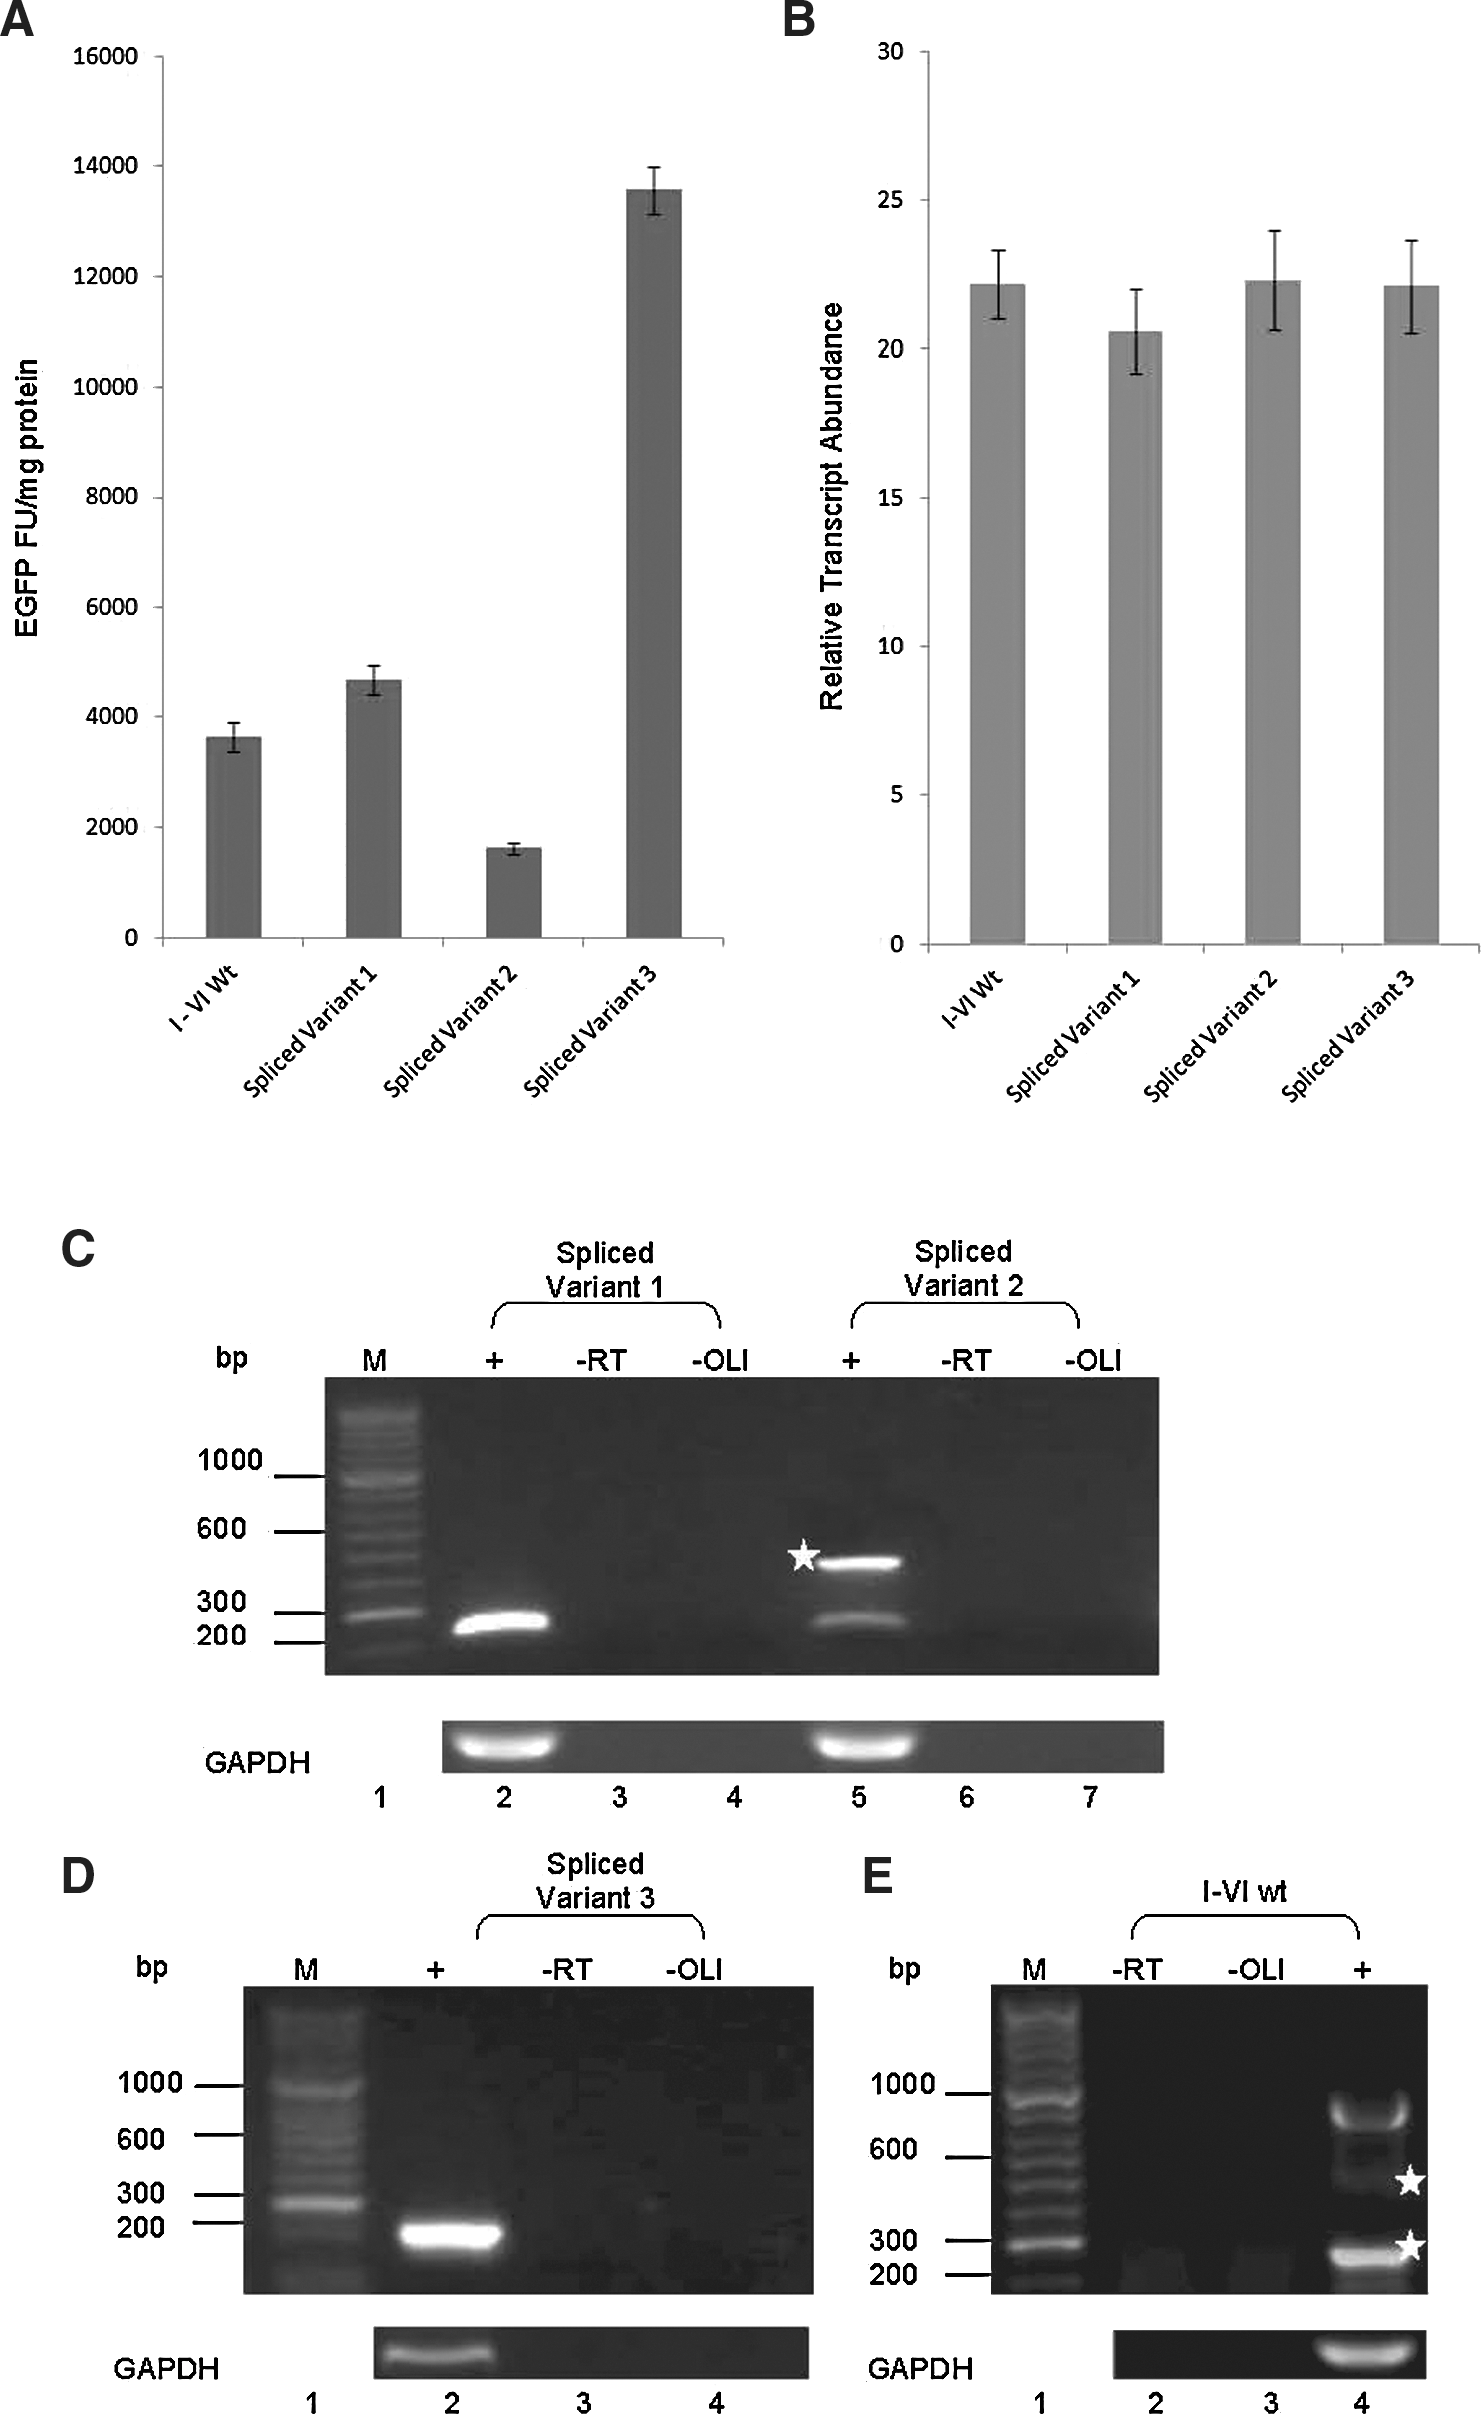
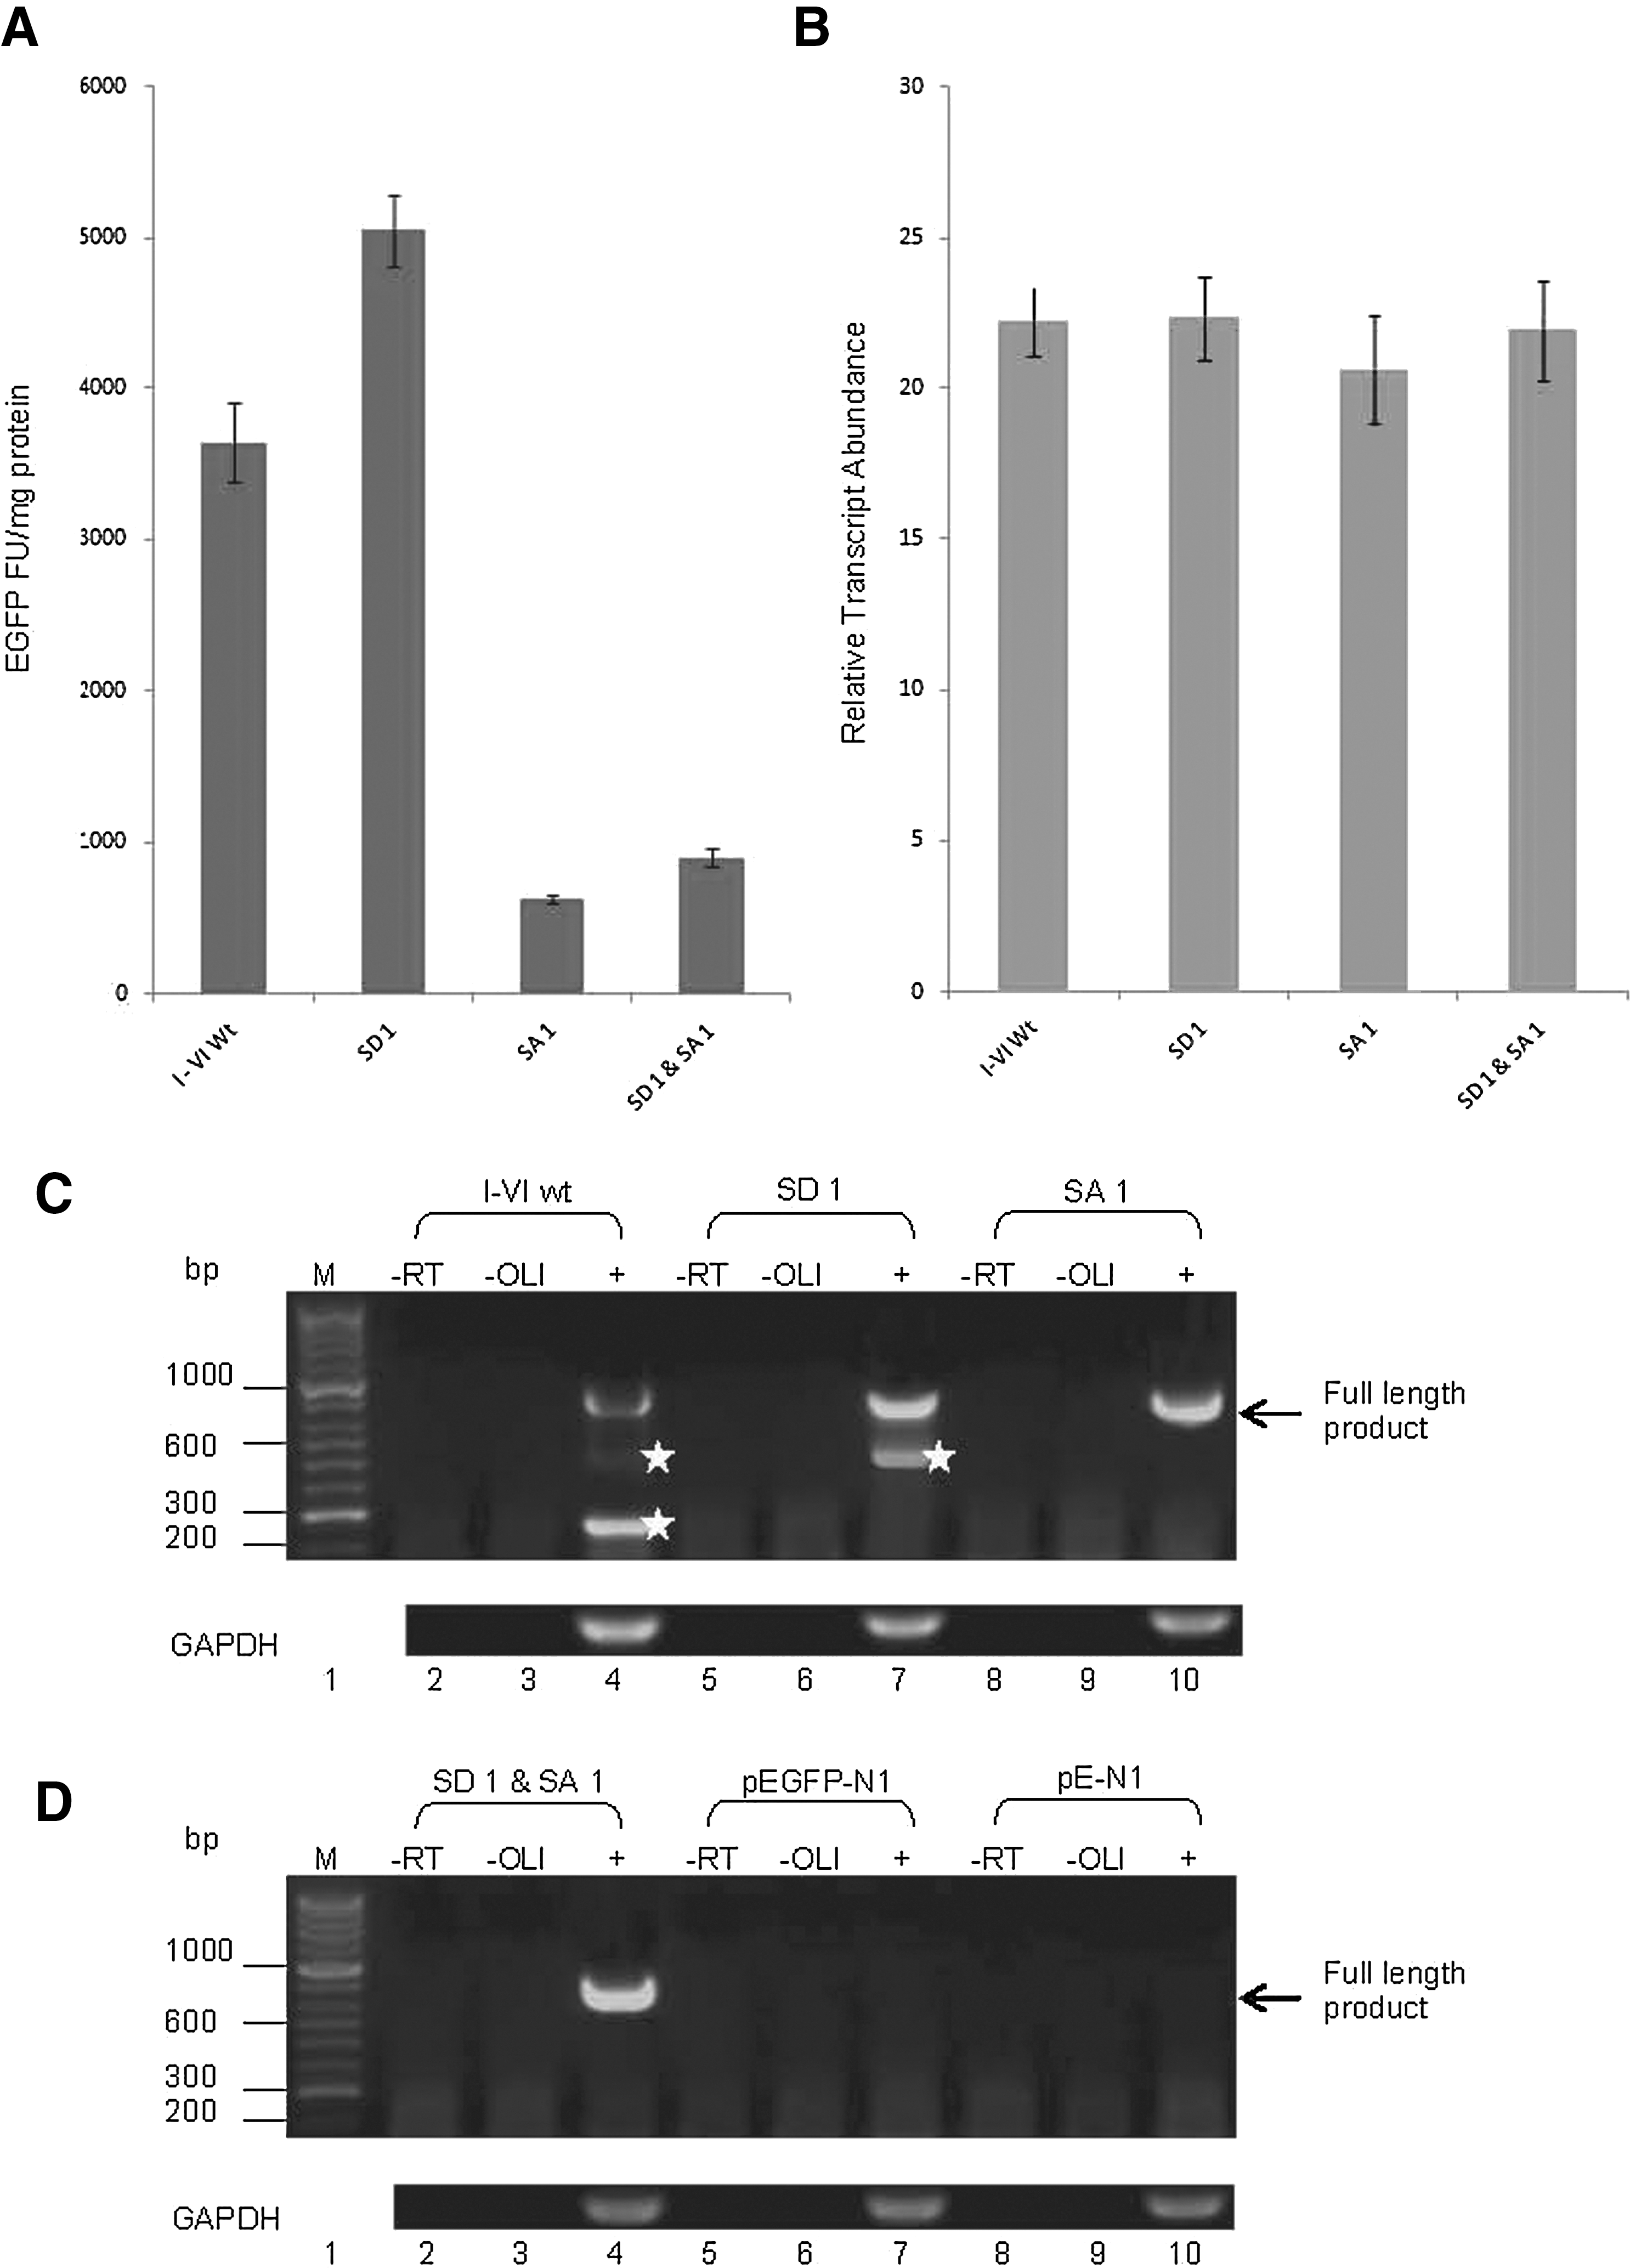
Analysis of spliced variants. Spliced variant 1 increased EGFP expression by 22% (p=0.021) in comparison to the wild type, while spliced variant 2 decreased EGFP expression by 55% (p<0.01) and spliced variant 3 produced a fourfold increase in EGFP expression (p<0.01). Transcript abundance was consistent for all constructs. Reverse transcriptase polymerase chain reaction (RT-PCR) analysis of spliced variants 1 and 2 reveals full transcript within variant 1 and suggests that spliced variant 2 is further processed to produce spliced variant 3.
Alignment of the sequences of the two shorter amplimers with the full-length transcript revealed that splicing had occurred within the transcript (data not shown). The two spliced sequences used the same splice acceptor SA 1 (immediately before sORF I, NL4-3 nt. position 8095) but alternative splice donor sites, SD 1 and SD 2 (NL4-3 nt. positions 8745 and 8540, respectively) as depicted in Figure 1C. The 240-bp splice product (spliced variant 1) resulted from the removal of sORFs I to V inclusive (using SD 1 and SA 1), while the 480-bp splice product (spliced variant 2) resulted from the removal of sORFs III to V inclusive (using SD 2 and SA 1).
Spliced variants 1 and 2 were cloned separately into the plasmid pEGFP-N1, and these constructs were transfected into HEK293 cells; EGFP expression, transcript abundance, and transcript integrity were analyzed as described earlier. Spliced variant 1, which contains only sORF VI, produced a slight increase (22%) in EGFP expression compared to the wild type (p=0.021, n=6) (Fig. 3A), but transcript abundance did not change (Fig. 3B). In contrast, spliced variant 2, which contains sORFs I, II, and VI, produced a 55% decrease in EGFP expression compared to the wild type (p=<0.01, n=6).
Transcript RT-PCR analysis (Fig. 3C) showed that the predominant species produced in spliced variant 1 transfected cells was the expected 240-bp spliced product, containing sORF VI alone (Fig. 3C, lane 2). However, an analysis of spliced variant 2-transfected cells (Fig. 3C, lane 5) revealed two amplified products: the expected 480-bp spliced variant 2, containing sORFs I, II, and VI, and a smaller, less abundant product (214 bp). All amplified products were again recovered, cloned, and sequenced as detailed previously.
Alignment of the sequences of the three products (data not shown) revealed that splicing within the transcript of spliced variant 2, involving SD 1, and an alternative splice acceptor, SA 2 (NL4-3 nt. position 8069) 26-bp downstream of SA 1, had produced a third product (spliced variant 3, Fig. 1C) of similar size to spliced variant 1. This splicing event results in the complete removal of sORFs I and II and the ATG initiation codon of sORF VI, presenting an alternative, in-frame sORF ATG codon (weak Kozak sequence context) 69 bp further downstream (NL4-3 nt. position 8022); this alternative sORF is designated sORF VIalt. Spliced variant 3 was not detected in any of the six colonies screened in the initial RT-PCR and cloning experiments involving spliced variant 1, suggesting that splicing to produce variant 3 is an infrequent event.
Analysis of expression showed that spliced variant 3, which contains only the sORF VIalt ATG initiation codon, produced a fourfold increase in EGFP expression compared to the wild type (p=<0.01, n=6) with no change in transcript abundance (Fig. 3A, B, respectively). Transcript RT-PCR analysis (Fig. 3D, lane 2) confirmed that the predominant species produced in variant 3-transfected cells was of the size expected for the product containing sORF VIalt.
Analysis of the HIV-1NL4-3 sequence revealed typical splice donor (at nt 8745 and 8540) and splice acceptor (at nt 8095 and 8069) sequences. SD 1 (NL4-3 nt. position 8745) was 100% conserved across 27 HIV-1 subtype B sequences examined, while SD 2 (NL4-3 nt. position 8540) of variant 2 was slightly less well conserved (86 and 93% conservation of the two critical nucleotides, respectively) (Fig. 4A). SA 1 was 100% conserved across all 27 HIV-1 B clade sequences examined (Fig. 4B). Analysis of the SA 2 site showed that conservation of the vital A and G nucleotides at positions 13 and 14 was poor (30% and 65%, respectively). There is potential for production of a fourth spliced product, from the moderately conserved SD 2 and the poorly conserved SA 2, but this product was never detected in our experiments.
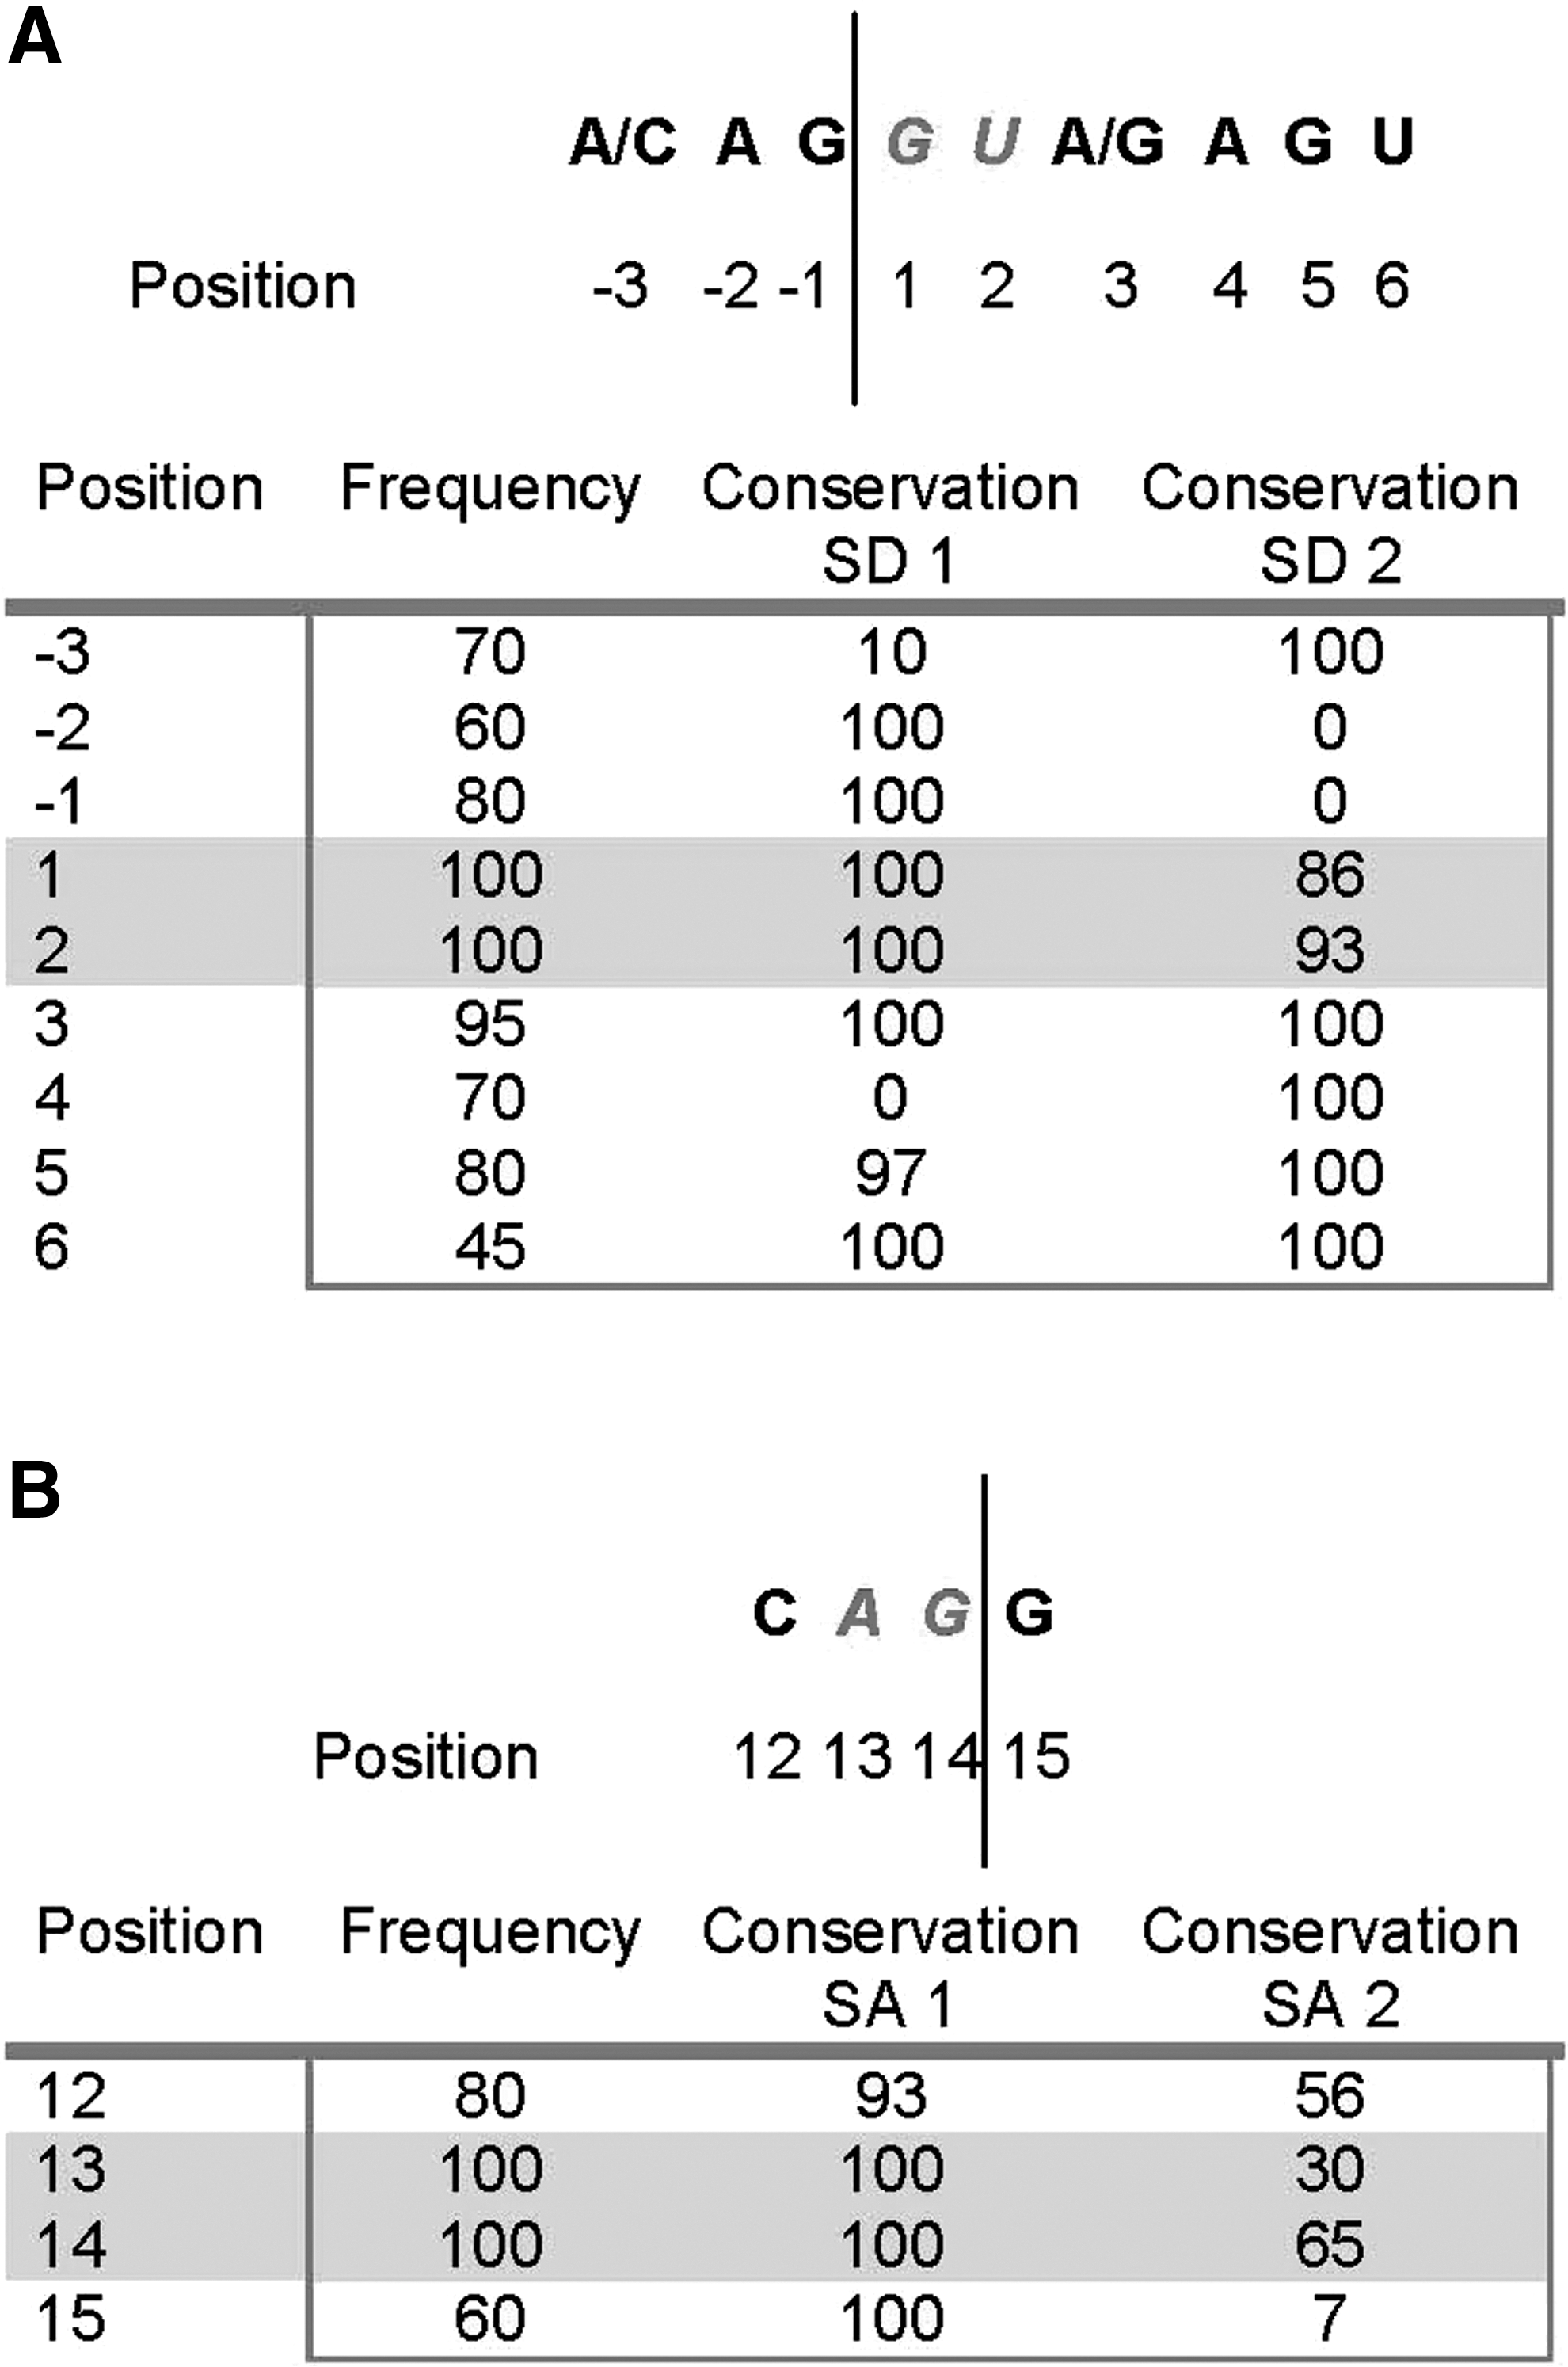
Conservation of splice donor and acceptor motifs. Essential sequence components of splice donor 1 and splice acceptor 1 are 100% conserved across 27 HIV-1 subtype B sequences.
Real-time PCR was used to determine the relative levels of alternatively spliced and unspliced transcripts in the cDNA pool obtained from HEK293 cells transfected with the pEGFP-(sORF I-VI wt) construct. TaqMan probes specific to each species (unspliced product and spliced variants 1, 2, and 3) were used. All four probes were efficient (Fig. 5A). The probe specificity was confirmed using positive control DNA; absence of amplification in –RT-indicated samples were not contaminated with DNA. Copy numbers indicate that variants 1 and 3 are the most abundant products (Fig. 5B) present in 3:2 ratio (p<0.01, n=3). In combination, these two transcripts are eightfold more abundant than the unspliced transcript, consistent with our RT-PCR experiments (Fig. 3E, Lane 4). Spliced variant 2 was the least abundant of all the transcripts, equivalent to 6% of the unspliced transcript (p<0.01, n=3).
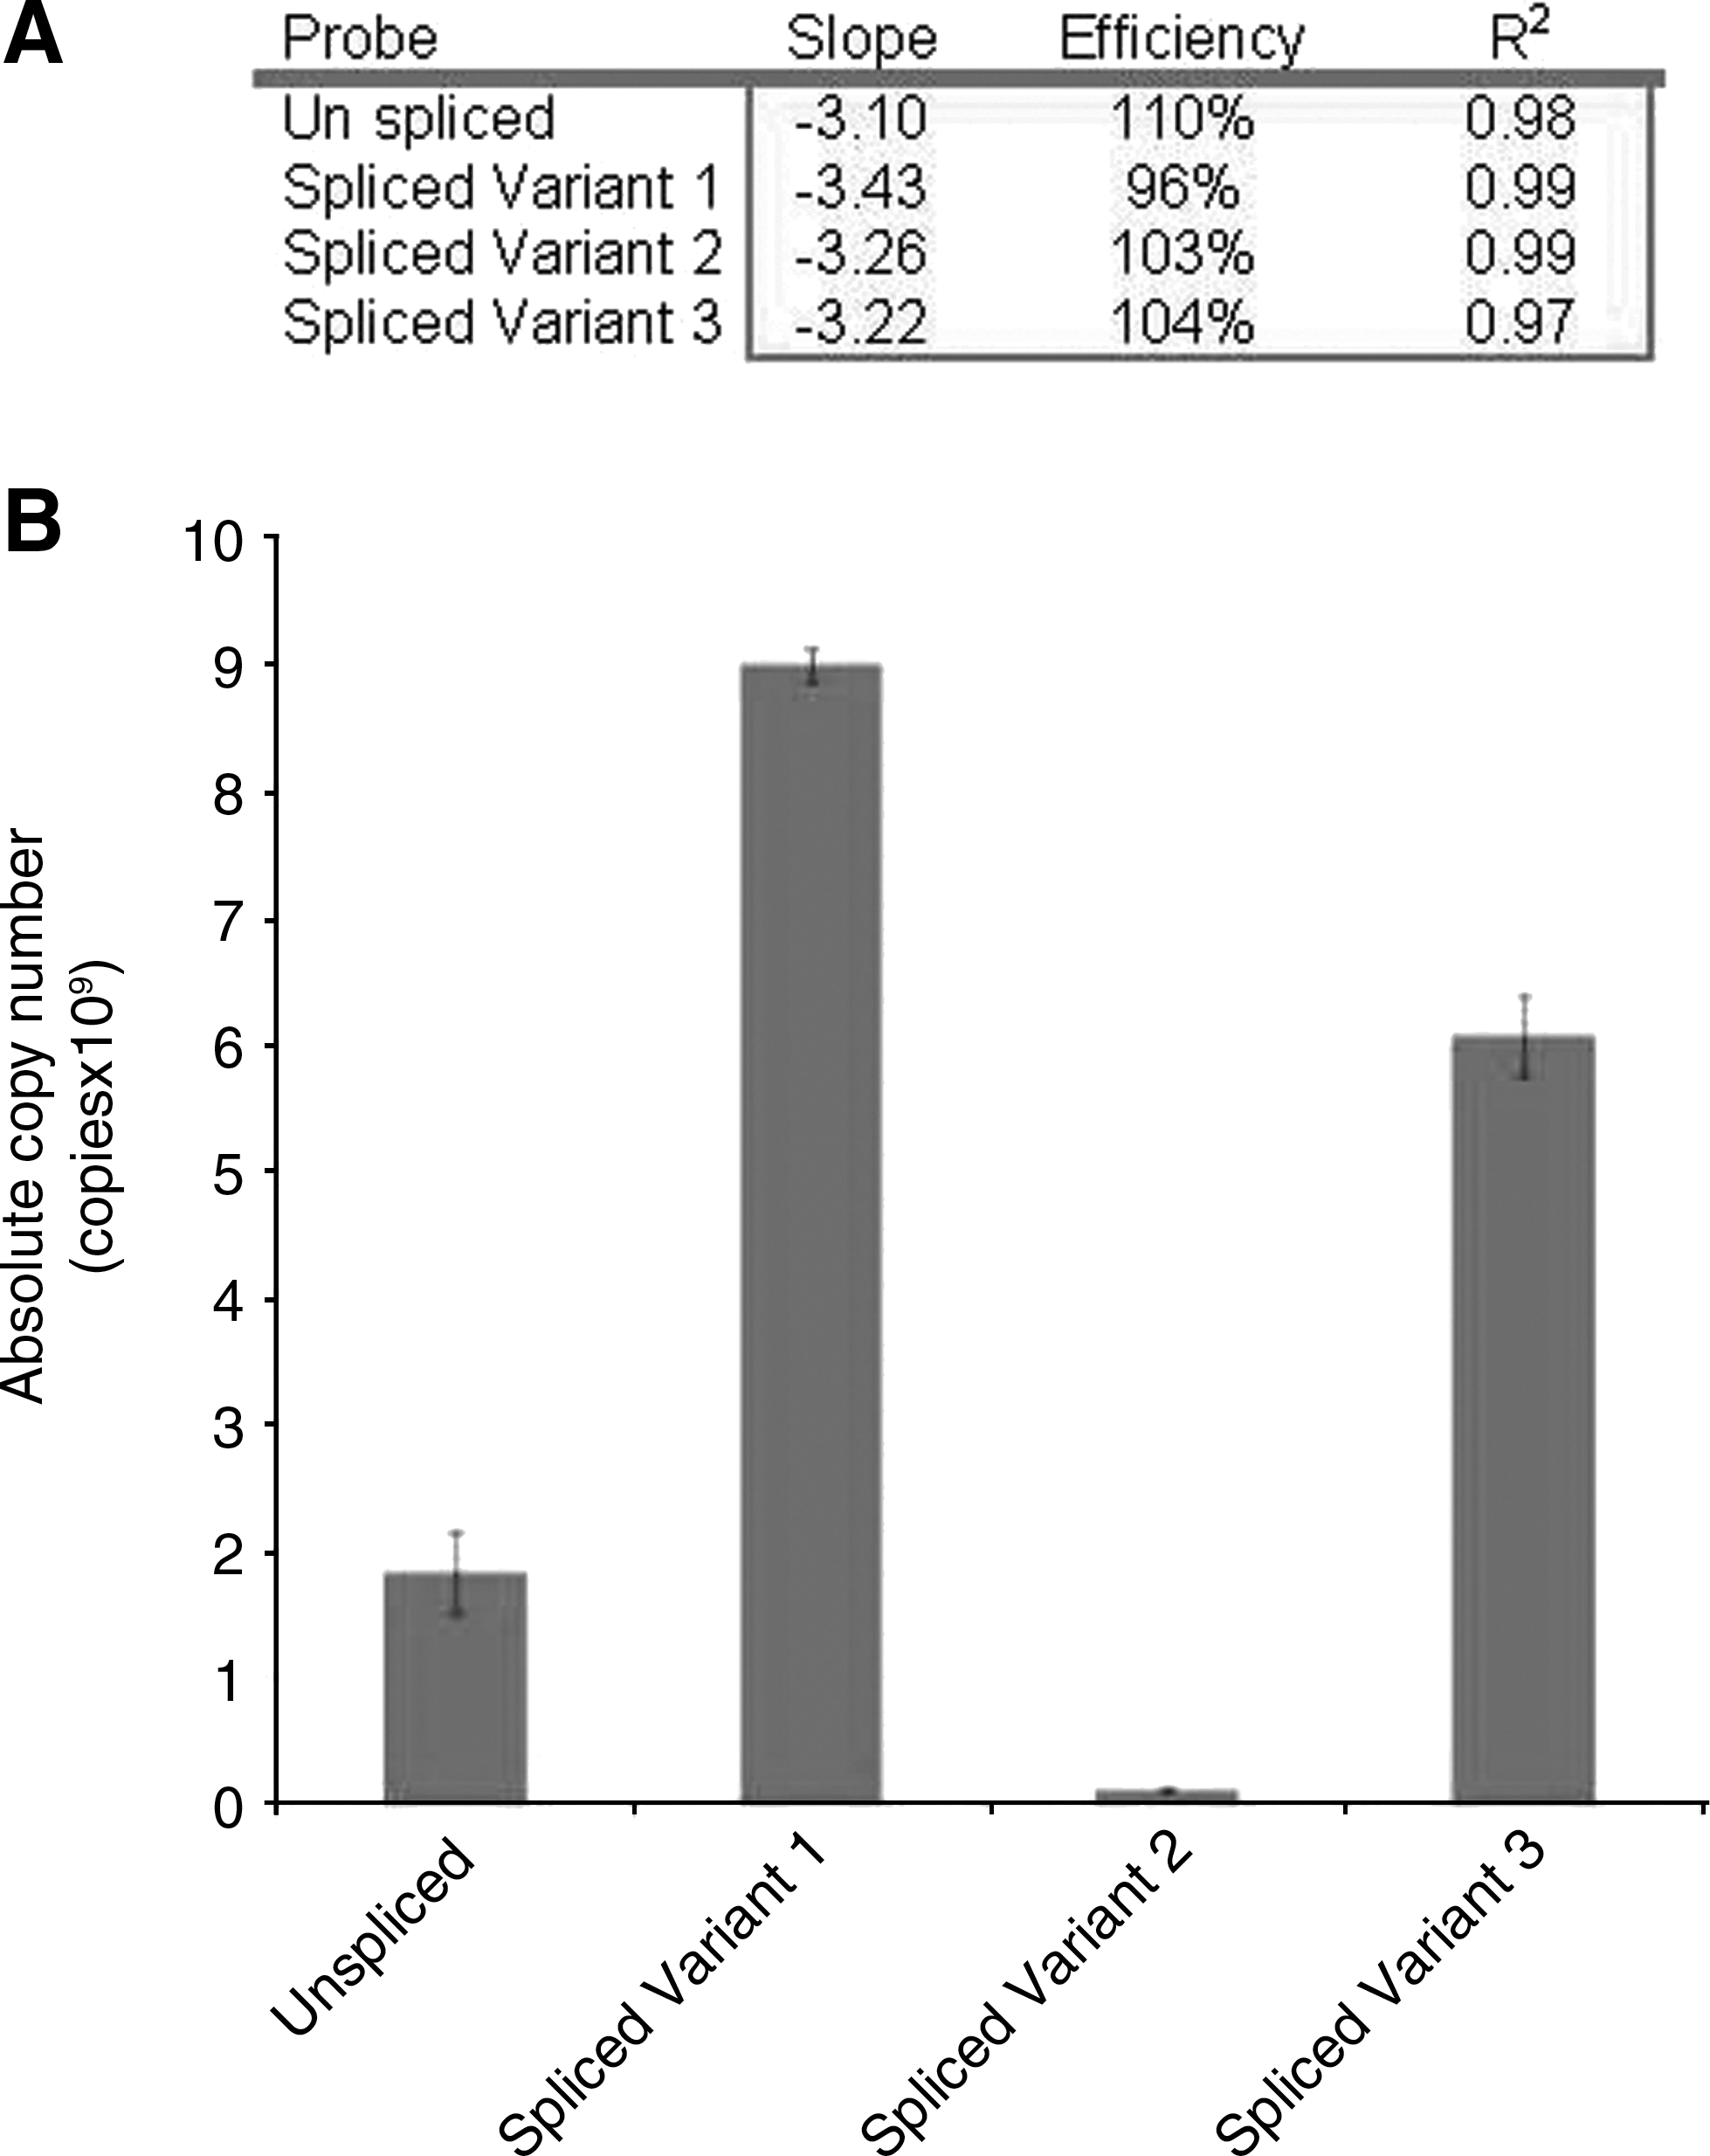
Quantitative real-time PCR analysis of transcript abundance. Real-time PCR analysis confirms that spliced variants 1 and 3 are the most abundant products present at a ratio of 3:2 (p<0.01) and, in combination, are eightfold more abundant than the unspliced transcripts. Spliced variant 2 was the least abundant of all the transcripts.
Effects of mutating the SA 1 and SD 1 motifs
Constructs in which the SD 1 and/or SA 1 sites had been mutated were transfected into HEK293 cells alongside the pEGFP-(sORF I-VI wt) construct and controls (pEGFP-N1, pE-N1); analysis of reporter gene expression, transcript abundance, and transcript integrity was performed as previously described.
Mutation of the conserved splice donor (SD 1) produced a 28% increase in EGFP expression compared to the wild type (p=0.003, n=6) (Fig. 6A); transcript abundance did not change (Fig. 6B). RT-PCR analysis (Fig. 6C, seventh lane) showed that both the full-length, unspliced transcript and spliced variant 2 (produced using the alternative splice donor site, SD 2, at nt 8540) were present (confirmed by the PCR product sequence analysis, Fig. 6C, Lane 7, starred). Note that spliced variant 3 was not detected due to the absence of SD 1.
Effects of mutating the major splice donor and acceptor motifs. Mutation of splice donor 1 increased EGFP expression by 28% (p=0.003) in comparison to the wild type. Mutation of splice acceptor 1 (with or without disruption of splice donor 1) decreased EGFP expression to ∼17% of wild-type levels. Transcript abundance is consistent for all constructs. RT-PCR analysis of splice donor 1 mutant reveals splicing to produce spliced variant 2, while mutation of splice acceptor 1 with or without splice donor 1 abolishes splicing activity.
Similar results were obtained when SA 1 was disrupted in either the presence or absence of SD1. Production of EGFP was reduced to ∼17% of wild-type levels (Fig. 6A), and transcript abundance was again unaffected (Fig. 6B). The predominant cDNA/mRNA species in each instance was the full-length, unspliced transcript; no splice products were detected (Fig. 6C, lanes 4 and 10).
Discussion
The expression of negative-sense genes in retroviruses has been contentious until negative-sense transcription in HTLV-1 was shown to produce a protein of functional importance (Gaudray et al., 2002; Arnold et al., 2006). While HBZ has been shown to be a transcription factor, no functional role has yet been attributed to HIV-1 ASP.
While the conservation of the asp ORF in HIV-1 has been well established (Miller, 1988), this work describes the presence and high-level conservation of a series of sORFs upstream of the asp ORF across all subtypes of HIV-1. Upstream sORFs are typically associated with translational regulation of the downstream gene product; examples include many genes for which tight regulation of expression is critical (Davuluri et al., 2000; Morris et al., 2000; Suzuki et al., 2000). Here, we have demonstrated that the sORF region upstream of HIV-1 asp regulates the expression of a downstream reporter gene without any change in transcript abundance. Regulation was abolished by mutation of the sORF AUG initiation codons, suggesting a translational mechanism of regulation.
In addition, we have shown that the asp sORF region undergoes alternative splicing in vitro producing at least three different spliced variants in addition to the unspliced transcript; the most abundant of these retains only the sORF immediately preceding asp, sORF VI. Michael et al. (1994) and Bukrinsky and Etkin (1990) reported negative-sense asp transcripts of sizes 2.3 kb and 1.6 kb, respectively. These can now be explained as the unspliced and predominant spliced (utilizing SA 1 and SD 1) forms, differing by the size of the 0.65-kb intron that we have detected. The importance of SA 1 and SD 1 is supported by the high conservation of these typical splice acceptor and donor sequences. While conservation of SD1 could be explained by high-level conservation of the positive-sense strand, as required to maintain Pro (NL4-3 Env Pro814) in this position within Env gp41, this is not the case for SA1. The inclusion of any nucleotide base at position X of the ACX nucleotide sequence would maintain Thr at this position within gp41 (NL4-3 Env Thr597), suggesting that another selective pressure is responsible for the high-level conservation observed here. SD 2 is only moderately conserved and SA 2 is poorly conserved, so these sites may be of little importance.
Our experiments have shown that mutation of the predominantly utilized splice acceptor, SA 1, abolishes splicing activity of the sORF region, drastically reducing reporter expression. Splicing may have a role in releasing the severe inhibitory effect of the presence of the sORFs, in a similar manner to regulation of expression of the Estrogen Receptor α by alternative splicing of upstream sORFs reported by Kos et al. (2002).
Spliced variant 1 (containing sORF VI alone) produces a higher level of expression in comparison to spliced variant 2 (containing sORFs I, II, and VI), which could be related to the number of upstream sORFs. However, spliced variant 3 (sORF VIalt) produces much higher levels of expression than either spliced variants 1 or 2, suggesting specific inhibition associated with sORF VI. This inhibition is also observed in the wild-type pool of unspliced and mixed spliced variants. The mechanism by which ribosomes translate these transcripts is not known and is the subject of further work in our laboratory.
Transcription of the negative-sense gene is restricted to the early phase of infection by T-cell transcription factors acting on the negative-sense promoter (Michael et al., 1994; Bentley et al., 2004). This study indicates that translation may also be strongly inhibited by the presence of multiple sORFs upstream of asp; inhibition may be modulated by alternative splicing of the upstream transcript. Such multi-modal regulation would permit a combination of regulatory signal inputs to precisely control asp expression, limiting ASP production to a particular phase in the virus replication cycle and/or in response to host signaling events. The potential for intron sequences to control expression of proviral and host cell genes via si-RNA or mi-RNA pathways, activities that are becoming increasingly apparent (Yeung et al., 2007; Klase et al., 2009; Schopman et al., 2011), must also be considered.
Most studies on asp and its expression to date, including this work, have used gene or specific region (e.g., upstream region, LTR) constructs. It is now crucial to extend these investigations into HIV-1-infected cell systems. However, the transient expression (Landry et al., 2007) of asp regulated by transcription from the 3′-LTR, the potential for alternative splicing of the transcript, and sORF inhibition of translation, as well as the lack of a known function for ASP, present great challenges.
Conclusions
The strong conservation of asp and its sORFs across all HIV-1 subtypes suggests that the asp gene product may have a tightly regulated role in the pathogenesis of HIV-1. We have shown that the asp sORF region inhibits downstream gene expression and may be alternatively spliced. This may provide a potential mechanism for the control of expression of the asp gene.
Footnotes
Acknowledgments
The authors wish to thank Dr. D. Purcell (Department of Microbiology and Immunology, The University of Melbourne, Australia) for providing the pE-N1-negative control plasmid and Mr Zoon Chan (The School of Applied Sciences and Engineering, Monash University, Gippsland, Australia) for assistance in cloning of spliced variants 1 and 2. We also wish to acknowledge the assistance of Dr. Karen Laurie and Ms. Louise Carolan (The Victorian Infectious Diseases Reference Laboratory, Melbourne, Australia) with the quantitative RT-PCR experiments.
This work was supported by The School of Applied Sciences and Engineering, Monash University, Gippsland campus.
Authors' Contributions
M.S.B. completed in silico analyses and performed the majority of the experimental work; K.E.B. performed preliminary RT-PCR analysis; N.J.D. assisted with data interpretation and experimental design; J.A.M. assisted with experimental design, research supervision, and data analysis; all authors participated in drafting of the article and approved the final article.
Author Disclosure Statement
The authors declare that they have no competing financial interests.