
Abstract
Fluoxetine is a selective serotonin reuptake inhibitor (SSRI) antidepressant that is widely prescribed. The DNA-binding behavior of fluoxetine antidepressant and calf thymus DNA was investigated in Tris-HCl buffer at physiological pH 7.4 with a series of techniques, including UV-Vis and circular dichroism spectroscopies, competitive study with Hoechst 33258, viscometry, and cyclic voltammetry. Fluoxetine molecules bind to DNA via groove mode as illustrated by hypochromism with no red shift in the UV absorption band of fluoxetine, decrease in Hoechst–DNA solution fluorescence, and no significant changes in viscosity of DNA. The CD spectra of DNA molecules show a little change in stacking mode of base pair but no modification changes in DNA conformation, for example, from B-DNA to A or C-DNA. The binding constant (Kb ) of DNA with fluoxetine was calculated to be 6.7×10⁴ M−1, which is in the range of reported and known groove binders, such as distamycin. All results showed the groove-binding mode of interaction of fluoxetine with DNA.
Introduction
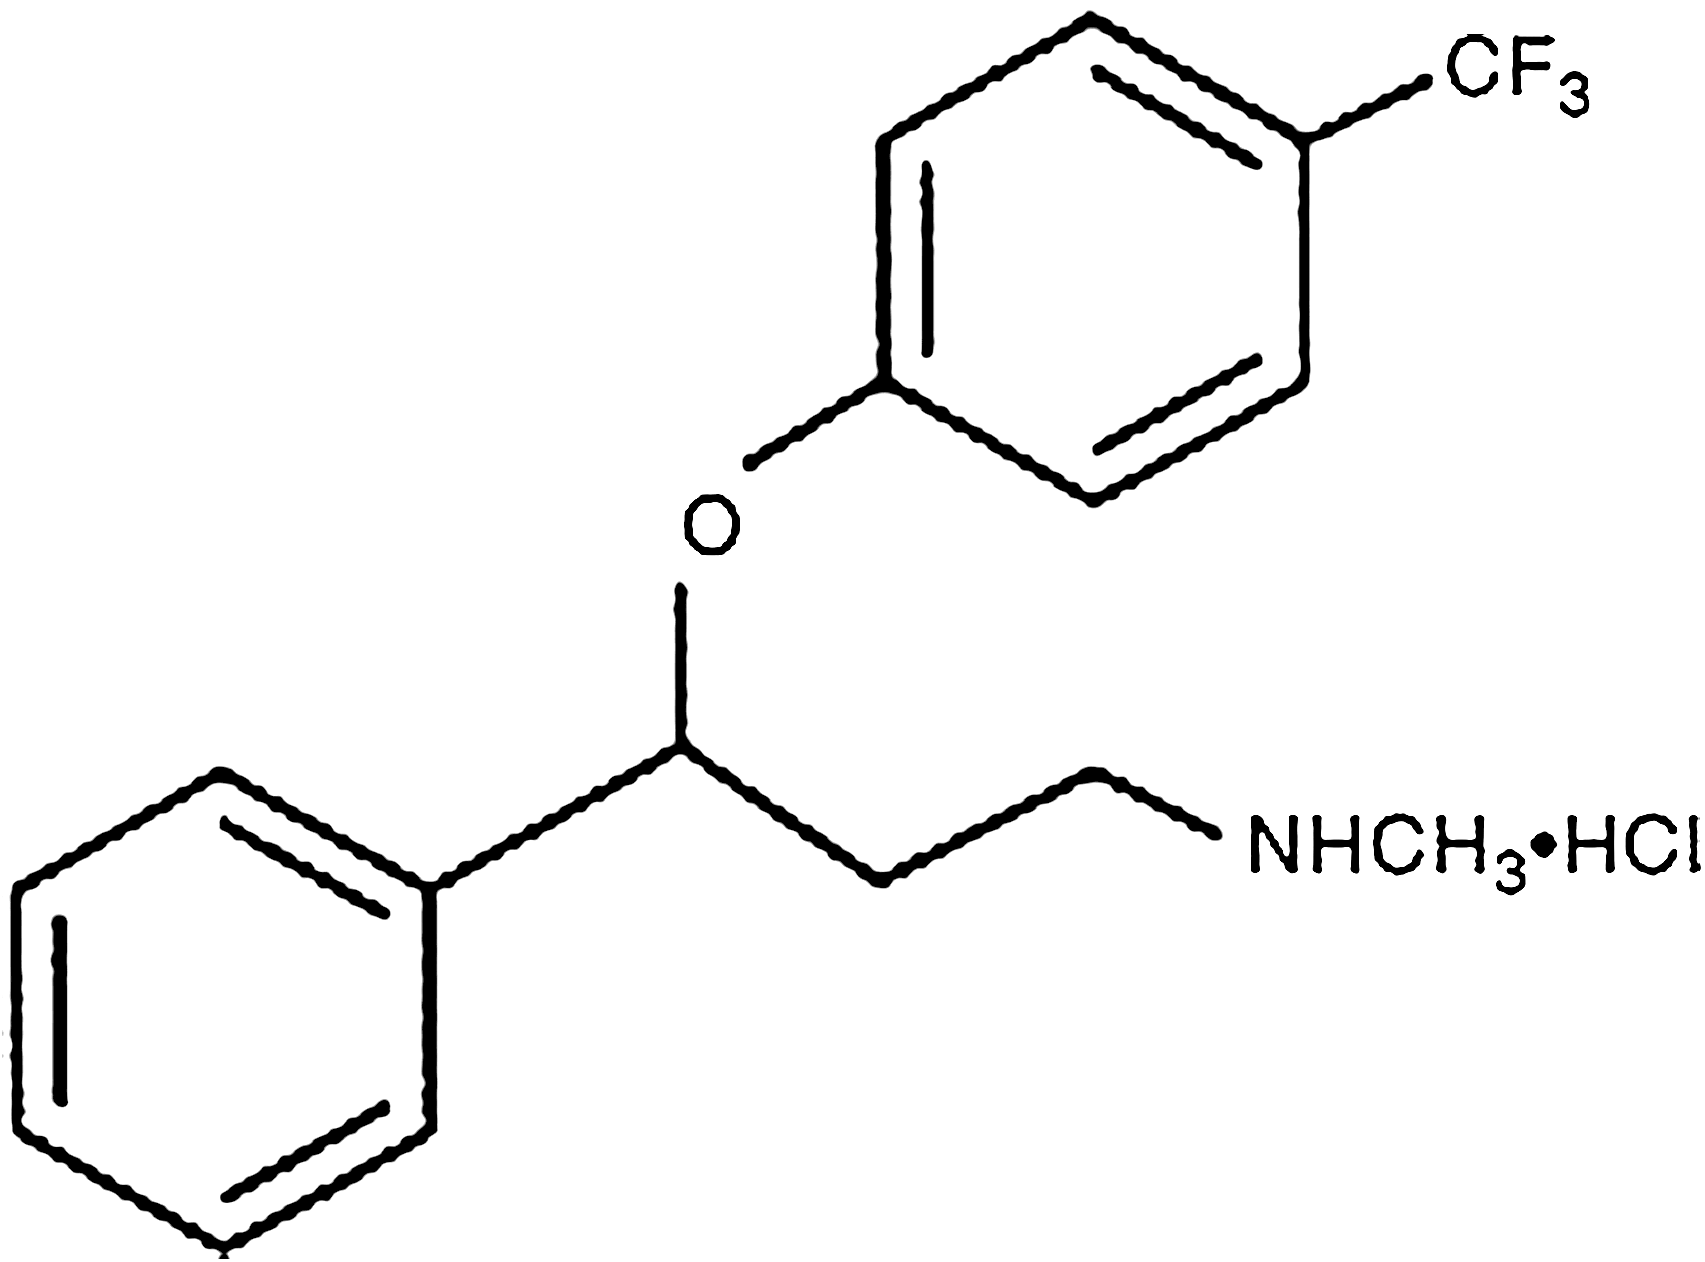
Molecular structure of fluoxetine HCl (N-methyl-3-phenyl-3-[(α,α,α-trifluoro-ρ-tolyl)oxy]propylamine).
Deoxy ribonucleic acid plays an important role in the life process, because it bears heritage information and instructs the biological synthesis of proteins and enzymes through the replication and transcription of genetic information in living cells (Kumar and Arunachalam, 2006).
Small molecules can react with DNA via covalent or noncovalent interactions, with interest generally focusing on the latter. There are several types of sites in the DNA molecule where such binding can occur: (i) between two base pairs (full intercalation), (ii) in the minor groove, (iii) in the major groove, and (iv) on the outside of the helix (Pyle et al., 1989; Ni et al., 2006).
Because of the widespread usage of fluoxetine antidepressant (Margolis et al., 2000) and the importance of intact DNA in the life of organisms (Wyatt et al., 1999), in the present study, we investigated the interaction of native calf thymus DNA (CT-DNA) with fluoxetine in 10 mM Tris-HCl aqueous solution at neutral pH 7.4.
Materials and Methods
Chemicals and materials
Highly polymerized CT-DNA and Tris-HCl were purchased from Sigma Co. NaOH, potassium acetate, and Hoechst 33258 were purchased from Merck. Fluoxetine was dedicated benevolently by Dr. Abidi Pharma Company. All solutions were prepared using double-distilled water. Tris-HCl buffer solution was prepared from Tris–(hydroxymethyl)-amino-methane–hydrogen chloride and pH was adjusted to 7.4. Fluoxetine stock solution (10−3 M) was prepared by dissolving an appropriate amount of the compound in Tris-HCl buffer. Solutions of CT-DNA gave the UV absorbance ratio (260/280 nm) of more than 1.8, indicating that the DNA was sufficiently free of protein. The DNA concentration per nucleotide was determined by absorption spectroscopy using a molar absorption coefficient (ɛ) of 6600 M−1·cm−1 at 260 nm (Lawrence et al., 2006; Kashanian et al., 2008a; Rao et al., 2008; Sasmal et al., 2008; Kashanian and Zeidali, 2011). The stock solutions were stored at 4°C and used within 4 days.
Physical measurements and instrumentation
The UV-Vis spectra for DNA–fluoxetine interactions were obtained using an Agilent 8453 spectrophotometer. Absorption titration experiments were conducted by keeping the concentration of fluoxetine constant (5×10⁻⁵ M) while varying the DNA concentration from 0 to 5×10⁻⁴ M (r i=[DNA]/[fluoxetine]=0.00, 1, 3, 5, 8, and 10). Solutions of DNA and fluoxetine were scanned in a 0.5-cm (1-mL) quartz cuvette. Fluorescence intensities were measured using a Cary luminescence spectrometer with the following setting: 350 nm as excitation wavelength and 480 nm as emission wavelength. In the competitive binding studies, concentrations of DNA and Hoechst 33258 were kept constant (5×10⁻⁵ and 5×10⁻⁵ M−1, respectively) while varying the fluoxetine concentration from 0 to 0.5×10⁻⁵ M. Circular dichroism (CD) measurements were recorded on a JASCO (J-810) spectropolarimeter by keeping the concentration of DNA constant (8×10⁻⁵ M) while varying the fluoxetine concentration from 0 to 7.2×10⁻⁵ M (r i=[fluoxetine]/[DNA]=0.0, 0.3, 0.5, and 0.9). For viscosity measurements, a viscometer (SCHOT AVS 450) was used, kept at 25°C using a constant temperature bath. DNA concentration was kept constant (5×10⁻⁵ M) and the concentration of fluoxetine was varied from 0 to 5×10⁻⁴ M. Data are presented as (η/η o)1/3 versus r i, where r i=[fluoxetine]/[DNA] and η is the viscosity of DNA in the presence of the fluoxetine and η o is the relative viscosity of DNA alone. Relative viscosity values were calculated from the observed flow time of DNA solution (t) and corrected for the flow time of buffer alone (t o), using the expression η o=(t−t o)/t o (Lawrence et al., 2006; Kashanian and Zeidali, 2011). The cyclic voltammetric (CV) measurements were performed by SAMA with a three-electrode system: a Hanging Mercury drop electrode as working electrode, silver–silver chloride (Ag/AgCl) as reference electrode, and a platinum wire as counter electrode. For voltammetric measurements, the supporting electrolyte (5.0 mM Tris-HCl buffer solution, pH 7.3) was located in a polarographic cell of volume 10 mL and deaerated via purging with pure N2 gas for 2 min. The CV measurements were carried out by keeping both concentration of the fluoxetine and the total volume of solution constant while the dsDNA concentration was varied.
For cleavage study, first, plasmid DNA was isolated as follows: pure culture of Escherichia coli containing plasmid DNA was incubated at 37°C for 12 h in nutrient broth containing kanamycin. The broth was harvested after 12 h, centrifuged at 4000 rpm for 5 min, and was decanted and the entire medium was drained. The pellet was resuspended in 1 mL of SET (sucrose, ethylene diamine tetraacetic acid, and Tris-HCl) buffer by vortexing. Appropriate concentration of NaOH and sodium dodecyl sulfate buffer was added to make a final concentration of 10% (v/v), mixed well (without vortexing), and incubated on ice for 5 min. Then, 1.5 mL of potassium acetate solution (5 M) was added and mixed immediately. Following 5 min of incubation on ice, 4.5 mL chloroform:isoamylalcohol (24:1) was added to the extraction mixture and the resulting solution was centrifuged for 10 min at 8000 rpm and at 4°C. The supernatant was collected in a new tube, 10 mL of 100% EtOH (kept at room temperature) was added, and the solution was centrifuged for 5 min at 10,000 rpm. The pellet was washed with 5 mL of 70% EtOH (kept at room temperature), centrifuged 5 min at 5000 rpm, and dried. The pellet was dissolved in TE (Tris-HCl and ethylene diamine tetraacetic acid) buffer (nearly 200 mL), 50 mL RNase A (1 mg/mL in TE) was added, and then the mixture was incubated at 37°C for 1–2 h. The homogeneity of plasmid DNA was confirmed by gel electrophoresis (Shahabadi et al., 2010a; Kashanian and Zeidali, 2011). DNA was stored at −20°C until use. Reaction of fluoxetine with PUC18 plasmid DNA (0.02 molar) was performed in TE buffer (pH 8). The contents were incubated for 3 h at 37°C. Concentration dependence studies were performed using different fluoxetine ratios (r i=[fluoxetine]/[DNA]=0.00, 0.05, 0.1, and 0.25). Electrophoresis was conducted at 80 V for 1 h in TBE buffer solution using 1% agarose gel to analyze DNA. The gel was stained with ethidium bromide and photographed using UV illumination (Kashanian et al., 2011).
Results
Electronic spectral studies of fluoxetine
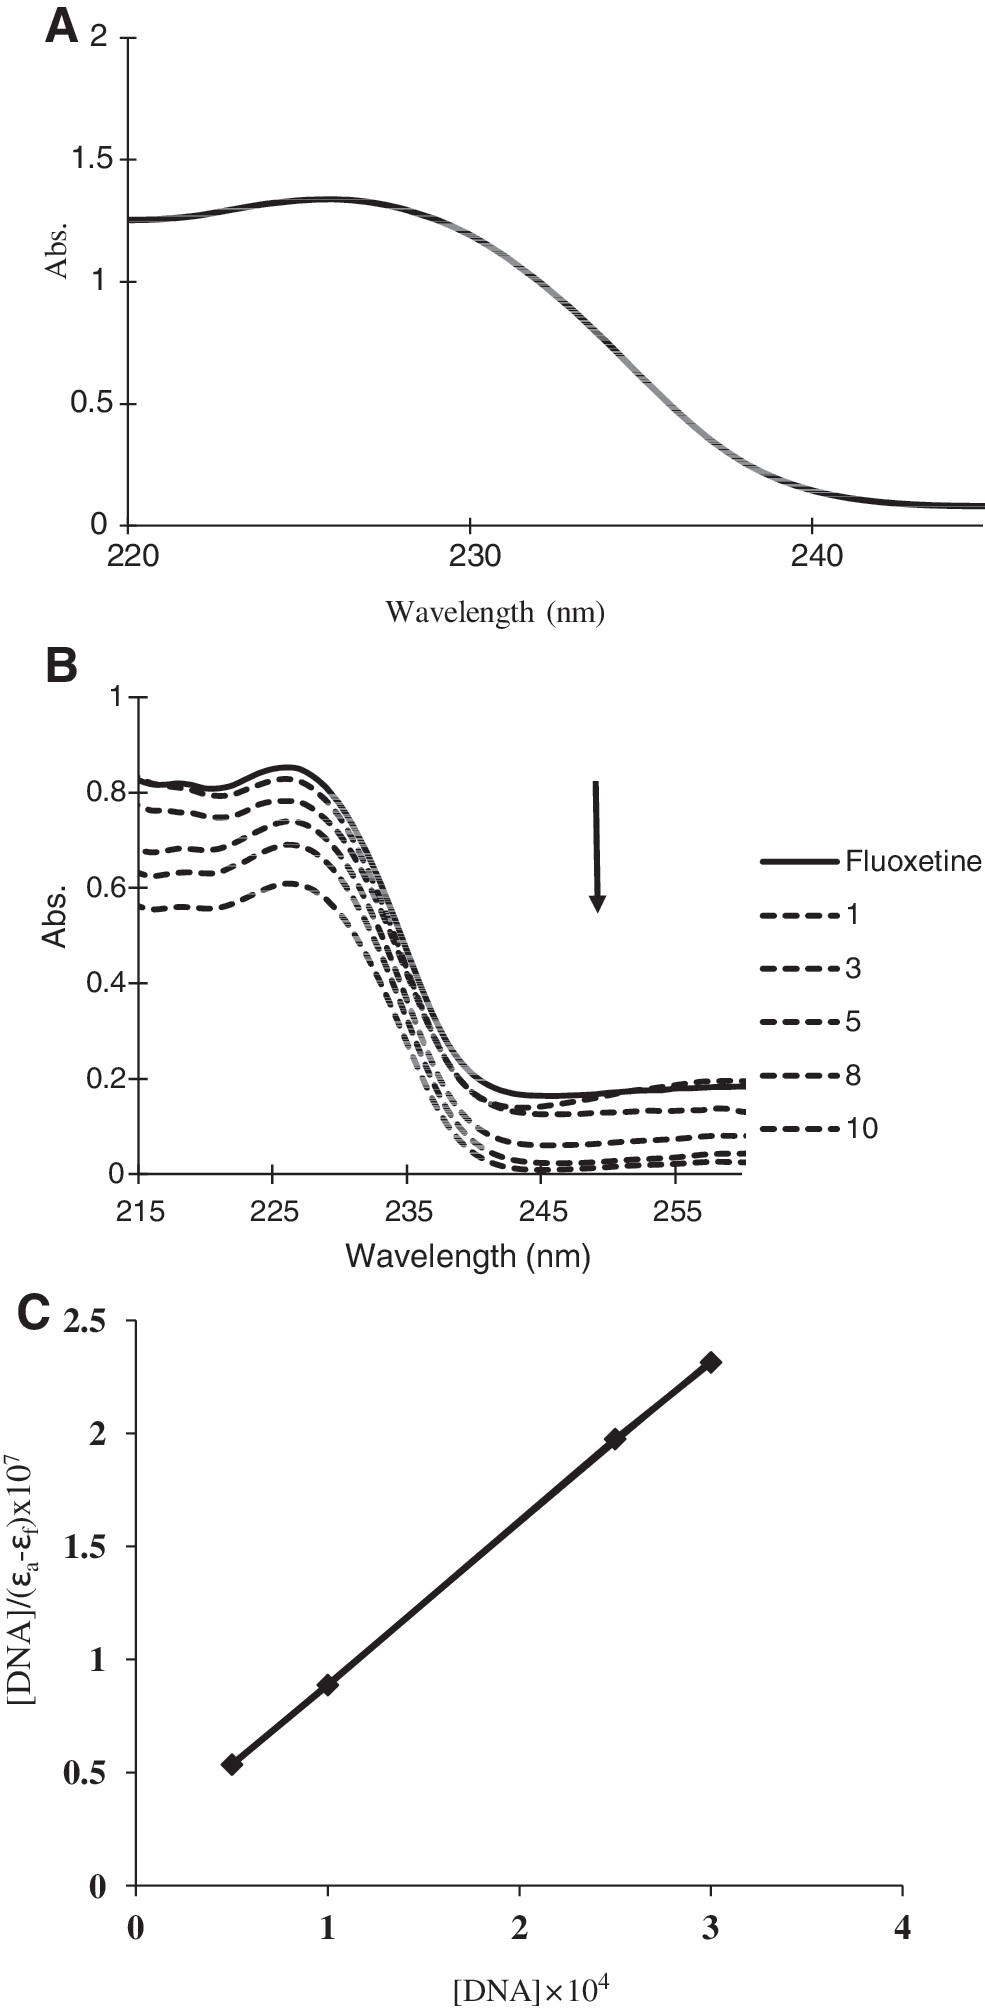
Electronic absorption spectroscopy is one of the most useful techniques for DNA-binding studies (Wu et al., 2005). The absorption spectra of fluoxetine in the absence and presence of CT-DNA are given in Figure 2A and B, respectively. There exists in Figure 2A a well-resolved band at 226 nm for fluoxetine. With increasing DNA concentrations, the hypochromism increased, which suggests that target molecules have strong interaction with DNA (Xu et al., 2008). Hypochromicity in the absorption spectra generally accompanies the binding of molecules to DNA. The extent of spectral change is related to the strength of binding. From the absorption spectra of the complex it can be suggested that the complex exhibited intense absorption bands in the UV region, which are attributed to intra-ligand π–π* transition of the coordinated groups. In the presence of DNA, the absorption bands of the fluoxetine at about 226 nm exhibited hypochromism. The spectroscopic changes suggest that the complex has interacted with DNA (Chen et al., 2009). The absorption data were analyzed to evaluate the intrinsic binding constant (Kb
), which can be determined from equation 1.
Where the apparent absorption coefficients ɛa, ɛf, and ɛb correspond to A obsd/[M], the extinction coefficients of the free compound, and the extinction coefficient of the compound when fully bound to DNA, respectively. By plotting [DNA]/(ɛa – ɛf) versus [DNA] (Fig. 2C), Kb is given via ratio of the slope to the intercept. The intrinsic binding constant Kb of fluoxetine was 6.7×10⁴ M−1. The Kb value obtained here is lower than that of reported for classical intercalators (e.g., ethidium bromide and [Ru(phen)DPPZ], whose binding constants have been found to be in the order of 106–107 M−1) (Waring, 1965; Cory et al., 1985). The observed binding constant is in the range of the groove binders of DNA, as observed in the literature (Vaidyanathan and Nair, 2003; Xu et al., 2008).
Competitive binding between Hoechst 33258 and fluoxetine for DNA
To investigate the mode of fluoxetine binding to DNA, a competitive binding experiment was performed. Hoechst 33258 binds strongly to the minor groove of double-stranded B-DNA with specificity for AT-rich sequences (Kakkar et al., 2001). The interaction of Hoechst 33258 with DNA in pH 7.4 Tris-HCl was characterized by the fluorescence spectra; fluorescence emission spectra are significantly enhanced by increasing the DNA concentration (Guan et al., 2006; Kashanian and Zeidali, 2011). A significant decrease in the Hoechst–DNA solution fluorescence after addition of fluoxetine was observed (Fig. 3).
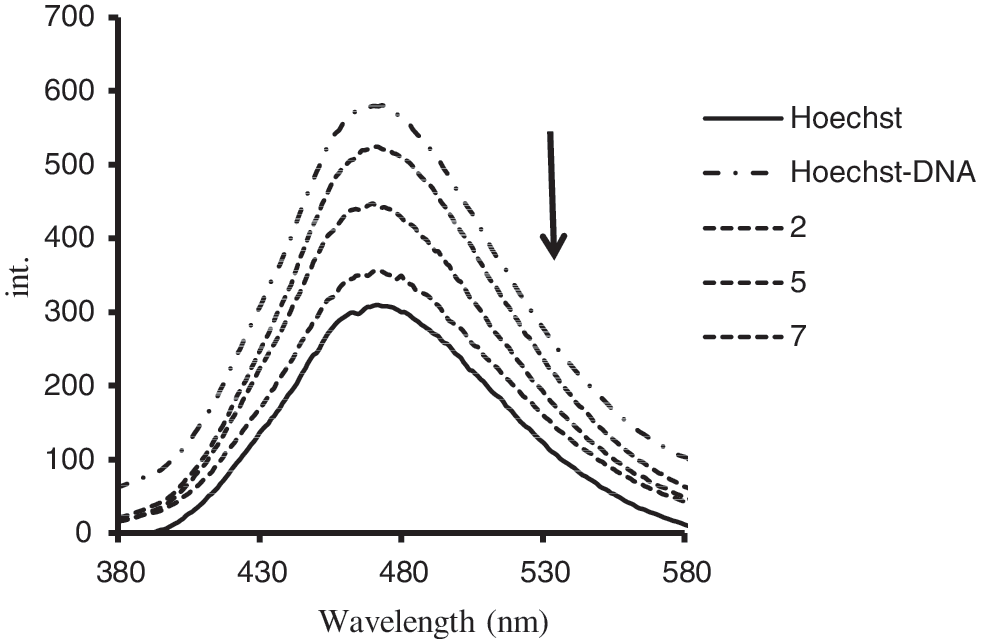
Emission spectra of the Hoechst–DNA complex in the presence of increasing amounts of fluoxetine in aqueous solution at room temperature (r i=[fluoxetine]/[DNA–Hoechst]=2, 5, and 7). The arrow shows the decrement of Hoechst-DNA emission intensity spectra after addition of increasing amounts of Fluoxetine, as it is illustrated in the text.
CD spectral studies
CD spectroscopic technique is useful to monitor the conformational variations of DNA in solution.
The well-known CD spectrum of CT-DNA is a conservative pattern with a positive ellipticity at approximately 275.9 nm due to base stacking and a negative one at 245.4 nm due to polynucleotide helicity (Lincoln et al., 1997). The interaction of fluoxetine with DNA induces a change in the CD spectrum of the B-DNA. The intensity of negative band has a little change upon increasing of fluoxetine concentration, but decrement of positive DNA band is obvious, as indicated in Figure 4.
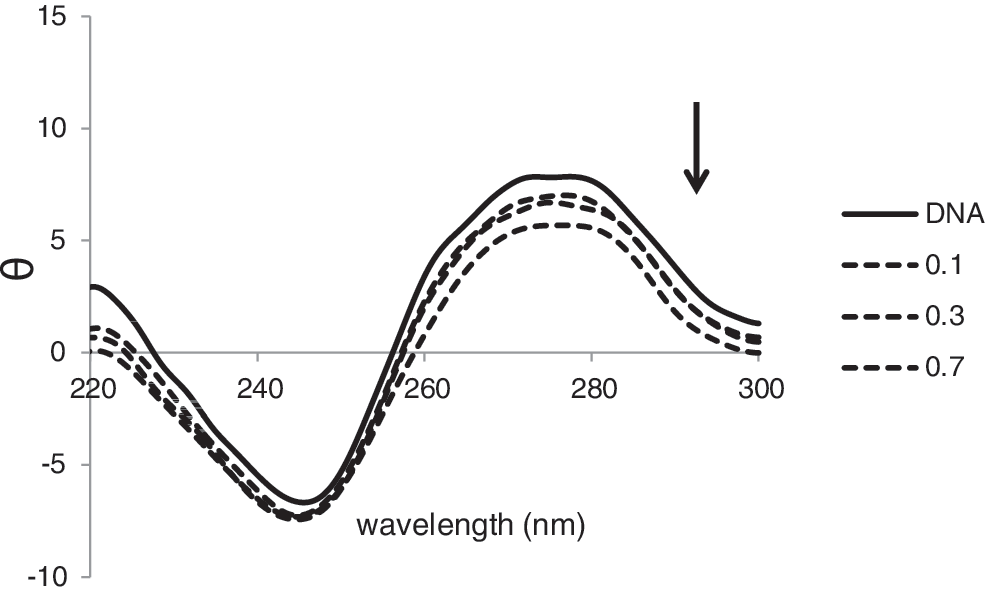
Circular dichroism spectra of DNA (88.0×10⁻⁵ M) in 0.01 M Tris-HCl buffer, in the presence of increasing amounts of fluoxetine (r i=[fluoxetine]/[DNA]=0.0, 0.1, 0.3, and 0.7). The arrow shows that with the increasing amounts of FLX there is a decrease in CD absorption spectra as it is illustrated in the text.
Viscosity study
Viscosity measurement can be a simple method to distinguish the binding mode of DNA-binding agents (Wilson and Jones, 1982). Viscosity measurements may be used to monitor such DNA structural changes by the length changes of rod-like DNA. It has already been proved that under appropriate conditions intercalative molecules cause a significant increase in viscosity of DNA solutions due to increase in separation of base pairs at intercalation sites and hence an increase in overall DNA contour length. In contrast, some molecules that bind exclusively in the grooves of DNA, under the same conditions, induce less-pronounced or no changes in DNA solution viscosity (Qiu et al., 2007). In our experiment, the viscosity measurements were carried out on CT-DNA by varying the concentration of fluoxetine and the result showed that addition of the drug causes no significant viscosity changes (see Fig. 5).
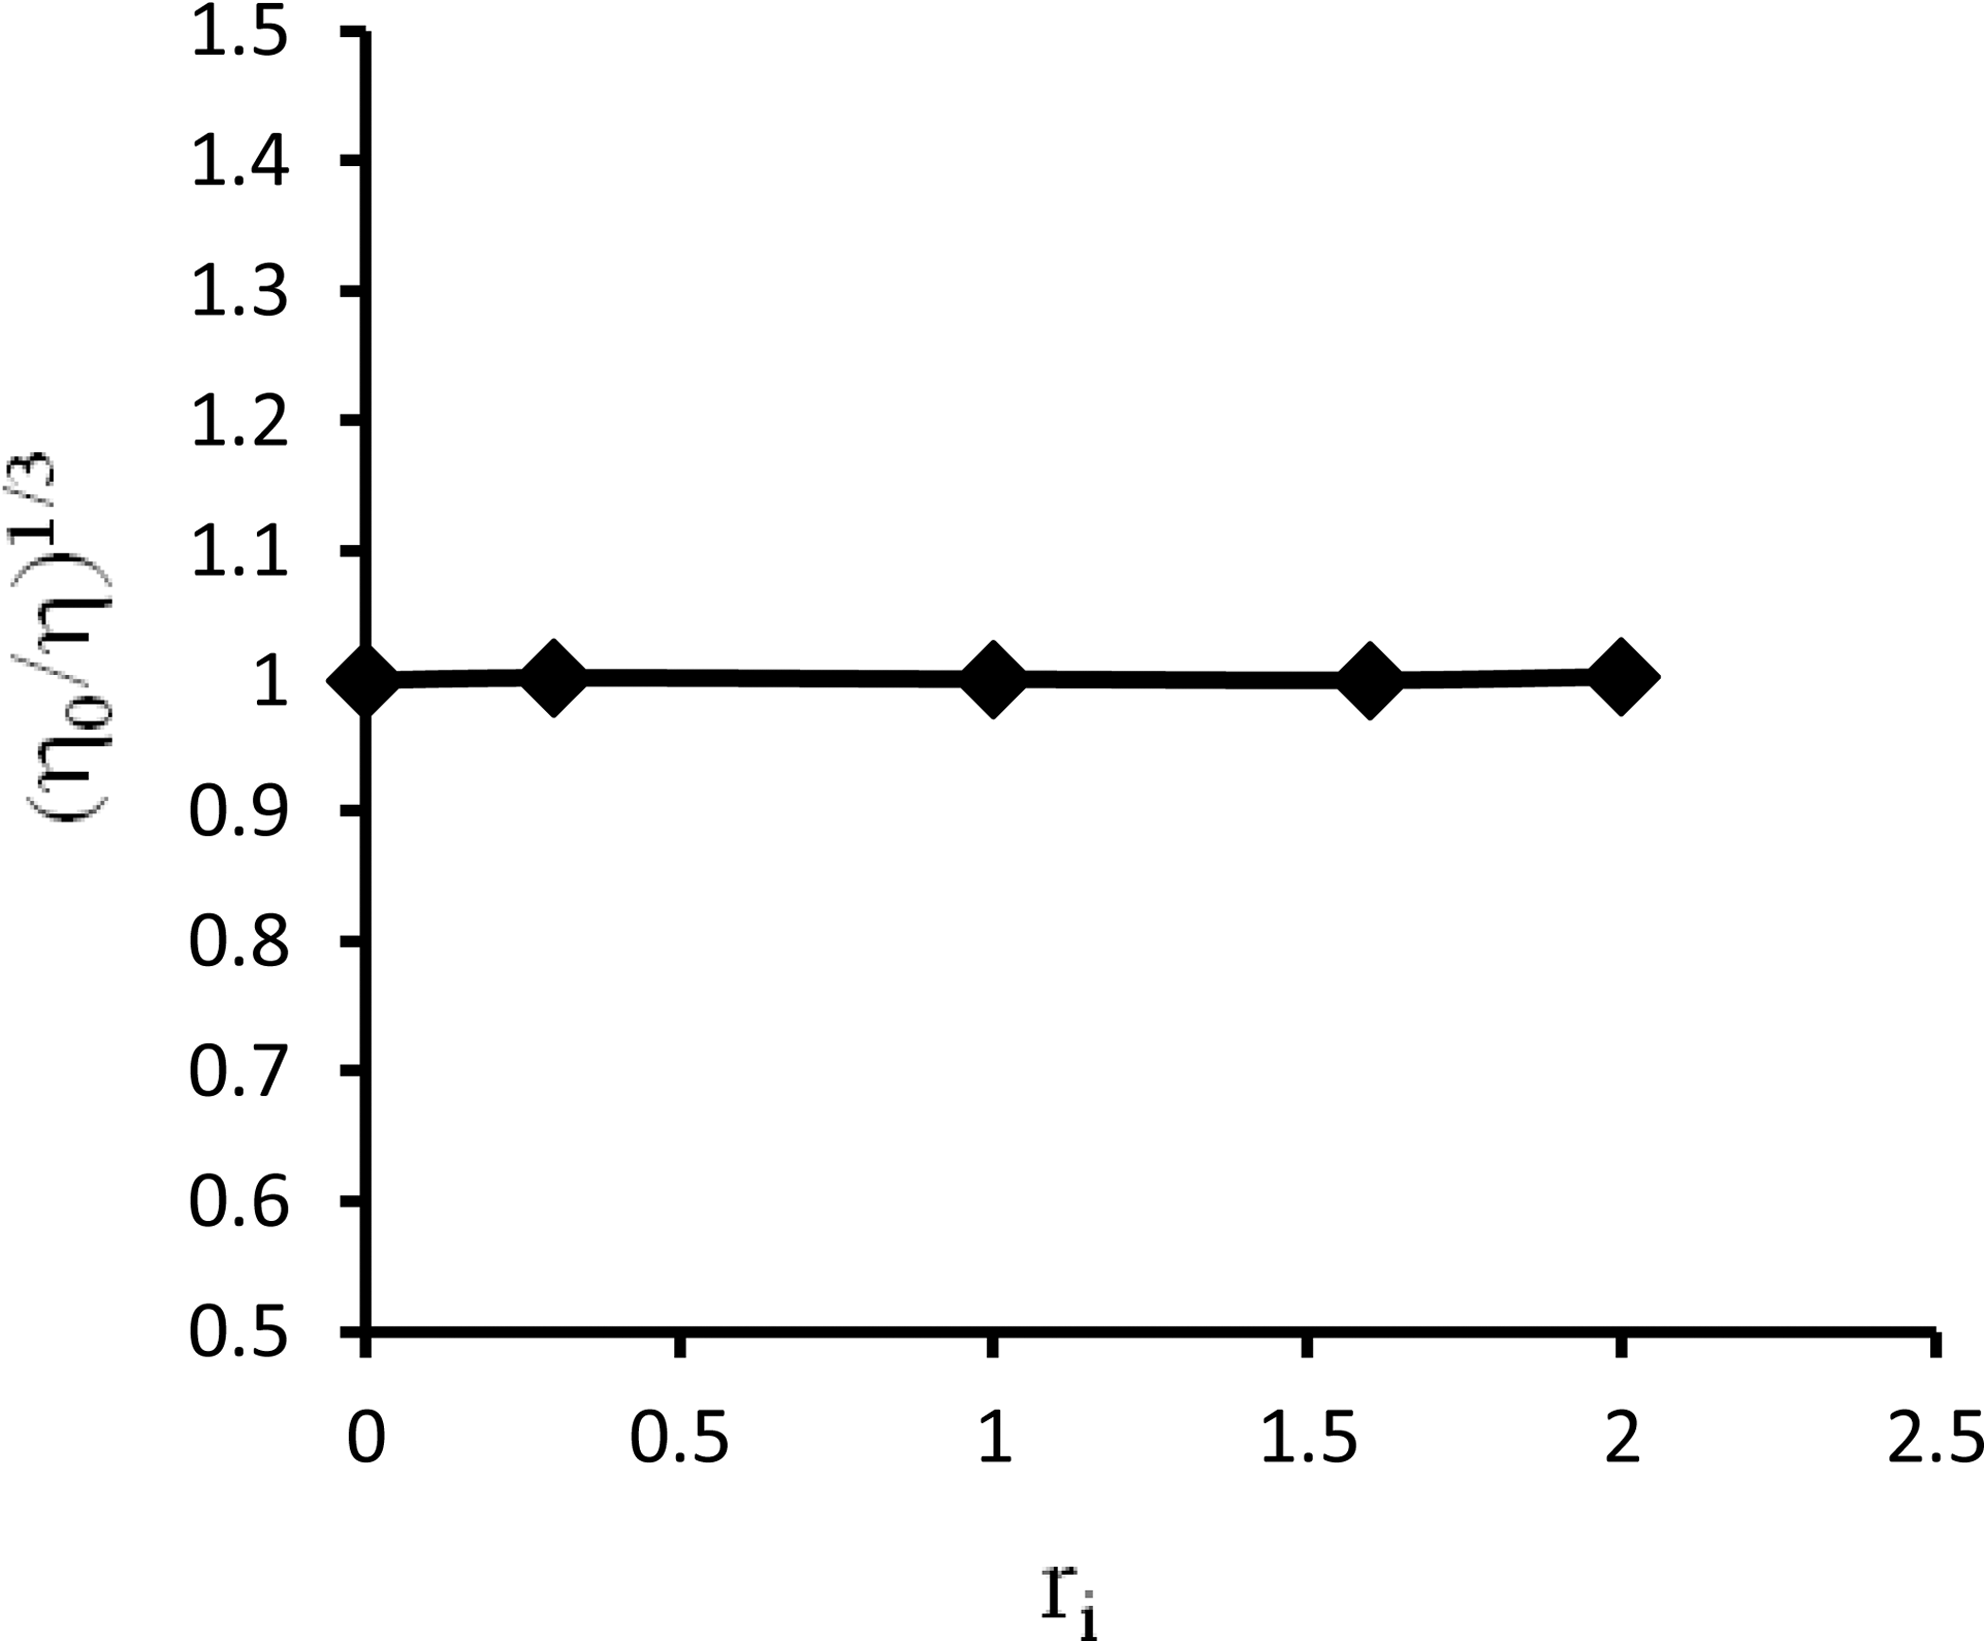
Effect of increasing amounts of fluoxetine on the viscosity of CT-DNA (5×10⁻⁵ M) in 0.01 M Tris-HCl buffer (pH 7.4) (r i=0.0, 0.4, 1.0, 1.6, and 2.0).
CV study
Electrochemical investigation of drug–DNA interactions can provide a useful complement to other methods and provide information about the mechanism of interaction and the conformation of adduct (Ibrahim, 2001). Native DNA is not reducible at the electrodes because the stability of the intact double helix makes the reducible bases inaccessible to the electrode (Zhou et al., 2007).
Recently, the electrochemical techniques were used as a rapid and inexpensive method to study DNA interactions with different compounds. The advantages of this technique are low cost, ease of use, high sensitivity, and a wide dynamic range of operation (Revenga-Parra et al., 2007). The typical cyclic voltammograms of 10−3 M of fluoxetine without and with DNA at Pt electrode in Tris-HCl buffer (0.01 M, pH 7.3) are shown in Figure 6. The cyclic voltammogram of 10−3 M of DNA at Pt electrode in Tris-HCl buffer shows no oxidation peaks because the bases are inside the double helix (Palecek and Fajta, 2001). Curve a shows the cyclic voltammogram of 10−3 M of fluoxetine. Addition of CT-DNA to a solution of fluoxetine results in remarkable decreases in the peak current heights. According to this observation, it seems that the decreases of fluoxetine peak current after addition of DNA are caused by the interaction of fluoxetine with DNA, which results in a decrease in the apparent diffusion coefficient. In other words, in the presence of DNA, the equilibrium concentration of free fluoxetine in solution decreased, which resulted in the decrease of the peak current (Kashanian et al., 2008b; Gholivand et al., 2012).
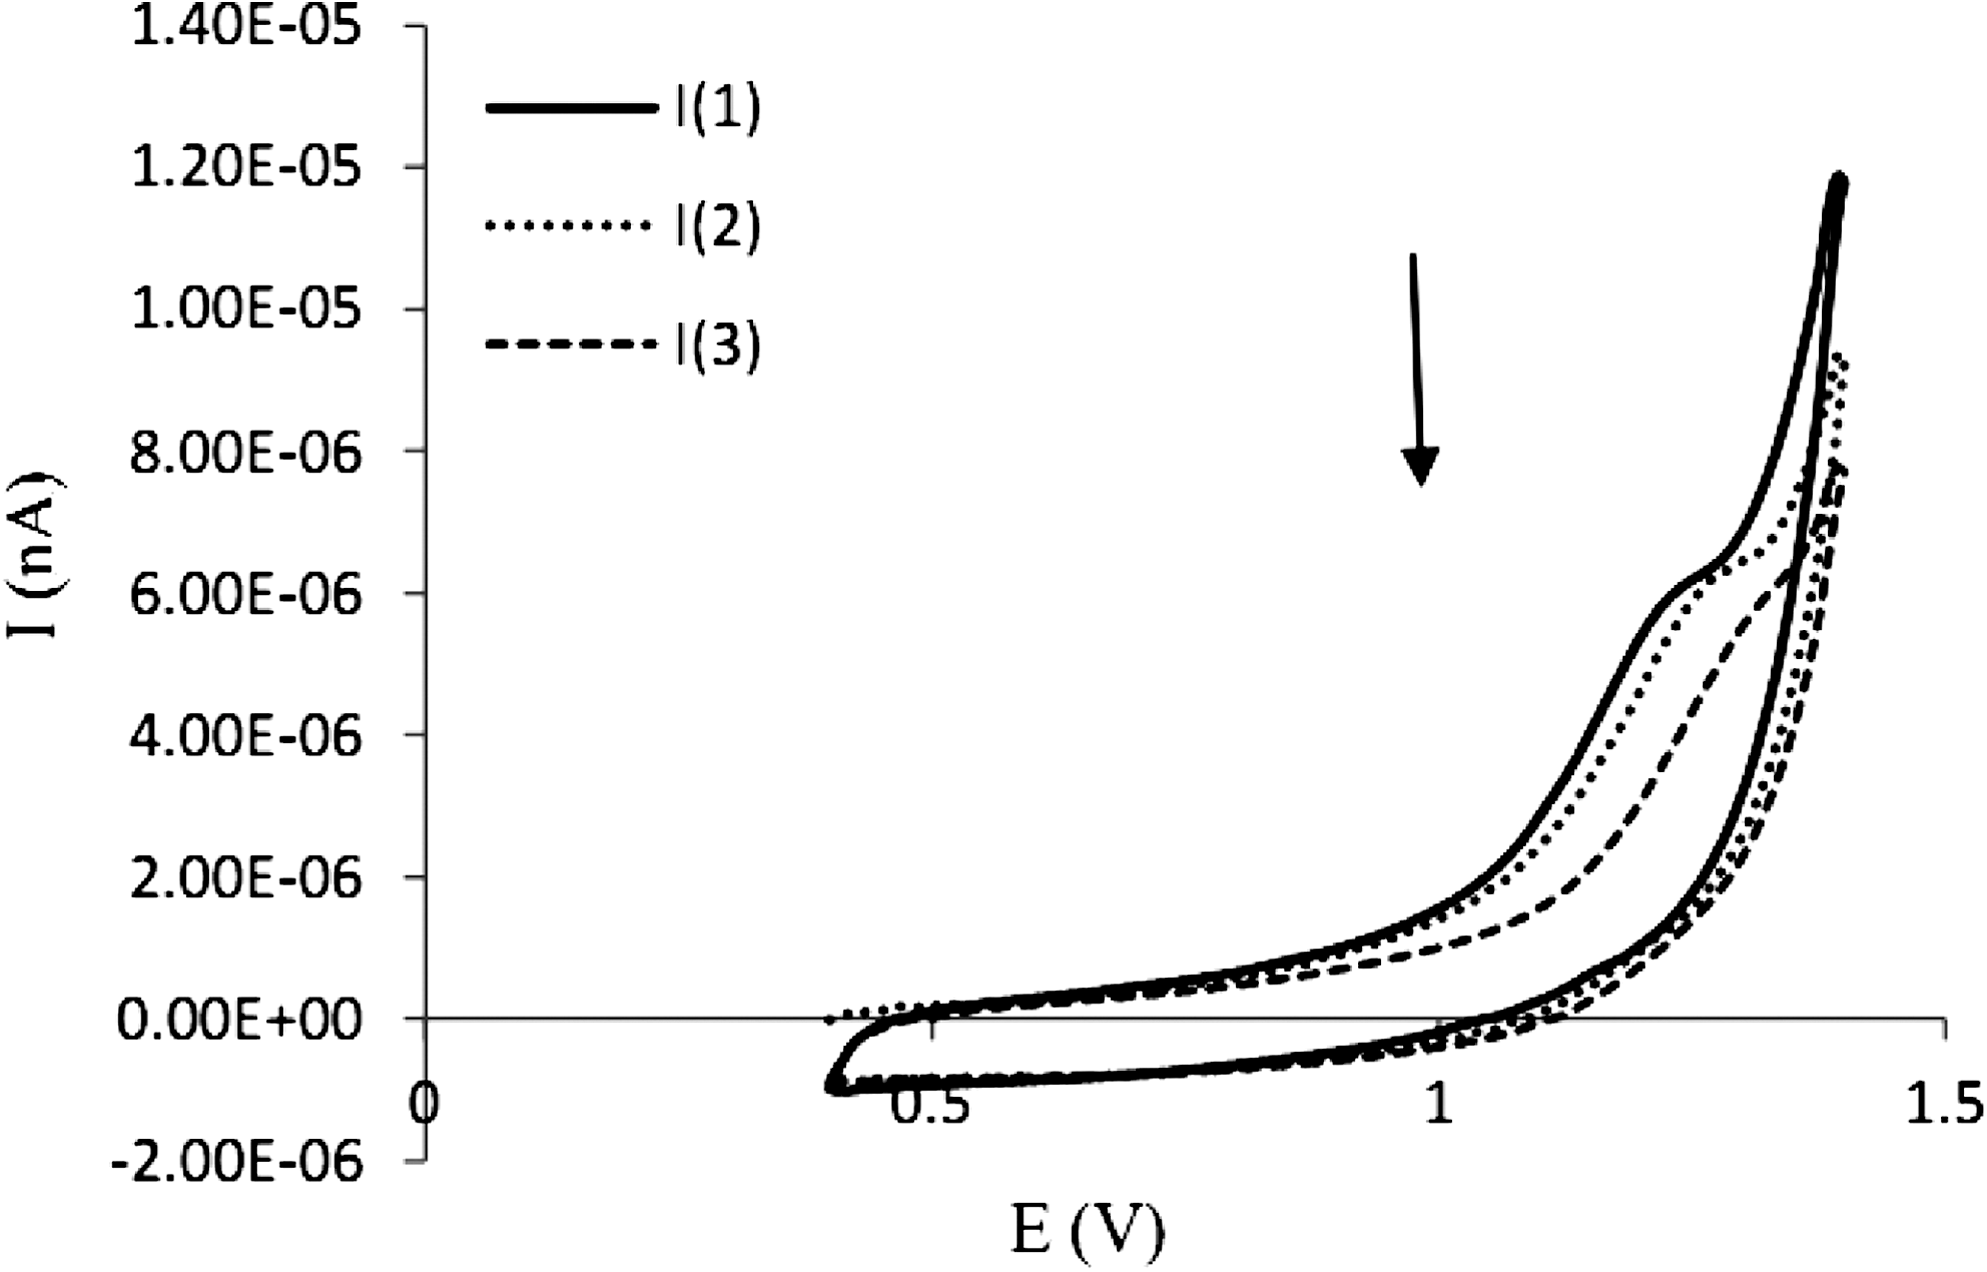
Cyclic voltammetry of fluoxetine in the absence
DNA cleavage studies
Since fluoxetine molecules showed binding propensity with CT-DNA, the DNA cleavage abilities of this drug were studied by agarose gel electrophoresis using supercoiled PUC18 plasmid DNA as a substrate. Change in electrophoretic mobility of plasmid DNA on agarose gel is commonly taken as evidence for direct DNA–molecule interactions. The DNA cleavage ability of fluoxetine was assessed by the conversion of DNA from Form I (supercoiled form) to Form II (nicked circular form) or Form III (linear form). A concentration-dependent DNA cleavage by fluoxetine was performed in which PUC18 DNA (0.02 M) was incubated at 310 K for 2 h. During electrophoresis, while scission occurs on one strand (nicking), the supercoiled form relaxes to generate nicked form (Form II). When cleavage occurs on both the strands, a linear form (Form III) is generated that migrates between Forms I and II (Parveen and Arjmand, 2012). With the increase in concentration of fluoxetine, DNA cleavage was not observed as it is shown in Figure 7.
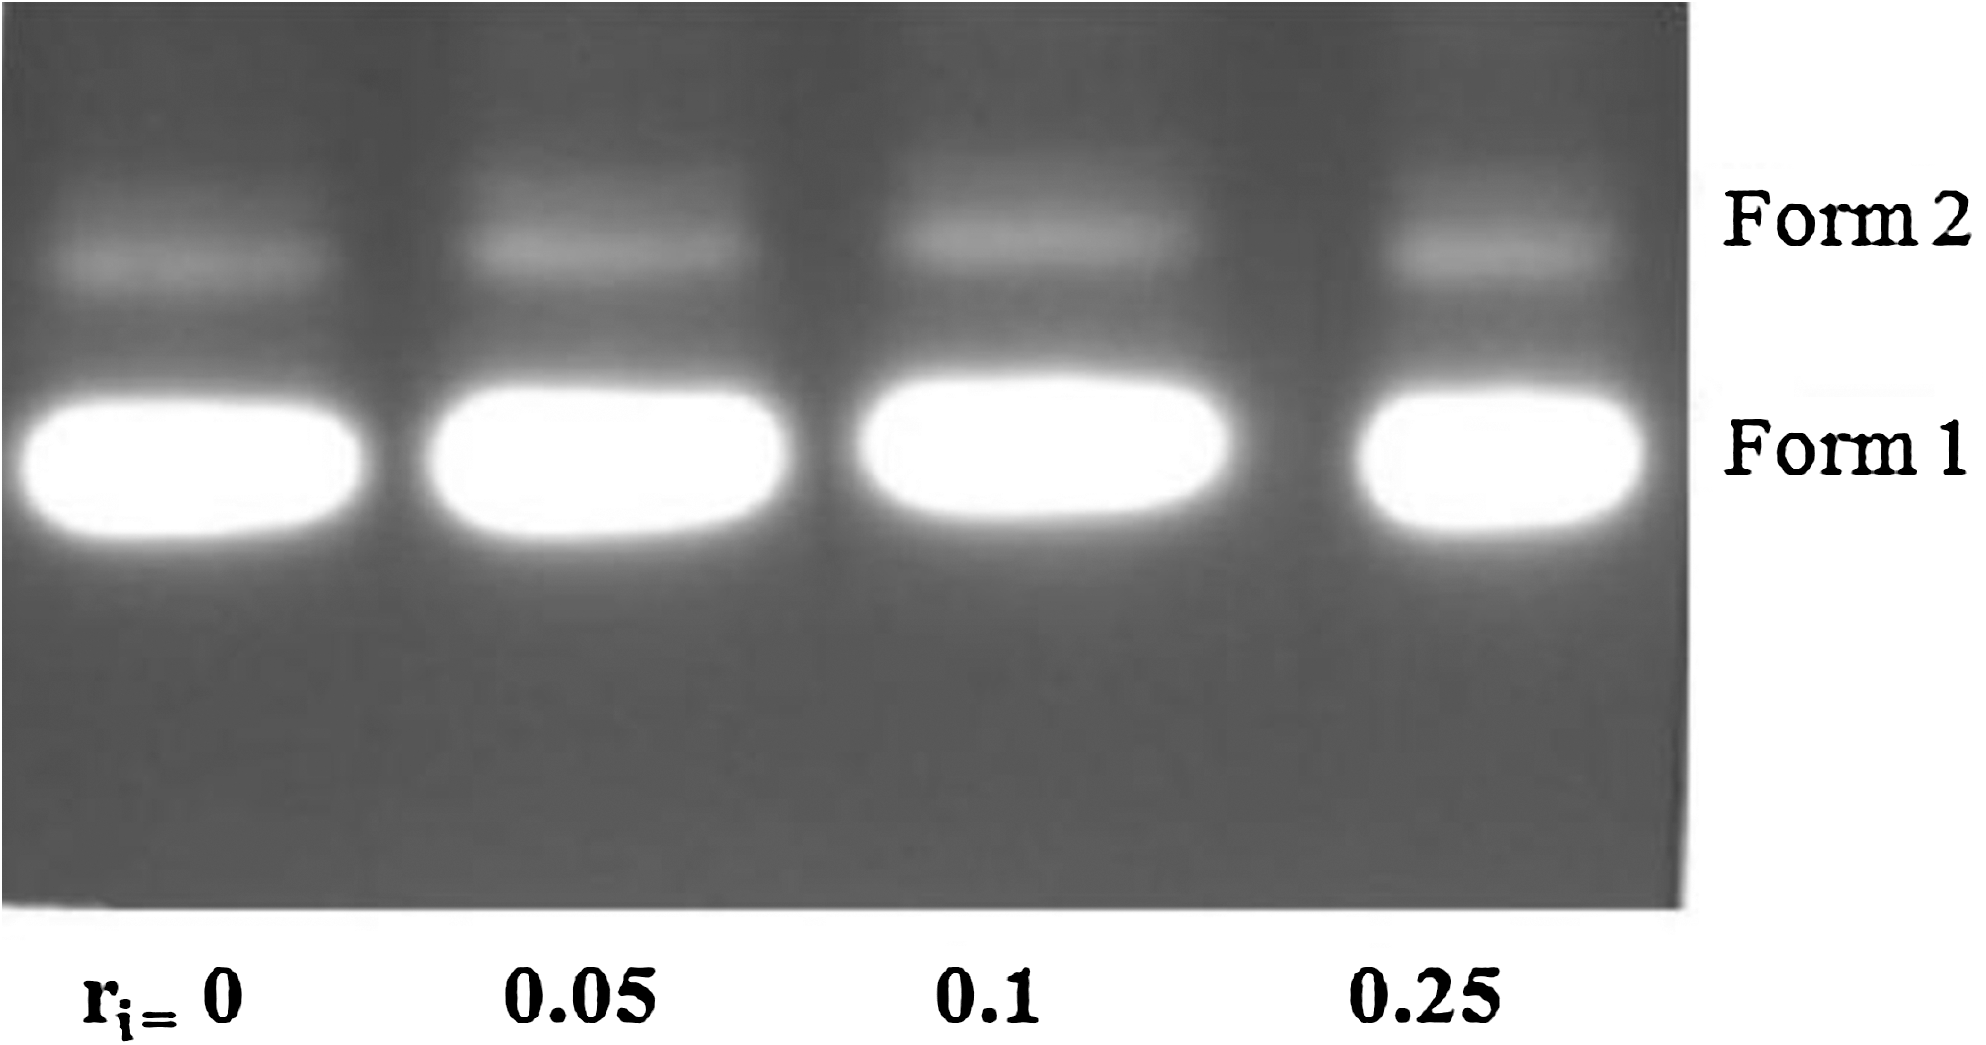
Gel electrophoresis of DNA in the presence of increasing amounts of fluoxetine (r i=fluoxetine/[DNA]=0.00, 0.05, 0.10, and 0.25).
Discussion
Fluoxetine belongs to the group of SSRIs and is the most frequently used drug today for the treatment of episodic depression (Pavelka, 2010). According to the results from UV and fluorescence spectroscopy, viscosity, cyclic voltammetric, and CD spectral studies, fluoxetine binds to CT-DNA with high affinity through a groove-binding mode, which could cause conformational changes in the DNA double helix. Addition of increasing amounts of CT-DNA to a fluoxetine solution results in the obvious hypochromism tendency of the absorption bands. Fluoxetine interaction may occur via a surface-binding mode. Amino and hydroxyl groups could form hydrogen bonds with the DNA base pairs, contributing to the interaction of the molecules with DNA (Kumar and Arunachalam, 2006; Arjmand et al., 2008; Kumar et al., 2009). The competitive binding experiment with Hoechst 33258 indicated that fluoxetine could interact as a groove binder as demonstrated by the decrease in Hoechst–DNA solution fluorescence band, indicating that fluoxetine has the ability to interact with DNA in the minor groove. Although Hoechst interacts with DNA with a high affinity (Strekowski and Wilson, 2007) it can be replaced by fluoxetine. Moreover, the Kb value obtained was lower than that of classical intercalators, whose binding constants are on the order of 106–107 (Xu et al., 2008; Arjmand and Sayeed, 2010). Comparing the intrinsic binding constant (Kb ) of fluoxetine with those of known DNA groove binders (Zhang et al., 2001; Wang et al., 2004; Sharma et al., 2005; Shahabadi et al., 2010b), we can deduce that this molecule binds to CT-DNA via the groove-binding mode.
Optical photophysical probes provide necessary, but not sufficient, support for a binding model. Measurements of DNA viscosity provide a critical test of binding in solution. Intercalating agents are expected to elongate the double helix to accommodate the ligands in between the base pairs, leading to an increase in the viscosity of DNA. In contrast, molecules that bind exclusively in the DNA grooves by partial and/or nonclassical intercalation, under the same conditions, typically cause less-pronounced or no change in the DNA solution viscosity (Xi et al., 2009). The relative viscosity of DNA in the presence of varying amounts of fluoxetine indicates that it can bind to DNA via groove- and/or surface-binding mode (Jiang, 2004; Sasmal et al., 2008; Kashanian et al., 2010).
CD results showed conformational changes in the CT-DNA double helix. The interaction of fluoxetine with DNA induces some changes in the CD spectra of the B-DNA. Classical intercalation reactions tend to reduce the helical intensity while increasing the base-stacking interactions, which leads to transition from a more B-like to a more A-like structure within the DNA molecule (Kashanian et al., 2010). The intensity of negative band has a little change upon increasing amounts of fluoxetine, indicating no significant drug effects on DNA helicity. Although decrement in positive DNA band is obvious, which indicates decrease in base pair stacking, however, perturbations on the base-stacking and helicity bands are not as pronounced as being indicative of a transition in DNA conformation, for example, from B-DNA to A, C, Z, or other forms of DNA. This evidence supports groove-binding nature of the drug (Chen et al., 2009; Shahabadi et al., 2009; Kashanian and Zeidali, 2011). The interaction effectively screens the negative charge on N (7) base sites as well as phosphate oxygen atoms simultaneously, both along the deoxyribophosphate backbone and in the groove of the helix, to promote a transconformational change in the DNA structure. Further transformation of DNA structure proceeds by removal of water from the base sites and the grooves of the helix (Shahabadi et al., 2009). These changes are indicative of a nonintercalative mode of binding of fluoxetine, and provide additional support of groove binding.
Conclusion
Fluoxetine exhibits a high binding affinity for CT-DNA. Different instrumental methods were applied to investigate the interaction mechanism. The following results support that fluoxetine can bind to CT-DNA via groove binding. 1. The maximum absorption wavelength of fluoxetine decreased in the presence of different concentrations of DNA; the observed spectral behavior clearly rules out intercalative binding mode of the molecule to DNA. The intrinsic binding constant observed (Kb
=6.7×10⁴ M−1) was comparable to other groove binders. 2. The competitive binding experiment with Hoechst 33258 indicated that fluoxetine could interact as a groove binder as demonstrated by the decrease in Hoechst–DNA solution fluorescence band, indicating that fluoxetine is able to interact with DNA in the minor groove. Although Hoechst interacts with DNA with a high affinity (Strekowski and Wilson, 2007), it can be replaced by fluoxetine. 3. Less perturbations on the base-stacking and helicity bands of CD spectra indicate that fluoxetine induces some conformational changes, within the DNA molecule similarly to other groove binders. 4. The viscosity of DNA is not affected by the fluoxetine addition, which is supporting fluoxetine as a groove binder. 5. Addition of CT-DNA to the fluoxetine solution resulted in a decrease in the cathodic currents because of the slower mass transfer of complexes bound to DNA fragments, which supports the DNA interaction with fluoxetine (Maruyama et al., 2001; Saquib et al., 2010, Gholivand et al., 2012). 6. Gel electrophoresis of PUC18 DNA treated with fluoxetine does not show any evidence of DNA cleavage.
These changes are indicative of nonintercalative binding mode of fluoxetine and provide additional support for its groove-binding nature.
At the end it should be noted that the concentration of fluoxetine that was used in this study is much less than that of currently being used as an antidepressant drug.
Footnotes
Acknowledgment
The financial support from Razi University Research Center is gratefully acknowledged.
Disclosure Statement
No competing financial interests exist.