
Abstract
Myelodysplastic syndrome (MDS) is a heterogeneous group of clonal hematopoietic stem cell diseases. Approximately 30% of patients with MDS will develop acute myeloid leukemia (AML). Immune dysregulation may contribute to MDS initiation and progression. The altered expression and clonal expansion of the Vβ repertoire were observed in patients with MDS. To further examine the characteristic features of γδ+T cells in MDS, we investigated the distribution pattern and clonal expansion capacity of the T-cell receptor (TCR) Vγ and Vδ repertoire in patients with refractory anemia with excess of blasts (RAEB) and compared the difference between groups of patients with RAEB and RAEB-AML. Thirty-one patients with newly diagnosed MDS-RAEB were enrolled, and 9 of the 31 patients with RAEB developed AML (RAEB-AML). The TCR Vγ subfamily expression frequencies were similar in the RAEB and RAEB-AML patient groups. The number of the TCR Vδ subfamilies expressed in the RAEB group was higher than that in the RAEB-AML group. In most cases, a significantly higher Vδ4 subfamily expression frequency (63.64%, 14/22) could be detected in the RAEB group, whereas only 11.11% (1/9) was found in the RAEB-AML group (p=0.0079). At least one clonally expanded TCR Vδ subfamily member was detected in all cases in both groups. Vδ3 was the most frequent clonally expanded T cell subfamily member found in the RAEB and RAEB-AML group, while the most frequent clonally expanded T cell subfamily member in the RAEB-AML group was Vδ8 (87.5%, 7/8), which was significantly higher than that in the RAEB group (42.86%, 9/21; p=0.0307). In conclusion, the TCR Vδ subfamily expression pattern exhibited a marked restriction in patients with RAEB-AML. The lower Vδ4 frequency and higher clonally expanded Vδ8 T cell alterations were the characteristic features found in RAEB-AML. These results provide new data regarding the immunodeficiency and immune reactive characteristics of patients with RAEB and RAEB-AML.
Introduction
The T-cell receptor (TCR) is a glycoprotein heterodimer that is linked by disulfide bonds. Four TCR chains have been identified: α, β, γ, and δ (Griesser, 1995). T cells possessing a γδ TCR are an important subset of cytotoxic nonconventional effectors that take part in immune reactions against mycobacteria and tumors. Although T cells bearing γδ+T cell receptors constitute a minor subset of human peripheral T cells (1–10%) with αβ+T cells, making up the remaining population, they can perform specific activities. The biological function of γδ+T cells is unclear. It has been revealed that γδ+T cells can recognize and lyse malignantly transformed cells without tumor-specific antigen recognition, thus playing an important role in antitumor immune defense and surveillance (Girardi et al., 2001; Liu et al., 2008; Beck et al., 2010). In addition, γδ+T cells can interact with myeloid cells and demonstrate a regulatory role in various forms of tolerance (Kapp et al., 2004; Born et al., 2007). Recently, it has been reported that γδ+T cells play a critical role in processes such as the regulation of graft versus host disease and autoimmune disease mediation (Robak et al., 2001; Fujishima et al., 2007). However, little is known about the alternative functions of γδ T cells in MDS. Kiladjian et al. (2008) have reported that Vδ2 T cells, the major circulating γδ T cell subset, had limited proliferative capacity and reduced in patients with MDS.
Rearrangement of the individual variable (V), diversity (D), joining (J), and constant (C) regions leads to the creation of the hypervariable complementarity determining region 3 (CDR3) of the TCR, which plays a major role in the recognition of antigenic peptides (Li et al., 2005b; Yin et al., 2011). γδ T cells rearrange and express clonally diverse antigen receptors in a manner similar to αβ T lymphocytes; however, the V, D, and J element repertoire in the TCR γ and TCR δ loci is limited in number. The TCR γ gene contains at least 14 functional variable (TCR Vγ) segments belonging to four subgroups (i.e., TCR Vγ I to IV), and the TCR δ gene contains at least eight functional TCR Vδ segments that are subdivided into eight Vδ subfamilies (i.e., Vδ1–Vδ8). Analysis of the TCR CDR3 repertoire may be a powerful tool in the study of immune-mediated hematologic diseases (Plasilova et al., 2003). A skewed expression and clonal expansion of the Vβ repertoire with a frequent expression of polyclonal in the CD4+T cells and oligoclonal in the CD8+T cells was observed in patients with MDS (Fozza et al., 2009). To further examine the γδ T cell characteristics in MDS in this study, we investigated the distribution pattern and clonal expansion capacity of the TCR Vγ and Vδ repertoire in RAEB and compared the difference between the RAEB and RAEB-AML groups.
Methods
Patients
Peripheral blood (PB) samples were obtained from 31 patients with newly diagnosed MDS-RAEB (17 males and 14 females; median age: 54 years, range 15–84 years) before treatment in the Department of Hematology, Guangdong General Hospital. The MDS diagnosis was based on the standard WHO classification and immunophenotypic criteria. Among these cases, 18 were RAEB-I and 13 were RAEB-II. The study was approved by the Ethics Committee of the Guangdong General Hospital. All patients gave informed consent. According to the clinical outcome, we divided the cases into two groups, RAEB (22 cases; numbered C1–C22) and RAEB-AML (nine cases; numbered C-A1 to C-A9), which developed AML (M2, M4 and M5) at different times after diagnosis. All samples were collected between December 2004 and December 2009, and the samples from RAEB-AML group were collected before disease progression to AML. The clinical data are listed in Table 1.
PIN, patient identification number; WBC, white blood cells; HB, hemoglobin B; PLT, platelet; RAEB, refractory anemia with excess of blasts; F, female; M, male; IPSS, International Prognostic Scoring System; NA, not available.
RNA extraction and cDNA synthesis
Peripheral blood mononuclear cells (PBMCs) were isolated by Ficoll-Hypaque gradient centrifugation. RNA was extracted from the PBMCs according to the manufacturer's protocol (Trizol; Invitrogen). The RNA quality was analyzed in a 0.8% agarose gel stained with ethidium bromide. The RNA (1–2 μg) was synthesized into first-strand cDNA with random hexamer primers using the Superscript III First-Strand Synthesis kit (Invitrogen). The cDNA quality was confirmed by RT-PCR for β2 microglobulin gene amplification.(Lai et al., 2011).
RT-PCR for the TCR Vγ and TCR Vδ subfamily
Three sense TCR Vγ primers and a single TCR Cγ reverse primer or eight TCR Vδ sense primers and a single TCR Cδ primer were used in an unlabeled PCR for amplification of the TCR Vγ and Vδ subfamilies, respectively. Subsequently, a runoff PCR was performed with fluorescent primers labeled at 5′ end with a FAM fluorophore (i.e., Cγ-FAM or Cδ-FAM), which was purchased from TIB MOLBIOL GmbH. The primers are listed in Table 2. The PCR was performed as previously described (Li et al., 2007, 2009). cDNA aliquots (1 μL) were amplified in 20 μL reactions using one of the three Vγ primers and a Cγ primer or one of the eight Vδ primers and a Cδ primer. The final reaction mixture contained 0.5 μM of the sense and antisense primers, 0.1 mM dNTPs, 1.5 mM MgCl2, 1× PCR buffer, and 1.25 U Taq polymerase. The amplification was performed in a 2720 Thermal cycler (ABI). After a 3-min denaturation at 94°C, 40 cycles of 94°C for 1 min, 60°C for 1 min, and 72°C for 1 min were performed followed by a final 6 min elongation at 72°C. The products were then stored at 4°C.
GeneScan analysis of the TCR Vγ and TCR Vδ subfamily clonality
Unlabeled PCR product aliquots (2 μL) were subjected to a runoff reaction cycle using fluorophore-labeled Cγ-FAM or Cδ-FAM primers. The labeled runoff PCR products (2 μL) were heat denatured at 94°C for 4 min with 9.5 μL formamide (Hi-Di Formamide; ABI) and 0.5 μL size standards (GeneScan (TM)-500-LIZ(TM); Perkin Elmer, ABI). The samples were then loaded into a 3100 POP-4 (TM) gel (Performance Optimized Polymer-4; ABI) and resolved by electrophoresis in a 3100 DNA sequencer (ABI, Perkin Elmer) for size and fluorescence intensity determination using GeneScan software (Li et al., 2009). Since the positions of the Vγ/Vδ and Cγ/Cδ primers are fixed, the length distribution observed in the PCR Vγ-Cγ/Vδ-Cδ products depends only on the size of the rearrangement of V-J (in TCRγ) or V-D, D-J (in TCRδ) gene segment and the randomly inserted nucleotides (VN(DN)J). After eletrophoresis on an automated sequencer and subsequent computer analysis, the products of different size could be separated and expressed as different peaks (Li et al., 2005a).
Statistical analysis
The Mann–Whitney U test was used to compare the mean of expression and clonally expanded TCR Vγ and Vδ subfamily numbers between the two groups. Differences in the TCR Vγ and Vδ subfamily frequencies between two groups were compared using the chi-squared or Fisher's exact tests. The relationship between the number of expressed and skewed TCR Vγ or Vδ subfamilies and clinical characteristics (i.e., age, sex, white blood cells [WBC] count, hemoglobin level, platelet [PLT] count, and serum ferritin [SF] levels) were analyzed using Pearson's or Spearman's correlation. A p-value<0.05 was considered statistically significant. The statistical analysis was performed using the SPSS software (version 11.5).
Results
TCR Vγ and Vδ subfamilies expression
In this study, a total of 31 patients with MDS-RAEB-I or MDS-RAEB-II were selected to analyze their distribution and clonal expansion history. We divided the cases into two groups according to their clinical features, RAEB and RAEB-AML, and the latter included nine patients who developed AML at different times after diagnosis. We then analyzed the TCR Vγ and Vδ repertoire characteristics in the PB from the two MDS groups.
The expression of TCR Vγ and Vδ subfamilies was detected by RT-PCR, no PCR products was scored as negative for the corresponding TCR subfamily by agarose gel electrophoresis. All of the three TCR Vγ subfamilies could be detected in 90.91% (20/22) of the RAEB and 77.78% (7/9) of the RAEB-AML groups, and the remaining two patients with RAEB and the two with RAEB-AML expressed one or two Vγ subfamilies, respectively. The TCR VγI, VγII, and VγIII expression frequencies were 95.45% versus 100%, 90.91% versus 88.89%, and 100% versus 88.89% for the RAEB versus RAEB-AML groups, respectively, and they were not significantly different (i.e., p>0.05) (Figs. 1 and 2).
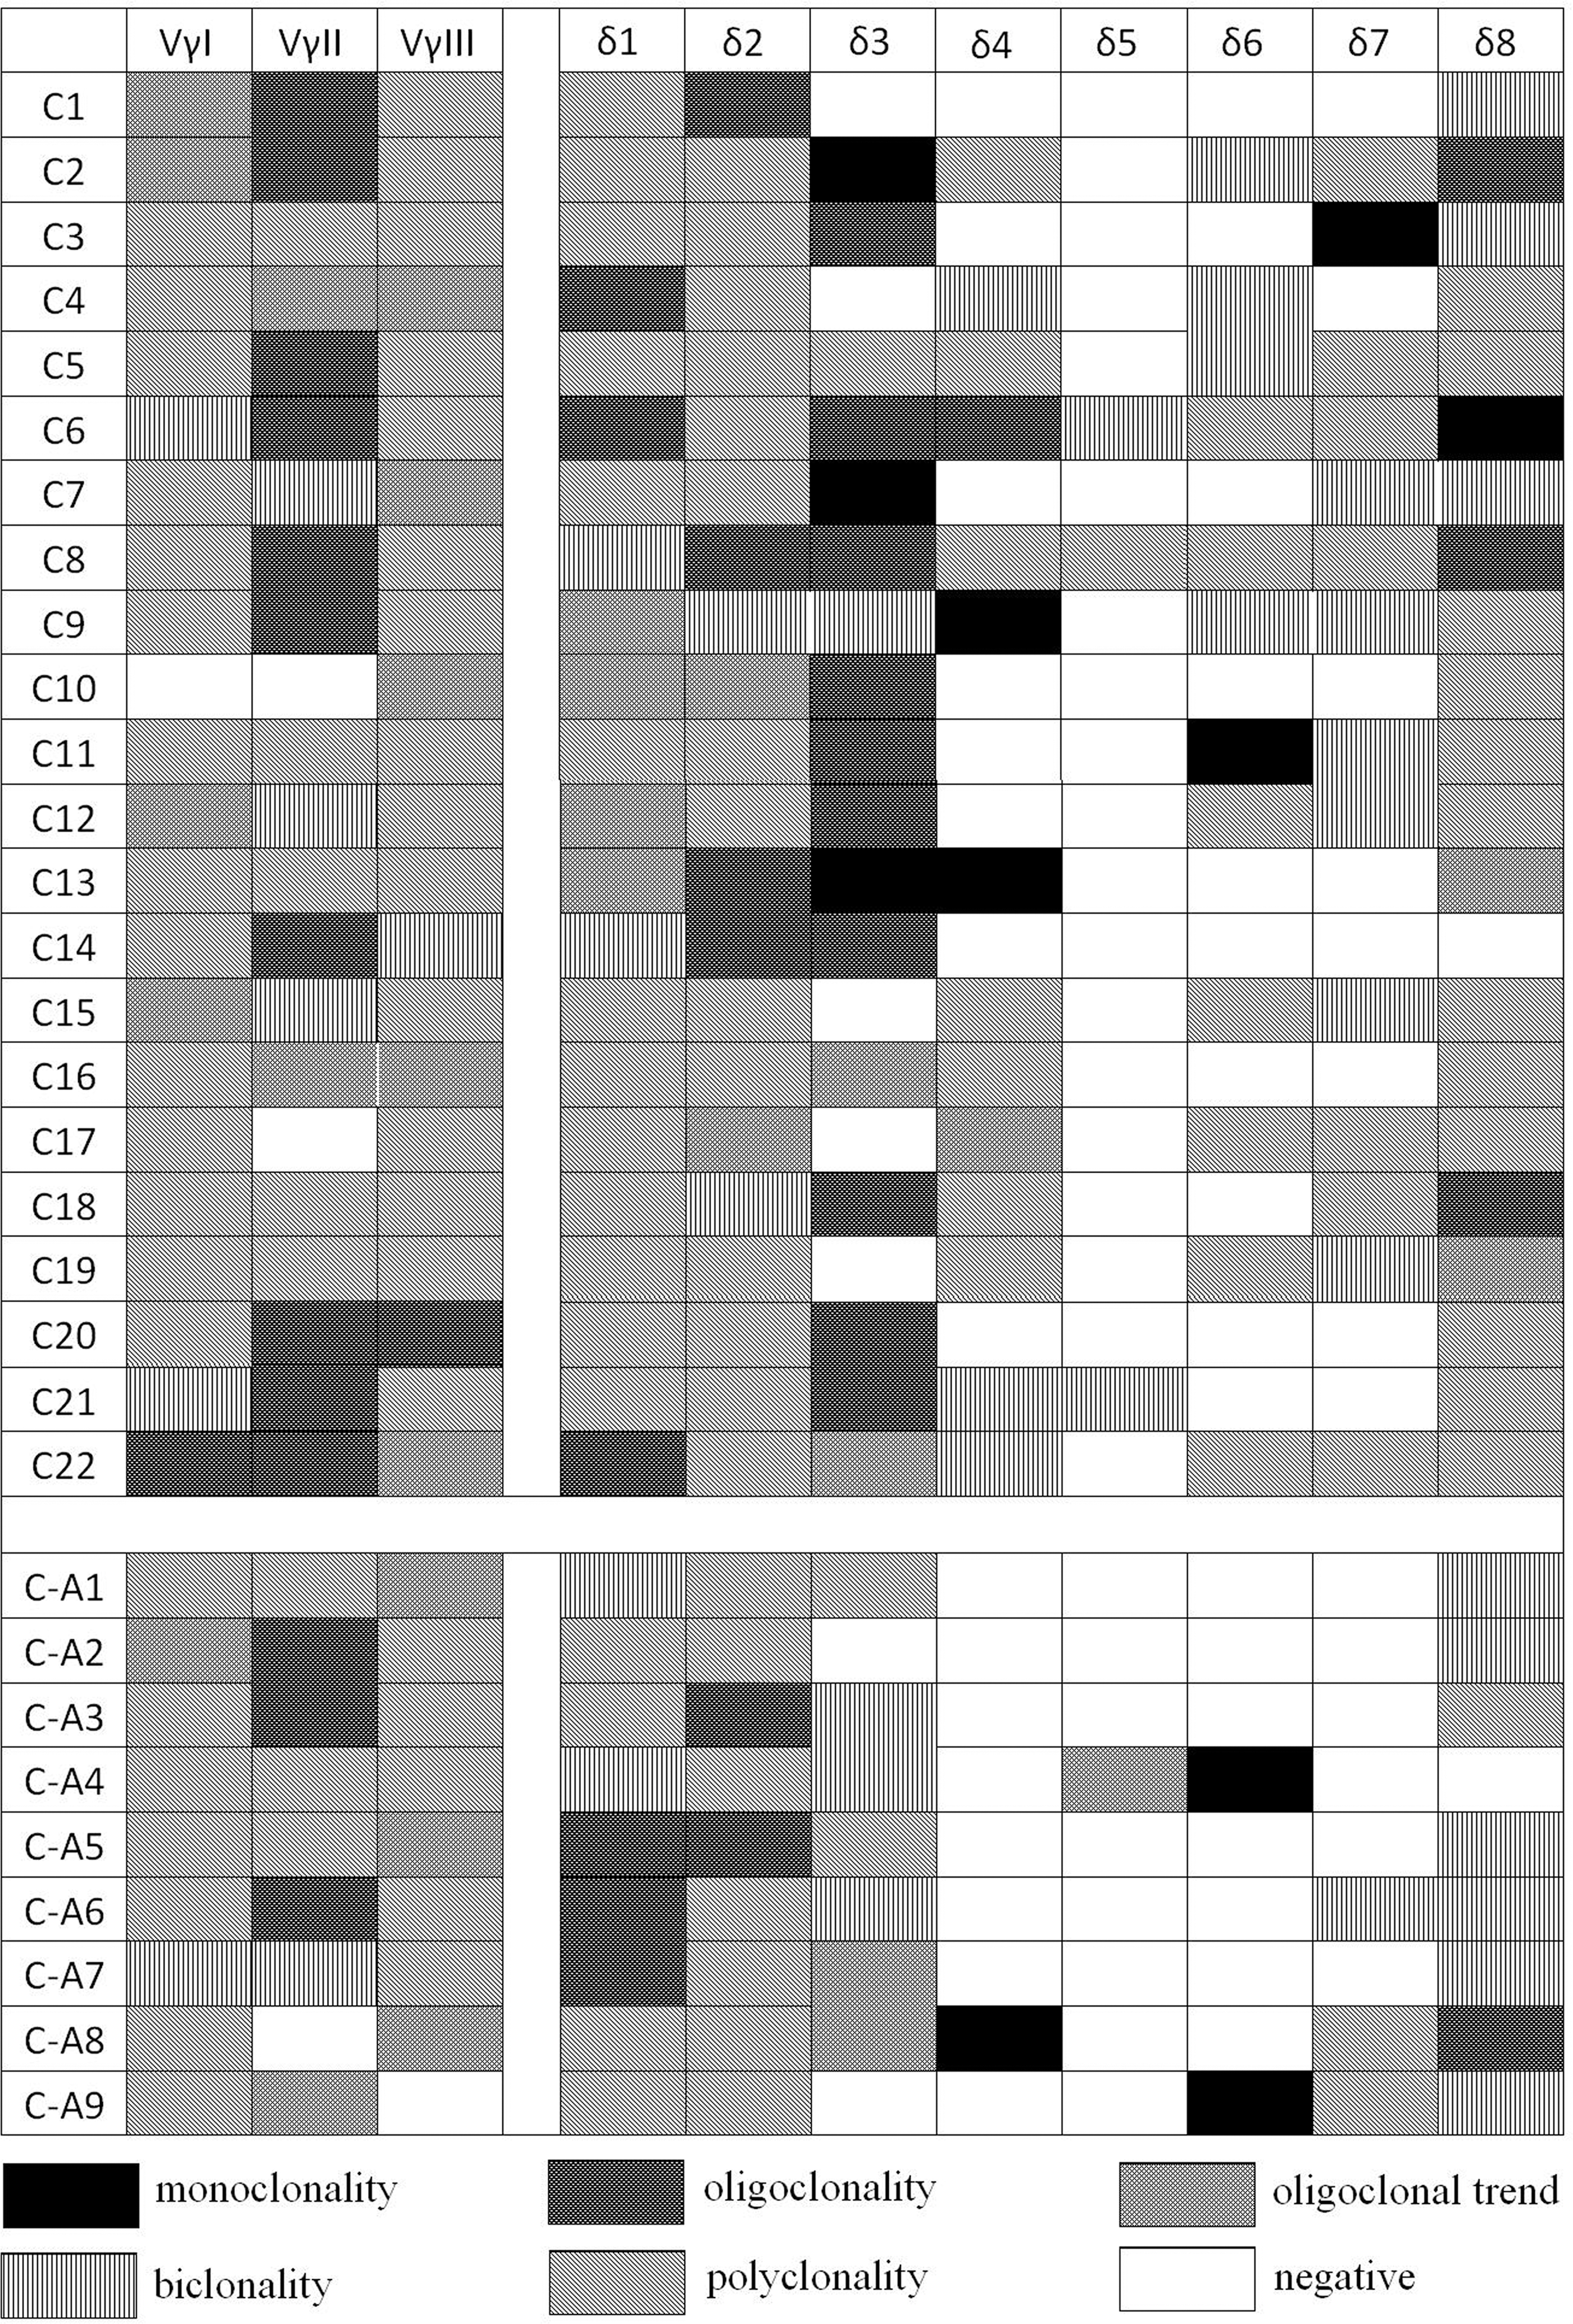
The distribution and clonality features of the TCR Vγ and Vδ subfamilies in 22 patients with RAEB (C1–C22) and nine patients with RAEB-AML (CA1–CA9). TCR, T-cell receptor; RAEB, refractory anemia with excess of blasts; AML, acute myeloid leukemia.
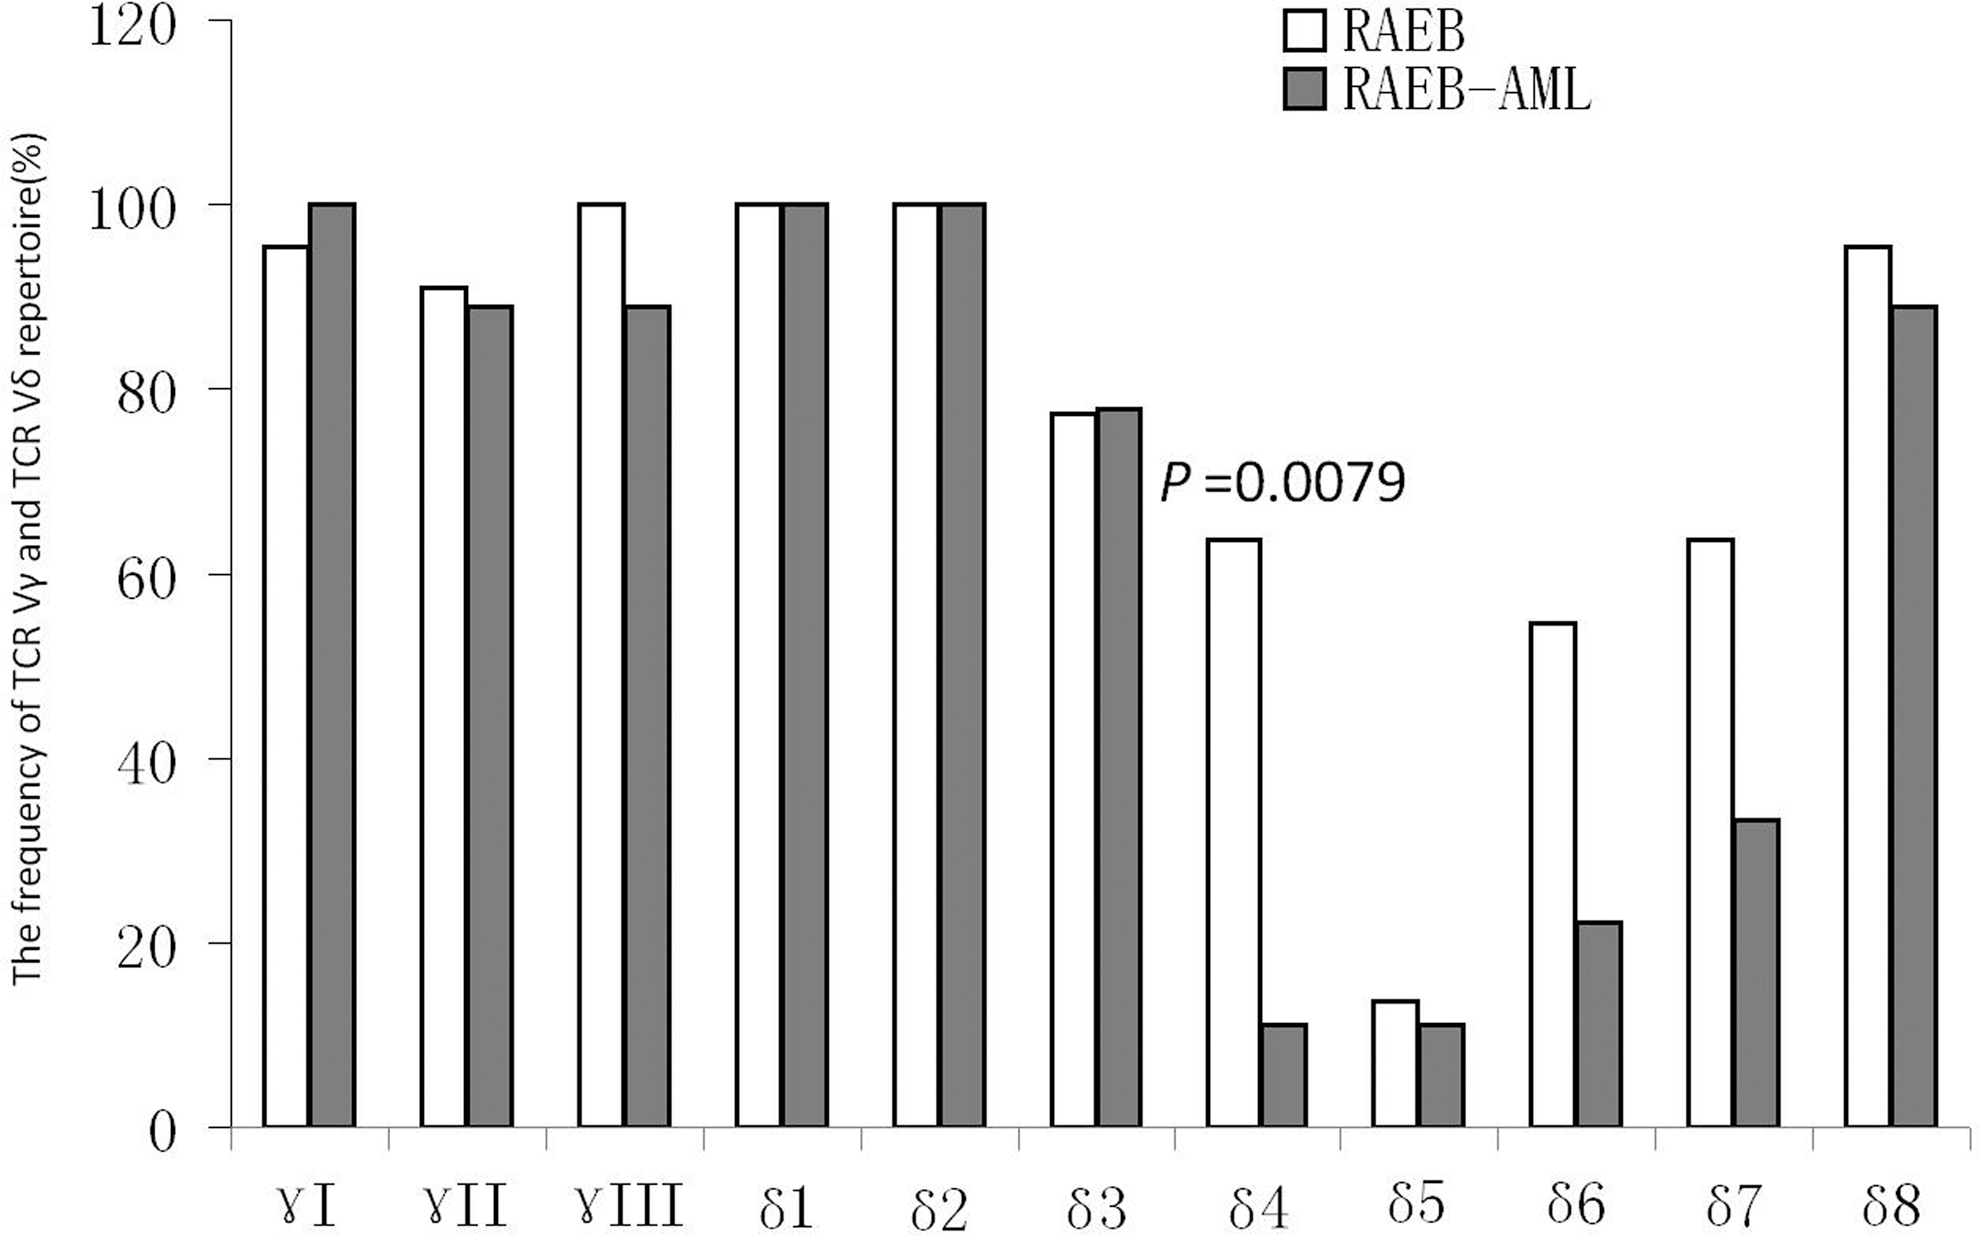
The expression frequencies of the TCR Vγ and TCR Vδ subfamilies in patients with RAEB and RAEB-AML. The TCR Vδ4 frequency in the RAEB group was significantly higher than that in patients with RAEB-AML (p=0.0079).
For the TCR Vδ repertoire analysis, 3–8 (5.68±1.39) of the Vδ subfamilies could be identified in the RAEB group, and 3–6 (4.44±0.88) of the Vδ subfamilies were found in the RAEB-AML group, and the mean value of the number of expressed subfamilies in the RAEB group was higher than that in the RAEB-AML group (p=0.0197). Similar expression frequencies were found for most of the Vδ subfamilies, including Vδ1, Vδ2, Vδ3, Vδ5, and Vδ8, and Vδ5 expression was absent in patients from both groups. In most cases, a significantly higher expression frequency of the Vδ4 subfamily (63.64%, 14/22) could be detected in the RAEB group, and its frequency was only 11.11% (1/9) in the RAEB-AML group (p=0.0079). Although the Vδ6 and Vδ7 expression frequencies seemed high in the RAEB group (54.55% and 63.66%), there was no significant difference compared with the RAEB-AML group (22.22%, p=0.1007 and 33.33%, p=0.1238 for the Vδ6 and Vδ7 comparisons, respectively) (Figs. 1 and 2).
The TCR Vγ and Vδ subfamily clonality
The clonality of Vγ and Vδ subfamily T cells was identified by GeneScan analysis, which was used to identify the CDR3 size and assessing the spectratype pattern visually. Polyclonality of TCR Vγ and Vδ subfamily T cells displays a Gaussian or nearly Gaussian-like distribution consisting of multiple peaks (usually 6–8), any deviation from the Gaussian profile (skewed repertoire) would indicate clonally expanded pattern. Oligoclonal and biclonal shows a skewed spectratype profile with a single dominant peak and double peaks, respectively. Oligoclonal trending is between polyclonal and oligoclonal. The PCR product analysis produces only one peak, which means that CDR3 lengths are identical, named as the monoclonal pattern (Li et al., 2009; Lu et al., 2004).
Clonally expanded Vγ and Vδ subfamilies (i.e., an oligoclonal, oligoclonal trending, biclonal, or monoclonal pattern) could be identified in every subfamily in the different cases (Fig. 3). The distribution of the clonally expanded T cells is shown in Figure 1.
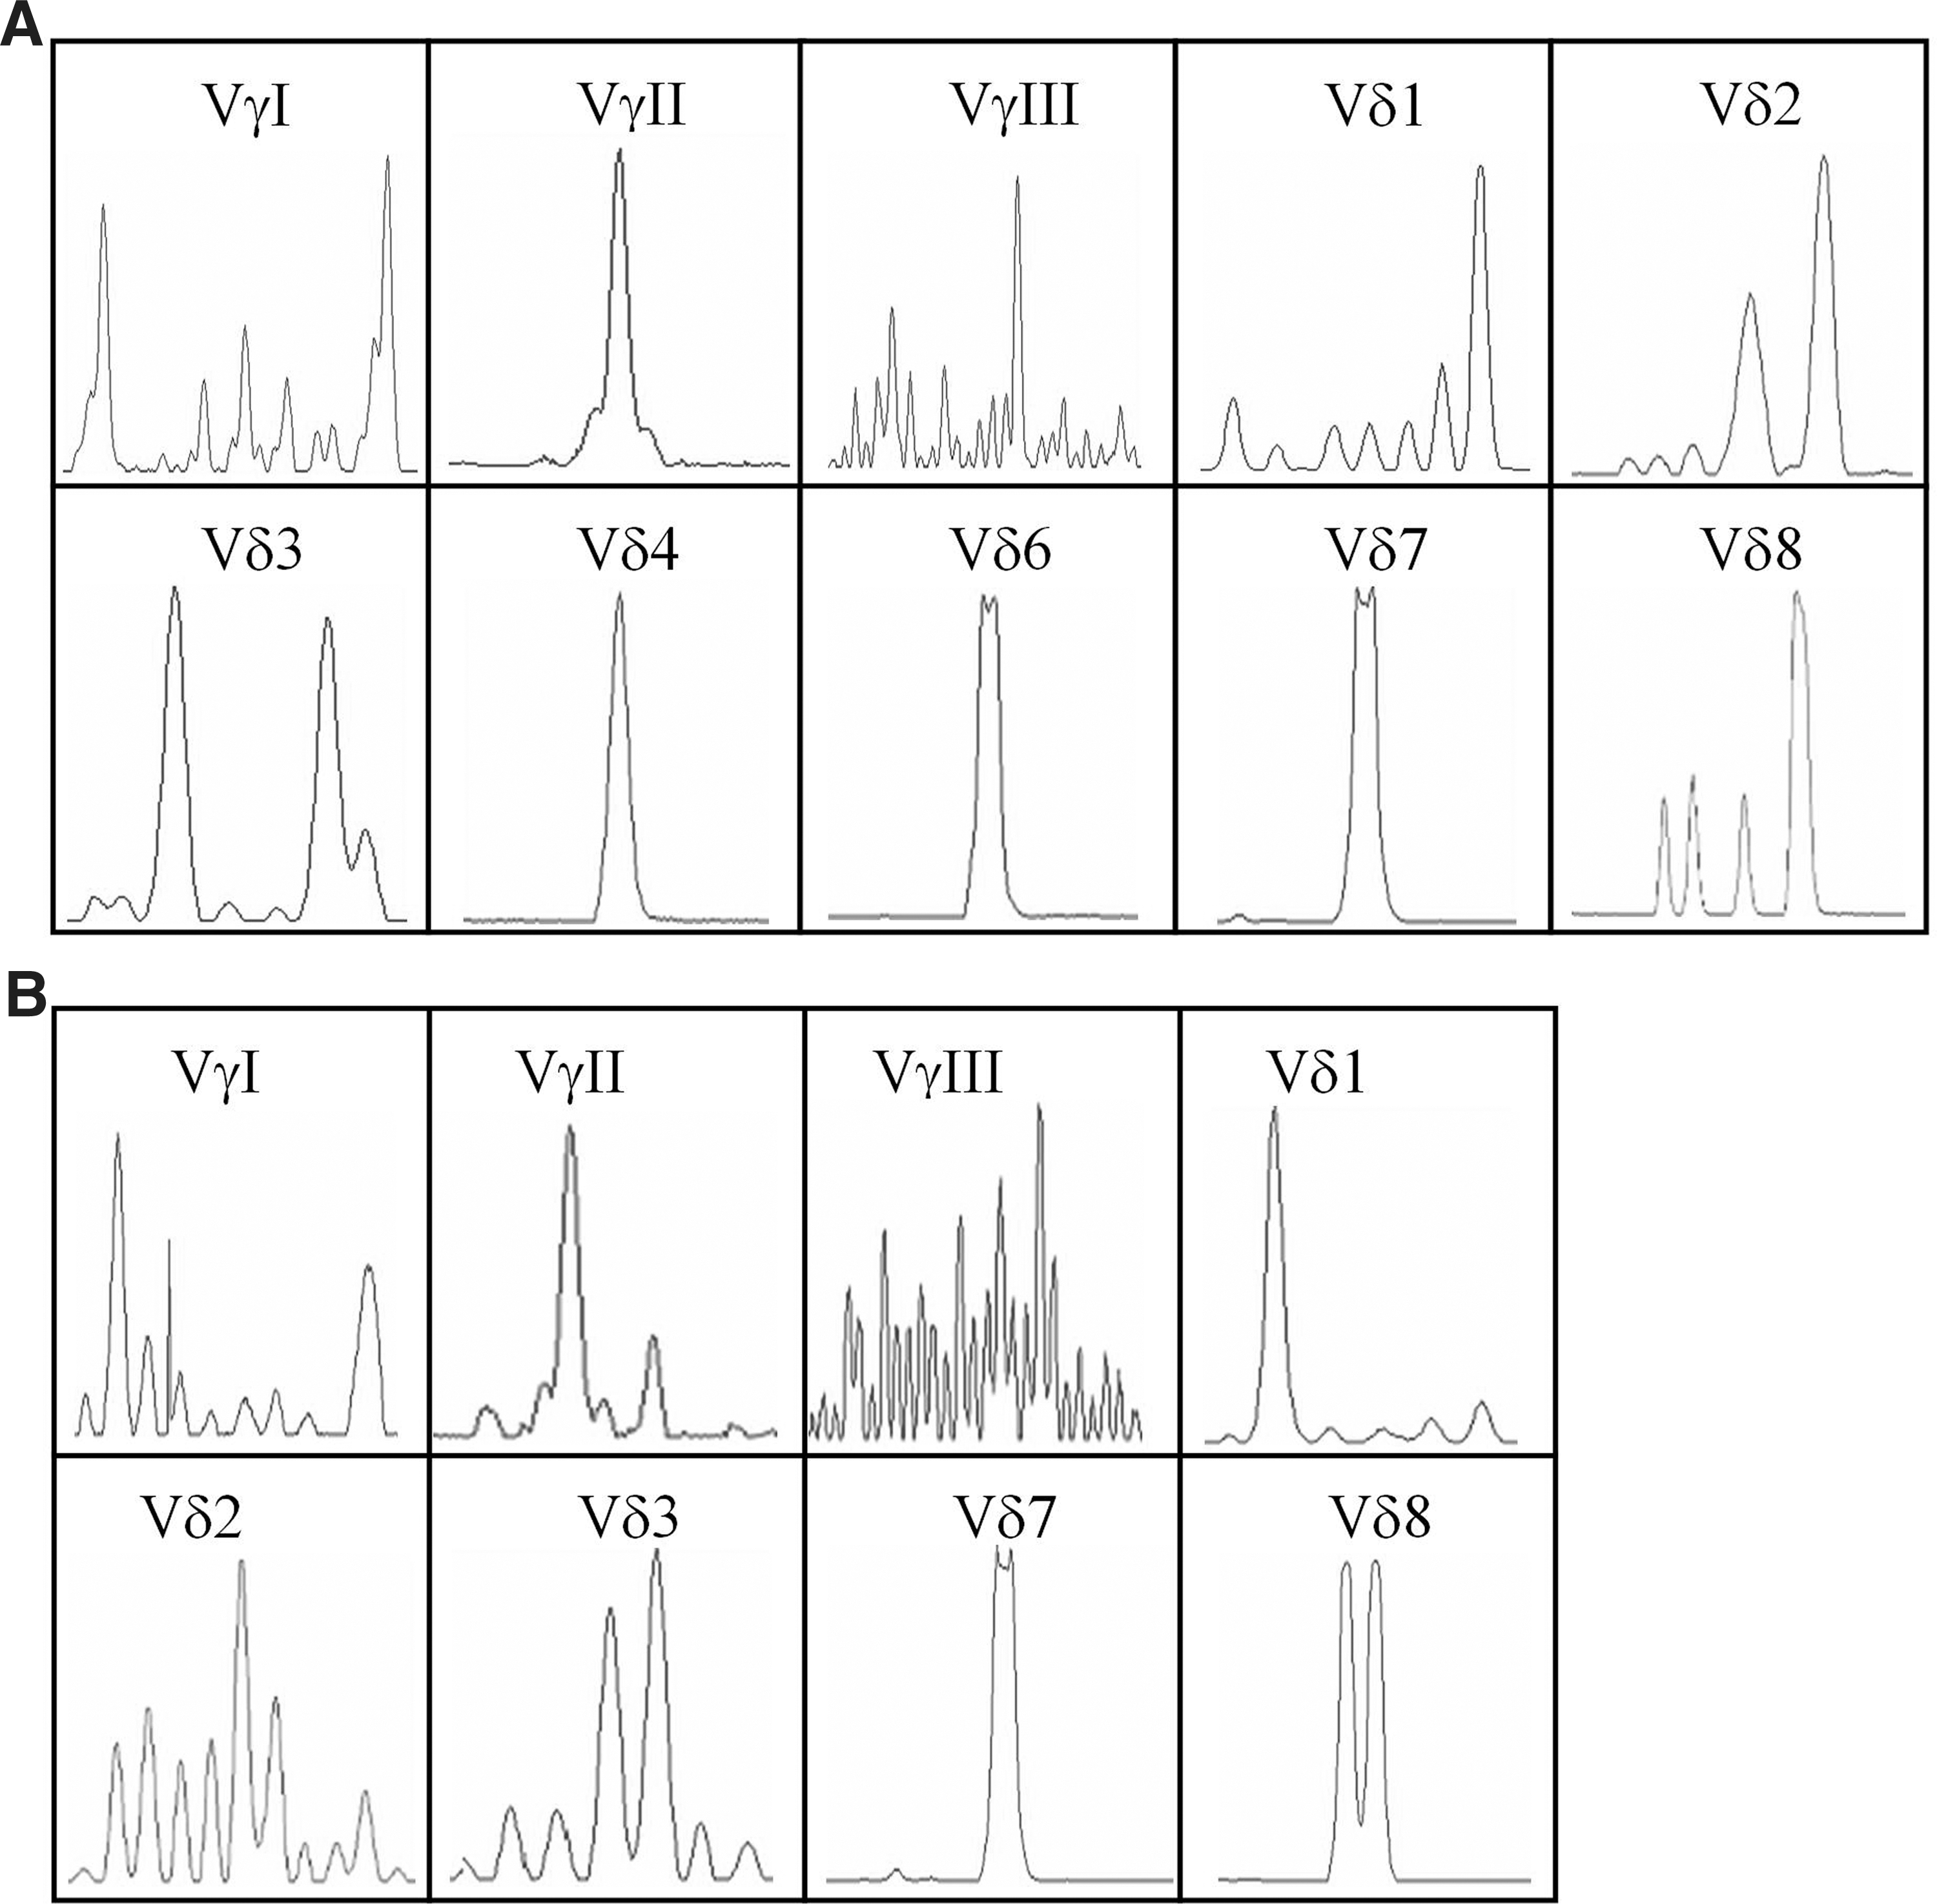
CDR3 analysis of the TCR Vγ and Vδ families in peripheral blood samples from
At least one clonally expanded TCR Vγ subfamily was found in 72.73% (16/22) of the RAEB group and 88.89% (8/9) of the RAEB-AML group (p=0.639) cases. At least one clonally expanded TCR Vδ subfamily was detected in all cases from both groups. The mean value of the clonally expanded Vδ families was 2.86±1.32 for the RAEB group, which is similar to that of the RAEB-AML group (2.67±1.0; p=0.701). Vδ3 was the most frequent clonally expanded T cell subfamily found in the RAEB group (94.12%, 16 out of 17 positive cases) and RAEB-AML group (71.43%, five out of seven positive cases). In the RAEB-AML group, Vδ8 was the most frequent clonally expanded T cell subfamily (87.5%, 7/8), and it was significantly higher than that in the RAEB group (42.86%, 9/21; p=0.0307) (Fig. 4).
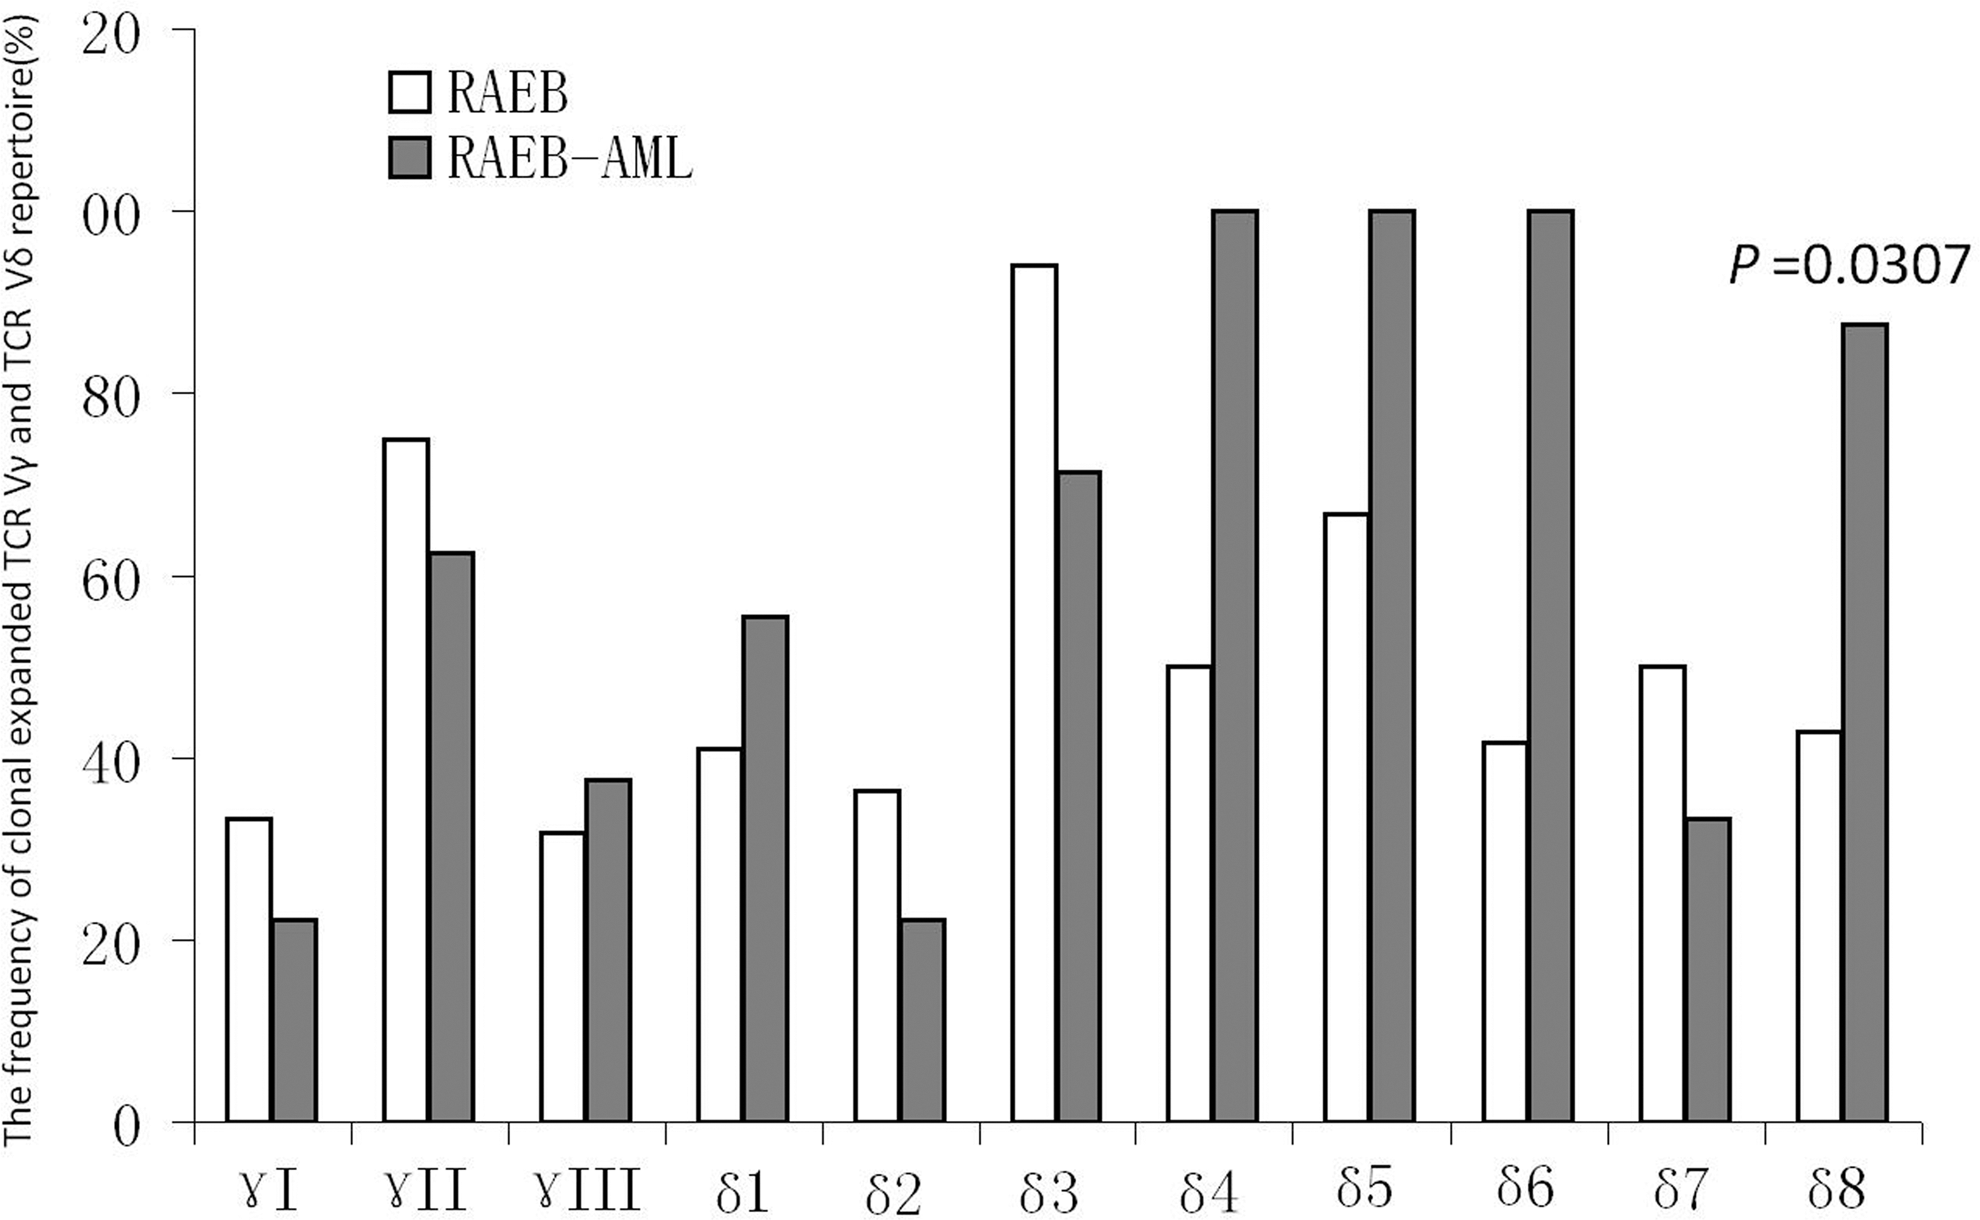
The clonally expanded TCR Vγ and TCR Vδ subfamily frequencies in patients with RAEB and RAEB-AML.
Relationship between clonally expanded TCR Vγ or Vδ and the clinical characteristics
The clinical characteristics of the patients are shown in Table 1. The patients could be divided into two groups by age. The number of clonally expanded TCR Vδ subfamilies in patients ≥60 years was higher than that found in patients younger than 60 years (p=0.0323). The expression and clonality of the TCR Vγ and TCR Vδ subfamilies were not associated with sex, WBC, hemoglobin B level, PLT count, SF, WHO subtype, or International Prognostic Scoring System score (p>0.05).
Discussion
Immune mechanisms are involved in the pathophysiology and evolution of MDS. Analysis of alterations in the TCR repertoire as well as the TCR-CD3 signaling may be an effective investigational approach that may help to understand immunological abnormalities and provide guidance for clinical applications using this information (Wlodarski et al., 2006; Li et al., 2012). Several studies have reported an abnormal αβ TCR repertoire in patients with MDS (de Vries et al. 2008; Chamuleau et al., 2009; Campregher et al., 2010). It is now known that abnormally expanded γδ T cells play an important role in antitumor immunity. Different TCR Vγ and Vδ subfamily T cell expression patterns have been reported in patients with leukemia and immune thrombocytopenic purpura (Bartkowiak et al., 2002; Li et al., 2009; Zhang et al., 2009; Xuan et al., 2011). Little is known about the distribution and clonality of the TCR Vγ and Vδ subfamilies in MDS. In this study, we first investigated the features of the γδ TCR repertoire in 31 cases with MDS-RAEB and analyzed its relationship with AML progression. Similar to the expression features of the TCR Vγ subfamilies in normal individuals and some autoimmune diseases such as idiopathic thrombocytopenic purpura (ITP), an unrestricted TCR Vγ subfamily expression pattern was found in samples from the REAB and REAB-AML groups, indicating highly diverse Vγ gene segment subfamily usage (Li et al., 2009; Zhang et al., 2009). The highly restricted TCR Vγ subfamily usage that is predominant for TCR VγII (Vγ9) was characterized in B-cell chronic lymphocytic leukemia (B-CLL) (Bartkowiak et al., 2002). However, in this study, there was no significant difference in the TCR Vγ subfamily expression pattern in the REAB-AML group. Thus, further investigation is needed to summarize the TCR Vγ repertoire expression features that are related to leukemia after MDS.
In contrast to TCR Vγ subfamilies, a restricted TCR Vδ repertoire expression pattern is a common feature in patients with RAEB and RAEB-AML, particularly in RAEB-AML patients. Expanded T cells bearing a particular γδ TCR type that is stimulated by potent and common antigens leading to the inhibition of expansion of other T cell subfamily members may account for this phenomenon because TCR Vδ subfamily T cell clonal expansion has been detected in the majority of patients in this study. The most frequently expressed genes in the patients were TCR Vδ1 and Vδ2 followed by Vδ8 and Vδ3. Compared with patients with ITP who frequently express TCR Vδ1 and Vδ2 with rare expression of the other subfamily members, nearly half or more patients with RAEB expressed the Vδ3, Vδ4, and Vδ6–8 subfamily genes (Zhang et al., 2009). These results suggested that γδ T cells in patients with RAEB had more diverse TCR Vδ segments. This diversity may reflect the heterogeneity found in RAEB patients and that is different to ITP patients. It is worth noting that the number of expressed TCR Vδ subfamilies in the RAEB-AML group is significantly less than that in the RAEB group, particularly the TCR Vδ4 subfamily, which could be detected in most RAEB cases (63.64%) but only in 11.11% of the RAEB-AML cases. Restricted TCR Vδ subfamily expression may reflect the immunodeficiency status in patients with RAEB-AML; however, whether it is related to the evolution to AML remains an open question. Studies have shown that γδ T cells activated by zoledronic acid exerted antimyeloma activity in vitro, and in a leukemia model, human γδ T cells that were expanded in vitro exerted anti-leukemia activity (Mariani et al., 2005; Siegers et al., 2011). Furthermore, a study by Kiladjian et al. (2008) has demonstrated that Vδ2 T cells were reduced and dysfunctional in a subset of patients with MDS. Consequently, whether the remaining, expressed Vδ subfamily gene T cells, such as Vδ4, indeed operates effectively and participates in the prolonged progression to AML remains an open question. Further studies are required to determine the cytotoxic activity against neoplastic γδ T cells from patients with MDS.
Clonally expanded TCR Vγ and Vδ subfamilies could be detected in the majority of patients with RAEB and RAEB-AML. The clonally expanded TCR Vγ and Vδ subfamily T cells in RAEB may reflect expansion of unique T cell subpopulations after antigen-driven proliferation, for example, in response to putative MDS-associated Ags. Further investigation is needed to determine whether these clonally expanded T cells are related to anti-malignant cells or play an autoimmune reactive effect. However, the higher frequency of clonally expanded Vδ8 T cells in the RAEB-AML patient group may be a characteristic of this population and may be related to the leukemia associated antigen in AML post MDS. Few reports have described the abnormal expansion of the TCR Vγ and Vδ clones in relation to different diseases or antigens. Wu et al. (2001) have confirmed that the T cells infiltrating the kidneys with IgAN were oligoclonal Vδ1 T cells. In B-CLL patients, T cells expressing the Vδ1 TCR displayed the highest relative increase (Bartkowiak et al., 2002). Different γδ T cell subfamilies may possess different biological functions (Carding and Egan, 2002). Overall, the biological function and clinical significance of clonally expanded Vδ8 T cells in patients with RAEB-AML remain unclear and require further characterization.
In addition, we attempted to characterize the association between the distribution and clonal expansion alterations of TCR Vδ and clinical patient characteristics. The results demonstrated that the restricted expression of TCR Vδ in patients age 60 years or older was significantly higher than that of younger patients. T cell diversity declines with age as determined by TCR Vβ chain analysis (Naylor et al., 2005). Aging affects all arms of the immune system. In the elderly, the increased risk for developing MDS has, in part, been attributed to the decline in the γδ T cell diversity with increasing age.
In conclusion, to our knowledge, this is the first characterization of the difference in the distribution and clonality of the TCR Vγ and Vδ repertoire in patients with RAEB and RAEB-AML. The TCR Vδ subfamily expression pattern exhibited a marked restriction in patients with RAEB-AML. The lower Vδ4 frequency and higher clonally expanded Vδ8 T cell alterations were the characteristic features of patients with RAEB-AML, and further characterization is needed to determine the biological function of these T cells. These results provide new data regarding the immunodeficiency and immune reactive characteristics of patients with RAEB and RAEB-AML.
Footnotes
Acknowledgments
This work was supported by grants from the National Natural Science Foundation of China (No. 30972790), the Science and Technology Planning Project of Guangdong Province (No. 2009A030200009), and Administration of Traditional Chinese Medicine of Guangdong Province (No.2009116).
Disclosure Statement
No competing financial interests exist.