




Abstract
Previously, we isolated cell lines that display various degrees of transformed phenotypes from a single-cell population of human diploid fibroblasts (RB) containing a large deletion (13q14-22) in one copy of chromosome 13. They included a cell line transfected with SV40 early genes (RBSV), an immortalized cell line (RBI), an anchorage-independent cell line (RBS), and a tumorigenic cell line (RBT). Here, we analyzed gene expression profiles in these cell lines and showed that expression of some fibroblast-specified or mesenchyme-specified genes were downregulated, and those of stem cell–specified genes, including NANOG, were upregulated during malignant progression. When NANOG expression was knocked down with a short hairpin NANOG expression vector (shNANOG vector) in the RBS and RBT cells, the anchorage independency and tumorigenicity were repressed. We next examined various cancer cell lines for NANOG expression and showed that some cancer cell lines expressed a high level of normal and/or variant NANOG proteins. Overexpression of NANOG mRNA in lung adenocarcinoma was also shown by in situ hybridization. All these data indicate the involvement of NANOG in tumorigenesis.
Introduction
To analyze the precise mechanism of human cell transformation, we previously isolated various cell lines as a model for multistep malignant transformation from a single strain of primary human fibroblasts (RB) containing a large deletion (13q14-22) in one copy of chromosome 13 (Oka et al., 1999). They included a cell line transfected with SV40 early genes (RBSV), an immortalized cell line (RBI), an anchorage-independent cell line (RBS), and a tumorigenic cell line (RBT). The RBI, RBS, and RBT were derived from a single colony of the RBSV, indicating that all these cell lines are offspring of clonal population and, therefore, possess minimum difference in genetic background. Using these cell lines, we analyzed expressional alteration of various genes (Oka et al., 1999; Kyo et al., 2000; Watari et al., 2006).
Here, we examined expressional profiles of differentiation-related genes in these cell lines and showed that expression of some fibroblast-specified or mesenchyme-specified genes were downregulated, and those of stem cell–specified genes, including NANOG, which is an embryonic stem cell nuclear factor gene (Mitsui et al., 2003), were upregulated during malignant progression. When NANOG expression was knocked down with a short hairpin NANOG expression vector (shNANOG vector) in the RBS or RBT cells, the anchorage independency and tumorigenicity were repressed. Also, we showed an overexpression of normal and/or variant NANOG proteins in various human cancer cell lines and that of NANOG mRNA in lung adenocarcinoma tissues. These findings suggest involvement of NANOG in tumorigenesis.
Materials and Methods
Cell culture
Isolation and characterization of the RB cell lines were described previously (Oka et al., 1999). These cell lines were cultured in a Dulbecco-modified minimal essential medium (DMEM) with 10% fetal bovine serum (FBS).
Construction of retrovirus vector and virus production
pCX4, a Moloney murine leukemia virus–based retrovirus vector, was constructed by Akagi and colleagues (Akagi et al., 2000). pCXPshNANOG, an shNANOG vector, was constructed by inserting the nucleotides, described below, into a pCXPshU6 vector that contains a human U6 promoter and a puromycin-resistance gene. The nucleotide sequences that were inserted are 5′-GGGTTAAGCTGTAACATACTTCAAGAGAGTATGTTACAGCTTAACCCTTTTTT-3′ (Zaehres et al., 2005). The construct was verified by DNA sequencing.
Western blot analysis
Cells were lyzed with an RIPA buffer (0.15 M NaCl, 50 mM Tris-HCl [pH 7.4], 1 mM ethylenediaminetetraacetic acid, 1% Triton X-100, 1% sodium deoxycholate, 0.1% SDS, 100 mg/ml phenylmethylsulfonyl fluoride, and 0.25 TIU/ml aprotinin). The cell lysates were run on a 5–20% SDS–polyacrylamide gel and electroblotted onto a polyvinylidene difluoride membrane. The membranes were incubated successively with antibodies against mouse monoclonal anti-Vimentin (sc-6260, Santa Cruz), mouse monoclonal anti-N-cadherin (610920, BD Transduction Lab), rabbit polyclonal anti-Fibronectin (F3648, Sigma–Aldrich), mouse monoclonal anti-NANOG (4893, Cell Signaling), or mouse monoclonal anti-β-actin (A2228, Sigma-Aldrich) and then with a horseradish peroxidase-conjugated anti-rabbit or mouse immunoglobulin G (IgG) antibody (Cell Signaling). After reaction with chemiluminescence reagent (Amersham,), the protein bands were visualized on X-ray film.
Northern blot analysis
RNA, isolated using an SV total RNA isolation kit (Promega), was subjected to formaldehyde-1.2% agarose gel electrophoresis, blotted onto nylon membranes, hybridized with 32P-labeled probe, washed, and autoradiographed. 32P-labeled SLUG, SNAIL, S100A4, and β-actin cDNA probes were prepared with labeling kit (GE Healthcare) according to the manufacturer's protocols.
Semi-quantitative real-time polymerase chain reaction
Semi-quantitative real-time polymerase chain reaction (RT-PCR) was performed as described previously (Watari et al., 2012). The nucleotide sequences of the primers are as follows: the forward primer for NANOG, 5-CTATACTAACATGAGTGTGG-3; the reverse primer for NANOG, 5-GATTCAGCCAGTGTCCAGAC-3; the forward primer for SOX-2, 5-GCACAGCGCCCACATGTACA-3; the reverse primer for SOX-2, 5-CGGCCCTCACATGTGTGAGA-3; the forward primer for KLF-4, 5-TGGGCCCCCACATTAATGAG-3; the reverse primer for KLF-4, 5-GTCATATCCACTGTCTGGGA-3; the forward primer for OCT-4, 5-CTGCAGCTTAGCTTCAAGAA-3; the reverse primer for OCT-4, 5-AAGGGCAGGCACCTCAGTTT-3; the forward primer for GAPDH, 5-TCTTCACCACCATGGAGAAG-3; and the reverse primer for GAPDH, 5-ACCACCTG GTGCTCAGTGTA-3.
Quantitative RT-PCR
Quantitative RT-PCR (qPCR) was performed with SYBR Premix Ex Taq II (Takara) using StepOne Plus (Applied Biosystems). Relative quantification was performed against a standard curve, and the values were normalized against the input determined for the housekeeping gene, GAPDH. The primer sequences used for qPCR were as follows: the forward primer for NANOG, 5′-CAAAGGCAAACAACCCACTT-3′ and the reverse primer for NANOG, 5′-TCTGCTGGAGGCTGAGGTAT-3′; the forward primer for GAPDH, 5′-GGTGGTCTCCTCTGACTTCAACA-3′ and the reverse primer for GAPDH, 5′-GTGGTCGTTGAGGGCAATG-3′ (Leschik et al., 2008, Blin et al., 2010).
In situ mRNA hybridization
In situ mRNA hybridization was performed as described previously (Shimakage et al., 2006) using human cancer tissue. Briefly, pSK-NANOG, a NANOG cDNA-containing pSKII vector, was used to prepare the sense and antisense probes labeled with digoxigenin-11-UTP. The labeled riboprobes were fragmented by alkali hydrolysis and hybridized with tissue sections. Hybridized signals were detected with alkaline phosphatase-conjugated anti-digoxigenin antibody and nitroblue tetrazolium and X-phosphate.
Anchorage-independent growth assay
Anchorage-independent growth was assessed by the colony-forming ability in soft agar. Cells were inoculated into 0.4% agarose in DMEM supplemented with 10% FBS. After 2 weeks' incubation, the number of colonies larger than 0.125 mm in diameter was counted.
Tumorigenicity assay
Cells (1×10⁷ cells/0.2 ml per site) were injected subcutaneously in the back of female 4-week-old BALB/cJ (nu/nu) mice. Tumor formation was checked periodically.
Results
Expressional alteration of differentiation-related genes in the RB cell lines
As described above, the RB cell lines (Fig. 1a) were derived from a single strain of human fibroblasts (RB), and the RBI, RBS, and RBT were offspring of a single colony of the RBSV, indicating that these cell lines possess minimum difference in genetic background. Therefore, these cell lines are suitable to identify genes involved in the malignant progression of human cells. We first examined whether or not the malignant progression of the RB cells was accompanied by expressional change of differentiation-related genes. Figure 1b and c showed that fibronectin, vimentin, N-cadherin, SNAIL, SLUG, and S100A4 were largely downregulated as increasing their malignant phenotype, suggesting that malignantly transformed cells lost mesenchymal nature of the parental cells. However, these malignant cell lines did not express epithelial cell-specified genes such as E-cadherin (data not shown), suggesting that the malignant transformation of the RB cells may not result from mesenchymal to epithelial transition.
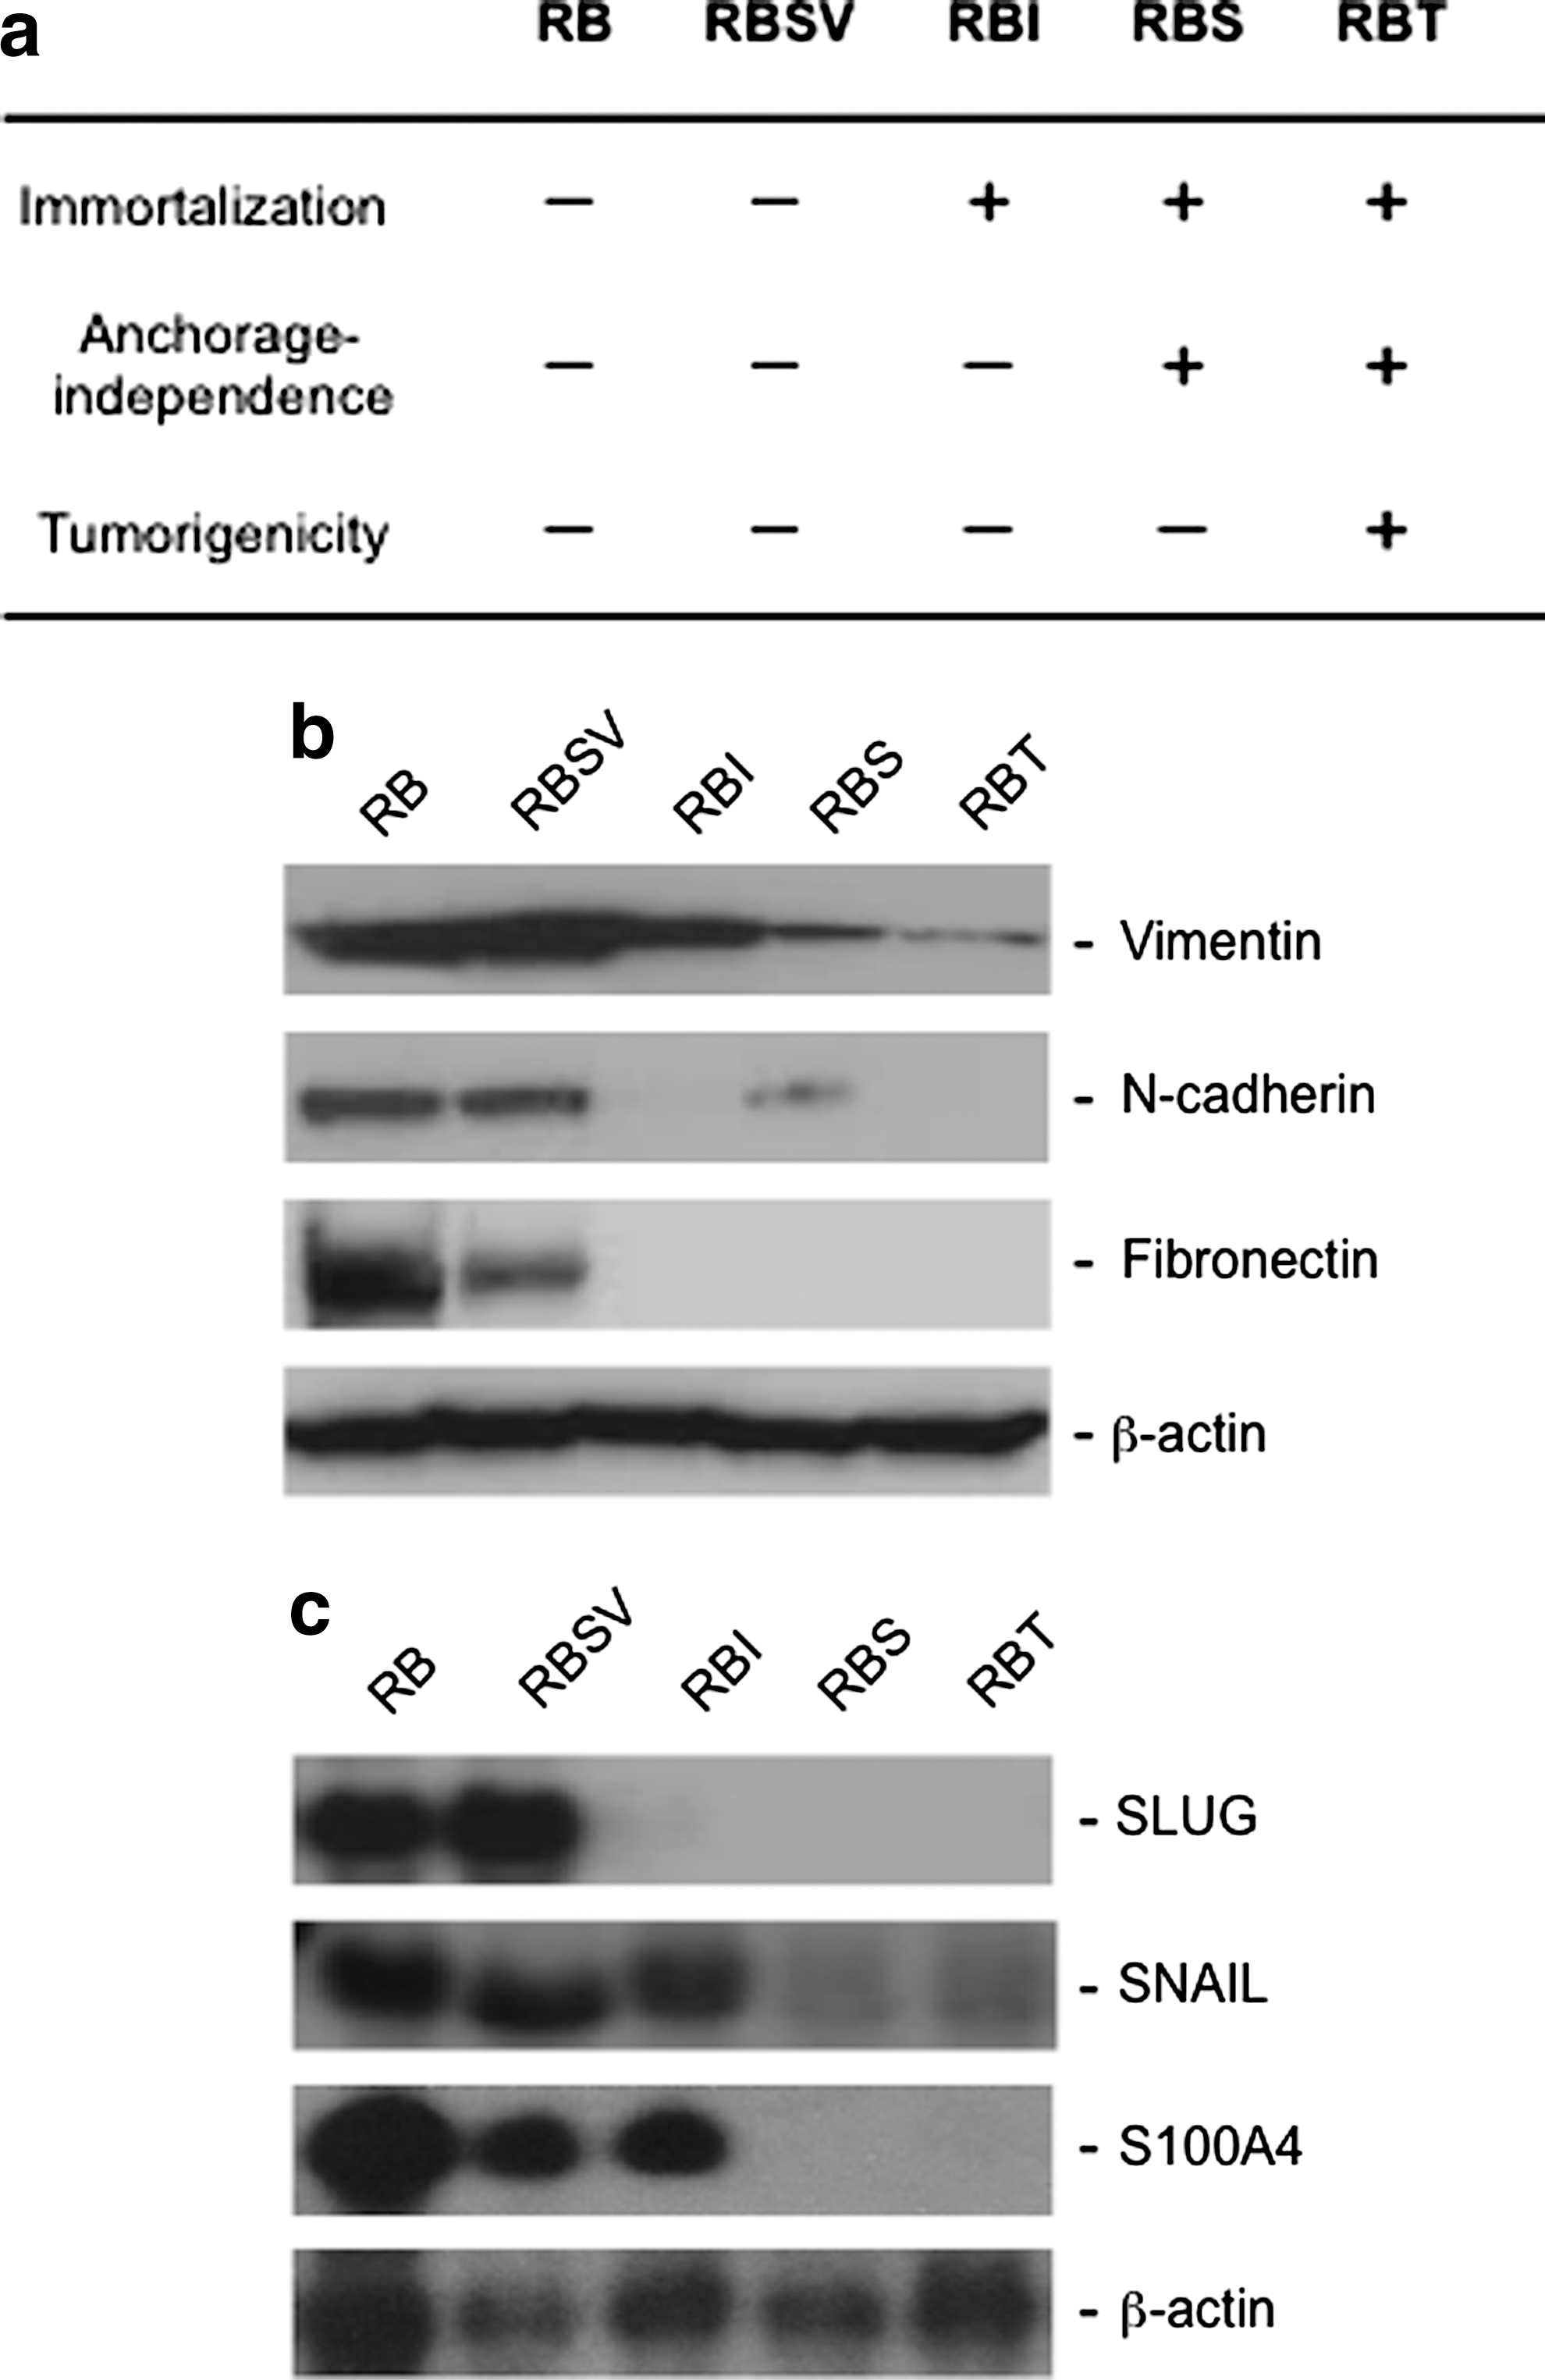
Differentiation status of the RB cell lines.
We next examined the expression of some embryonic stem (ES) cell–specified genes by semi-quantitative RT-PCR. As shown in Figure 2a. NANOG and SOX2 mRNAs were upregulated with malignant progression of the RB cells, though expression levels of KLF-4 and OCT4 mRNAs were not upregulated. All these data suggest that malignant transformation may correlate, in part at least, with dedifferentiation.

Embryonic stem (ES) cell marker gene expression in the RB cell lines.
Requirement of NANOG upregulation for malignant progression of the RB cells
We focused on and investigated the relevance between NANOG expression and malignant progression of RB cells. First, we tried to confirm the NANOG upregulation by different methods, in situ hybridization and quantitative RT-PCR. Data obtained by in situ hybridization were consistent with the above results (Fig. 2b), and quantitative RT-PCR showed that NANOG expression levels in the RBS and RBT were about twice the amount of those in untransformed cells such as the RB and RBSV (Fig. 2c). Although we also looked at the expression level of the NANOG protein by western blotting, we could not detect it clearly because of the very low expression level.
To examine whether the NANOG upregulation is associated with the malignant progression or not, the immortalized RBI cells were transfected with a human NANOG cDNA expression vector. However, the transfected RBI did not form colonies in soft agar (data not shown), suggesting that NANOG overexpression alone was not sufficient for malignant transformation. We next attempted to knock down the NANOG expression in the RBS and RBT cells by introducing the shNANOG vector. The transfected RBS and RBT cells selected with puromycin formed colonies and tumors less efficiently (Fig. 3a–d). These results present the possibility that NANOG upregulation may play some role in malignant progression. To further examine it, we isolated the RBT cell clones, of which NANOG expression levels were repressed by shNANOG (Fig. 3e), and examined growth abilities in liquid and semi-solid media. Growth rates of the RBT/vector and RBT/shNANOG #12 in liquid media were the same, whereas the RBT/shNANOG #2 grew considerably slower than the other cell clones (data not shown). Efficiencies of colony formation in soft agar by the RBT/shNANOG cell clones were less than that by the control cell clone (Fig. 3f). Degrees of repression of colony formation depend on the expression levels of NANOG mRNA (Fig. 3e, f). These results suggest that NANOG upregulation may be essential for malignant progression of the RB cells.
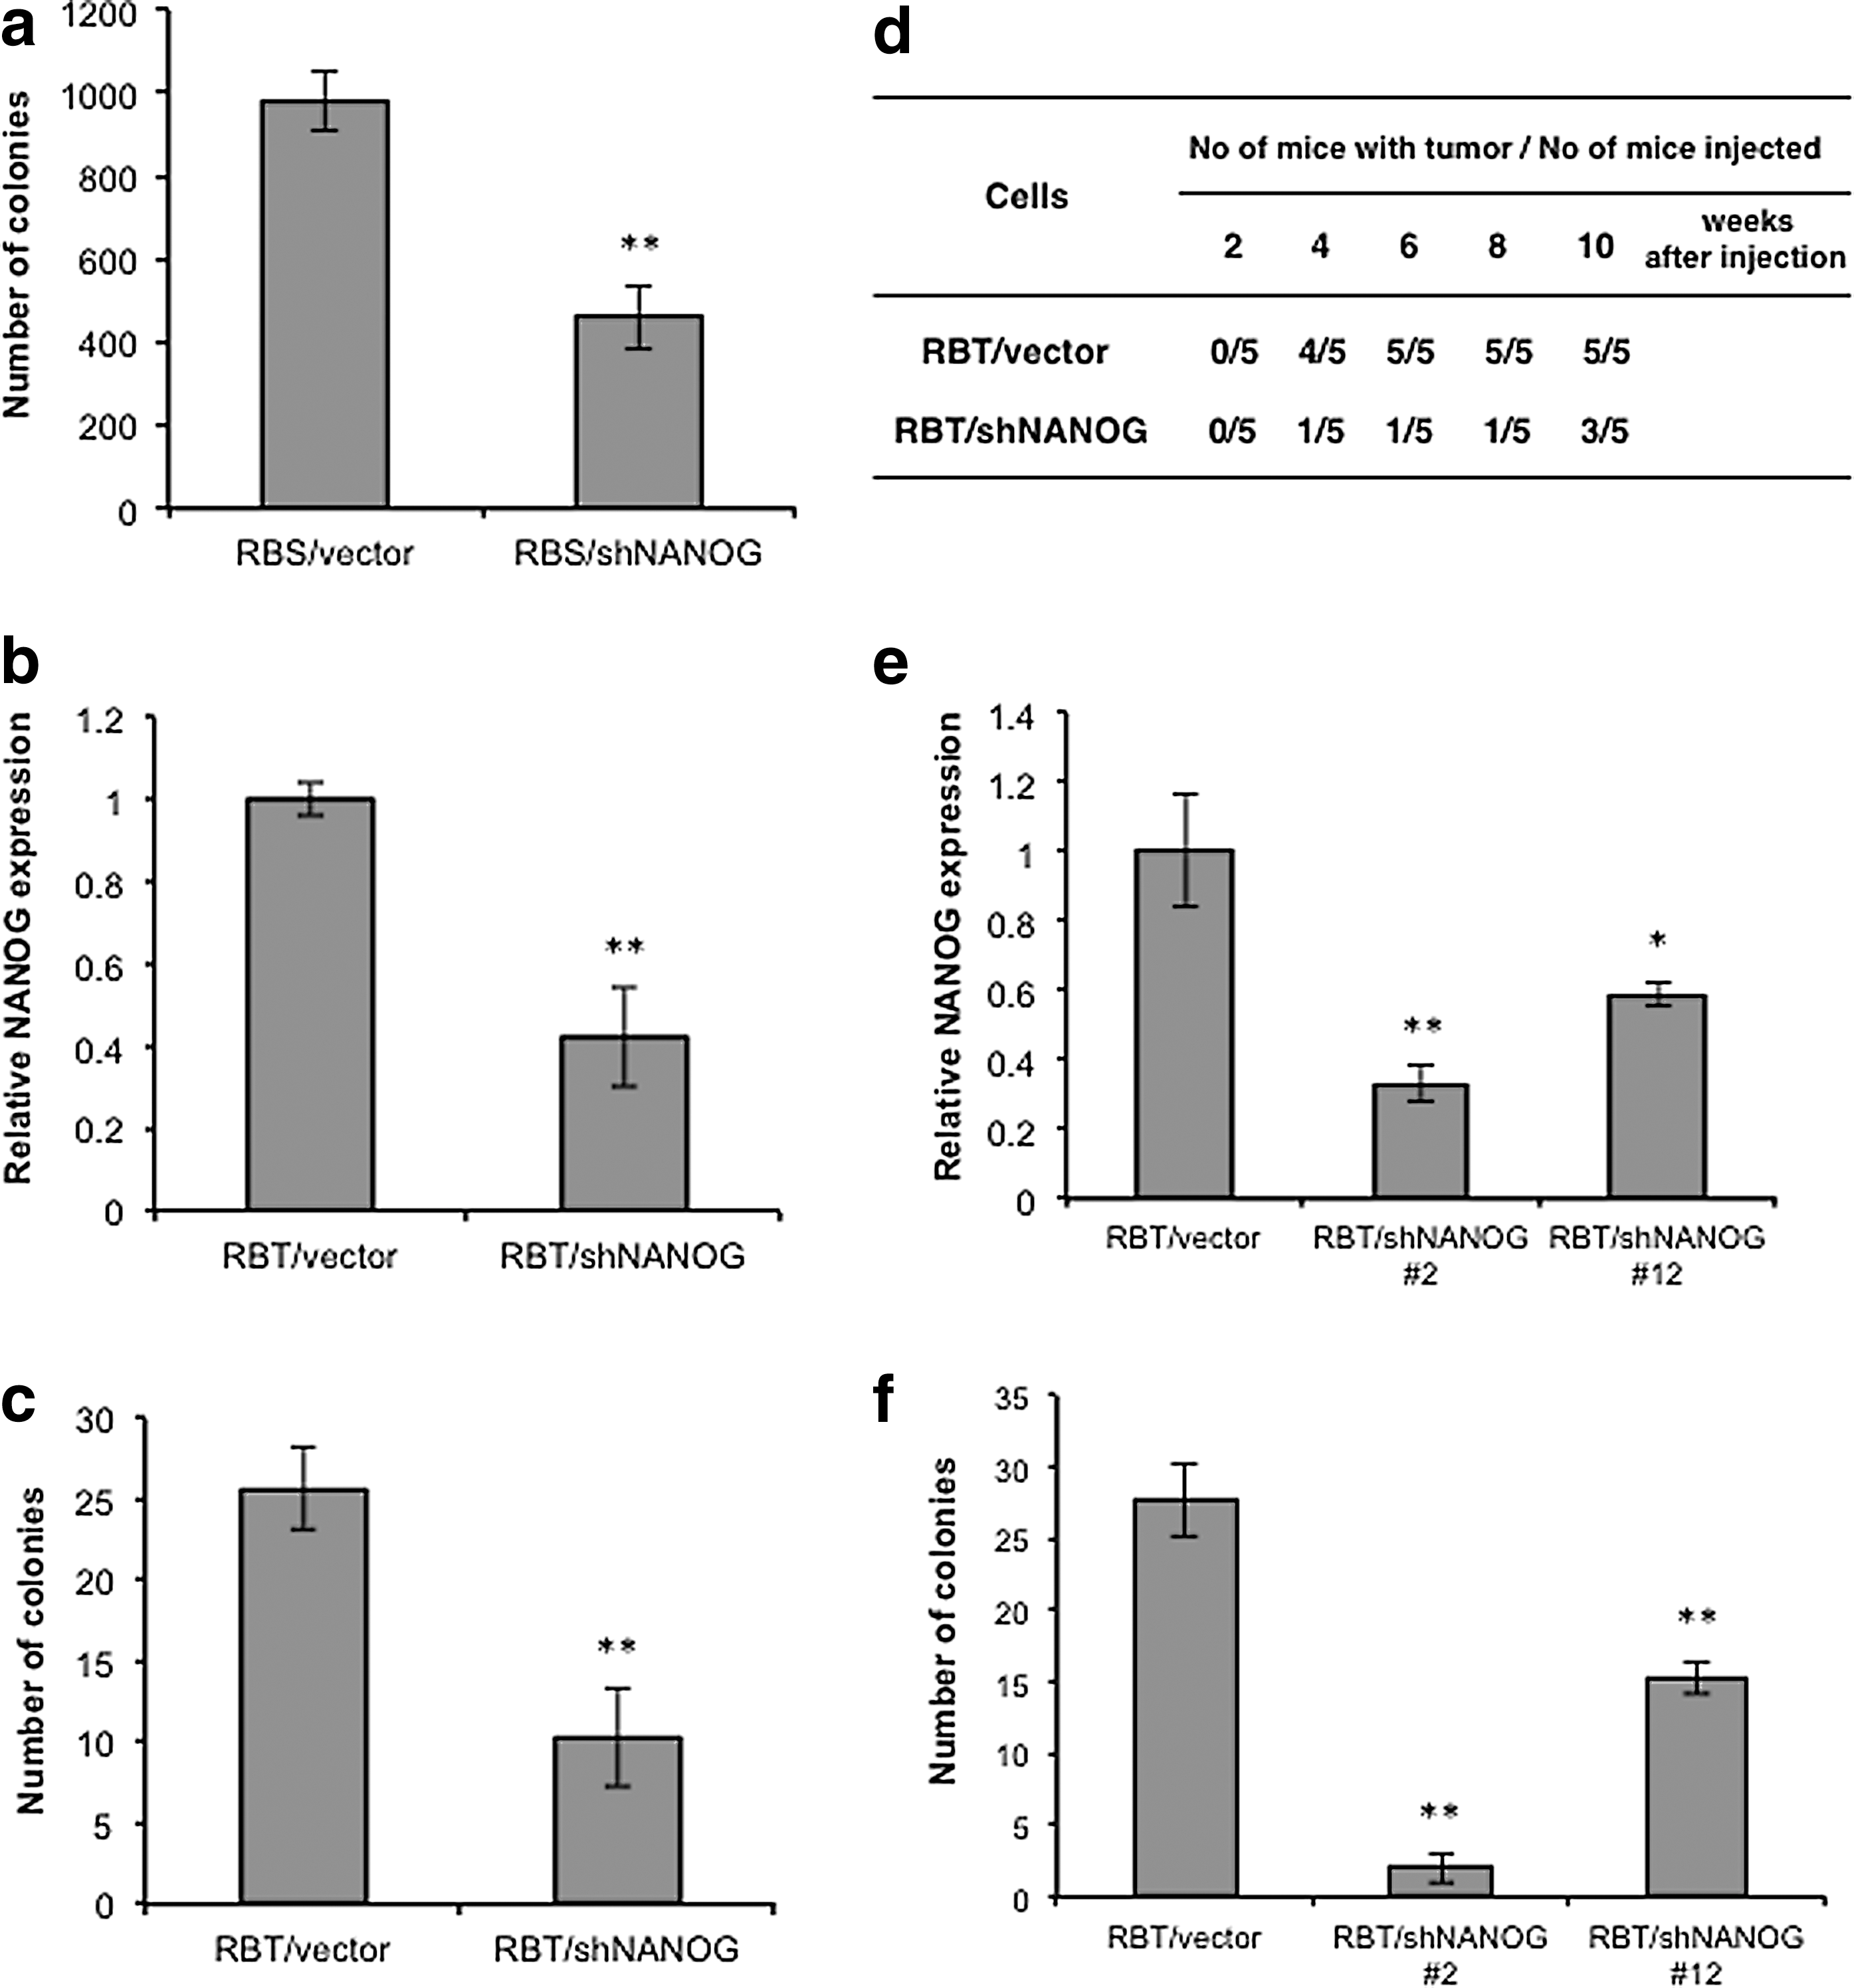
Requirement for NANOG expression in transformed phenotype of the RB cell lines.
NANOG upregulation in human cancer cells
We examined whether or not NANOG upregulation was also observed in human cancer cell lines or cancer tissue. Figure 4a shows expression of NANOG proteins in various human cancer cell lines. Tera-2 (embryonal carcinoma cell line), used as a positive control, expressed a high level of NANOG protein, whereas HF (primary human fibroblasts), used as a normal cell control, expressed a very low level of the protein. Expression of the NANOG protein was detected in many cancer cell lines, though its expression level was not as high as that of Tera-2. Strikingly, a very high expression of NANOG variant proteins was also detected in some cancer cell lines, such as HeLa (cervical carcinoma cell line), HT-1080 (fibrosarcoma cell line), and MCF7 (breast cancer cell line). Although structures of these NANOG variants have not been determined yet, they might result from alternative splicing or genetic rearrangement.
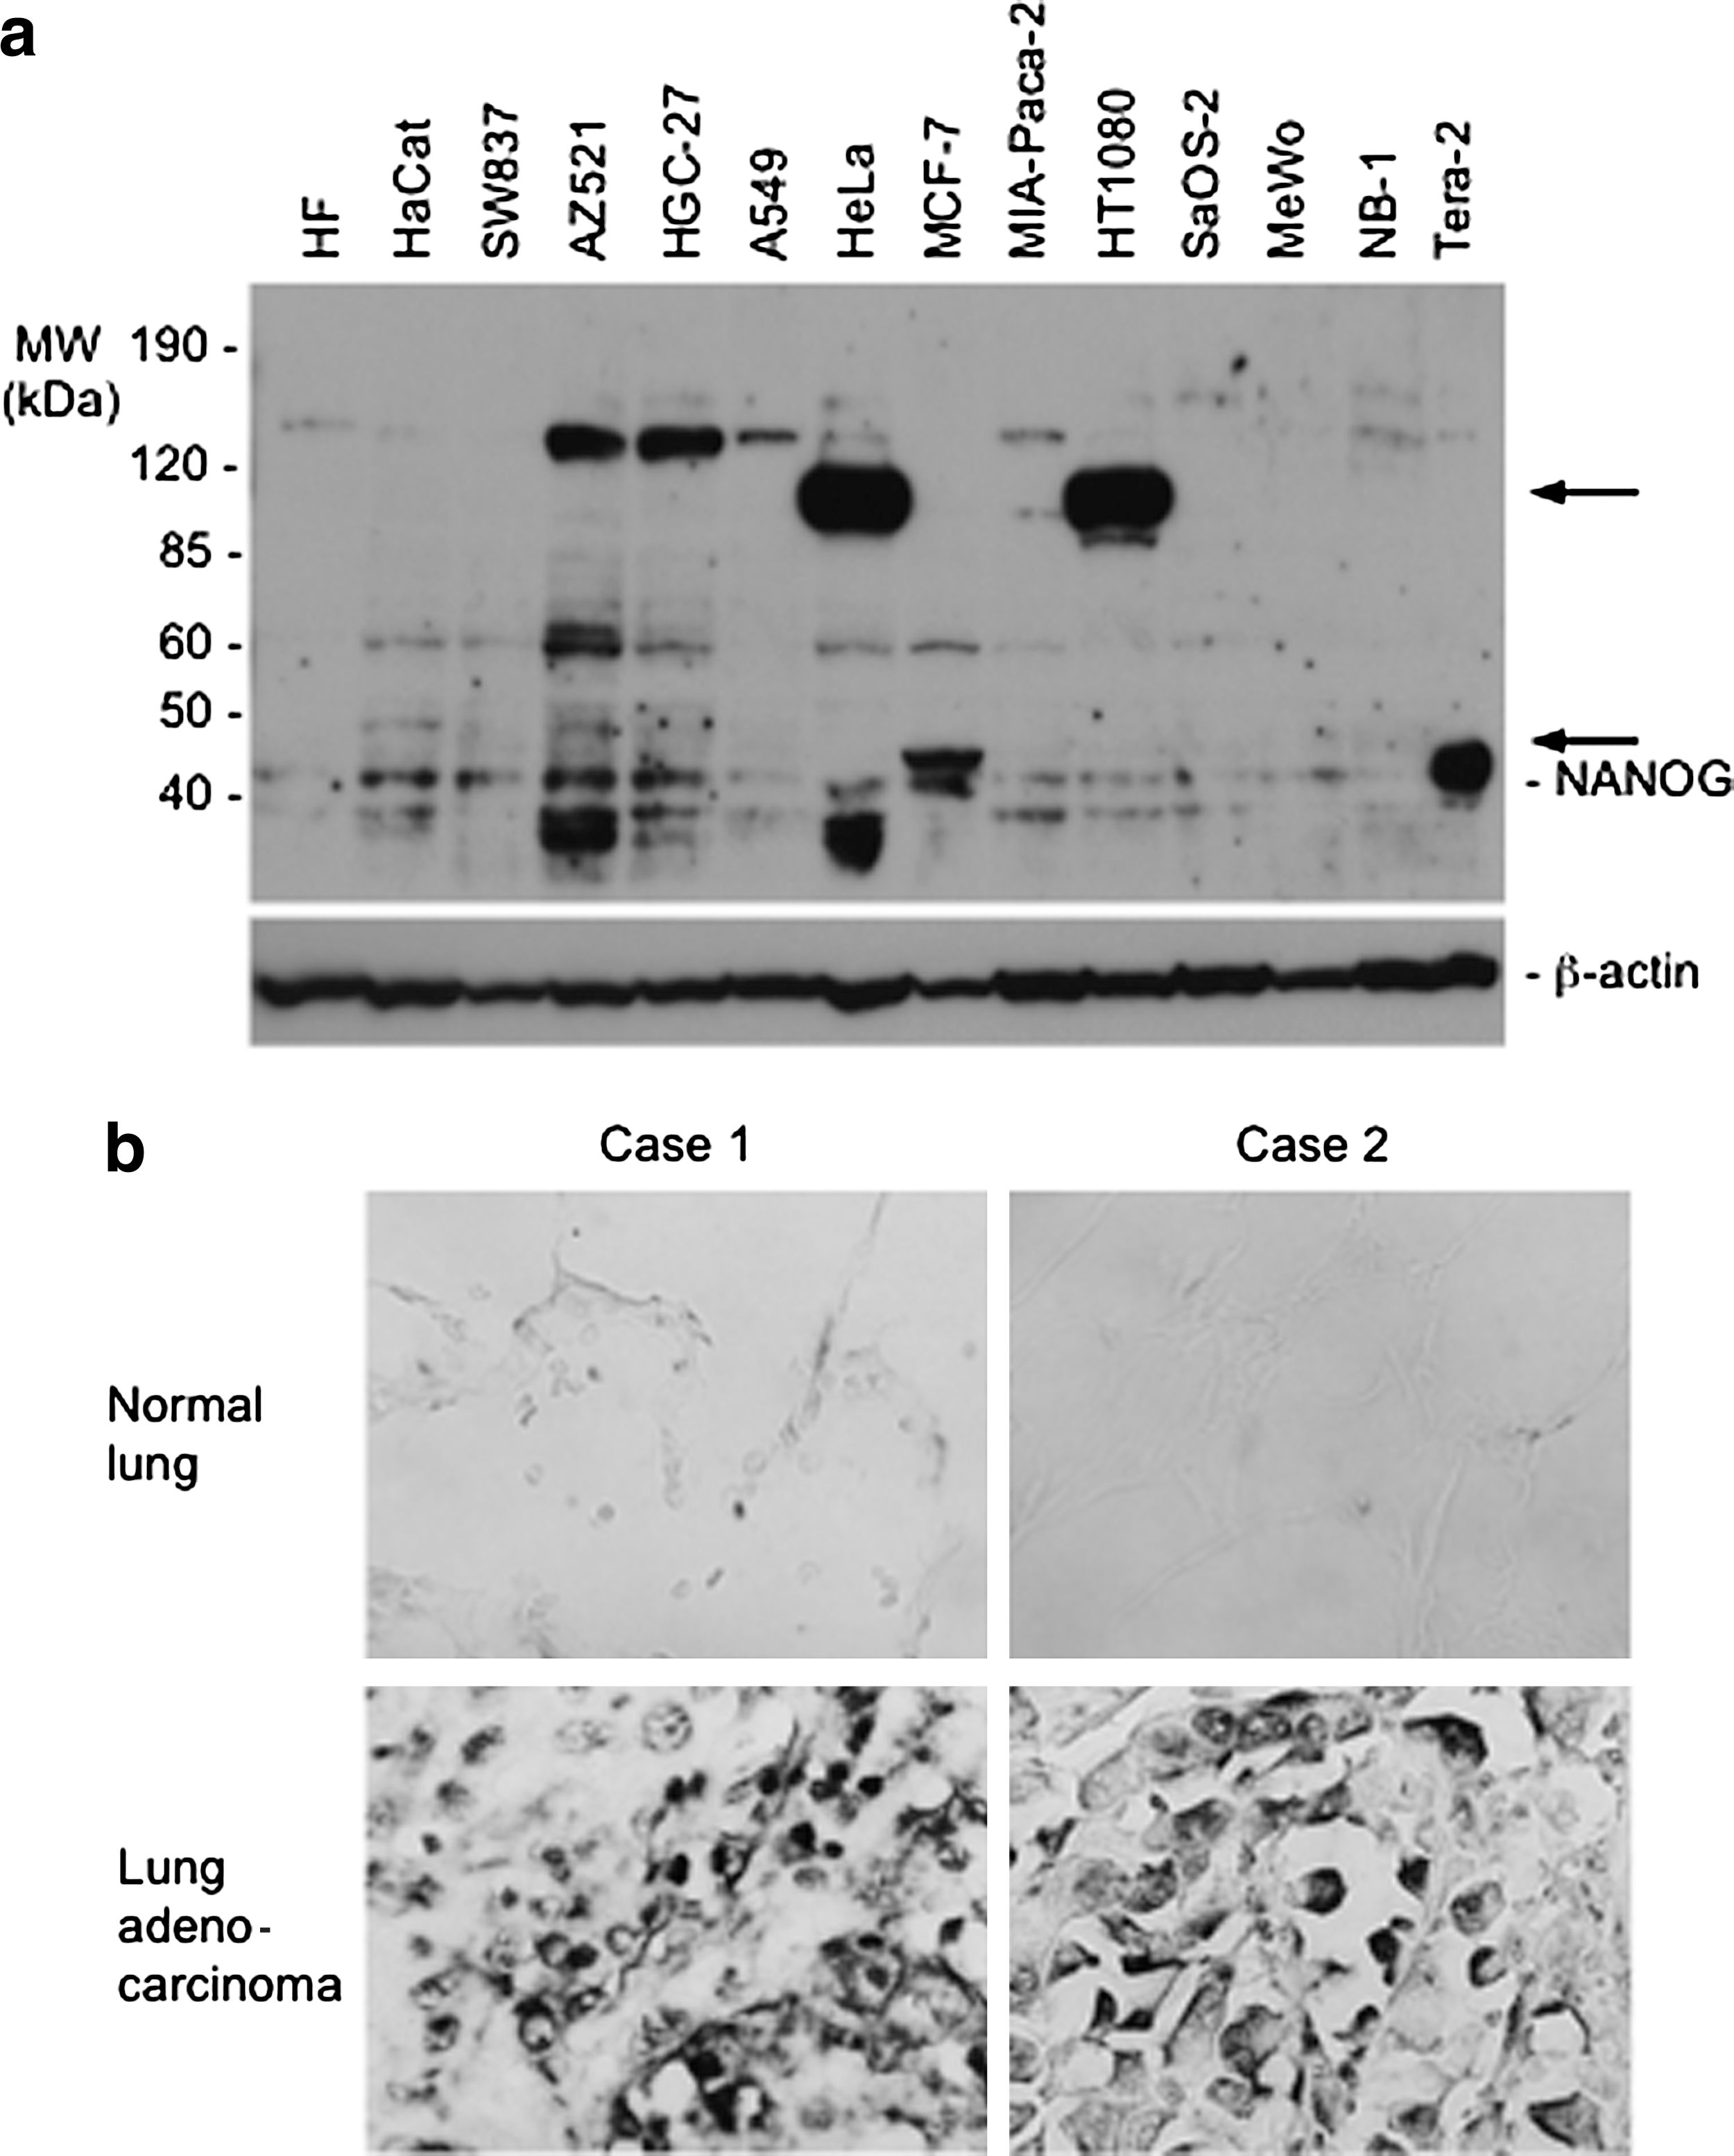
NANOG expression in human cancer cells.
Furthermore, in situ mRNA hybridization was performed using tissue sections of various human lung tumors and normal counterparts. Of these, lung adenocarcinoma (2/2: no. of positive cases/no. of cases examined), but not their normal counterparts, overexpressed NANOG mRNA (Fig. 4b). This result is consistent with a previous report shown by cDNA microarray (Chiou et al., 2010). NANOG overexpression was neither observed in lung squamous cell carcinoma (0/2), thymoma (0/2), or mesothelioma (0/2) (data not shown). All of these results suggest that NANOG upregulation may be involved in tumorigenesis of certain cancers.
Discussion
In this article, we investigated whether dedifferentiation was involved in the malignant progression of the RB human fibroblasts and showed that some mesenchyme-specified genes were downregulated and some stem cell–specified genes, including NANOG, were upregulated during malignant progression (Figs. 1 and 2). These results suggested that the RB cells lost their mesenchymal nature and acquired some kind of stem cell nature during malignant progression. These changes might not result from replacement of cell types, that is, the progressed cells expressing stem cell–specified genes might not be derived from stem cells contaminated in the RB cell population. This was because the RBI cell clone was derived from a single colony of the RBSV, and the RBS and RBT malignant cell clones from a single colony of the RBI (Oka et al., 1999). It is obvious that the RBI cells retain expression of some mesenchyme-specified genes but lost that of other genes, suggesting that these cells represent an intermediate differentiation state between the normal RB cells and the malignant RBS or RBT cells (Figs. 1 and 2). These facts indicate that the RB cells dedifferentiated and progressed from untransformed fibroblasts to stem cell–like malignant cells. Our model cell lines (the RB cell lines) for multistep malignant transformation contributed to obtaining this important conclusion that may influence the argument about the origin of cancer stem cells.
We also showed involvement of the NANOG upregulation in the malignant progression of the RB cells (Fig. 3). When NANOG expression in the anchorage-independent RBS and RBT cells was knocked down by the shNANOG vector, their colony-forming efficiencies decreased. Also, the shNANOG-transfected RBT cells formed tumors less efficiently (Fig. 3d). A previous report showed that downregulation of human NANOG expression inhibited tumorigenesis of prostate, breast, and colon cancer cells (Jeter et al., 2009). These observations strongly suggest that NANOG may be involved in the malignant progression of the RB cells. However, NANOG alone was not sufficient for the progression, because overexpression of NANOG in the RBI cells did not result in acquisition of anchorage independence (data not shown), and we have previously shown that loss of a certain gene, mapped on chromosome 13, was necessary for the progression of the RB cells (Oka et al., 1999). Although it has been reported that human kidney and colorectal cell lines were malignantly transformed by ectopic expression of NANOG (Lin et al., 2011; Ibrahim et al., 2012), this discrepancy might be interpretable by differences in the cell type.
A previous study reported that NANOG is highly expressed in germ cell tumors, testicular carcinoma, CNS germinoma, cervical cancer, and lung adenocarcinoma (Hart et al., 2004; Hoei-Hansen et al., 2005; Santagata et al., 2006; Ye et al., 2008; Chiou et al., 2010). In the present study, we also showed NANOG overexpression in some lung adenocarcinoma by in situ hybridization (Fig. 4b). Further, we showed that some cancer cell lines such as HeLa, HT1080, and MCF7 expressed a very high level of NANOG variant proteins (Fig. 4a). Although the smaller splice variants and pseudogene products with the same molecular weights were reported (Kim et al., 2005, Ambady et al., 2010, Uchino et al., 2012), no report on the NANOG variants with higher molecular weight has been published so far. Therefore, these long variants might result from genetic rearrangement. However, we could not exclude completely the possibility that these extra bands were nonspecific. Analyses of these variants may be a key to the clarifying mechanism of the progression and may be an important subject to be resolved in the future. In any case, these data suggest that NANOG may be involved in tumorigenesis.
Footnotes
Author Disclosure Statement
No competing financial interests exist.