




Abstract
Oral hypoglycemic agent metformin is commonly used for treating type II diabetes; however, initial reports demonstrated that it could be used for suppressing tumor growth in vitro and in vivo. Moreover, novel potential anticancer drug histone deacetylase (HDAC) and inhibitor trichostatin A (TSA) have been extensively studied for inducing various malignancies growth inhibition, cell cycle arrest, and apoptosis. The object of the present study was to investigate the anti-proliferation and apoptosis induction effects of metformin and TSA in osteosarcoma cell line, and to explore the mechanism of metformin and TSA in combination to inhibit the proliferation of osteosarcoma cells. After treating with metformin and TSA, the viability of osteosarcoma cell lines (MG-63 and LM8) was analyzed by 3-(4, 5-dimethylthiazol-2-yl)-2, 5-diphenyltetrazolium bromide (MTT) at various concentrations, cell cycle analysis of MG-63 and LM8 cell was performed by flow cytometry. Real-time polymerase chain reaction and Western Blotting were performed to determine the expression of apoptosis-related genes and proteins such as Caspase-3, Bcl-2/Bax, Cyclin D1, and p21. Protein expression of the molecules involved in 5′-adenosine monophosphate-activated protein kinase (AMPK) signaling pathway after treatment with combination was determined by Western blotting. Moreover, orthotopic xenograft tumors were challenged in nude mice to establish the murine model; tumor weight and tumor volume were monitored after drug administration separately or combined via the intraperitoneal (i.p.) route. MTT assays showed that the viability of osteosarcoma cell lines in the combination group (10 mM metformin, 0.3 μM TSA) decreased in a concentration- and time-dependent manner; moreover, the cell cycle of MG-63 and LM8 in the combination group could be arrested in G1/G2 phase higher number compared with drug use separately. Furthermore, a combination of these drugs does not act via the AMPK signaling pathway to induce MG-63 osteosarcoma cell line growth inhibition and apoptosis. As data have showed here, metformin cotreatment increased TSA antitumor effects and have a synergistic effect on osteosarcoma cell line proliferation and apoptosis.
Introduction
Metformin is often used in clinical applications to decrease blood sugar levels in people with type 2 diabetes; however, recently it has received large attention because of its potential antitumor effects (Tomic et al., 2011; Ashinuma et al., 2012; Chen et al., 2012; Qu et al., 2012) that are thought to be unrelated to its hypoglycemic effects (Zakikhani et al., 2008; Janjetovic et al., 2011; Niehr et al., 2011; Chan and Miskimins, 2012; Li et al., 2012). Recent data demonstrated that metformin decreased tumor cell growth by activating 5′-adenosine monophosphate-activated protein kinase (AMPK) signaling pathway in various cancer cell types (Ben Sahra et al., 2008, 2011; Cantrell et al., 2010; Zakikhani et al., 2010; Janjetovic et al., 2011; Malki et al., 2011; Rattan et al., 2011; Rocha et al., 2011; Hanna et al., 2012; Jung et al., 2012; Klubo-Gwiezdzinska et al., 2012; Shi et al., 2012; Xiao et al., 2012; Xiong et al., 2012).
Currently, data show that single or combined interventions affecting epigenetics and acetyl-CoA metabolism may extend healthy lifespan in mammals (Wallace et al., 2010). Moreover, common metabolic and degenerative disorders and cancers could be ameliorated by the symptoms of effective metabolic and pharmacological treatments in future therapies (Cooney, 2011). These metabolic and degenerative diseases and cancer are becoming increasingly apparent due to our fast-paced lifestyles.
Histone deacetylases (HDAC) are a class of enzymes that regulate gene expression of somatic cell in an epigenetic layer, meaning that while HDAC is overexpressed in some tumors, it is closely correlated with oncogenic factors (Poljakova et al., 2011; Bajbouj et al., 2012; Cheng et al., 2012). However, trichostatin A (TSA), an antifungal antibiotic produced by Streptomyces hygroscopicus with cytostatic and differentiating properties, also a potent and specific inhibitor of HDAC, could increase histone acetylation and active gene expression in somatic cells (Ben Sahra et al., 2008; Cantrell et al., 2010; Kim et al., 2010; Wallace et al., 2010; Cooney, 2011; Dong et al., 2011; Janjetovic et al., 2011; Poljakova et al., 2011; Rattan et al., 2011; Tan et al., 2011; Anh et al., 2012; Bajbouj et al., 2012; Cheng et al., 2012; Xiao et al., 2012; Yan et al., 2012; Zhang et al., 2012).
The purpose of the present study was to evaluate the antiproliferative meformin and HDAC inhibitor TSA in vitro in human osteosarcoma cell lines and to assess its synergistic antitumor effect.
Materials and Methods
Cell lines and its culture condition
Human osteosarcoma cell lines (MG-63, HOS, SaOS-2, and U20S) and murine osteosarcoma cell line LM8 were obtained from American Type Culture Collection (ATCC). Cells were cultured in a monolayer culture in RPMI-1640 (Hyclone) supplemented with 10% heat-inactivated fetal bovine serum (FBS; Hyclone), 100 U/mL penicillin, and 100 U/mL streptomycin. Cells were incubated in a humidified atmosphere incubator with 5% CO2 at 37°C. The cells maintained no more than 90% confluence or were routinely passaged every 2–3 days. Cells in the exponential growth phase were used in all the experiments.
Reagents and antibodies
Metformin, TSA and compound C (the AMPK inhibitor) were obtained from Sigma for cell proliferation and in vivo studies; a 10 mM solution of TSA in absolute ethanol was prepared and stored at −20°C until use. A stock solution of 2 mg/mL TSA in dimethyl sulfoxide (DMSO) was used for in vivo experiments. Cisplatin was obtained from the hospital pharmacy. Anti-β-actin, anti-P-AMPK, anti-AMPK, anti-P-AKT, anti-AKT, anti-p-p70S6K, anti-p70S6K, anti-p-mTOR, anti-mTOR, anti-Erk, anti-p-Erk, anti-4EBP1, anti-p-4EBP1, anti-Bcl-2, anti-Bax, anti-p21, anti-p27, anti-Cyclin D1, anti-Cyto C, and anti-caspase-3 were purchased from Cell Signaling Technology. Horseradish peroxidase-conjugated anti-rabbit IgG, anti-mouse IgG, and enhanced chemiluminescene (ECL) reagents were from Pharmacia-Amersham.
Cell viability detection using 3-(4, 5-dimethylthiazol-2-yl)-2, 5-diphenyltetrazolium bromide assay
Cell proliferation was measured using the 3-(4, 5-dimethylthiazol-2-yl)-2, 5-diphenyltetrazolium bromide (MTT) assay. The effects of different concentrations of metformin, TSA, and their combinations on the viability of MG-63, HOS, SaOS-2, U20S, and LM8 cells were determined by the MTT assay separately. Briefly, cells were seeded into 96-well plates at a density of 3.5×10³ cells/well (100 μL), and incubated for 24 h for sufficient attachment before drug treatment. Cells were grown in a 100 μL medium containing 2% FBS in 96-well plates at 37°C. After 24, 48, 72, or 96 h treatment with varying doses of single drug or combined therapy, we replaced the old medium with a fresh medium containing 1% FBS with or without drugs and incubated for another 24 h at 37°C. After treatments, media were discarded and cells were washed with phosphate-buffered saline (PBS) and incubated with MTT (5 mg/mL) in 100 μL fresh medium to each well, and the plates were incubated at 37°C for another 4 h. Then, the medium was discarded; 200 μL DMSO was added to dissolve MTT formazan crystals; and absorbance at 570 nm was measured using a 96-well format plate reader (BioTek). Wells containing only Dulbecco's Modified Eagle Medium and MTT were used as controls. Cell viability was determined based on the mitochondrial conversion of MTT to yellowish formazine, calculated as percentage of viable cells in total population. Each experiment was performed using six replicated wells for each drug concentration and carried out independently thrice.
Cell cycle analysis
Cells were seeded at 1×10⁵ cells per well in 12-well plates overnight and treated with the indicated treatment for 72 h. The adhered and floating cells were harvested by trypsinization, washed, and fixed in 70% ice-cold ethanol. The cell pellets were resuspended in a solution containing 50 μg/mL propidium iodide (PI), 0.1 mg/mL RNase A, and 0.1% Triton-X 100 in 3.8 mM sodium citrate buffer, and incubated at 37°C for 30 min. Four distinct phases are recognized in a cell population: the G1-, S-, G2-, and M-phase. Analysis and data acquisition were performed on fluorescence activated cell sorter FACScan XL using ModFit LT™ software (Becton Dickinson).
Annexin V staining for apoptosis detection
Apoptosis was detected using the Annexin V-fuorescein isothiocyanate (FITC) apoptosis kit (BD Bioscience) in accordance with the manufacturer's instructions. Briefly, 5×10⁵ cells were seeded and cultured in 10 cm dishes for 24 h. Cells treated for 48 h with metformin, TSA alone, or in combination were collected. Untreated cells were also collected as controls. The cells were resuspended in 500 μL of binding buffer, with 5 μL of Annexin V-FITC, and then, 5 μL of PI was added. The cells were then incubated at room temperature for 5 min in the dark and analyzed for Annexin V-FITC binding by flow cytometry (FACS) using a fluorescein isothiocyanate (FITC) signal detector (FL1) and a PI signal detector (FL2). The cells in the FITC-positive and PI-negative fraction were regarded as apoptotic cells. Each experiment was repeated thrice, and reproducible results were obtained.
Mitochondrial membrane potential assays
Mitochondria were selectively probed with potential sensitive MitoTracker Red CMXRos (Invitrogen). CMXRos exhibit time-dependent accumulation in mitochondria, indicated by a shift in its fluorescence emission from green to red. Mitochondrial depolarization is thus indicated by a decrease in the red/green fluorescence ratio. MG-63 and LM8 cells were harvested after a 24 h exposure to metformin, TSA alone, or in combination, and then centrifuged at 400 g for 5 min; the cell pellet was resuspended in 0.1 μM final concentrations of MitoTracker Red CMXRos dissolved in dimethyl sulfoxide for 20 min. The cells were then washed and resuspended in PBS, and then fixed with 4% paraformaldehyde (PFA) in PBS for 10 min at 4°C. After another wash in PBS, the cells on the microplate were read by a spectrophotometer. Mean and standard deviation is plotted for three replicates from each condition.
Clonogenic survival experiments
Cells (up to 500 per plate) were seeded into 6-cm dishes. After 6 h, they were treated with metformin, TSA alone, or in combination. One week later, colonies were fixed with methanol and stained with 1.25% Giemsa for counting. Cell survival was expressed in relation to the untreated control. Values are given as the mean of three independent experiments.
Quantitative polymerase chain reaction
MG-63 cells were seeded and cultured for 24 h, and treated with metformin, TSA, and its combination. After 24 h, cells were harvested, and total RNA was isolated using Trizol (Invitrogen Company). RNA was reverse transcribed using a first-strand cDNA synthesis kit from Tiangen Corp. Room temperature-polymerase chain reaction (PCR) was performed on an Applied Biosystems 7300 Real-time PCR system using SYBR Green incorporation following standard protocols. Ct values were calculated based on duplicates and normalized to the housekeeping gene cycA. Primers were β-actin-F (5′-AGC GCA AGT ACT CCG TGT G-3′), β-actin-R (5′-AAG CAA TGC TAT CAC CTC CC-3′); p21-F (5′-TGA GCC GCG ACT GTG ATG-3′), and p21-R (5′-GTC TCG GTG ACA AAG TCG AAG TT-3′); p27-F (5′-ACT GAG GCG GAG ACG AAG GT-3′) and p27-R (5′-CCT GAC AAG CCA CGC AGT AGA T-3′); Cyclin D1-F (5′-TGT TCG TGG CCT CTA AGA TGA AG-3′) and Cyclin D1-R (5′-AGG TTC CAC TTG AGC TTG TTC AC-3′); Bcl-2 forward (5′-CAT GTG TGT GGA GAG CGT CAA-3′) and Bcl-2 reverse (5′-GCC GGT TCA GGT ACT CAG TCA-3′); and Bax-F (5′-GCC CTT TTG CTT CAG GGT TT-3′) and Bax-R (5′-TCC AAT GTC CAG CCC ATG AT-3′).
Protein extraction and Western blotting
MG-63 cells were grown in 150-mm dishes in medium containing 10% FBS at 37°C. After 24 h, we replaced the old medium with fresh medium containing 1% FBS with or without drugs and incubated for another 24 h at 37°C. After treatments, cells were scraped, collected, and centrifuged to obtain the pellet. The cell pellets were washed twice in 20 mL ice-cold PBS. Each cell pellet was suspended in 400 μL ice-cold homogenization solution (50 mM Tris–HCl, pH 7.4, 320 mM sucrose, 0.1 mM phenylmethylsulfonyl fluoride, and 1 mM EDTA), transferred to a 1.5 mL eppendorf tube, and subject to sonication gently in a micro-ultrasonic cell disruptor (Kontes). The cell lysates were centrifuged at 12,000 rpm for 10 min at 4°C, and the supernatants were collected. Mitochondria and cytosolic fractions were separated according to the supplier's instructions (Pierce Biotechnology) to analyze the mitochondrial release of cytochrome c. The protein concentrations were measured using the Coomassie plus protein assay reagents (Pierce Biotechnology).
Protein concentrations were measured using a BCA assay. Protein samples (30 μg), diluted with sodium dodecyl sulfate sample buffer, were separated by 10% polyacrylamide gel electrophoresis, and followed by electroblotting on a polyvinylidene difuoride (PVDF) membrane. After blocking in 5% nonfat dry milk, the membrane was probed overnight at 4°C with the following primary antibodies: anti-β-actin, anti-P-AMPK, anti-AMPK, anti-P-AKT, anti-AKT, anti-p-p70S6K, anti-p70S6K, anti-p-mTOR, anti-mTOR, anti-Erk, anti-p-Erk, anti-4EBP1, anti-p-4EBP1, anti-Bcl-2, anti-Bax, anti-p21, anti-p27, anti-Cyclin D1, anti-Cyto, C, and anti-caspase-3 immunoreactivity was detected using antimouse or antirabbit IgG-conjugated peroxidase; then visualized with the ECL kit (Pierce) according to the manufacturer's instructions.
Cell-based enzyme-linked immunosorbent assay for AMPK activation
Cell-based enzyme-linked immunosorbent assay (ELISA) (Mijatovic et al., 2005) was used to detect the intracellular levels of active AMPK (phosphorylated form). Cells (1×10⁴ cells/well) were seeded into a 96-well flat-bottom plate; after 24 h of culture, they were treated with concentrations of metformin, TSA alone, or in combination; then, cells were fixed in 4% PFA; 1% H2O2 in PBS containing 0.1% Triton X-100 (PBST) was used to quench endogenous peroxidase; and unspecific binding sites of antibodies were blocked with 10% fetal calf serum. Primary rabbit polyclonal antibodies that were specific for mouse phospho-AMPK and secondary peroxidase-conjugated goat anti-rabbit IgG were separately undertaken at 37°C for 1 h in PBST. After incubation with the peroxidase substrate tetramethylbenzidine, the reaction was stopped with HCl. The absorbance of the cells on the microplate was measured by a spectrophotometer at 450 nm. The obtained absorbances were corrected for the cell number determined by crystal violet staining [details described in reference (Janjetovic et al., 2011)]. Mean and standard deviation is plotted for 3 replicates from each condition.
In vivo xenograft studies
Female BALB/c athymic nude mice (4–6 weeks old) were purchased from the Shanghai Laboratory Animal Center of the Chinese Academy Sciences. LM8 cells were grown, harvested, washed with PBS, and resuspended in sterile, serum-free PBS. Each mouse were injected subcutaneously (s.c.) into each posterior hind flank region with approximately 6.0×10⁶ LM8 cells, one site per mouse. Xenografts were allowed to grow, and treatment was started when the injected cell mass reached a mean volume of 130 mm3. After tumor formation, the mice were randomized into five groups (N=5 per group), and administered metformin (100 mg/kg/day, i.p.), TSA (500 μg/kg/day, i.p.), combination (100 mg/kg/day meformin plus 500 μg/kg/day TSA, i.p.) and cisplatin (5 mg/kg/day, i.p.), saline only in the case of the untreated control group. Tumor growth was monitored once a week. The length (Len) and the width (Wid) of the tumors were measured using a slide caliper, and the volume (V) of each tumor was calculated as follows: V=Len×Wid2/2. The mice were sacrificed, and the tumors were excised after 20 days of treatment. The mouse model was approved by the Institutional Animal Care and Use Committee, and animal care was in strict compliance with the institutional guidelines.
Statistical analysis
All data were indicated as the mean±standard deviation (SD) and were analyzed using Student's t-test. p<0.05 was considered statistically significant.
Result
Metformin and TSA inhibit the proliferation of osteosarcoma cells
Although metformin may affect the MTT assay independent of cell numbers, there is no perfect cell viability method for different doses of drugs on different cell lines' detection. Therefore, different controls should be strictly provided. To study the effects of metformin and TSA combination on osteosarcoma cell growth in vitro, we evaluated human osteosarcoma cell lines MG-63, as well as mouse osteosarcoma cell line LM8. First, cells were treated with various concentrations of metformin (2.5–20 mM) for 24, 48, 72, and 96 h or TSA (0.1–0.6 μM), and cell viability was assessed by MTT assay. Results show that metformin or TSA inhibited the growth of these four osteosarcoma cell lines MG-63 and LM8 in a dose-dependent manner (Fig. 1A, B). To analyze the growth-inhibitory effects of combining metformin with TSA, MG-63, HOS, SaOS-2, U20S, and LM8 cells were treated with drugs alone or in combination for 48 h and then examined by the MTT method. The combination of these two drugs (10 mM metformin and 0.3 μM TSA) significantly inhibited cell growth compared with drugs used alone (p<0.05, Fig. 1C, D).
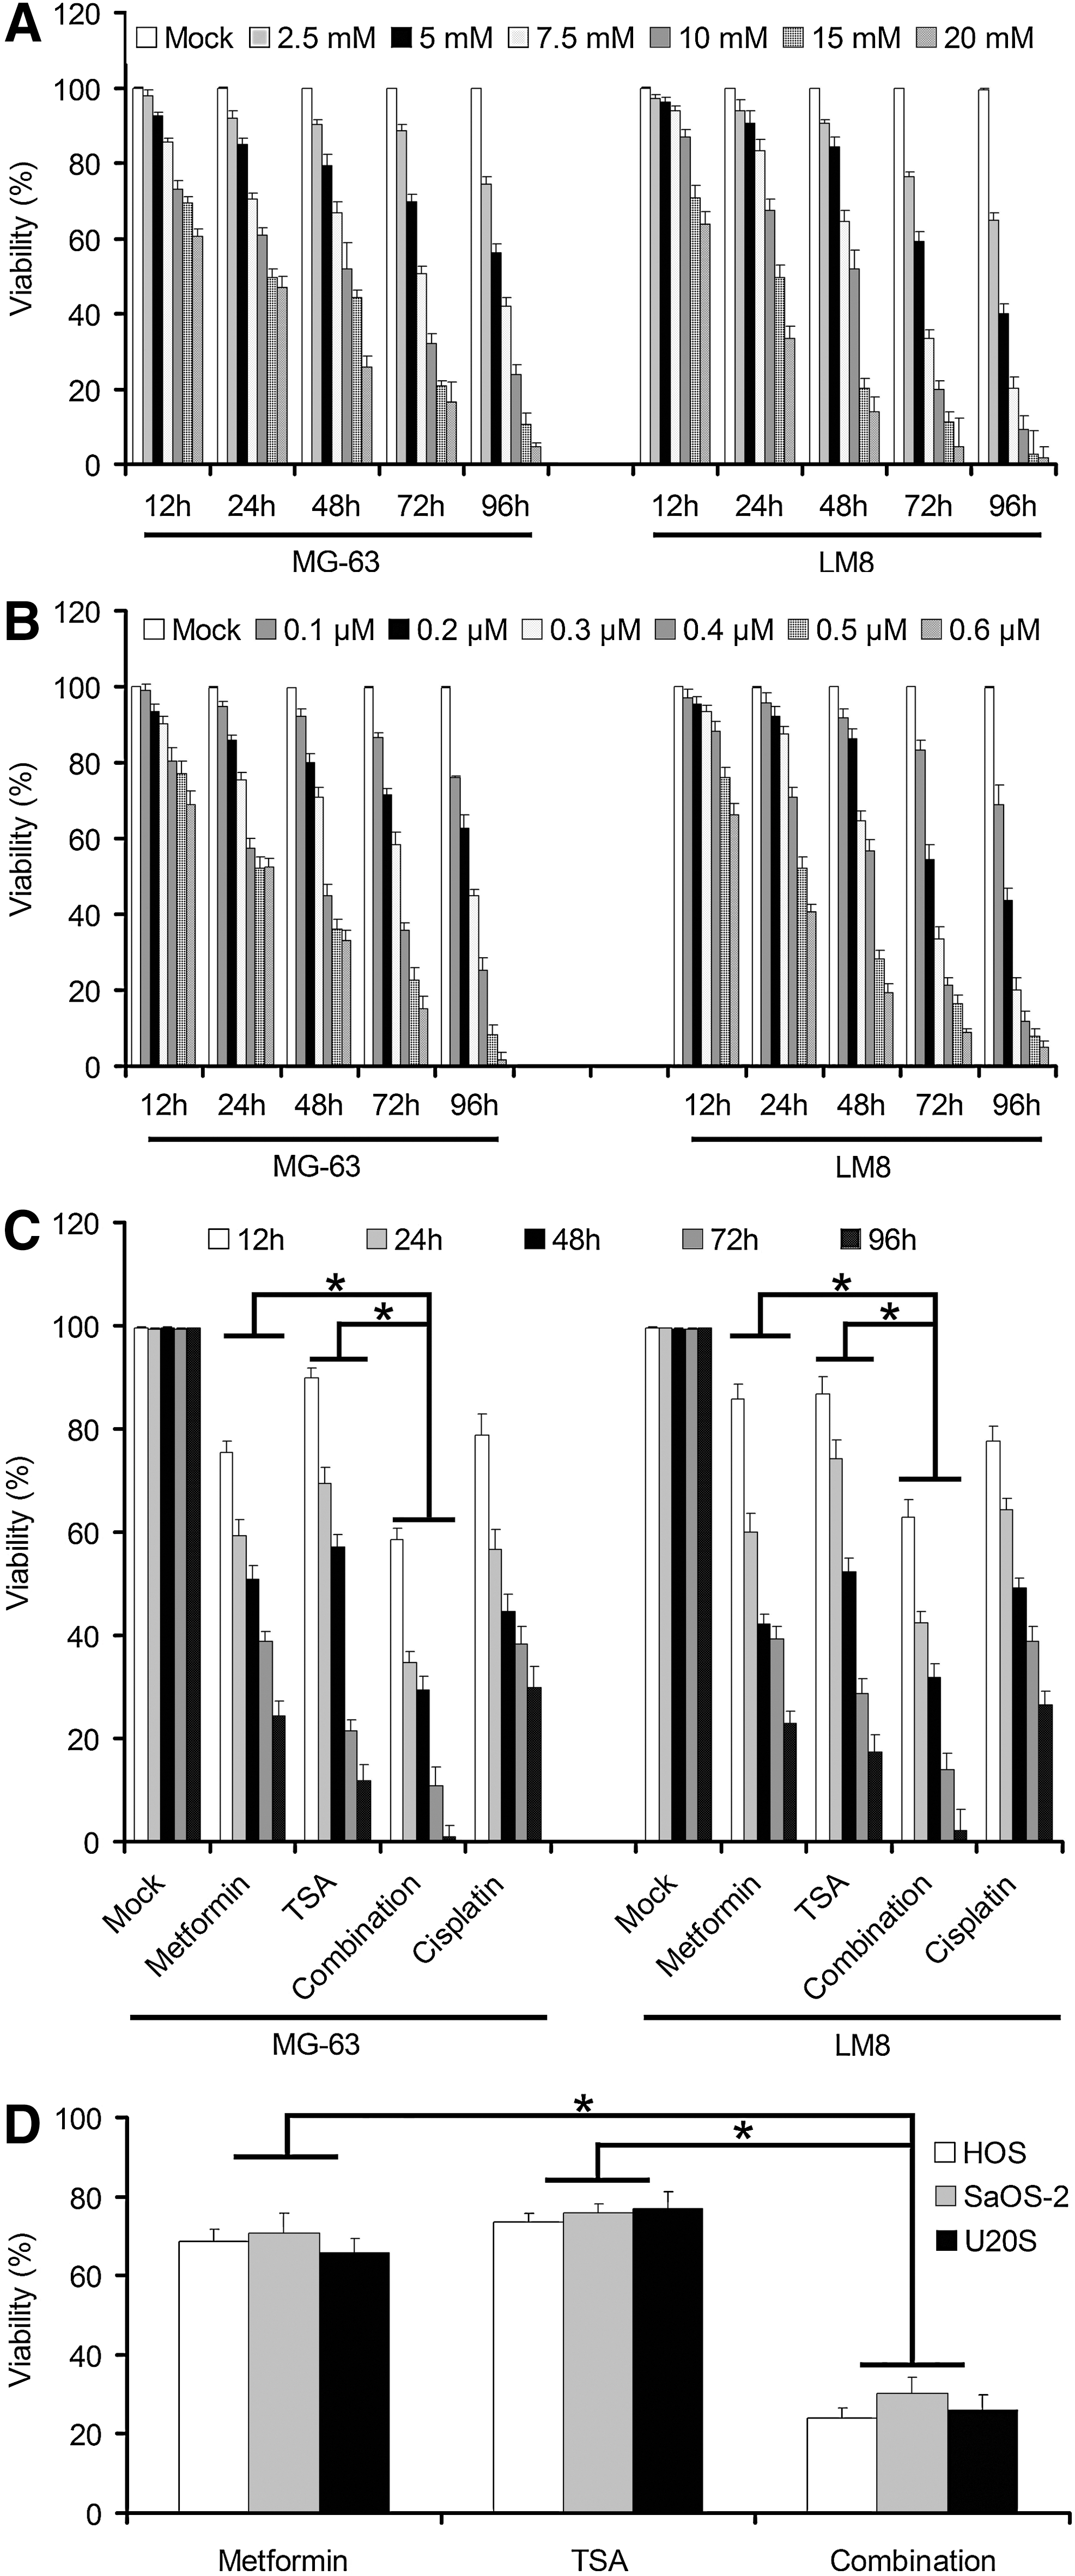
Viability of metformin and trichostatin A (TSA) on osteosarcoma cells.
Drug interaction results to determine the method of gold standard (Chou, 2006) are as follows: In the linear region of the dose-response curve, using the following formula to calculate the value of q: q=two drugs inhibit the rate/two single drugs are expected to inhibit rate=EA+/EA+(1- EA), x EB, q>1.15, and two-drug synergy. The experimental results to calculate the value of q: q24h=1.21, q48h=1.26. Therefore, metformin combined with TSA synergistically inhibit osteosarcoma cells' growth.
Metformin and TSA induce G0/G1 phase arrest and apoptosis in osteosarcoma cells
MTT assays showed that a combination of metformin and TSA could synergistically inhibit osteosarcoma cells' proliferation; therefore, it would be interesting to know the mechanisms underlying this effect on osteosarcoma cells. First, the effects of this treatment combination on cell cycle kinetics were examined using flow cytometry. As shown in Figure 2A, combination treatment of 10 mM metformin and 0.3 μM TSA induced a significant accumulation of cells in the sub-G1 phase when compared with the control or drugs used alone (p<0.05). To evaluate the induction of apoptosis by this combination, cells were treated with metformin and TSA alone or in combination and then examined by Annexin V/PI staining followed by flow cytometry; metformin and TSA combination elicited significant apoptosis compared with drugs used alone (p<0.05, Fig. 2B). Moreover, to examine the mitochondrial membrane potential under combination treatment, we used a mitochondrial membrane potential assay to examine the effect of drug combination indicated by the decrease in the fluorescence intensity of CMXRos. Our data from three independent experiments have shown that a combination of metformin and TSA treatment triggered mitochondrial membrane depolarization in osteosarcoma cells (Fig. 2C, F).

Cell cycle, apoptotic rate, and mitochondria potential of osteosarcoma cells.
Combination suppresses soft agar growth, induces DNA fragmentation, and modulates related gene expression in MG-63 or LM8 cells
To determine whether drug combination inhibits tumor cell clone formation, we performed a soft-agar colony formation assay. We found that the combination decreased the number of the colonies (Fig. 3A). Moreover, Figure 3B demonstrated that genomic DNA isolated from MG-63 cells treated with this combination was significantly fragmented in the laddered pattern compared with drugs used alone. The treatment of combination decreased the expression of Bcl-2, Cyclin D1 and increased the expression of Bax, p21, and p27 in MG-63 osteosarcoma cells by real-time PCR analysis (Fig. 3C). Moreover, from the Western blot analysis (Fig. 3D), in the downstream of apoptosis signaling pathways, there is a significant cleavage activation of caspase-3. Besides, the combination induced the release of cytochrome c from mitochondria to cytosol of MG-63 cells (Fig. 3D). The results confirmed that a combination of metformin and TSA induces apoptosis of osteosarcoma cells in vitro.
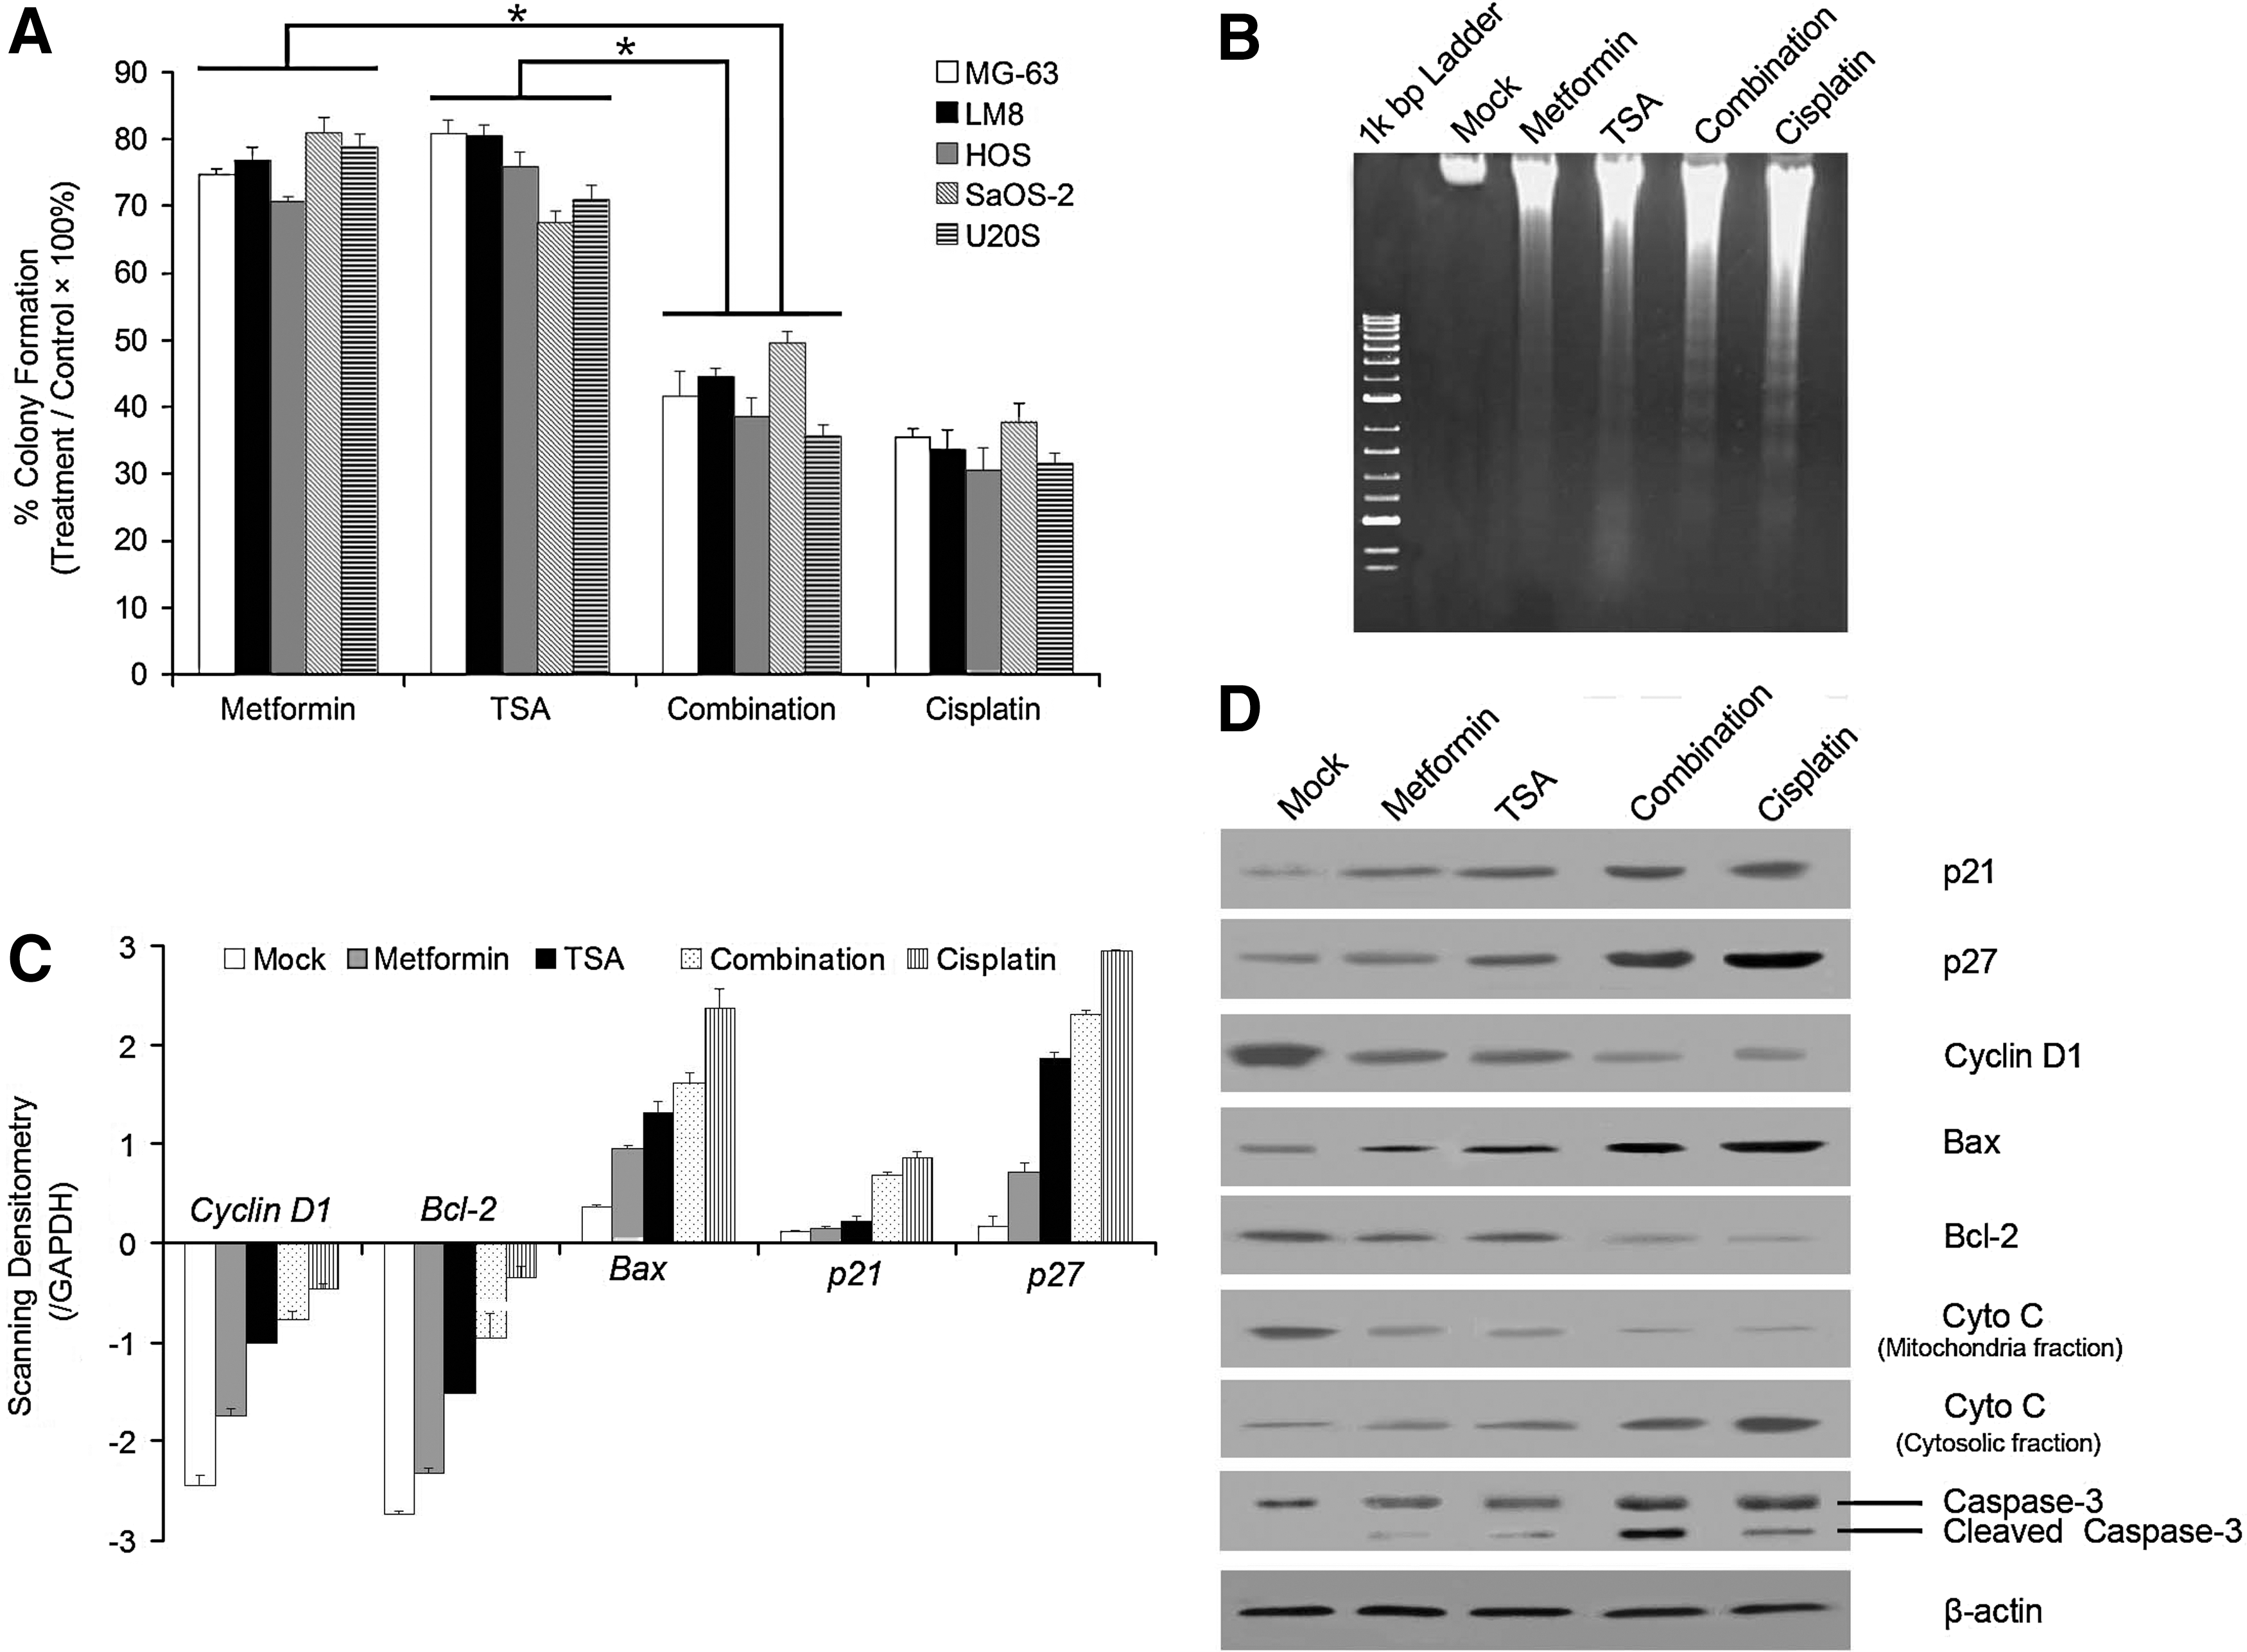
Soft agar colony formation analysis, DNA fragmentation, and expression of cell cycle and apoptosis-related genes in MG-63 or LM8 cells after different treatment for 48 h.
Combination suppresses osteosarcoma cells growth via AMPK-independent signaling pathway
AMPK signaling pathway is the main intracellular target of metformin; therefore, we assessed the fact that the anti-osteosarcoma effect of drug combination could be mediated by AMPK activation. Cell-based ELISA showed a significant increase in AMPK phosphorylation after 12 and 24 h of exposure of MG-63 cells to drugs used alone or in combination (Fig. 4A). In order to determine whether the anti-osteosarcoma effect of combination is mediated by the AMPK pathway, compound C (AMPK inhibitor) was used to block the AMPK signaling pathway. MTT assay revealed that compound C (5 μM) did not rescue MG-63 osteosarcoma cells from drug combination (Fig. 4B), although it could suppress metformin-induced AMPK activation efficiently (data not shown). Therefore, AMPK activation is not necessary for inducing osteosarcoma cell apoptosis of metformin and TSA combination. Western blotting was used to assess the effect of drug combination on the phosphorylation status of AKT, ERK, AMPK, mTOR, p70S6K, and 4EBP1. Increased phosphorylation of AMPK along with decreased phosphorylation of mTOR, P70S6K, and 4EBP1 was observed. Moreover, phosphorylation of Akt and Erk expression was also significantly inhibited after cells had been treated with drugs (Fig. 4C). These results demonstrate that metformin inhibited the proliferation of osteosarcoma cells via an AMPK-independent pathway.
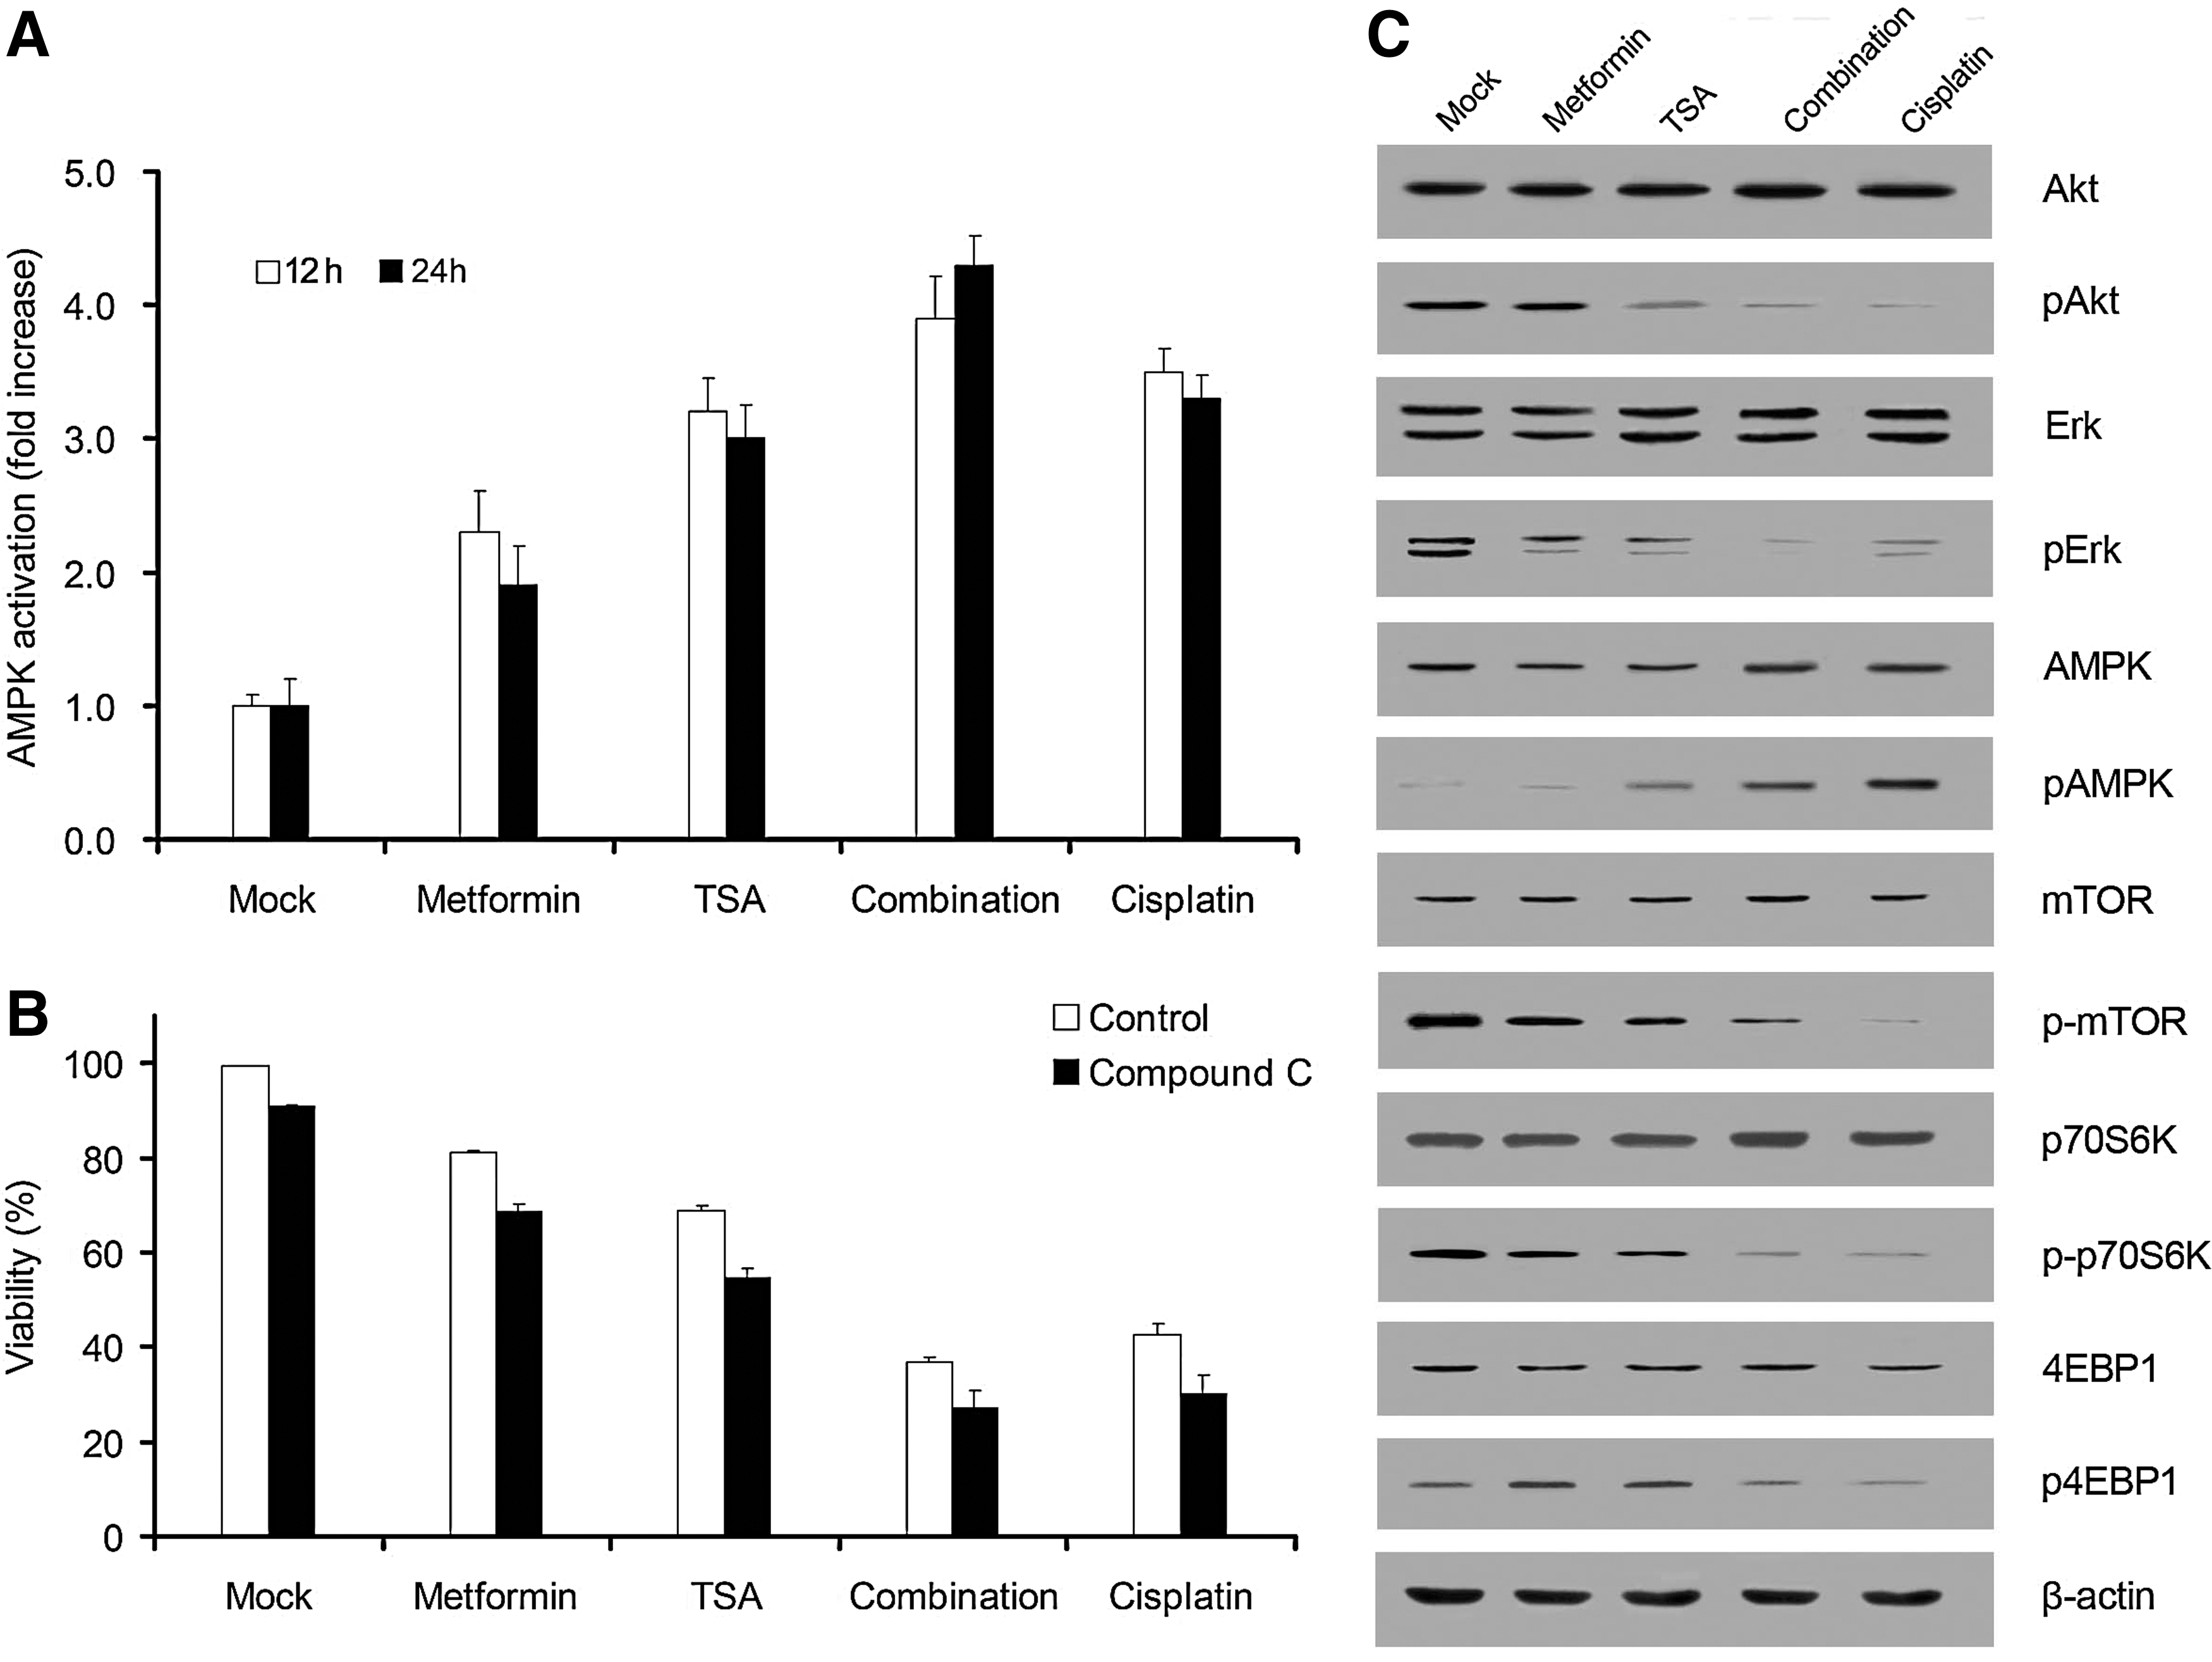
Anti-osteosarcoma effect on combination of metformin and TSA via 5′-adenosine monophosphate-activated protein kinase (AMPK)-independent manner.
Combination suppresses in vivo tumor proliferation
In order to determine whether the combination could suppress tumor growth, the synergistic effect of combination on tumor growth inhibition was done in vivo via an intraperitoneal injection. The present study has shown that osteosarcoma cell growth was inhibited in the combination group. Tumor weight (Fig. 5A) and volume (Fig. 5B) in the combination group was significantly decreased compared with the group of the drug used alone (p<0.05).
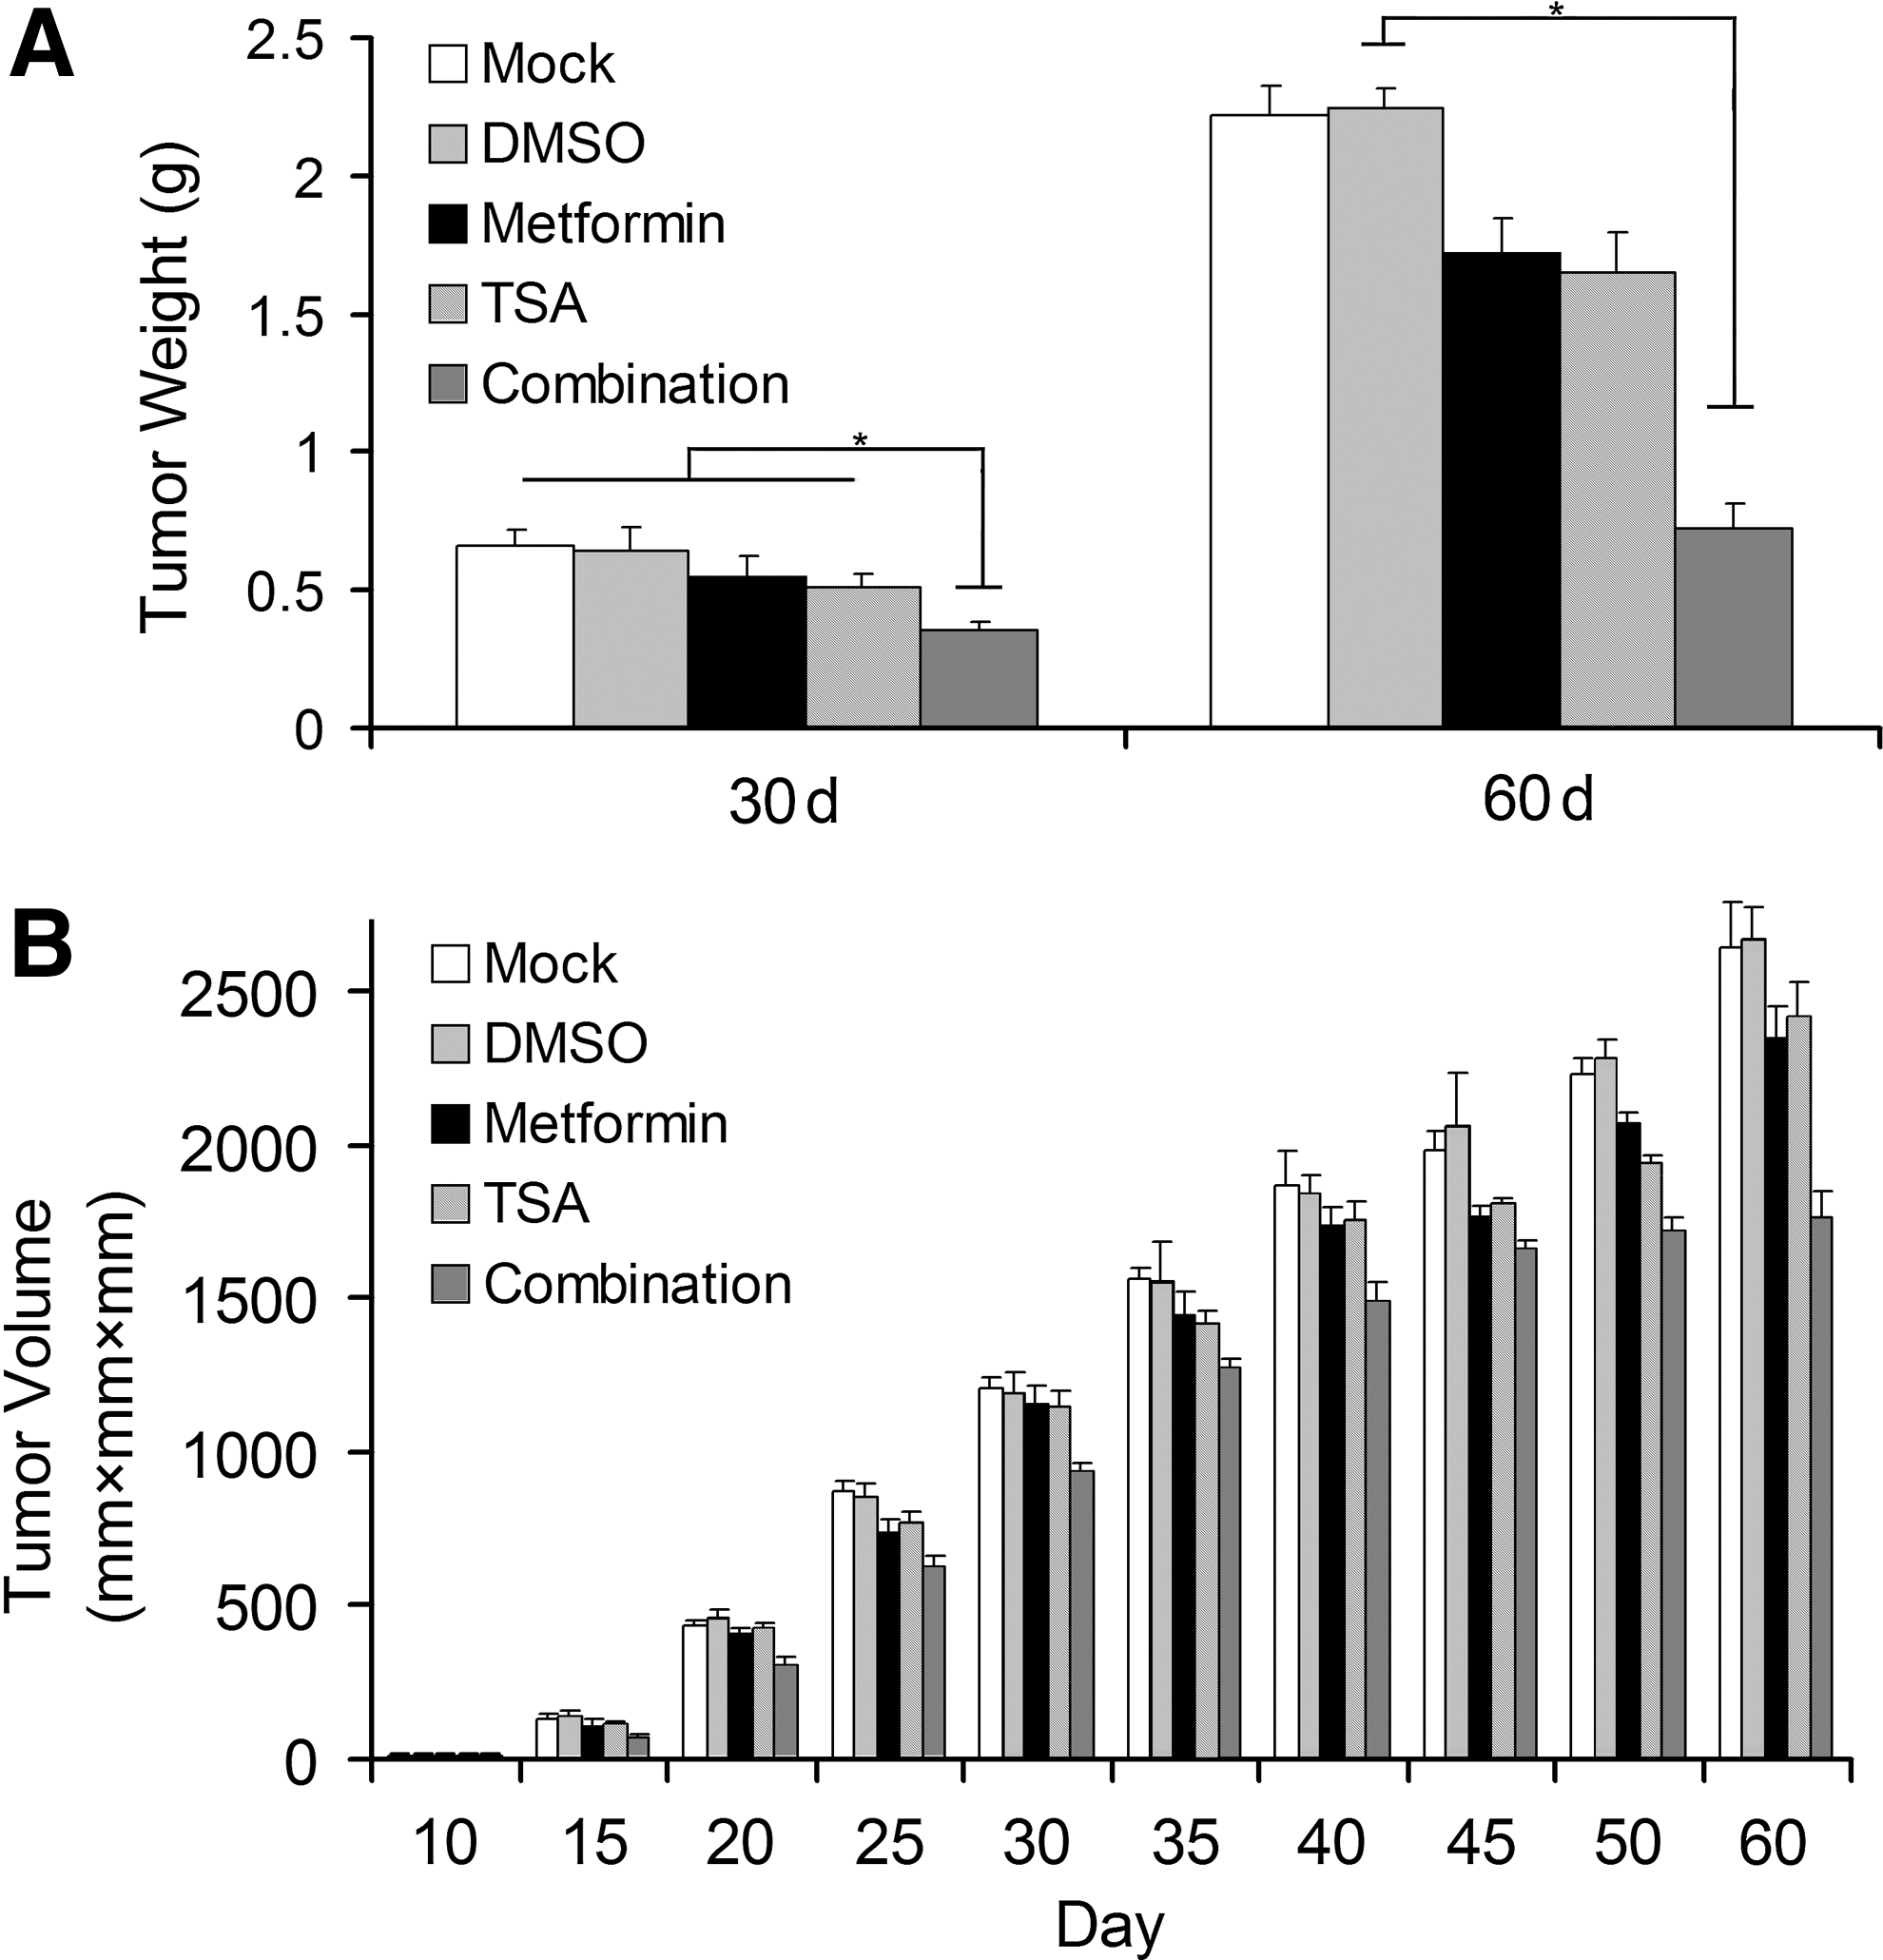
Osteosarcoma model (BALB/c athymic nude mice were used as osteosarcoma cells LM8-bearing mice) and its therapy.
Conclusion
Metformin is widely used for type II diabetes treatment; it has been used not only for a long period, but also with less toxicity and is relatively cheap. A recent report showed that metformin could inhibit the proliferation of cancer cells in vitro (Tomic et al., 2011; Ashinuma et al., 2012; Chen et al., 2012; Qu et al., 2012). This means that TSA also has been shown to induce apoptosis in many cancer cells at submicromolar concentrations with very low toxicity toward normal cells (Dong et al., 2011; Poljakova et al., 2011; Anh et al., 2012; Bajbouj et al., 2012; Cheng et al., 2012). Although TSA has been reported to inhibit cell growth and induce apoptosis of various cancer cells (Kim et al., 2010; Dong et al., 2011; Tan et al., 2011; Yan et al., 2012; Zhang et al., 2012), its effect on osteosarcoma cells is rarely investigated. Furthermore, this anti-tumor effect is still limited compared with other anti-cancer drugs. According to our present research, we have confirmed that metformin and TSA combination could synergistically inhibit osteosarcoma cell proliferation.
The present study demonstrates that antidiabetic drug metformin combined with TSA exerts potent anti-osteosarcoma effects both in vitro and in vivo. The combination blocked the proliferation of osteosarcoma cells in G2/M phase of the cell cycle and caused apoptosis associated with Bcl-2 and Bax modulation as well as caspase 3 and cytochrome C, mitochondrial depolarization but in an AMPK-independent manner. Moreover, our results clearly showed that an i.p administration of metformin and TSA combination decreased tumor growth.
In summary, the combined use of metformin and TSA can cooperatively enhance the inhibition of osteosarcoma cell proliferation. Our findings show that this approach effectively suppresses the growth and induces the apoptosis of osteosarcoma cells in vivo and in vitro.
Footnotes
Disclosure Statement
The authors have no commercial, proprietary, or financial interest in the products or companies described in this article.