




Abstract
Malignant transformation is likely to render cells hyperploid, primarily tetraploid. We have measured the frequency of division into three rather than two daughter cells as a function of ploidy. Such trivisions were followed in near-tetraploid uveal melanoma (UM), hypotetraploid HaCaT (<4 N), hypertriploid HeLa (>3 N), and in near-diploid (∼2 N) lung epithelial cell lines by time-lapse image analyses. A stepwise analysis of cytokinesis revealed higher frequency of cell trivisions relative to divisions in hyperploid HeLa (1:24, 4%), HaCaT (1:126, 8%), and UM (1:186, 0.5%) cells. The occurrence of trivision was significantly lower in near-diploid endothelial cells (1:1400, 0.07%). We have previously observed the phenomenon of trivision in HaCaT cells treated with heavy metal lead, and here we describe that trivision is a spontaneous process taking place without genotoxic treatment. Beside re-diploidization by trivision, the hyperploid state decreases the cell size of the daughter cells and is likely to increase the time of cytokinesis. On the basis of the results, it is hypothesized that among other cancer-related causes, hyperploidy could be related to cell trivision, could cause random aneuploidy, and could generate new cancer-specific karyotypes.
Introduction
During malignant transformation, cells escape the disrupted primary tumor (Banfalvi, 2012a, 2012b), increase their ploidy, and become polyploid, mostly tetraploid (Castedo et al., 2011). Genomic constrains of the mitotic machinary generated by the increased number of chromosomes in near-tetraploid cells affect genome stability (Storchova et al., 2006; Storchova, and Kuffer, 2008) and are likely to activate DNA repair (Storchova and Pellman, 2004; Fujiwara et al., 2005). Near tetraploidy is thought to be a metastable state between normal euploidy and cancer-associated aneuploidy that cells try to avoid by losing chromosomes and returning to diploidy but resulting in a near-diploid, aneuploid state (Storchova and Pellman, 2004; Fujiwara et al., 2005; Margolis, 2005). This article supports the notion that cancer cells try to avoid metastable hypertriploid and hypotetraploid state by trivision. Long-term scanning microscopy revealed that these cells produce three rather than two smaller than average daughter cells, a phenomenon named cell trivision.
Materials and Methods
Chemicals and cell cultures
HaCaT cells
In vitro spontaneously immortalized aneuploid (hypotetraploid) keratinocytes were derived from histologically normal skin of a Caucasian male (Boukamp et al., 1988; Boukamp et al., 1997).
UM cell line
The human choroidal melanoma cell line OCM-1 cell line was obtained from the Research Center of Molecular Medicine, University of Debrecen, described as an aneuploid, near-tetraploid cell line (Kemeny-Beke et al., 2006). The UM, OCM-1 cell line is near tetraploid and aneuploid due to loss of chromosome 6 (Luyten et al., 1996).
HeLa cell line (ATCC CCL-2)
This adherent immortal hypertriploid epithelial cell line has been isolated from cervical adenocarcinoma (Scherer et al., 1953; Chen, 1988).
Diploid bovine pulmonary endothelial cell culture (ATCC CCL 209)
It was obtained from the American Tissue Culture Collection (Rockwille, MD) (Del Vecchio and Smith, 1981; Bolin et al., 1994).
Cells were grown in Dulbecco's-modified Eagle's medium (DMEM; Sigma-Aldrich, Budapest, Hungary) supplemented with 2 mM L-glutamine, 23 mM sodium bicarbonate, antibiotics (100 IU/mL penicillin and 100 μg/mL streptomycin) to avoid infection during long-term incubation and 10% heat-inactivated fetal bovine serum (FBS).
Measurement of cell trivision
Density of cell cultures
HaCaT hypotetraploid, UM (OCM-1) near-tetraploid and aneuploid, HeLa hypertryploid, aneuploid, and diploid bovine pulmonary endothelial cells were grown from 30–40% to full confluency.
Time of cell division and trivision
It was measured in HaCaT, UM, and in HeLa cell cultures. The last frame of photography showing the attachment of cells to be trivided was taken as start, and the reattachment of its daughter cells was taken as finish.
Calculation of cell volume
The volume and diameter of the cells were computed from the data of the time-lapse microscopy by measuring the diameters of the detached round cells before and after cell division and trivision. The diameters were calculated from the pixel size of the photography of cells. The radius of the cell was plugged into the formula, to get the volume of a sphere. Cell number, volume, and diameter of cell cultures were monitored with a Coulter channelizer (Beckman Coulter, Budapest, Hungary).
Frequency of trivision
It was calculated by dividing the number of trivisions by the number of divisions found during the time-lapse scanning (TLS) of HaCaT, UM, HeLa, and pulmonary endothelial cells.
Time-lapse cinemicroscopy
The system of TLS microscopy consists of: (1) Incubator: A SANYO MCO18-AIC CO2 incubator was used with a back side instrument port. Its chamber was modified to host two microscopes. (2) Microscopes: Microscopes were built using the frames of Olympus Tokyo upright microscopes. These were modified for inverted usage as revolver turrets were transferred to the place of the original illumination. CCD camera boards were placed under turrets, using Olympus Tokyo monocular adapter lower parts as housing. Specimen tables were kept in place, and only the slide orientation mechanisms were removed. Ocular sockets were used for illuminators. (3) Illumination: Diodes emitting light at 940 nm light (LED) with 5 mm diameters were applied for illumination to reduce phototoxicity. The longer wavelength offers a deeper penetration of approximately 3 mm thickness and less light dispersion through the culture medium and the wall of the T-flask. The 940 nm wavelength turned out to be an acceptable compromise to avoid phototoxicity and to maintain sufficient resolution power. The theoretical limit of resolution under our conditions at 1.25 numerical aperture is 1.88 nm based on the Abbe equation. Operational parameters were 1.2 V and 50 mA. The LED was driven by 5 V using a serial 82 Ohm resistor. To secure the reproducibility of the setup, an original 5 mm spherical LED head was used as a condenser. Illuminators were centered and fixed with glue in the microscope ocular tubes. The distance between the upper surface of the T-25 culture flask and the spherical ballhead of the LED was 120 mm. The most important compromise made in illumination was the minimization of heat and phototoxicity to avoid artificial transitions among different morphological forms and to sacrifice as little resolution as possible to prevent the blurring of images. Further reduction of phototoxicity was achieved by operating the spectrally near-infrared light emitting diodes and synchronization with image acquisition periods. (4) Microscope objectives: Carl Zeiss plan achromatic objectives were used with 10×magnification, and the condenser numerical aperture was set to 0.25. Low magnification was selected to operate the microscope under a broad field of view. (5) Cameras: Custom-modified two megapixel UVC camera boards with USB 2.0 connection served image detection. Modification included the removal of camera housing, removal of objectives and infrared-cut filters. Status indicator LEDs and attached resistors were desoldered, and driver circuit terminals were elongated with wires for near-infrared illumination. (6) Photography and visualization: Cell cultures in T flasks were placed on inverse microscopes, and photographs of cells were taken every minute. The screen of the computer was divided in two portions showing side by side the morphological changes of different cells. Individual cells were selected for further analysis.
Time-lapse photography of individual cells allowed us to determine the growth profile, described earlier for the analysis of cell death in mammalian and fungal cells (Nagy et al., 2012), and to follow the movement of individual cells (Banfalvi et al., 2012). The homepages of videofilms showing the growth and mobility of different cells are given under the legend of Figure 1.

Cell trivision in mammalian cell cultures screened by time-lapse scanning microscopy.
Digital image processing
Data on individual cells in cultures were investigated separately. Frames of the photography were numbered, and the exact time of recording was given at the bottom of each frame (year/month/h/min). Analysis lasted as long as the time-lapse microscopy. Image processing was performed in three steps: (1) Image acquisition and frame averaging: Image acquisition took place every minute. For an increased signal/noise ratio, 10 frames of images (1600×1200 pixels resolution @ 24-bit RGB) were collected within a 3 s interval, and these images were averaged, instead of using high camera light gain settings. Images were saved on hard disk in bitmap format with a file name indicating the time and frame number. Pixel size and scaling were calculated from calibration photos of the Bürker-chamber. (2) Image processing: Numbered image sequences were transferred to a custom-built computer (Biological Image Processing Station) running as a barebone Windows 7 operating system. Image processing was done by ImageJ software bundle, using custom-developed plugins and macros. Image sequences were first deflickered using a sequence stack histogram to avoid transient brightness changes between separate frames. Every sequence contains an empty frame at the beginning and at the end representing the field of view without specimen as a reference image for background. The averaging of these frames resulted in a background image representing the error caused by uneven illumination (bulb-effect), slight differences of CCD sensor manufacturing, or dust particles in the lightpath. This background image was subjected to a Gaussian blur effect at sigma (radius)=2 to soften the image and eliminate noise. The Gaussian smoothing resulted in an inverted image that extracted from each frame of the sequence the background artifacts and preserved boundaries and edges. After the lightpath background extraction, the image sequence was histogram equalized based on stack (sequence) histogram at 0.4% of the pixels saturated to improve the contrast of images. This plugin built into ImageJ revealed the specimen background, originating from the surface while finishing differences of the culture flask bottom and from the aggregates of the medium. The background was eliminated in two steps: a fast Fourier transform bandpass filtering (to exclude large structures down to 40 pixels and filtering small structures of approximately 3 pixels) and a background extraction process (using a rolling ball at radius 50 px). The RGB channels of the 24-bit bitmap images were then merged (10% blue, 40% green, and 50% red) to create an 8-bit grayscale image. (3) Thresholding: Image sequences derived by image processing were thresholded. Thresholding was done by using a stack histogram. The consequent binary image sequence was carefully overviewed, and nonflickering particles with solid outline were selected for analysis avoiding overlaps. Analysis was done by measurement of the thresholded areas of particles in subsequent frames. The image sequences were digitally processed using image enhancement algorithms available as plugins of the Java language-based NIH ImageJ (FiJi) open-source software bundle. Image analysis and quantification were done in the same software environment. In experiments, emphasis was placed on high-time resolution time-lapse videomicroscopy to eliminate major differences among the growths of different cells.
Prevention of artificial morphological transitions
Several precautions and measures were taken to avoid artificial morphological transitions and to get reproducible results. Cell cultures were grown at 37°C in a humidified atmosphere of 5% CO2 in RPMI 1640 medium supplemented with 10% FBS. The pH during time-lapse microscopy was kept constant by a pump constantly replacing the old medium with fresh one. Preculturing took place under the same conditions as culturing to prevent temperature-induced changes. Complete sedimentation of cells was necessary and allowed for 10 min before the selection of individual cells and starting the time-lapse image analysis. During time-lapse microscopy, the T flasks of cell cultures remained untouched, the door of the incubator was opened as rarely and for as short a time as possible. The computer was connected to the Internet and used as remote access tele-microscopy. ImageJ program was used for the analysis to adjust contrasting and correct geometric distortion. Further adjustments involved gray-scale intensity range thresholding and image segmentation to improve image analysis. Finally, images were converted to video by speeding up the projection to 30 exposures per second.
Under these conditions, our standardized experimental setup was suitable to (i) provide and sustain near-physiological conditions, (ii) allow the photography of individual cancer cells, (iii) follow the cell growth minute by minute at low phototoxicity in the absence of chemicals or fluorescent dyes, and (iv) measure the exact time of cell division and trivision.
Results
A single irregular cell division termed trivision was first seen by long-term scanning microscopy on Pb treatment of K562 human erythroleukemia cells (Banfalvi et al., 2012). However, it was not known whether this trivision was caused by the Pb treatment or could have occurred without genotoxic treatment. As such, unusual divisions termed cell trivisions have not been followed earlier by time-lapse microscopy, and we have screened different hypertriploid cell cultures and compared the frequency of trivisions with that of near-diploid cells.
Trivision of HaCaT cells
Cell trivision was confirmed in untreated HaCaT cells (Fig. 1A). Double trivision that occurs even less frequently was also captured in an HaCaT cell culture subjected to long-term microscopy (Fig. 1B). Cell # 2 in Figure 1B started to round up before the trivision would have begun after its mitotic detachment. Before the trivided daughter cells (2a, 2b, 2c in Fig. 1B) returned to the monolayer, cell # 1 also started to trivide (1a, 1b, 1c in Fig. 1B). At the end of the two trivisions, the six daughter cells settled down. This experiment suggested that (i) trivision takes place without genotoxic treatment, (ii) trivided cells settle down with no visble sign of instability.
Geometry of hyperdiploid nuclear material in UM cells
Tripolarization of the nuclear material before trivision was a characteristic morphological indicator of triploidization in near-tetraploid melanoma cells. The detachment from the monolayer of the melanoma cell to be trivided (Fig. 1C) started with the rounding up and the appearance of a trifurcation in the middle of the cell (Fig. 1D). Tripolarization pointed to the formation of the three daughter cells (Fig. 1D/l). The progression of trivision is shown by the numbers expressed in minutes at the bottom of each frame of the photographies. The whole process from the detachment to the trivision of the melanoma cell took an average of 58 min (Fig. 1D, a–p). The cytokinesis itself lasted ∼10 min (Fig. 1D, l–p).
Trivision in HeLa and bovine pulmonary endothelial cells
Two important observations were made during the trivision of HeLa cells: (i) There was a reduction in the cell size of the trivided daughter cells; (ii) after separation, each daughter cell settled down, indicating the viability of trivided cells (Fig. 1E).
Cell trivision was preceded by the triploidization of the nuclear material seen as a three-pointed star in the bovine pulmonary endothelial cell to be trivided (Fig. 1F). It is probably not a coincidence that the nuclear material is arranged into a trigonal planar geometry in the endothelial cell corresponding to the most distant configuration in which the three angles are 120o. It was noticed repeatedly that after trivision the nuclear material was unequally distributed in the three daughter cells, with some of the nuclear material excluded from the trigonal arrangement (Fig. 1F, n–p). The V-shaped nuclear material is a characteristic feature of trivision.
Reduced size of trivided HaCaT and UM cells
During regular cell growth, the mother cells before division contained twice the volume of the daughter cells (Fig. 2A). The question we addressed by measuring cell diameters on detachment was how significant the reduction in cell volume was after trivision. By comparing the volumes of the daughter cells before and after regular division, the volumes of HaCaT cells dropped from an average of 15.1 to 7.7 nL. This corresponds to a ∼50% reduction of cell volume after division and to a near-equal distribution of the cellular material. In HaCaT cells, the average volume of daughter cells after trivision was only 32%, and in UM, only 43% that of the daughter cells after division, indicating a drastic trivisional loss of cellular material (Table 1). The volume and diameter of the cell cultures were measured by Coulter channelizer, and a calibration curve was plotted (Fig. 2B) to compare it with the cell size measured individually during time-lapse microscopy. There was no difference between the cell size after division measured by time-lapse microscopy and by the Coulter channelizer.

Reduction of cell size during cell division and trivision. , uveal melanoma cells ■
Measurements were carried out as described in the “Materials and Methods” section.
UM, uveal melanoma.
Duration and frequency of cell trivision
The optimization of measurements of length of cell cycle and cell division by time-lapse microscopy (Nagy et al., 2012) has shown that without the replacement of growth medium, the logaritmic cell growth could be maintained for about 60 h. The second cell cycle of HaCaT cells was more than an hour longer than the third one, indicating that in a freshly started culture at low confluency, cells need some time for adaptation. The third cell cycle between 50% and 60% confluency turned out to be optimal to determine the length of the cell cycle. The fourth cell cycle at confluency ≥70% could not be utilized for cell cycle analysis, as the entropy of the image content became increasingly high, with some of the divided cells at densely packed regions being unable to settle down and as a result, the frequency of cell death increased (Nagy et al., 2012). For the measurement of trivisions, time-lapse image analysis was started between 30% and 40% confluency under a constant supplement of fresh culture medium. HaCaT cells were cultured for 60 h. An average of six cell divisions were observed in the visual field of time-lapse microscopy. The average duration of cell division of HaCaT cells was 41 min (Table 2), and the estimated number of cell divisions during the 60 h time-lapse microscopy was ∼140. This number corresponds to the cell growth of HaCaT cells seen in Figure 3B and to the 135 cell divisions of uveal melanome cells (Fig. 3A).
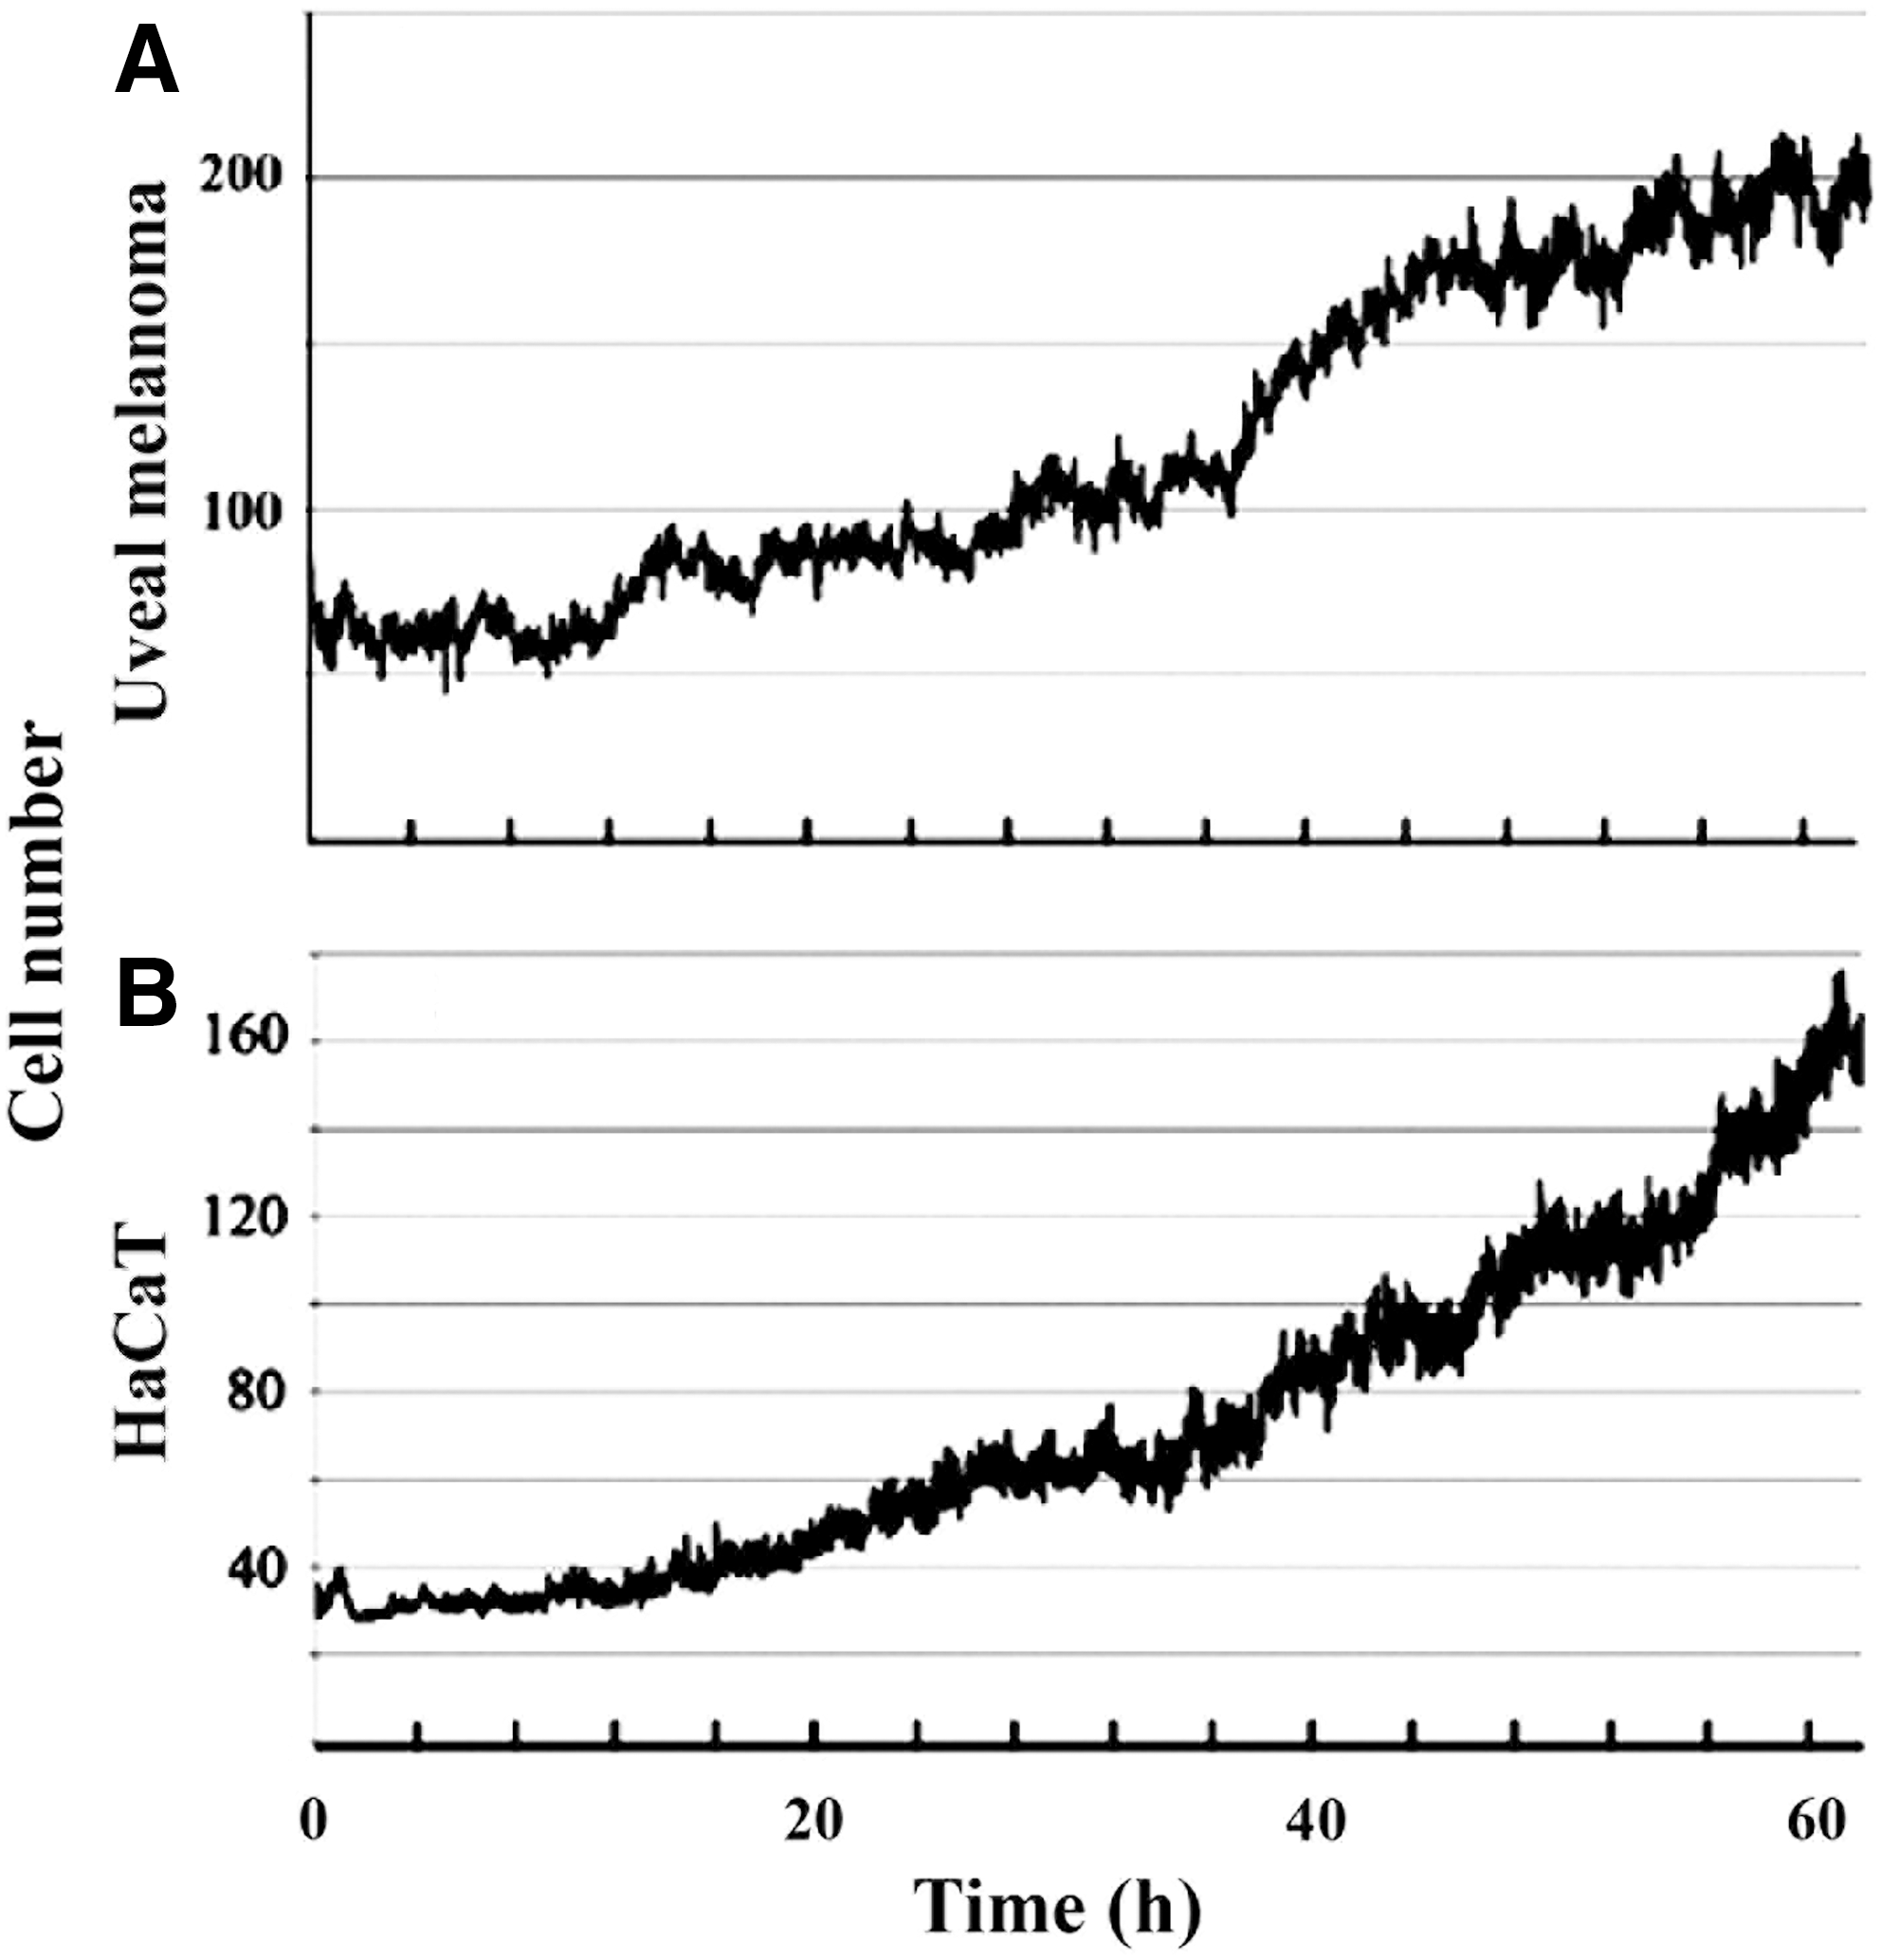
Cell growth during time-lapse image analysis.
Measurements were carried out as described in the “Materials and Methods” section.
TLP, time-lapse photography; n.d., not detected.
Time-lapse image analysis revealed that the duration from the detachment of the mother cell to the separation of daughter cells lasted significantly longer in the majority of the trivisions than those of cell divisions (Table 2). The trivision lasted ∼15 min longer than the cell division in HaCaT cells, and ∼40 min longer in UM cells. In HeLa cells, such a difference was not measured.
The ratio of trivisions/divisions was also expressed in percentages. Low frequency of trivision/division was found in the hypertriploid HeLa (4.2%), near-tetraploid UM (0.72%), and hypotetraploid HaCaT cells (0.79%) and very low frequency was seen in near-diploid endothelial cells (0.07%). Table 2 summarizes the duration and frequency data of divisions/trivisions with relatively large standard deviations. Although there is a tendency of trivisions lasting longer than divisions, the mean values are not significant, due to the mix from shorter (35 min) to longer (68 min) trivision time. Altogether 51 trivisions and 164 division were observed during the 153 time-lapse image analyses in the three hyperploid cell lines, only 1 trivision and ∼1400 divisions were found in near-diploid cells.
Spatial movement of trivided cells
The time of cinematography plotted against the number of divided cells is presented as a growth curve of UM (Fig. 3A) and HaCaT cells (Fig. 3B). Minor flutuations in cell number are related to the cellular movement of dividing cells at the periphery of the visual field of view.
The two-dimensional view of detached cells could not distinguish among the vivid cellular movements of the mother and the three daughter cells (Fig. 4A). Thus, the photographs of time-lapse imaging were processed to voxel polygons for a better orientation and three-dimensional (3D) visualization of cell trivision. In the voxel, block X and Y indicate the two-dimensional cellular movement with the third dimension representing time (Fig. 4B). The spatial distinction of cells is schematically viewed during trivision (Fig. 4C). The 3D view shows the movement of three daughter cells (Fig. 4C, 1a, 1b, 1c) over time and how the third cell (1c) is changing the direction of its movement in the polygonal voxel block.

Cellular movement during detachment of dividing cells.
Apoptosis of hyperdiploid cells
That trivided small daughter cells are likely to be viable has been demonstrated in HaCaT cells after double trivision (Fig. 1B, r–t) and in the HeLa cell culture (Fig. 1E, m–p). The pursuit of trivisions in 153 time-lapse image sequences resulted in 51 trivisions, but only one trivision ended in apoptosis. In the time-lapse image analysis of UM cells, one extremely large cell started to tripolarize, indicating the beginning of cell trivision (Fig. 5i, j), but turned to an apoptotic process characterized by (i) the gradual shrinkage of the cell (Fig. 5a–j), (ii) blebbing (Fig. 5k, l), and (iii) formation of apoptotic bodies (Fig. 5m–p). The extremely low frequency of tripolarization ending in death rather than in cell trivision could point to, but does not fully support, the notion of the viability of the trivided smaller cells.
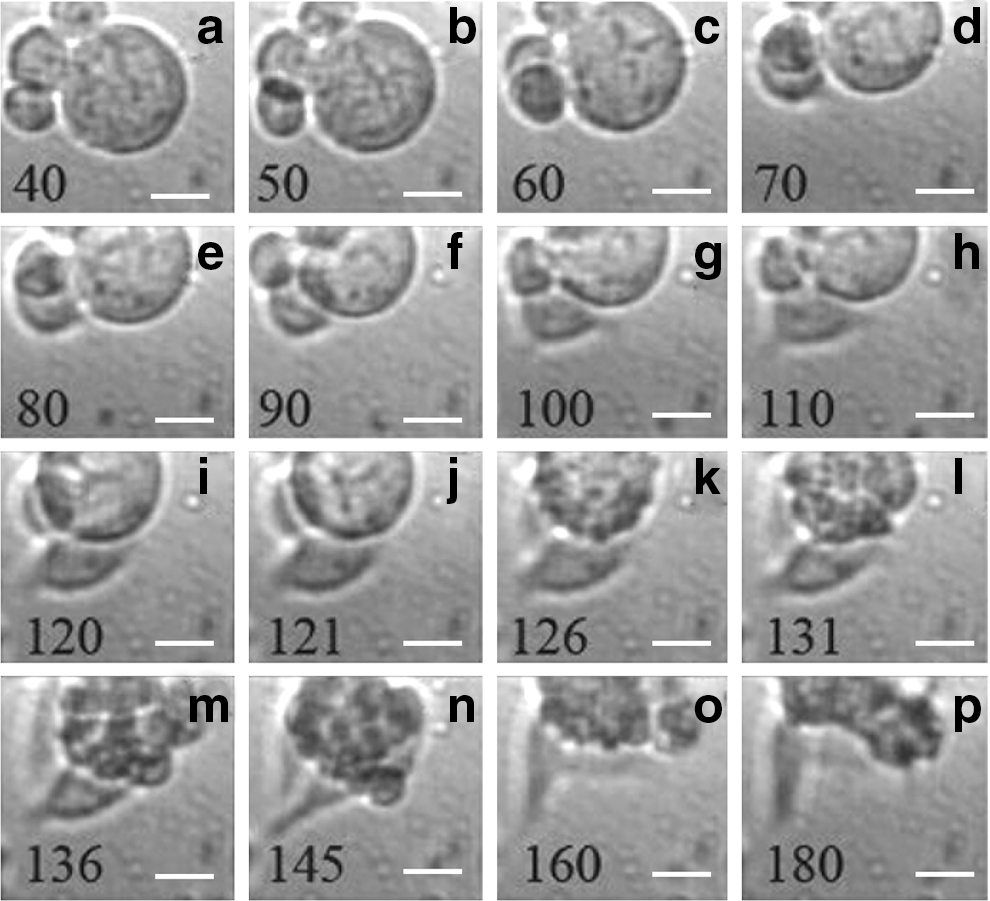
Tripolarization and apoptosis of a giant uveal melanoma cell.
Discussion
Most of the eukaryotic cells are diploid, with one set of chromosomes inherited from each parent. Polyploidy referring to the numerical change in the whole set of chromosomes was found more often in plant cells, but may occur in diploid animal cells, including human tissues (Parmacek and Epstein, 2009). Polyploidy can not only provide some metabolic benefit (Storchova and Pellman, 2004; Comai, 2005), but may also generate genetic instability. Polyploidy is more often found in less complex animals existing mainly as tetraploid, hexaploid, octaploid, and decaploid forms. In humans, the triploid syndrome is rare and is mainly due to polyspermy with low frequency of human pregnancies and miscarriages. Human tetraploidy was even less frequently diagnosed than triploidy. Aneuploidy that refers to the numerical change in a part of the chromosome set is more common. Cytokinesis failure, abnormal division, or mitotic slippage can cause aneuploid cancer through an unstable tetraploid intermediate (Ganem et al., 2007). As far as cytokinesis failures are concerned in yeast cells, the inactivation of the signaling pathway delayed the completion of cytokinesis (Norden et al., 2006). However, the generality of this finding remained controversial, as in other cells chromosome nondisjunction caused cytokinesis failure (Weaver et al., 2006). Other authors have found that cytokinesis could fail during chromosome nondisjunction and yield tetraploid rather than aneuploid cells (Shi and King, 2005). Ploidy changes during carcinogenesis have been registered (Olaharski et al., 2006). Cells possessing more than two centrosomes can undergo multipolar divisions and often result in highly aneuploid unviable cells (Holland and Cleveland, 2009). Failure to properly control centrosome number and function can lead to multipolar spindles, aneuploidy, disruption of cell polarity, and failure of asymmetric cell divisions (Heneen, 1970; Nigg, 2002). Pellmans group has found that multiple centrosomes in tumor cells create the potential for multipolar divisions that can lead to aneuploidy and cell death. The same authors proposed that the blocking of centrosome bundling may be an effective way to selectively kill cancer cells (Kwon et al., 2008). While higher aneuploidy after cell trivision is acknowledged, our results did not show signs of cell death, trivided cells seem to maintain their viability and could even cause small cell carcinogenesis. As an example for the reattachment and viability, the treatment of lung carcinoma cell lines with cisplatin, doxorubicin, and gemcitabine at the IC (50) dose is mentioned. Most of the attached lung cells were surviving, and the reattachment to the tissue culture plate acquired an enhanced malignant phenotype (Hsieh et al., 2012).
Related to cytokinesis, we have raised and answered several questions. Trivisions versus divisions affected only few a percentages of cells, nevertheless, they were higher in hypertriploid HeLa (1:24, 4%), in near-tetraploid UM (1:37, 3%) cells and somewhat lower in hypotetraploid HaCaT cells (1:126, 0.8%). Only a single cell trivision was observed in the 10 time-lapse image analyses carried out with the near-diploid human lung endothelial cells (∼1:1400, 0.07%). These observations caution against the conclusion that the trivision rates found in vitro would be necessarily similar to in vivo trivisions, particularly in cells close to the diploid state. Nevertheless, the tendency of hypertriploid, hyportetraploid, and near-tetraploid cells to return to diploidy resulting in an uneven distribution of nuclear material could indicate the aggravation of heterogeneous aneuploidy and malignancy of tumor cells. The cell volume of the rarely occurring trivisions cells being less than 50% that of divided cells could be another indication that trivision could contribute, but is probably not the major player in small cell carcinogenesis. The smaller cell size generated by trivision is not related to and did not increase the frequency of apoptosis. Cytokinesis failure manifested as trivision did neither cause cell death nor the loss of growth capacity.
These observations are in conformity with the findings of others. Although the immortal human HaCaT keratinocyte cell line is frequently used as a paradigm for in vitro skin keratinocytes due to its highly preserved differentiation capacity, the cause of aneuploidy in cell division was not known. HaCaT cells are able to revert back and forth between their differentiated and basal state; consequently, their growth varies widely (Hennings et al., 1980; Capone et al., 2000; Deyrieux and Wilson, 2007). The early appearance of unbalanced diploidy in HaCaT cells indicated disturbances in growth control and was thought to be responsible for its unlimited life span. The subsequent occurrence of the hypotetraploid HaCaT subclone (72–88 chromosomes) correlated with an improvement of growth capacity (Boukamp et al., 1988). Such a correlation between diploidy and cell growth was found earlier in human carcinoma cell lines (Tilgen et al., 1983). Mouse keratinocyte cell lines and a human keratocyte cell line with a karyotypical abnormality of trisomy of chromosome No. 8 further supported the notion that polyploidization could be crucial for autonomous growth in vitro (Fusenig et al., 1985). In Wilms tumor trisomic cells, the tripolar cell division led to cytokinesis failure and asymmetrical segregation of chromosomes into two daughter cells (Gisselsson et al., 2010) in conformity with our experiments showing that hypertrisomic cells divide into two rather than three cells.
Anomalous versus normal cell division can lead to cell death or cancerous state involving several steps depicted in Figure 6. The path from normal mitosis and cell division (Fig. 6a) to cancerous trivision may involve lagging mitosis due to stuck together chromosomes and lagging cell division (Fig. 6b). In arrested mitosis, the inability of separation of chromosomes can lead to apoptosis (Fig. 6c). Tripolarization of nuclear material in hypertriploid, hypotetraploid, and near-tetraploid aneuploid cells can lead to trivision (Fig. 6d).
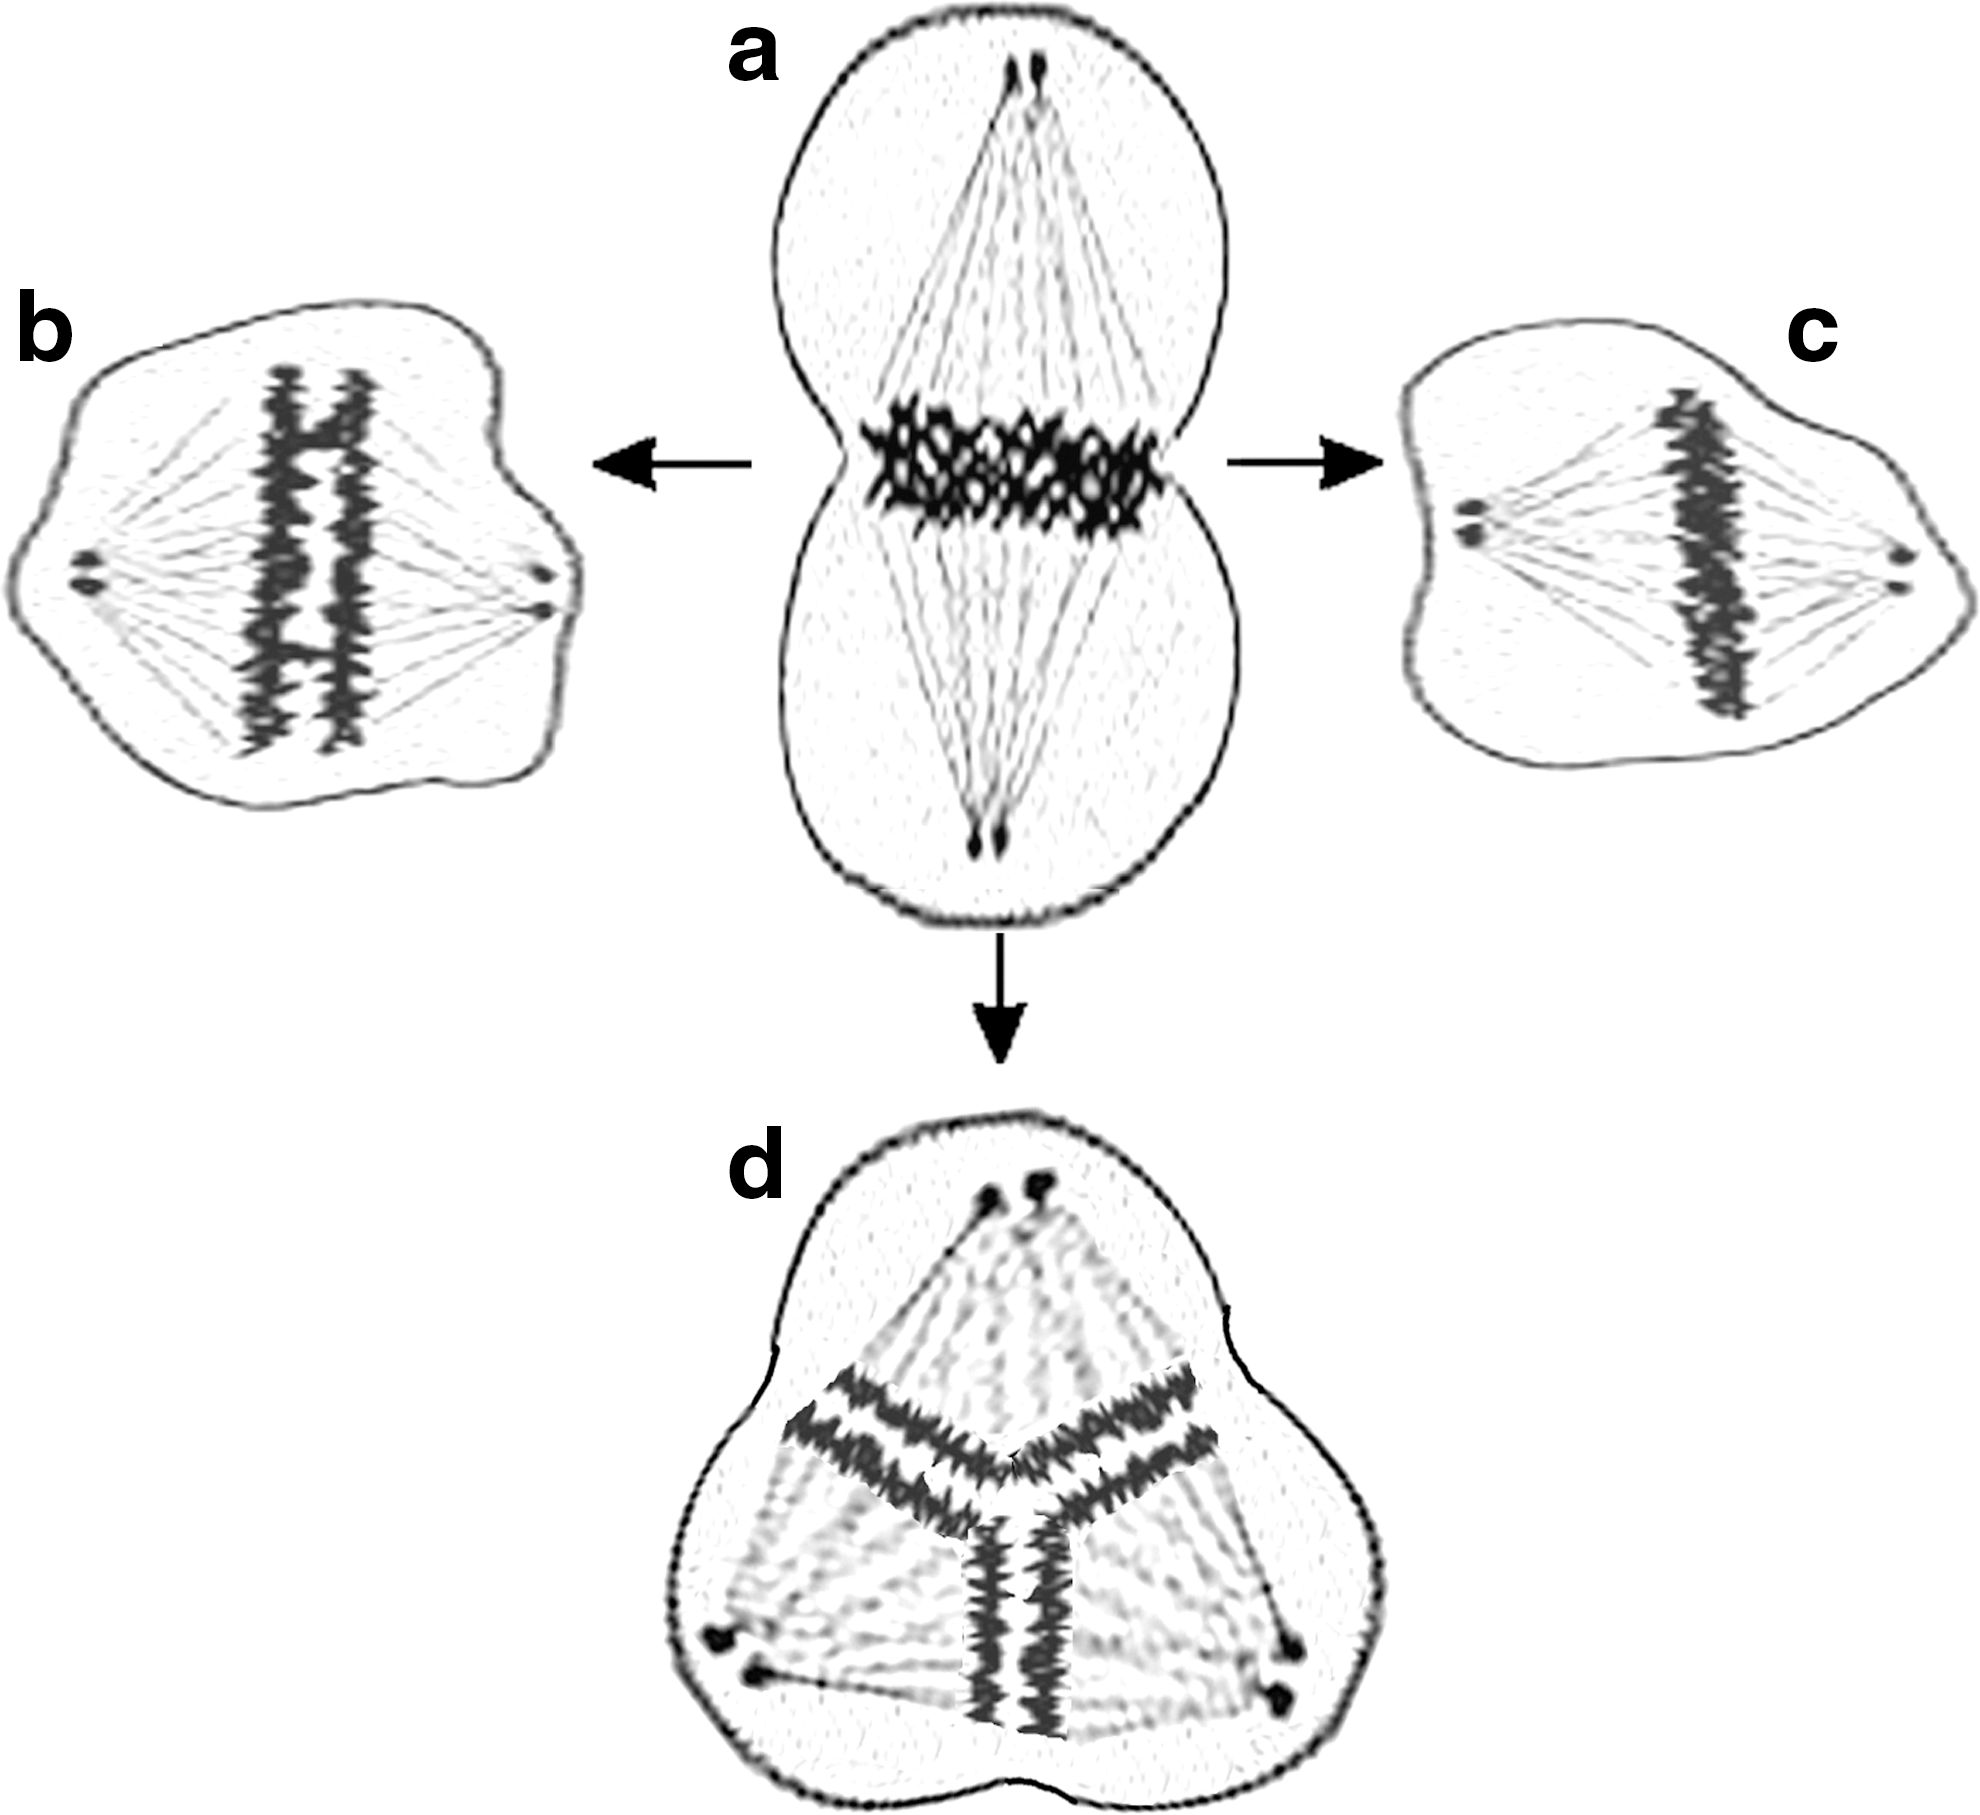
Anomalies in mitotic division. Planar geometric arrangement of nuclear material in
In conclusion, the aim of this study was to clarify whether hypertriploid (HeLa cells), hypertriploid-hypotetraploid karyotypical abnormalities (72–78 chromosomes=3.13–3.39 N) of the human keratinocyte HaCaT cell line, or the near-tetraploid state of the UM are related to aberrant cell divisions. To answer the question, time-lapse photographs were taken every minute during the live imaging of cell growth, and cellular changes including the frequency of unusual cell divisions have been compared with endothelial tumor cells close to diploidy. These experiments indicate that high ploidy (tri-, tetraploidy) predisposes cells to cell trivision. We hypothesize that among several other causes, tumor progression and metastasis could be related to cell trivision. The cell trivision-induced aneuploidy in higher ploidy states could be aggravated by the autonomous growth of these irregular divisions, in conformity with the multi-mutation theory of cancer (Nordling, 1953; Knudson, 1971). Finally, it is hypothesized that trivision could give an additional explanation for “small cell” carcinogenesis which was earlier merely a descriptive term to distinguish “small” from “large” cancer cells under the microscope. Before coming to a general conclusion, the observation that hypertriploid and hypotetraploid cells undergo cell trivision more frequently than near diploid cells does not necessarily mean a change in DNA content. The frequency of trivision could also depend on the number of centrosomes per cell or to the ability of trividing cells to bundle chromosomes, before coming to a general conclusion. The low frequency of trivision could also be contrasted by small cell cancer that is probably caused much more frequently by specific genetic changes and imperfect divisions than by trivisions.
Footnotes
Acknowledgment
This work was supported by the National Science Research Foundation of the Hungarian Academy of Sciences OTKA grant T42762 to GB.
Disclosure Statement
The authors declare that they have no competing interest.
References
Supplementary Material
Please find the following supplemental material available below.
For Open Access articles published under a Creative Commons License, all supplemental material carries the same license as the article it is associated with.
For non-Open Access articles published, all supplemental material carries a non-exclusive license, and permission requests for re-use of supplemental material or any part of supplemental material shall be sent directly to the copyright owner as specified in the copyright notice associated with the article.
