
Abstract
Defective T cell receptor (TCR) signaling resulting in lower T cell function plays a crucial role in the pathogenesis of T cell immunodeficiency in leukemia. Previous studies have indicated that lower TCRζ levels are a common characteristic of patients with leukemia, and upregulating TCRζ could partially recover T cell function. In this study, we characterized the effect of the stimulating factor induction on the TCRζ, Zap-70, and FcɛRIγ levels, IFN-γ secretion, and the distribution and clonal expansion of TCR Vβ subfamilies in CD3+ T cells sorted from peripheral blood from acute myeloid leukemia (AML) patients. The induction included single stimulating factor or a combination with different cytokines (IL-2, IL-7, IL-2+IL-7, IL-7+IL-12, CD3, CD3+CD28 antibody, CD3+CD28 antibody+IL-2, and CD3+CD28 antibody+IL-7) at 72 h. The results showed that increased TCRζ and Zap-70 levels with deceased FcɛRIγ in T cells after induction, and different responses to cytokine in T cell from different cases may indicate the heterogeneity of T cells and different immune statuses in different AML cases. Increased IFN-γ levels in T cells from AML patients were detected after induction in the IL-12+IL-7, CD3+CD28+IL-2, and CD3+CD28+IL-7 groups. Moreover, the number of TCR Vβ subfamily T cells expressed was increased; however, all of the TCR Vβ subfamily T cells in the AML patients could not be completely recovered after induction. In conclusion, the cytotoxicity and activation function of T cells could be enhanced after induction by different stimuli accompanied by an increase in TCRζ and Zap-70 and recovery of the TCR Vβ repertoire in AML patients.
Introduction
A
T cell immunodeficiency plays an important role in cancer and leukemia progression and promotes the expansion of malignant clones (Greiner et al., 2008; Müller-Schmah et al., 2012). Recent studies have revealed that T cell immunodeficiencies are common characteristics of patients with AML, and they are characterized by peripheral T cells that are incapable of interacting with blasts, reduced thymic output function, oligoclonally restricted T cell repertoires, and low activation and response to antigens. Moreover, the immunosuppressive microenvironment in the bone marrow where both innate and adaptive immune responses are profoundly deregulated sustains and modulates the proliferation, survival, and drug resistance of AML (Li, 2008, 2014; Shi et al., 2013; Isidori et al., 2014). Cases in which low T cell activation may be due to abnormal T cell receptor (TCR) signal transduction, such as that involving the TCRζ (also called as CD3ζ) chain (Rezvany et al., 1999; Chen et al., 2000; Li et al., 2009b; Erba, 2007), modulating the immune system, including reconstituting T cell activation and cytotoxicity against leukemia, may improve the survival of AML patients because the immune system is capable of recognizing and attacking leukemic cells (Isidori et al., 2014).
TCRζ is a CD3 subunit of the TCR/CD3 complex that plays a central role in T cell activation. Absence of the TCRζ chain impairs the proliferative response and mature T cell activation level. T cells from patients with leukemia are functionally impaired, and this is related to a decrease in the TCRζ chain expression (Chen et al., 2000; Fischer et al., 2005; Li, 2008; Chen et al., 2011). Recently, we have reported significantly lower expression of TCRζ in patients with AML and CML, and increasing TCRζ expression by gene transfer enhances the activation and cytotoxicity of T cells from patients with CML (Chen et al., 2009; Zha et al., 2012a, 2012b). However, there are few data characterizing TCRζ upregulation and the T cell activation and proliferation induced by different methods such as gene transfer and cytokine induction in T cells from AML. Thus, in this study, we investigated the characteristics of TCRζ upregulation and the TCR Vβ polyclonal expansion repertoire in CD3+ T cells from patients with AML after IL-2, IL-7, and IL-12 induction.
Materials and Methods
Samples
The samples used in this study were obtained from four newly diagnosed, untreated (de novo) patients with AML, including two males and two females (17–48 years old; median age: 33.25) who were classified according to morphology based on criteria defined according to the FAB classification. The clinical data of the patients are listed in Table 1. Peripheral blood mononuclear cells (PBMCs) were isolated from heparinized venous blood by Ficoll-Hypaque gradient centrifugation. CD3+ T cells were sorted from PBMCs using anti-CD3 monoclonal antibodies (MoAb) and the MACS magnetic cell sorting technique (Miltenyi Biotec). All procedures were conducted according to the guidelines of the Medical Ethics Committee of the Health Bureau of Guangdong Province, China.
WBC, white blood cells.
Cell culture
CD3+ T cells from patients were suspended at 2–5×10⁵ CD3+ T cells per mL per well in 24-well tissue culture plates in RPMI 1640 (Gibco) medium supplemented with 10% heat-inactivated fetal calf serum and 100 U/mL penicillin/streptomycin. CD3+ T cells were stimulated with different combination cytokines (IL-2, IL-7, IL-2+IL-7, IL-7+IL-12, CD3 MoAb, CD3+CD28 MoAb, CD3+CD28 MoAb+IL-2, and CD3+CD28 MoAb+IL-7) at 500 U/mL (PeproTech), 500 U/mL IL-7 (PeproTech), or 50 U/mL IL-12 (Sigma). The cultures were incubated in a humidified atmosphere at 37°C in 95% O2 and 5% CO2. After 3 days of culture, the cells were collected for RNA isolation, and analysis of the gene expression levels and TCR Vβ repertoire was performed.
RNA isolation and cDNA synthesis
RNA was extracted from the T cells before and after induction using the TRIzol RNA extraction buffer according to the manufacturer's protocol (TRIzol; Invitrogen). The quality of the RNA was analyzed in a 0.8% agarose gel stained with ethidium bromide. Two micrograms of RNA was reverse transcribed into first strand cDNA with random hexamer primers using the reverse transcriptase in the Superscript III Kit (Gibco). The cDNA quality was confirmed by reverse transcription-polymerase chain reaction (RT-PCR) for β2 microglobubin (β2M) (RT-PCR primers for the β2M gene are listed in Table 2).
Real-time quantitative reverse transcription–polymerase chain reaction
The primers used in this study were purchased from Shanghai Invitrogen Biotechnology Co. Ltd. (Table 2). The expression level of the TCRζ, Zap-70, and FcɛRIγ genes in cDNA from stimulated or unstimulated CD3+ T cells was examined by SYBR Green I real-time PCR. Briefly, PCR was performed in a 20 μL total volume containing 1 μL cDNA, 9 μL 2.5×SYBR Green I master mix (Tiangen), and 10 μM primers. After an initial denaturation at 95°C for 15 min, 45 cycles of the following procedure was performed using an MJ Research DNA Engine Opticon 2 PCR cycler (Bio-Rad): 30 s at 95°C followed by 40 s at 60°C for the β2M, TCRζ, Zap-70, and FcɛRIγ genes. The relative amounts of the genes of interest and the β2M reference gene were measured in two independent assays. Specific amplification of PCR products was analyzed by melting curve analysis. The data are presented as the relative expression of the genes of interest compared with the internal control gene as determined by the 2(−ΔCT) method (Chen et al., 2010; Shen et al., 2013).
Western blot analysis
CD3+ T cells at 1–3×10⁵ cells/0.2 mL with or without stimulation were solubilized in RIPA lysis buffer (1×phosphate buffered saline [PBS], 1% Nonidet P-40, 0.5% sodium deoxycholate, 0.1% sodium dodecyl sulfate [SDS], 10 mM phenylmethylsulfonyl fluoride, 1 mg/mL aprotinin, and 100 mM sodium orthovanadate) and incubated on ice for 30 min to isolate total protein. Proteins (10 μg/well) were separated by 10% SDS–polyacrylamide gel electrophoresis (SDS-PAGE) and transferred to a polyvinylidene fluoride (PVDF) membrane (Pall) using a damp–dry transfer device (Bio-Rad). After blocking for 1 h in 5% nonfat milk in PBS, the membrane was washed and incubated with mouse anti-β-actin (1:2000; ProteinTech), rabbit anti-human TCRζ or anti-human ZAP-70 (1:1000; Cell Signaling Technology). The antibodies were detected with 1:10,000 horseradish peroxidase-conjugated goat anti-rabbit IgG and horseradish peroxidase-conjugated donkey anti-mouse IgG (Jackson ImmunoResearch). A western blotting Luminol reagent (Beyotime) was used to visualize bands corresponding to each antibody (Nambiar et al., 2003). Blot images were captured using an Alliance 4.7 Gel doc system (UVI), and densitometric analysis of the bands was performed using the ImageJ software (
RT-PCR for TCR Vβ subfamily gene analysis
Twenty-four TCR Vβ subfamily genes were amplified by RT-PCR using 24 TCR Vβ sense primers and a common TCR Cβ reverse primer. Subsequently, runoff PCR was performed with fluorescent primers labeled at the 5′ end with a FAM fluorophore (Cβ-FAM) purchased from TIB MOLBIOL GmbH. PCR was performed as previously described (Li et al., 2005a). The 25 μL reaction mixture contained 1 μL cDNA, 0.5 mM forward and reverse primers, 0.1 mM dNTP, 1.5 mM MgCl2, 1×PCR buffer, and 1.25 U Taq polymerase (Promega). The amplifications were performed in a DNA thermal cycler (Biometra). After a 3 min denaturation at 94°C, 40 PCR cycles were performed with each cycle consisting of 94°C for 1 min, 60°C for 1 min, 72°C for 1 min, and a final 6 min elongation at 72°C. The products were then stored at 4°C (Li et al., 2005a; Jin et al., 2014).
GeneScan analysis
Two microliters of FAM-labeled runoff PCR products were heat denatured with 9.5 mL Hi-Di formamide (ABI) and 0.5 mL size standards (GeneScan™-500-LIZ™; ABI) at 94°C for 4 min. The samples were then loaded onto 3100 Performance Optimized Polymer-4 gel (3100 POP-4™; ABI), resolved by electrophoresis in an ABI 3100 DNA sequencer and analyzed using the GeneScan software as previously described (Li et al., 2005a; Jin et al., 2014).
Enzyme-linked immunosorbent assay
Cell supernatants were collected from stimulated groups after 72 h, and the IFN-γ levels were measured using the human IFN-γ enzyme-linked immunosorbent assay (ELISA) kit (Raybiotech) according to the protocol of the manufacturer.
Statistical analysis
Differences in mRNA expression between two groups were analyzed using the paired Student's t-test. The data are presented as the mean±standard deviation. Differences in the IFN-γ levels were analyzed using nonparametric tests for K related samples. Differences with a p<0.05 were considered statistically significant.
Results and Discussion
The expression levels of the TCRζ, Zap-70, and FcɛRIγ genes in AML T cells after cytokine induction
Because T cell immunodeficiencies are common characteristics of patients with AML (Li, 2008; Isidori et al., 2014), we aimed to elucidate the characteristics of T cell immunity in patients with AML. Our previous studies have characterized reduced thymic output function, oligoclonally restricted T cell repertoires, and a low repression level for TCR signal transduction factors in T cells from AML patients (Li et al., 2005a, 2009b; Chen et al., 2011). We found significantly lower expression levels for all four of the chain genes, CD3γ, δ, ɛ, and ζ, in CD3+ T cells, and the expression pattern of the four CD3 genes was different from that of healthy controls (Chen et al., 2011). Such deficiency in CD3 gene expression levels might be, at least, a part of the reason for the reduction in T cell activation in AML. Similar findings were also reported in CML, CLL, and lymphomas (Huang et al., 2012; Zha et al., 2012b; Liao et al., 2014). Therefore, enhancing CD3 expression may reactive the T cell activation functions and reverse the immunodeficiency in leukemia patients. Enhancement in TCRζ (CD3ζ), which is crucial for TCR signaling functions, because it provides 6 of 10 immunoreceptor tyrosine-based activation motifs for the TCR-CD3 complex (Call and Wucherpfennig, 2005; Li, 2008; Zha et al., 2012a), was reported by different methods, including cytokine induction and TCRζ transfer in T cells of CML patients (Chen et al., 2009; Zha et al., 2012b). A previous study showed that IL-2 could enhance the TCRζ level, but it could not completely recover the TCRζ level in T cells in CML patients (Chen et al., 2009). In this study, we compared the effects of different cytokine combinations on enhancing the TCRζ level.
We analyzed the effects of increasing the TCRζ level in CD3+ T cells sorted from four cases with AML after induction with a single stimulating factor or a combination of different cytokines at 72 h in vitro. The TCRζ expression level in CD3+ T cells from AML patients was mostly increased in each group (IL-2, IL-7, IL-2+IL-7, IL-7+IL-12, CD3 MoAb, CD3+CD28 MoAb, CD3+CD28 MoAb+IL-2, and CD3+CD28 MoAb+IL-7) (Fig. 1) with the exception of the IL-2+IL-7 and CD3+CD28 MoAb+IL-2 combinations in Case 2 (M2), and the TCRζ expression level in CD3+ T cells after induction appeared to be slightly decreased. Interestingly, there was an increased TCRζ expression level in all groups in Case 3 (M2). The different response to cytokine induction for the T cells in the M2 cases may indicate T cell heterogeneity and different immune statuses in different cases even within the same AML subtype.
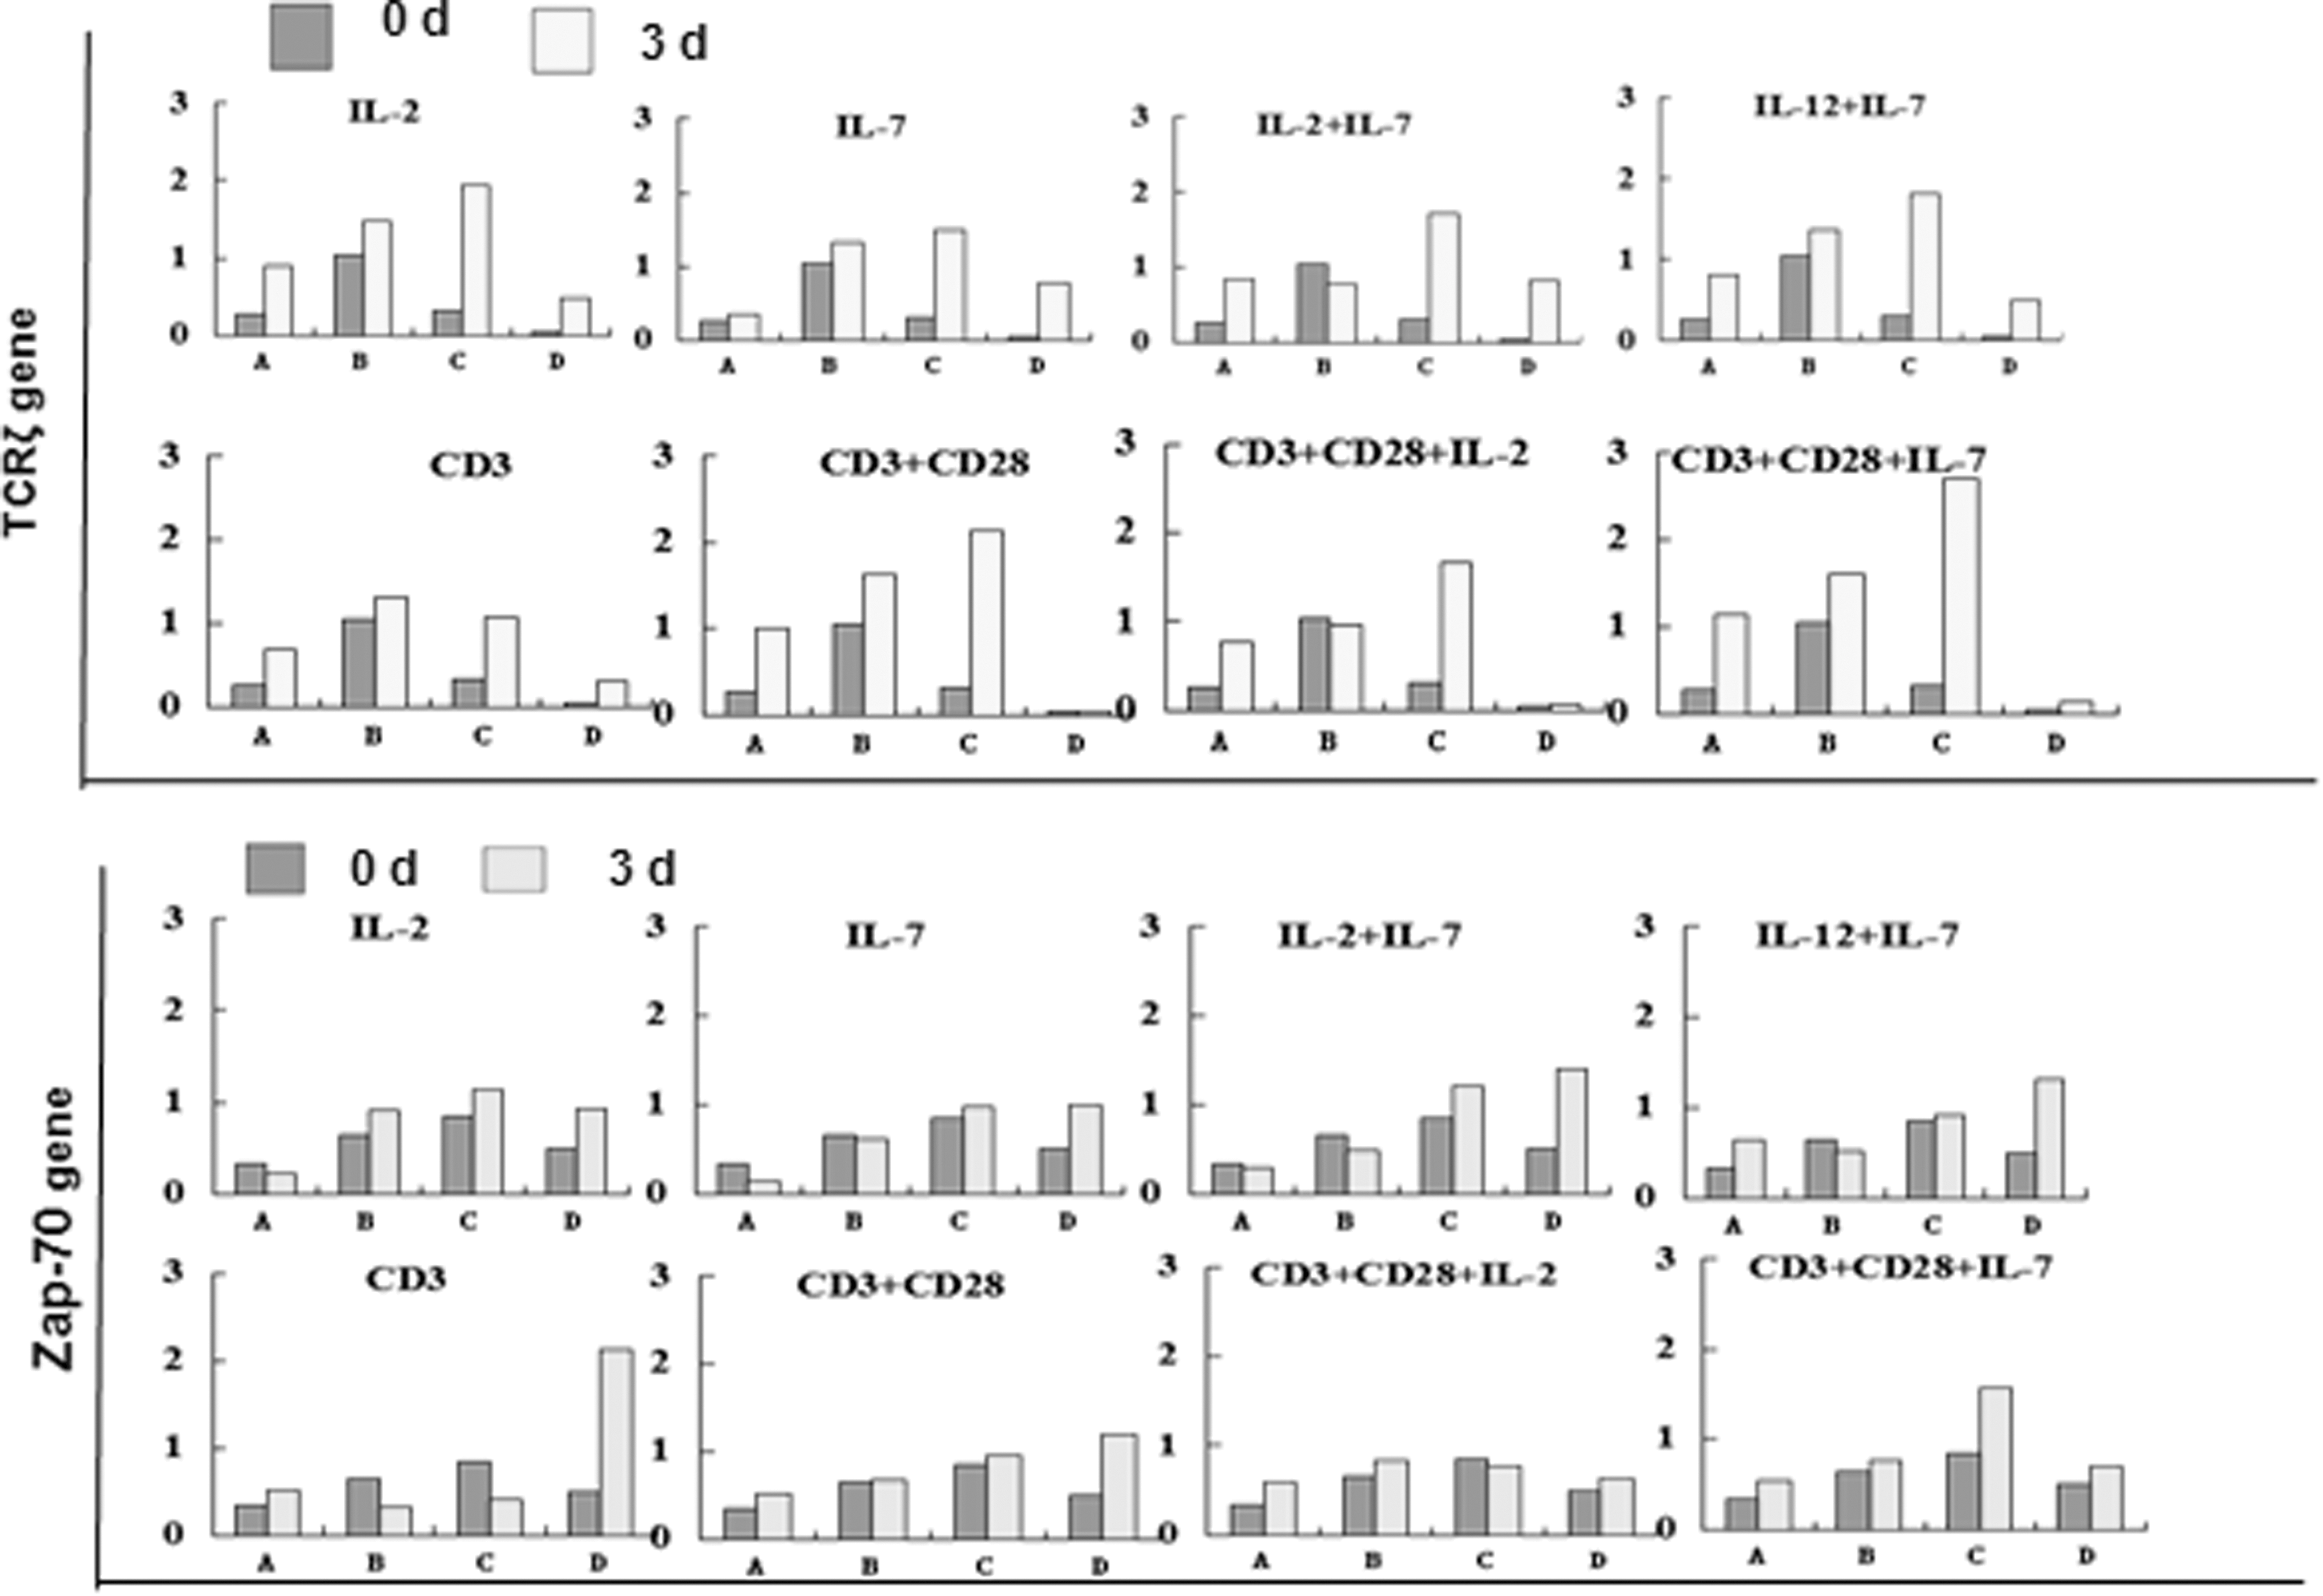
The expression level of the TCRζ and Zap-70 genes in T cells from four cases with acute myeloid leukemia (AML) before or 3 days after induction. A: Case 1 (AML-M3), B: Case 2 (AML-M2), C: Case 3 (AML-M2), D: Case 4 (AML-M5b).
We next detected the Zap-70 expression level in the same samples used for TCRζ detection. An increased Zap-70 expression level could be detected in each group in Case 4 (M5), whereas slight up or downexpression was found in Cases 1 through 3 in different groups in which the same tendency for Zap-70 upexpression was found in the CD3+CD28 MoAb and CD3+CD28 MoAb+IL-7 groups (Fig. 1). The expression levels of the TCRζ and Zap-70 proteins were also measured by western blot analysis, and similar results were found. An increased TCRζ level was found in the IL-2+IL-7 (p=0.01) and CD3+CD28 MoAb+IL-7 groups, and increased Zap-70 was found in the IL-12+IL-7 group (p=0.02) (Fig. 2). These results suggested that TCRζ and its downstream factor Zap-70 could be enhanced by the combination of IL-2 IL-7 or IL-12, and IL-7 may be the most important factor for such a stimulation process. It is well known that IL-7 is required for the development and survival of T cells and plays a critical role in modulating T cell homeostasis. This cytokine costimulates T cell activation by enhancing proliferation and cytokine production, particularly in the setting of suboptimal TCR triggering. Several studies have shown that IL-7 enhances T cell survival in long-tem cell cultures, and it was shown to be superior to IL-2. Moreover, IL-12 as a cytotoxic lymphocyte maturation factor/NK cell stimulatory factor, can enhance IL-2 production and the activity of cytotoxic effector cells, the combination of IL-7 and IL-12 is synergistic, leading to IFN-γ responses greater than that of IL-12 alone (Soiffer et al., 1993; Lynch and Miller, 1994; Fry and Mackall, 2002; Plain et al., 2012). Such a phenomenon was also shown in this study.
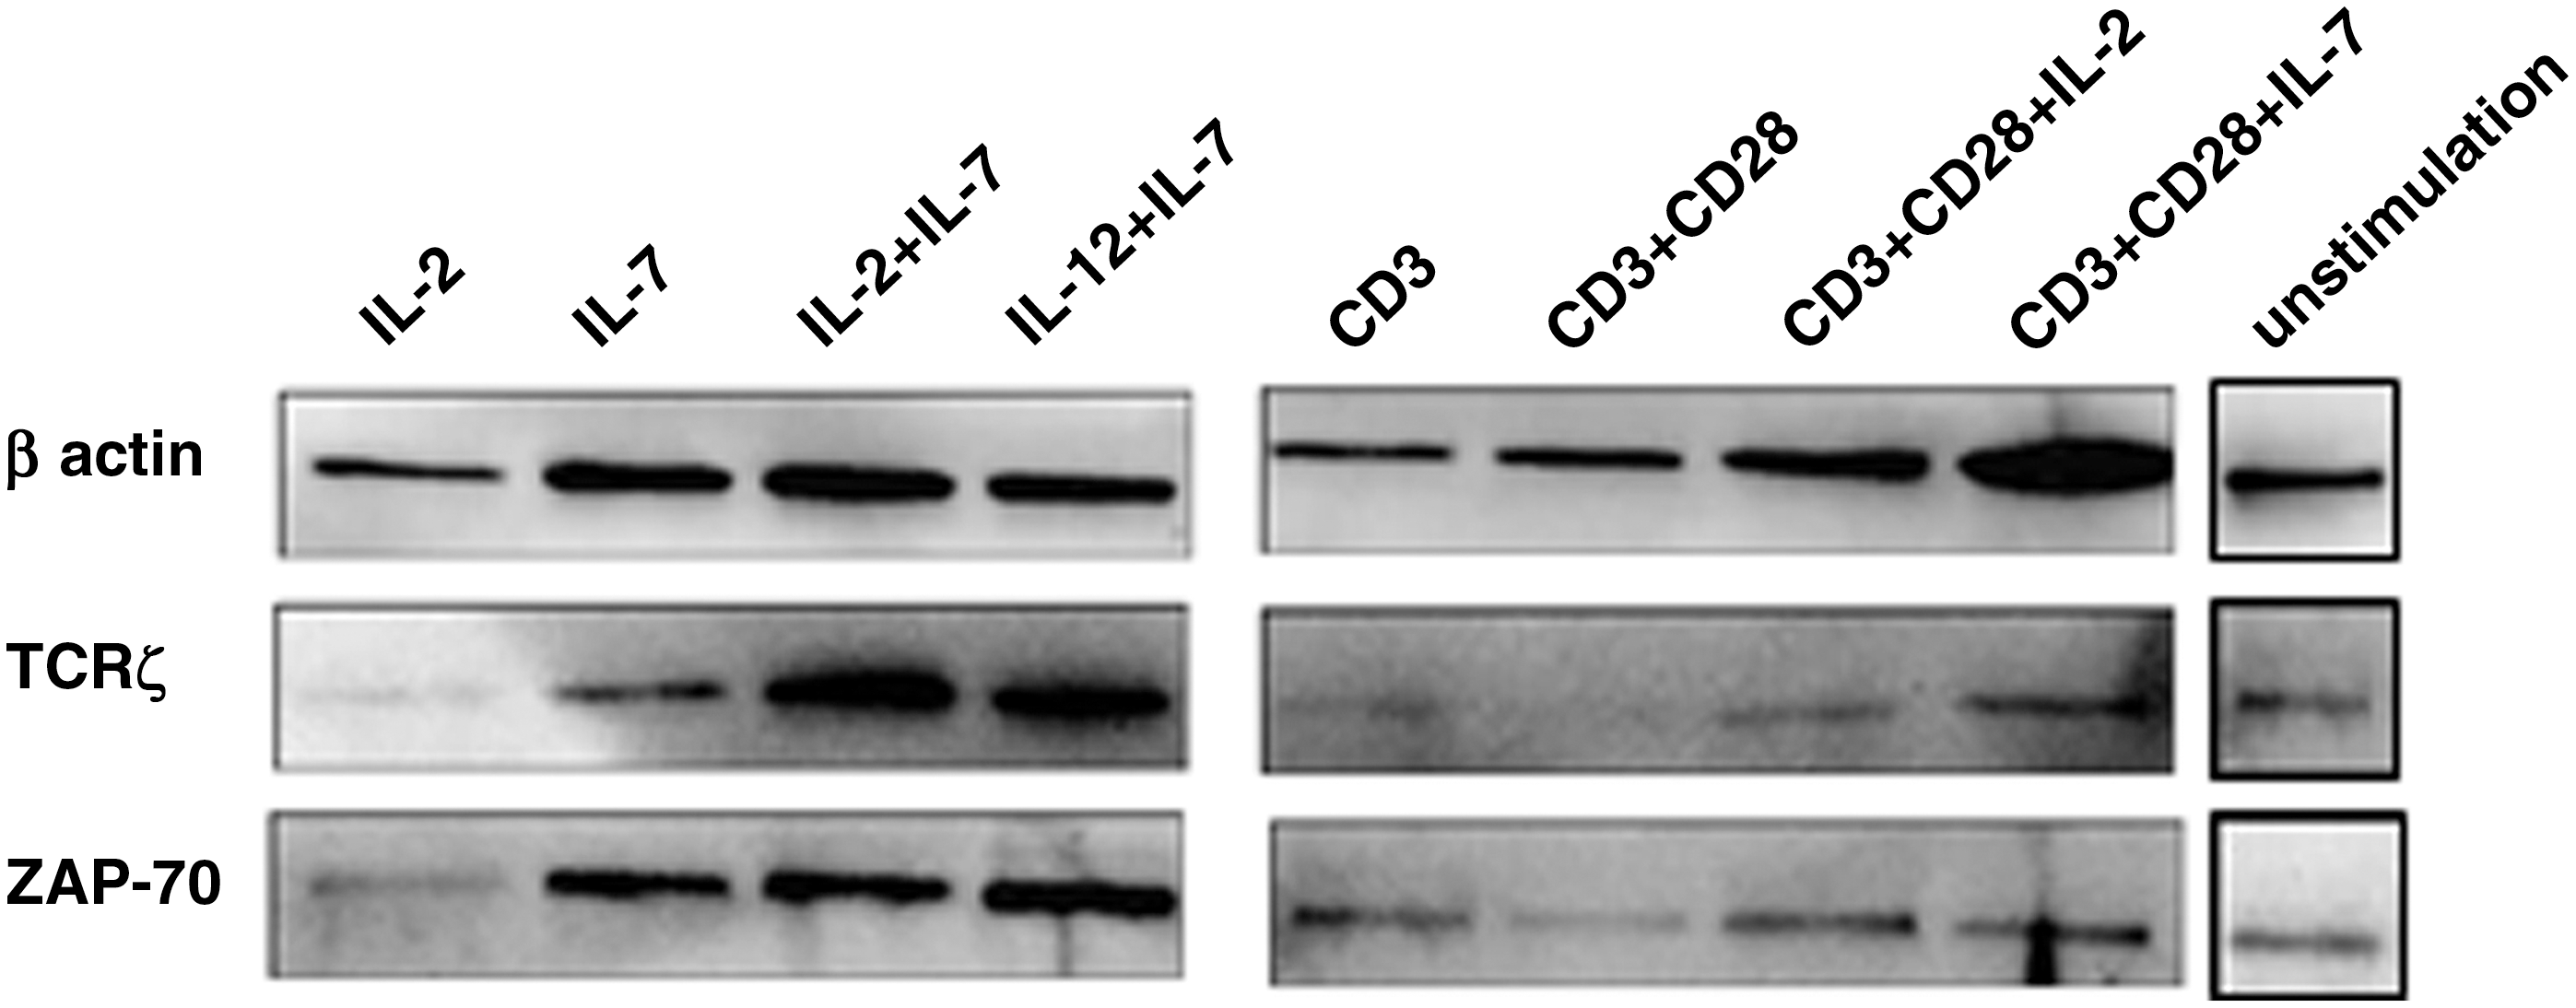
Detection of TCRζ and Zap-70 protein in T cells from an AML case before and after induction in different groups.
We also analyzed the expression characteristics of FcɛRIγ, the TCRζ gene complementary factor. The expression level of the FcɛRIγ gene was downregulated in each group and all samples after induction (Fig. 3). The expression level of FcɛRIγ was highest in Case 4, which was as high as 27- and 69-fold greater than Cases 1 and 2, respectively, followed by Case 3 before induction. This result was consistent with the results for the TCRζ expression level, which was lowest in Case 4 followed by Case 3 before induction, and this may be because both expression levels are complementary (Niu et al., 2015). This phenomenon also indicated a heterogeneous immune status for the AML patients. It is reasonable that the FcɛRIγ expression level was downregulated after induction because, in this case, TCRζ expression was upregulated.
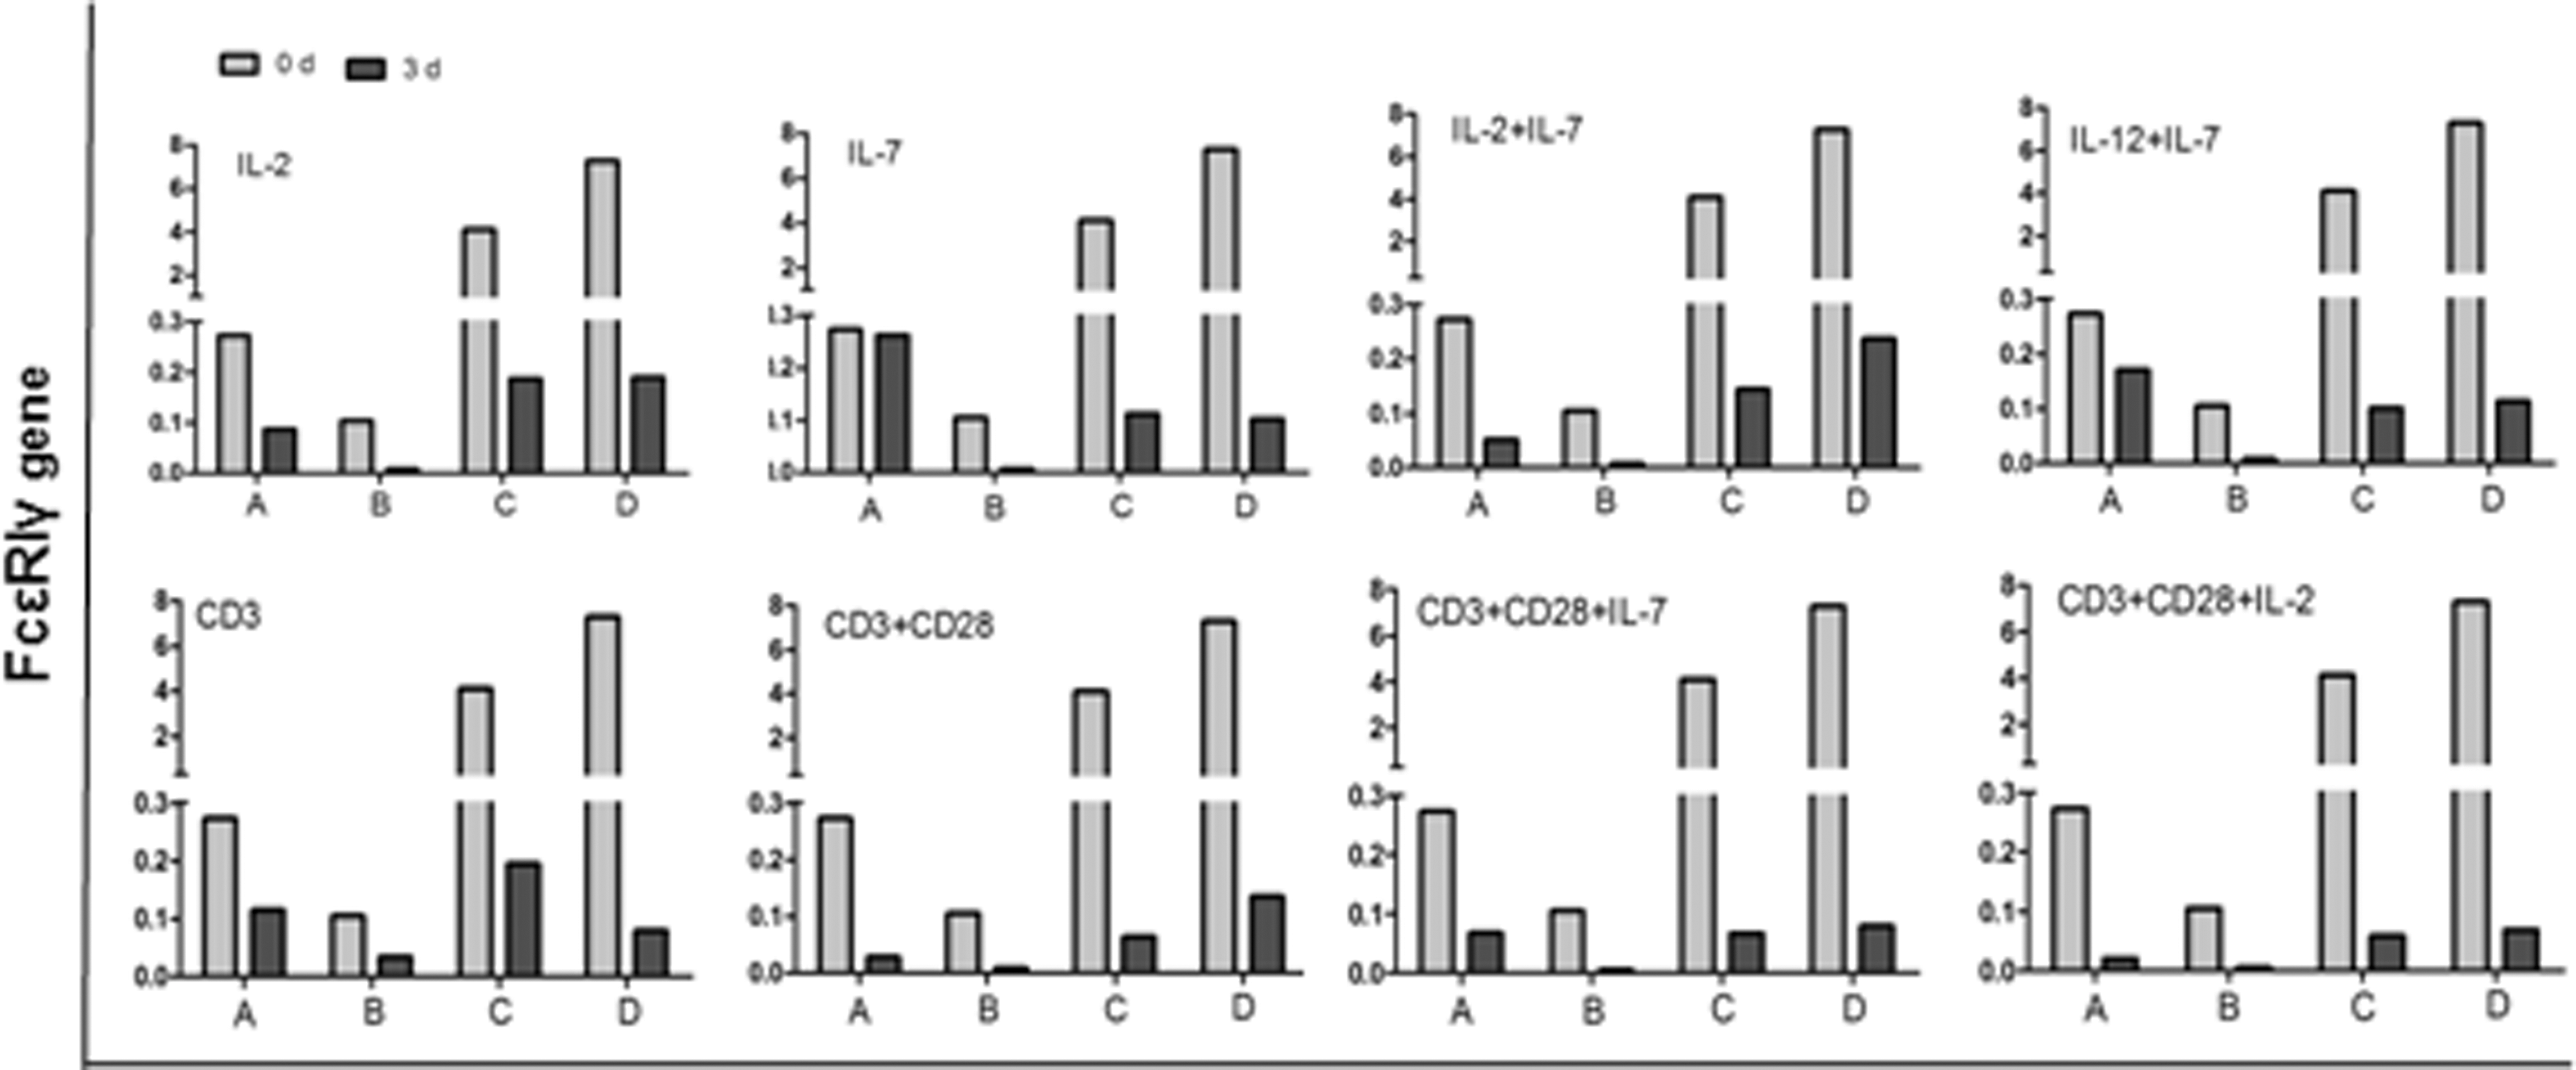
The expression level of the FcɛRIγ gene in T cells from four cases with AML before or 3 days after induction. A: AML-M3, B: AML-M2, C: AML-M2, D: AML-M5b.
Increased IFN-γ secretion in T cells from AML after cytokine induction
We next examined T cell function by measuring the IFN-γ secretion level (Thomas et al., 2014), which was stimulated by a single stimulating factor or a combination of different cytokines at 72 h in vitro. The secretion of IFN-γ from T cells from AML patients was significantly increased in each group (p=0.039). An increased IFN-γ level was detected in the IL-12+IL-7, CD3+CD28 MoAb+IL-2, and CD3+CD28 MoAb+IL-7 groups (Fig. 4). Thus, these results suggested that the cytotoxicity of T cells was enhanced after induction by different stimuli and was accompanied by an increase in TCRζ and Zap-70 and T cell activation, confirming that T cell function could be enhanced by cytokine induction in AML patients.

The IFN-γ secretion level in T cells from AML patients after cytokine induction.
The distribution and clonality of CD3+ T cells from AML patients after cytokine induction
Different TCR subfamily T cells display different functions for specific antigen responses (Zha et al., 2011; Chen et al., 2013), thus, it is of interest to characterize the contribution of cytokine induction to TCR subfamily T cell clone proliferation. Using results from the expression characteristics of the TCRζ, Zap-70, and FcɛRIγ genes and the IFN-γ secretion of CD3+ T cells from AML patients after cytokine induction, we analyzed changes in the TCR Vβ repertoire and T cell clonality in CD3+ T cells from three groups (control, CD3+CD28 MoAb, and CD3+CD28 MoAb+IL-7).
In general, 24 of the TCR Vβ subfamilies could be detected in peripheral blood T cells from healthy individuals (Li et al., 2007, 2009a), however, the absence of some TCR subfamilies is frequent in leukemia samples, which is a common characteristic of leukemia patients related to T cell immunodeficiency (Li et al., 2005a; Jin et al., 2014). In this study, 11–20 TCR Vβ subfamilies could be detected in CD3+ T cells from four cases with AML, and most cases displayed polyclonal expansion. Four to 13 TCR Vβ subfamilies were absent in the different cases, and previous studies showed a skewed distribution for the TCR Vβ repertoire, which was mostly detected in PBMCs from AML patients (Li et al., 2005a). These results may be influenced by the fact that PBMCs contain a high percentage of AML cells, which may reduce the sensitivity of PCR analyses. In this study, we detected the expression profile of the TCR Vβ repertoire in purified CD3+ T cells from AML patients, and the results may directly reflect the distribution of the TCR Vβ repertoire. Similar findings have indicated T cell immunodeficiency with restricted expression of the TCR Vβ repertoire in AML patients. Not only the low activation, but also the abnormal expansion of the TCR Vβ subfamily T cell needs to be revived in AML patients for T cell immunotherapy. Therefore, in this study, we attempted to revive T cell activation and expansion by using different T cell stimuli after confirming that the expression levels of the TCRζ and Zap-70 genes and the IFN-γ secretion ability of CD3+ T cells from AML patients was increased in different stimulation groups. In addition, we also analyzed the expression and expansion of the TCR Vβ subfamilies. Overall, the number of expressed TCR Vβ subfamilies was increased in T cells from the same case after induction; however, unlike the induction in normal T cells, which showed complete expansion of TCR Vβ subfamily T cells after IL-2 or PHA induction (Li et al., 2005b), stimulation could not completely recover all of the TCR Vβ subfamily members. For example, Vβ8 was not detected in any of the samples, whereas Vβ24 was positive after CD3+CD8 MoAb+IL-7 induction in Cases 3 and 4, but not in Case 1. This result may be related to the abnormal T cell function in AML patients, which could not be completely reversed by cytokine induction. However, another possibility is that there are specific clonally expanded T cells, which were thought to be related to leukemia-associated antigen (Li et al., 2005; Jin et al., 2014) in AML patient samples. Therefore, we further analyzed the clonality of the T cells before and after induction. Most T cells displayed polyclonality before induction, and only Vβ19 (in Case 2), Vβ6, Vβ15, and Vβ18 (Case 3) and Vβ9 (Case 4) showed oligoclonality. In addition, most TCR Vβ subfamily members maintained the same clonality after induction, for example, oligoclonally expanded Vβ9 T cells were identified in Case 4 before induction, and similar clonal characteristics were found for T cells after CD3+CD28 and CD3+CD28+IL-7 stimulation. These data suggest that a specific antigen for the clonally expanded T cells may be the leukemic-associated antigen. While some oligoclonally expanded T cells could be altered to have polyclonal proliferation, for example, oligoclonally expanded Vβ6, Vβ15, and Vβ18 T cells were identified in Case 3 before induction and the clonality was changed to polyclonality after CD3+CD28 MoAb and CD3+CD28 MoAb+IL-7 induction, it is interesting to note that polyclonality changing to oligoclonality was also observed for some Vβ subfamily members after induction, for example, Vβ20 in Case 3 and Vβ15 in Case 4 (Fig. 5). It is thought that the change in T cell clonality from oligo- to polyclonality indicates recovery of the proliferation of T cells after cytokine induction, but it is difficult to explain the change in T cell clonality from poly- to oligoclonality, which remains an open question requiring further investigation in a larger cohort of samples.

T cell clonality in CD3+ T cells from AML patients after cytokine induction. C1 to C4: AML Cases 1 to 4, A: control, B: CD3+CD28 monoclonal antibodies (MoAb) induction, C: CD3+CD28 MoAb+IL-7 induction.
In conclusion, we characterized alterations in the TCRζ, ZAP-70, and FcɛRIγ expression levels and increased IFN-γ secretion in AML T cells after induction by different cytokine combinations, and IL-7 might play a critical role in TCRζ upregulation and T cell activation. Moreover, the number of expressed TCR Vβ subfamily T cells was increased; however, all TCR Vβ subfamily T cells could not be completely recovered in AML patients after induction. Overall, the cytotoxicity and activation function of T cells could be enhanced after different stimuli, which accompanied a TCRζ and Zap-70 increase and recovery of the TCR Vβ repertoire in AML patients. Further investigation is needed to determine the optimal combination of cytokines for enhancing T cell expansion. Moreover, such T cell immune activation might be considered for supporting to design the TCR or CAR modified T cell immunotherapy in future (Han et al., 2013).
Footnotes
Acknowledgments
This study was supported by grants from the National Natural Science Foundation of China (Nos. 81100353, 81270604 and 81400109), China Postdoctoral Science Foundation (No. 2013 M540685), the Guangdong Natural Science Foundation, China (No. S2013040016151), the Medical Science Foundation of Guangdong Province (Nos. A2011325 and B2013213), and the Fundamental Research Funds for the Central Universities (Nos. 21611447 and 21613313).
Authors' Contributions
S.H.C. and Y.Q.L. contributed to the concept development and study design. S.L., X.F.Z., Y.X. and L.X. performed real-time PCR, RT-PCR, GeneScan, cell culture, ELISA, and western blot assays. S.L. and L.J.Y. prepared PBMCs, RNA, and cDNA. Y.H.L. and K.E.Z. were responsible for clinical diagnoses and performed clinical data acquisition. Y.Q.L., S.H.C., and S.L. coordinated the study and helped draft the article. All authors read and approved the final article.
Disclosure Statement
No competing financial interests exist.