
Abstract
The aim of this study was to examine the effect of mitochondrial morphogenesis changes on apoptosis and autophagy of high-glucose-treated proximal tubular epithelial cells (HK2). Cell viability, apoptosis, and mitochondrial morphogenesis were examined using crystal violet, terminal deoxynucleotidyl transferase-mediated dUTP-biotin nick end labeling (TUNEL), and mitotracker staining, respectively. High glucose inhibited cell viability and induced mitochondrial fission in HK2 cells. After depleting mitofusin 1 (MFN1), the MFN1(−) HK2 cells (fission type) became more susceptible to high-glucose-induced apoptosis and mitochondrial fragmentation observed by TUNEL and mitotracker assays. In siMFN2 HK2 cells (fission type), mitochondria were highly fragmented (>80% fission rate) with or without high-glucose treatment; however, siFIS1 (mitochondrial fission protein 1) HK2 cells (fusion type) exhibited little fragmentation (<13%). High-glucose treatment induced autophagy, characterized by the formation of autophagosome and microtubule-associated protein light chain 3 (LC3) B-II, as observed by transmission electron microscopy and western blotting, respectively. LC3B-II levels decreased in both MFN1(−) and siMFN2 HK2 cells, but increased in siFIS1 HK2 cells. Moreover, autophagy displays a protective role against high-glucose-induced cell death based on cotreatment with autophagy inhibitors (3-methyladenine and chloroquine). Mitochondrial fission may increase apoptosis and decrease autophagy of high-glucose-treated HK2 cells.
Introduction
A
It is well established that oxidative stress may result in mitochondrial damage and cell death through apoptotic pathways (Kim et al., 2007; Yang et al., 2012; Shih et al., 2014). In rat renal proximal tubular cells, high glucose was reported to inhibit mitochondrial functions, including carbonyl cyanide-p-trifluoromethoxyphenylhydrazone-mediated uncoupled respiration (Covington and Schnellmann, 2012), mitochondrial superoxide generation, partial complex III inactivation, low ATP levels, and cell death (Munusamy and MacMillan-Crow, 2009). However, the role of high glucose in mitochondrial morphogenesis is poorly characterized.
Mitochondrial morphogenesis (fission and fusion) is dynamic, interchangeable, and regulated by specific dynamin-related proteins. Under cellular stresses, mitochondrial morphological dynamics tend to fission, leading to mitochondrial fragmentation and cell death (Suen et al., 2008). Nevertheless, inhibition of fission and promotion of fusion may protect cells from apoptosis (Youle and Karbowski, 2005).
Several proteins involved in mitochondrial morphological dynamics have been reported. These include the fusion proteins, mitofusin 1 and 2 (MFN1/MFN2) and optic atrophic protein 1 (OPA1) (Hoppins and Nunnari, 2009), and the fission proteins, mitochondrial fission protein 1 (FIS1), dynamin-related protein1 (DRP1 or DNM1L), and mitochondrial fission factor (Lackner and Nunnari, 2009; Otera et al., 2010; Loson et al., 2013).
Modulation of the mitochondrial fission or fusion proteins regulates apoptotic responses. For example, inhibition of FIS1 protects from apoptosis (Lee et al., 2004; Wang et al., 2012), while FIS1 overexpression induces apoptosis (Alirol et al., 2006; Iwasawa et al., 2011; Zhang et al., 2016). Cell death inhibits MFN1-mediated fusion, while MFN1 and MFN2 overexpression protects from etoposide-induced apoptosis (Sugioka et al., 2004).
Autophagy, mitochondrial dynamics, and apoptosis are highly interrelated processes. For example, autophagy controls mitochondrial outer membrane permeabilization and apoptosis by regulating p53 upregulated modulator of apoptosis levels (Thorburn et al., 2014). Unc-51 like kinase1, an autophagy protein regulating mitophagy, was reported to induce mitochondrial apoptosis through ROS generation (Mukhopadhyay et al., 2015). Accordingly, mitochondria have been reported to modulate autophagic signaling (Nunnari and Suomalainen, 2012; Ouyang et al., 2012; Chaabane et al., 2013), including autophagosome formation and autophagic flux (Hailey et al., 2010; Graef and Nunnari, 2011; Las et al., 2011). Mitochondrial depolarization may occur naturally during mitochondrial fission or induce apoptosis (Rambold and Lippincott-Schwartz, 2011). The same proteins may partially regulate both autophagy and apoptosis. For example, the antiapoptotic protein BCL2 may interact with the proautophagic protein beclin1 (Decuypere et al., 2012), the proapoptotic protein Bax, and others to regulate autophagy and apoptosis (Erlich et al., 2007; Kang et al., 2011). This interaction of autophagy and apoptosis may determine the outcome of cellular stress (Maiuri et al., 2007; Nikoletopoulou et al., 2013; Marino et al., 2014). Hence, mitochondrial dysfunction may overwhelm prosurvival autophagy signaling, leading to apoptosis. However, the role of mitochondrial morphogenesis in high-glucose-induced autophagy remains unclear.
The object of this study is to validate the changes of apoptosis, mitochondrial morphogenesis, and autophagy and explore their possible linkage mechanisms.
Materials and Methods
Cell lines and chemical information
Human renal proximal tubular cells (HK2) (ATCC CRL-2190, BCRC 60097, Taiwan) were incubated in a humidified atmosphere with 5% CO2 at 37°C. Culture medium (Gibco) was prepared as follows: keratinocyte medium 500 mL, fetal bovine serum (FBS) 25 mL, and penicillin/streptomycin 5 mL. Glucose, 3-methyladenine (3-MA), and chloroquine (CQ) were purchased from Sigma-Aldrich.
Cell viability
Cell viability was measured using the crystal violet assay as previously described (Lee et al., 2015). Cells were seeded in 96-well plates (5 × 10³ cells/well). After overnight incubation, cells were treated with high or normal concentration of glucose for 24 h. The normal culture medium contained 5 mM glucose, and additional glucose was added to this medium to give a final concentration of 30 mM (high glucose) (Panchapakesan et al., 2013). For autophagy inhibition experiments, cells were cotreated with autophagy inhibitors [5 mM of 3-MA or 20 μM of CQ (Yen et al., 2015)] and high or normal concentration of glucose for 24 h. Following the drug treatments, cells were washed thrice with phosphate-buffered saline (PBS). Crystal violet reagent (0.5% in PBS) was added to these cells and the mix was incubated for 2 h at 37°C; the cells were then washed 10 times with PBS and air-dried. The cells were incubated with 100 μL of dimethyl sulfoxide for 1–2 h to completely dissolve the dye. Finally, the absorbance of these plates was read at 570 nm on a microplate reader.
Cellular apoptotic assay
Cells were seeded at a density of 8 × 10⁴ cells/well in a 12-well plate. After an overnight incubation, the cells were treated with the appropriate drugs. In the terminal deoxynucleotidyl transferase-mediated dUTP-biotin nick end labeling (TUNEL) assay, HK2 cells were treated with or without glucose for 24 h. After fixation with 4% paraformaldehyde, cells were incubated with blocking solution (10% FBS in PBS) for 30 min at room temperature. Next, cells were permeabilized with 0.1% (vol/vol) Triton X-100 in PBS and subsequently incubated with TUNEL reaction mixture (Roche) for 1 h at 37°C. They were observed by fluorescence microscopy (Olympus DP70; Olympus Corporation) under 400× magnification. The TUNEL intensity of apoptosis was measured using ImageJ (Helmy and Azim, 2012), a freely available java-based program developed at the National Institutes of Health. TUNEL intensity was measured and then normalized to cell number.
Mitochondrial fission rate
Mitochondrial morphology was assayed as previously described, with a slight modification (Brooks et al., 2007). In brief, 8 × 10⁴ cells/well were seeded in a 12-well plate. After overnight incubation, cells were treated with drug for 24 h. Mitochondria were stained using 100 nM MitoTracker Red CMXRos (Invitrogen, Life Technologies) for 10 min at 37°C. After washing twice with PBS, cells were fixed with 4% paraformaldehyde at room temperature for 10 min in the dark. After two washes with PBS, cells were permeabilized with 0.2% Triton X-100 in PBS at room temperature for 5 min. After PBS washing, cells were counterstained with 0.2 μg/mL of 4′,6-diamidino-2-phenylindole at room temperature for 10 min. After washing and mounting, cells were observed by fluorescence microscopy (Olympus DP70; Olympus Corporation) under 400 × magnification. Mitochondrial morphology images were blinded and scored independently by two experienced technicians in duplicate (n = 4). Mitochondria with punctate or fragmented patterns were regarded as fission type. The fission rate (%) was defined as the percentage of mitochondria with fission type among all counted mitochondria, that is, fission events/total (fission + intermediate + fusion types) × 100%.
Western blotting
Cells were seeded at a density of 3 × 10⁵ cells/well in a six-well plate. After an overnight incubation, cells were treated with normal or high glucose. Western blot analysis was carried out as previously described (Tain et al., 2013). In brief, cells were harvested by trypsinization and lysed in cell lysis buffer (PRO-PREPTM solution; Intron Biotechnology, Inc.). Protein (40 μg) sample was electrophoresed by sodium dodecyl sulfate–polyacrylamide gel electrophoresis. Subsequently, proteins were transferred to polyvinylidene difluoride membranes and blocked in TBST buffer for 1 h at room temperature. The primary antilight chain 3 (LC3)B 1:1000 (LC3B [D11] XP® Rabbit mAb #3868; Cell Signaling Technology) and anti-GAPDH 1:15,000 (GTX100118; GeneTex) were incubated at 4°C overnight. The membrane was incubated with secondary antibody (goat anti-rabbit) 1:3000 (SC-2004; Santa Cruz Technology) for 2 h at room temperature. The blots were visualized using Western Lightning Plus-ECL (PerkinElmer) and quantified by densitometry (Quantity One Analysis software; Bio-Rad) following background subtraction. Two independent drug-treated samples were used for western blot analyses.
Generation of MFN1 knockdown HK2 cells
The protocol and procedures of generation of gene knockdown cell lines were detailed in our previous work (Lee et al., 2010). Briefly, HK2 cells were transfected with SureSilencing MFN1 short hairpin RNA plasmids (SABiosciences) carrying sequences representing one of four targets on the MFN1 mRNA or a control scrambled sequence that did not match any human cDNA (by a BLAST search), under the control of a U1 promoter. Cells were transfected using the Metafectene Pro (Biontex) kit according to the manufacturer's instructions. In brief, 2 μg plasmid was mixed with 6 μL Metafectene in 100 μL serum-free and antibiotic-free culture medium for transfection. Cells were cultured in G418 culture medium, comprising HK2 cell culture medium containing 100 μg/mL of G418, and individual colonies were picked and grown as separate clones. Cells were maintained at 37°C, 5% CO2; they were passaged when confluent and not used beyond passage 18.
Small interfering RNAs for MFN2 and FIS1
Small interfering RNAs (siRNA) have been widely applied in renal proximal tubular epithelial cells (Ding et al., 2011; Bai et al., 2012). We carefully performed siRNA experiments along with appropriate controls and avoided potential pitfalls as described previously (Lee et al., 2008). siMFN2 and siFIS1 oligonucleotides were purchased from Sigma-Aldrich. siRNA transfections were performed in a 12-well plate. Each treatment was performed in triplicate. Cells were plated at a density of 8 × 10⁴ cells/well in plating medium for growth overnight. The medium was replaced with fresh plating medium 30 min before transfection. For each well, 1 μL of siMFN2 or siFIS1 and 3 μL of Metafectene Pro (Biontex T040-1.0) were diluted in 100 μL of serum/antibiotic-free medium in two separate tubes and incubated at room temperature for 5 min. Transfection mix was made by mixing the solutions of these two tubes and incubated for 30 min at room temperature. Subsequently, 800 μL of transfection mix was added dropwise into each well to generate 20 nM siRNA. After gentle rocking, the plate was placed in an incubator with 5% CO2 at 37°C.
Transmission electron microscopy
Cells were seeded at a density of 2 × 10⁵ cells/well in a six-well plate. Following an overnight incubation, cells were treated with normal or high glucose for 24 h. The protocol and method for transmission electron microscopy (TEM) were detailed in our previous report (Wang et al., 2014).
Briefly, cell culture samples were prefixed with 2.5% glutaraldehyde in 0.1 M PBS for 2 h at room temperature. Subsequently, cells were centrifuged for 10 min. After a 15-min wash in 0.1 M PBS, the samples were postfixed in 1% osmium tetroxide and 0.1 M PBS for 1 h and washed with PBS for 15 min before standard ethanol dehydration. Following embedding and sectioning, ultrathin sections were examined with the JEM-1230 transmission electron microscopes (JEOL).
Statistical analysis
Data are expressed as the mean ± standard deviation. Group differences in mitochondrial fission rate were analyzed by one-way analysis of variance with Tukey's HSD post hoc test (JMP® 9 software). Other data were based on the comparison between the test data with the controls using Student's t-test.
Results
Cell viability, apoptosis, and mitochondrial morphology in glucose-treated HK2 cells
The cell viability of high-glucose-treated HK2 cells was decreased compared with control cells (Fig. 1A). Compared with control, high glucose induced apoptosis in HK2 cells as determined by TUNEL staining (Fig. 1B, C), cell morphology (Fig. 1D, E), and induced mitochondrial fragmentation (Fig. 2) as determined by mitotracker staining.
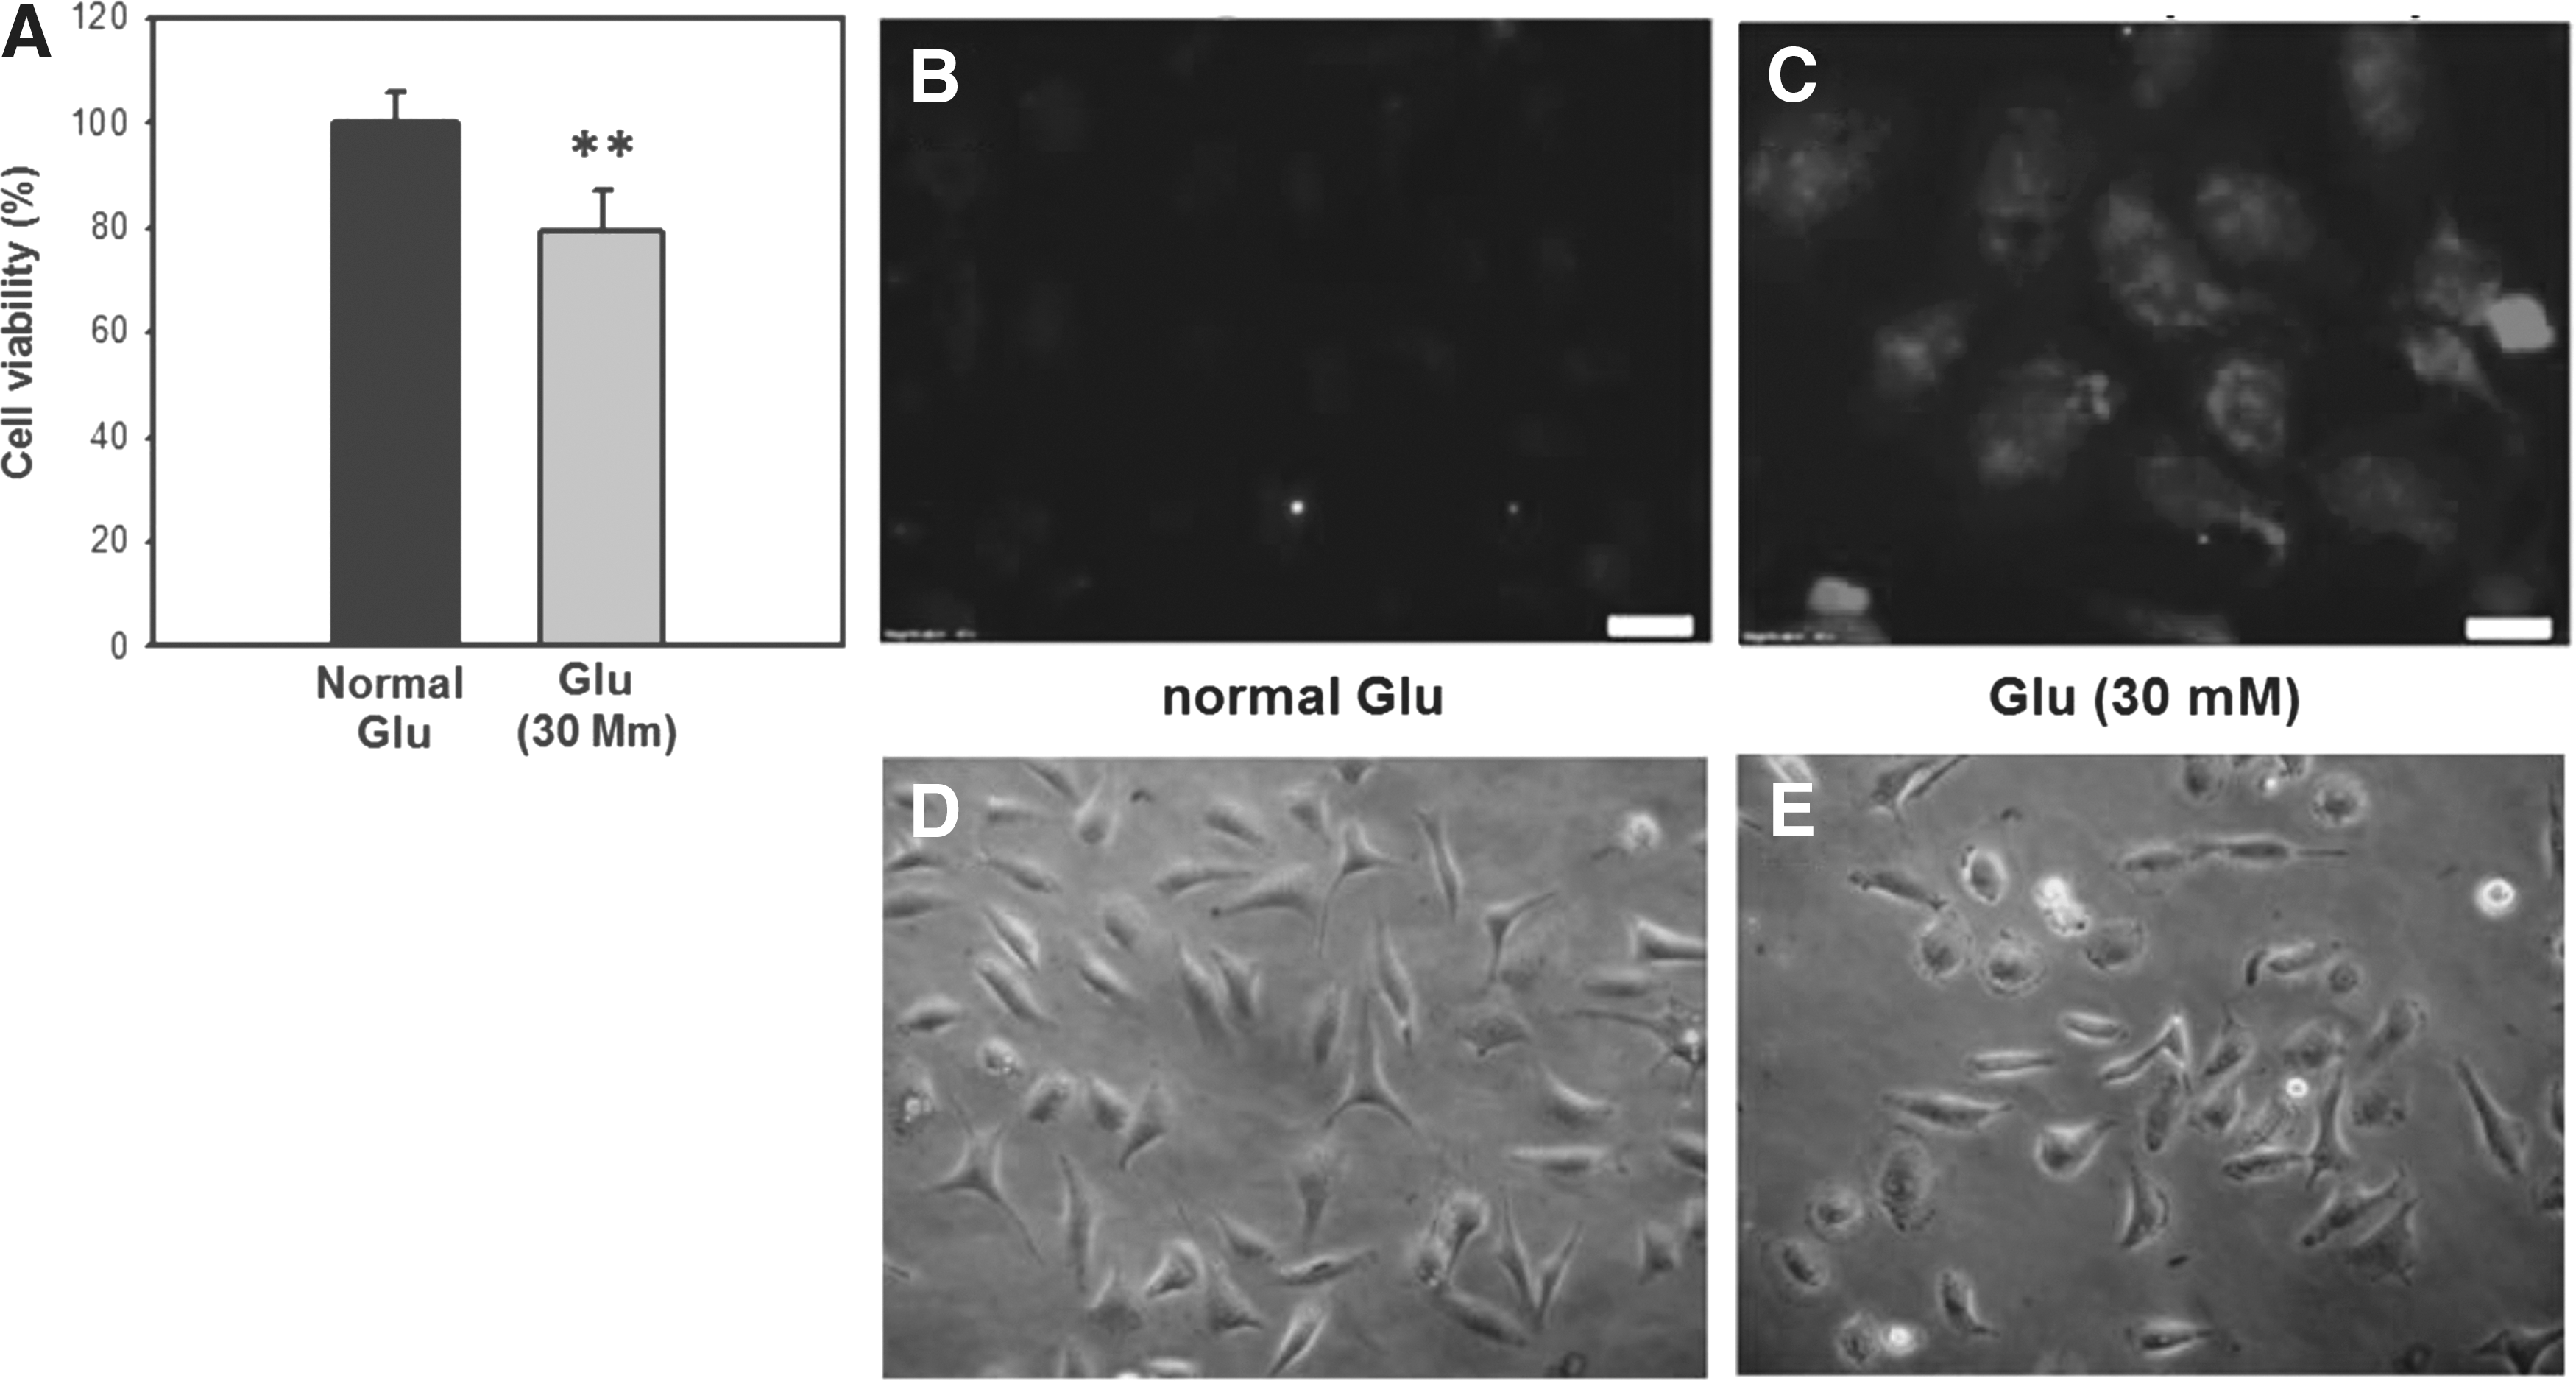
Cell viability and apoptosis in glucose-treated HK2 cells.
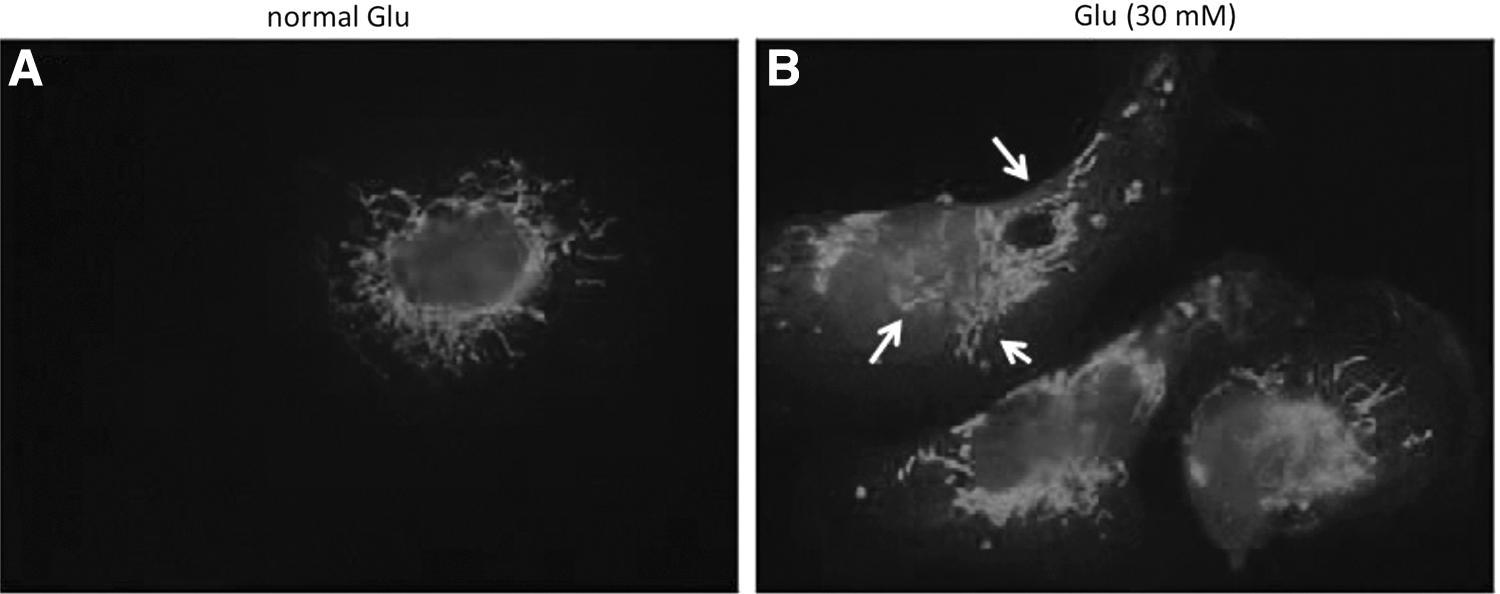
Mitochondrial morphology in glucose-treated HK2 cells. Cells were treated with normal (5 mM) and high (30 mM) glucose for 24 h. Mitochondrial fragmentation was detected by mitotracker staining.
Apoptotic and mitochondrial fragmentation effects of glucose-treated MFN1 knockdown HK2 cells
Because the apoptotic response may correlate with changes in mitochondrial morphogenesis (Sugioka et al., 2004; Youle and Karbowski, 2005), which is governed by fusion and fission proteins, we were interested in investigating the role of FN1 in glucose-treated HK2 cells. When cultured with high glucose, the MFN1-depleted cells (mitochondrial fission dominant) displayed more intense TUNEL staining (Fig. 3B, D) and mitotracker staining (Fig. 3G, I) compared with HK2 control cells (Fig. 3A, C, F, and H), respectively. These results suggest that MFN1(−) HK2 cells were more susceptible to high-glucose-induced apoptosis (p < 0.001) (Fig. 3E) and mitochondrial fragmentation (p < 0.005) (Fig. 3J).
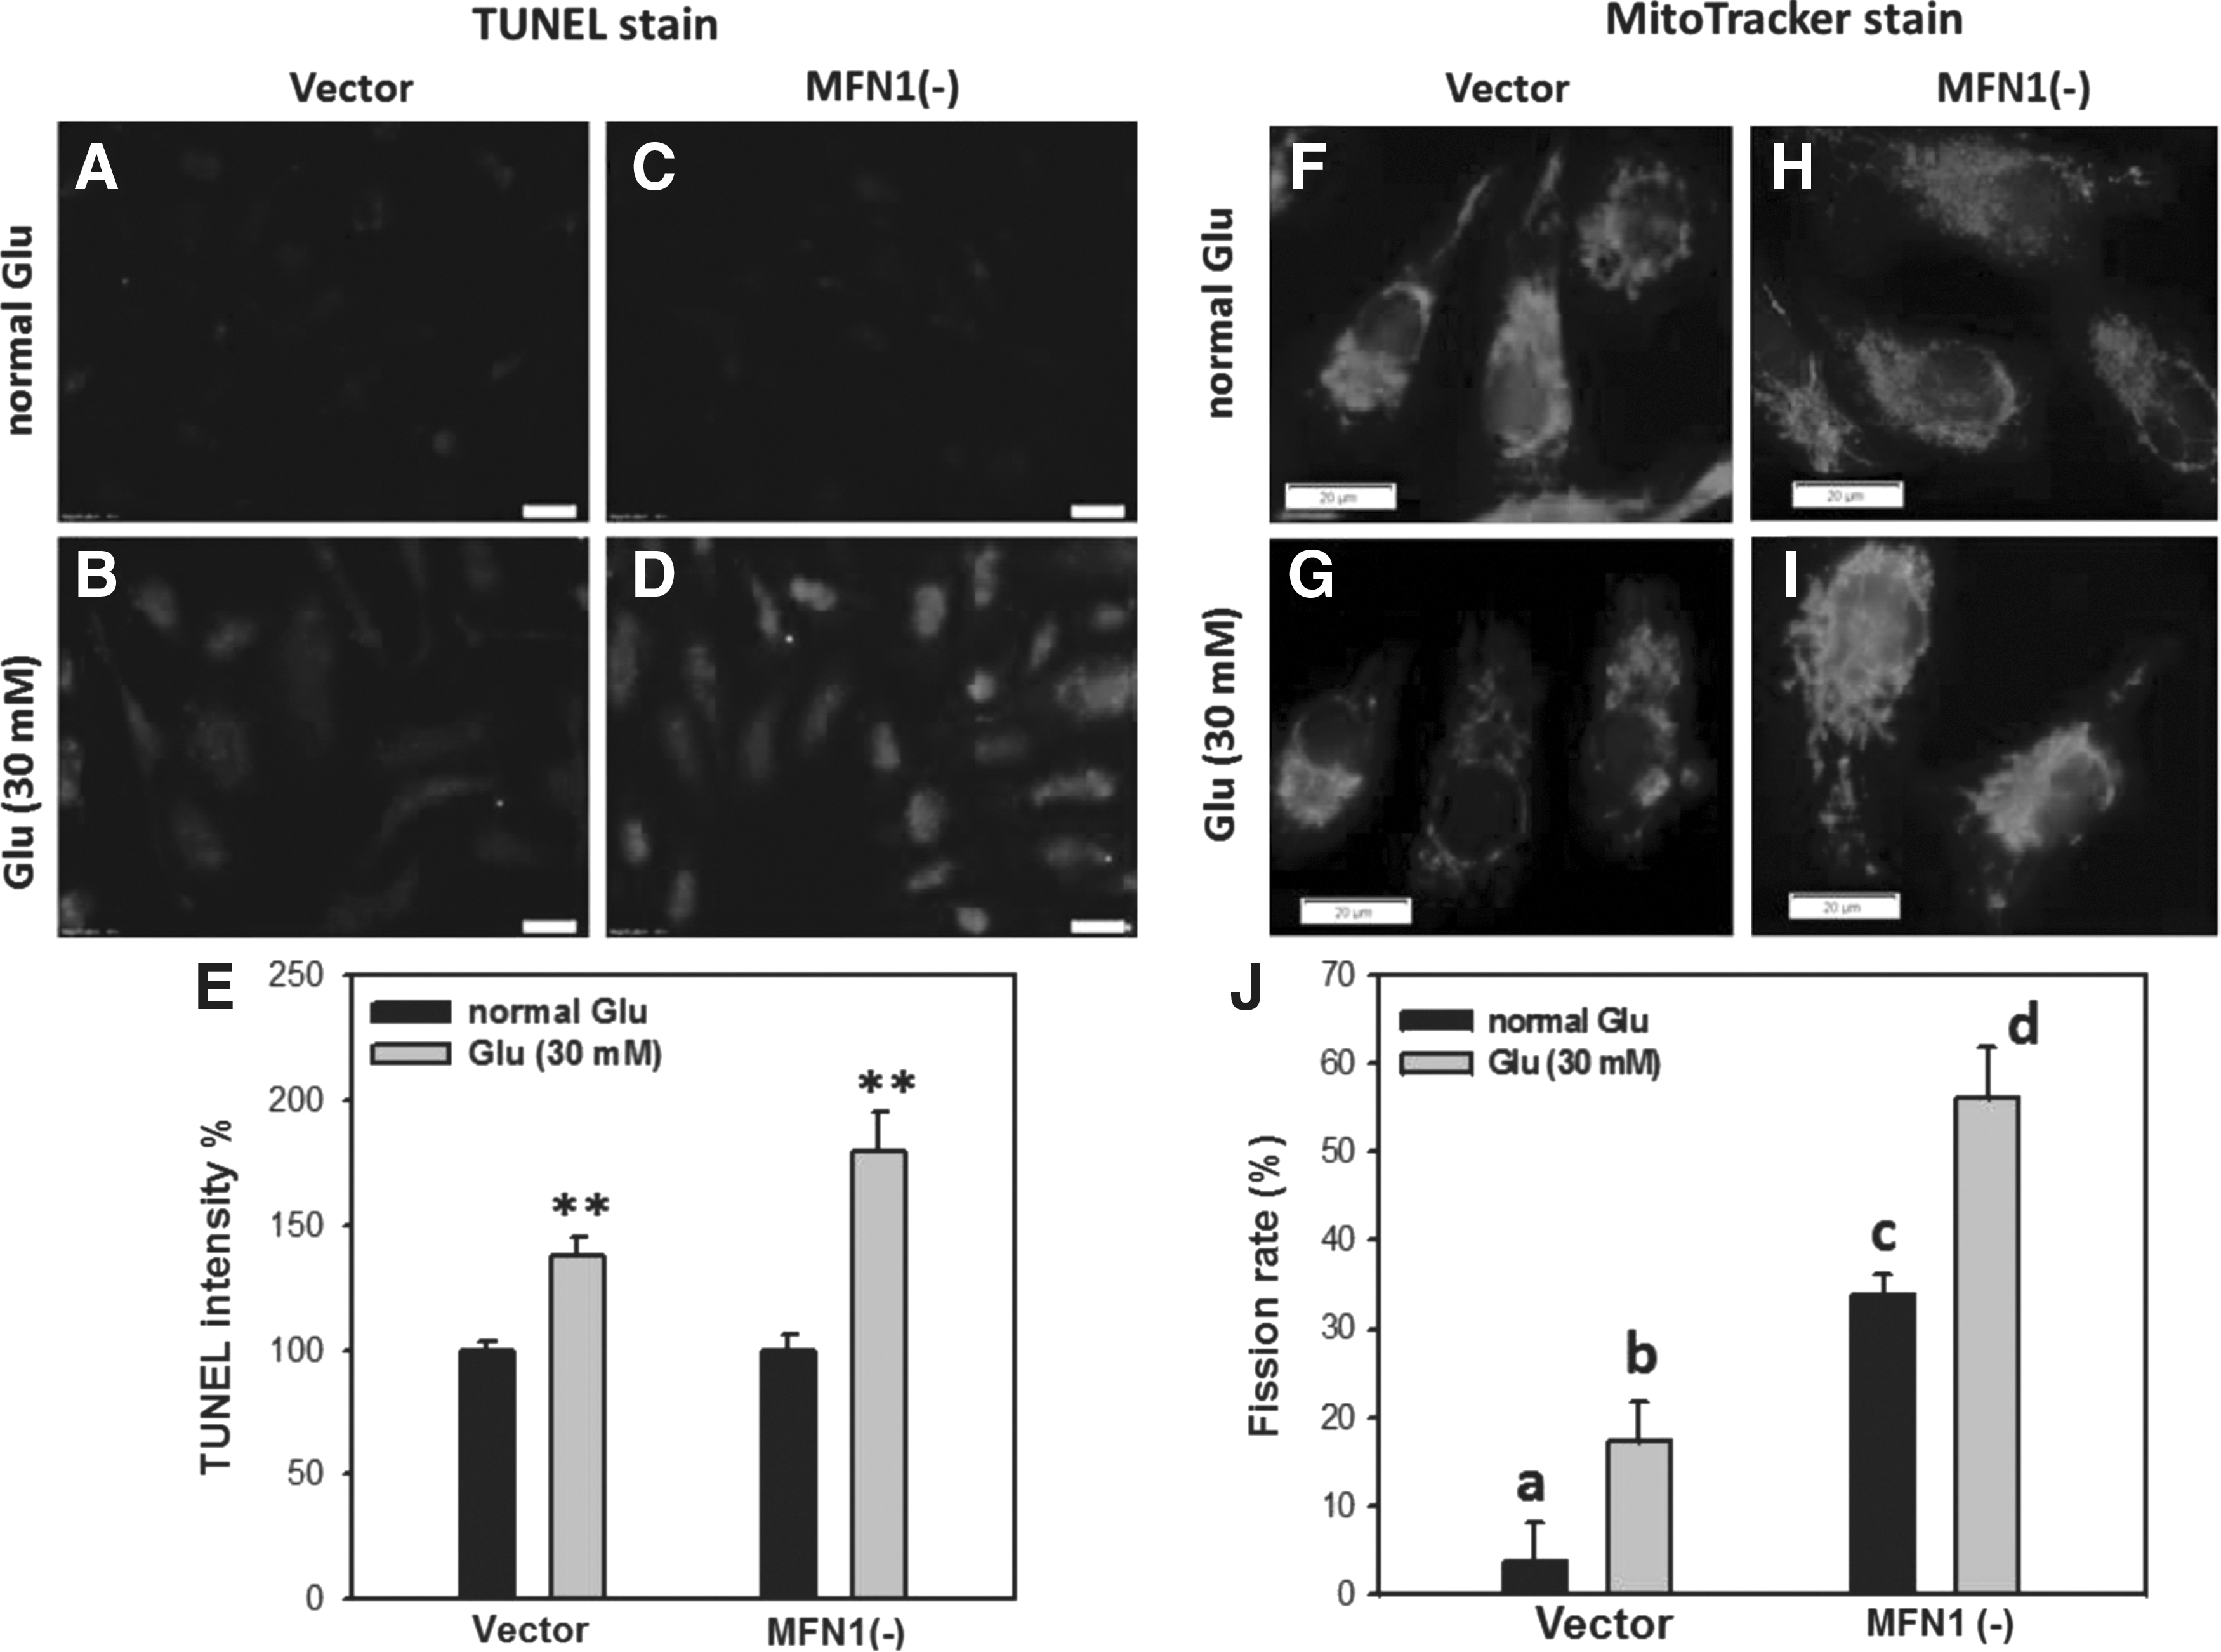
TUNEL and mitotracker staining of glucose-treated MFN1-depleted HK2 cells. Cells were treated with normal (5 mM) and high (30 mM) glucose for 24 h. shRNA of MFN1 was used to establish the stably MFN1-depleted HK2 cells [HK MFN1(−)]. These cells were observed at 24 h using fluorescence microscopy under 400× magnification.
Mitochondrial morphology of MFN2 or FIS1 siRNA-transfected HK2 cells
When MFN2 was depleted and cells incubated with a normal glucose concentration, mitochondria became more fragmented (mitochondrial fission dominant) compared with siScramble control (Fig. 4A, B). In contrast, when the mitochondrial fission protein FIS1 was knocked down, mitochondria became less fragmented (mitochondrial fusion dominant), similar to siScramble control (Fig. 4A, C). Under normal glucose incubation, the fission rate difference between siMFN2 and siFIS1/siScramble-transfected HK2 cells was significant (p < 0.001) (Fig. 4G).
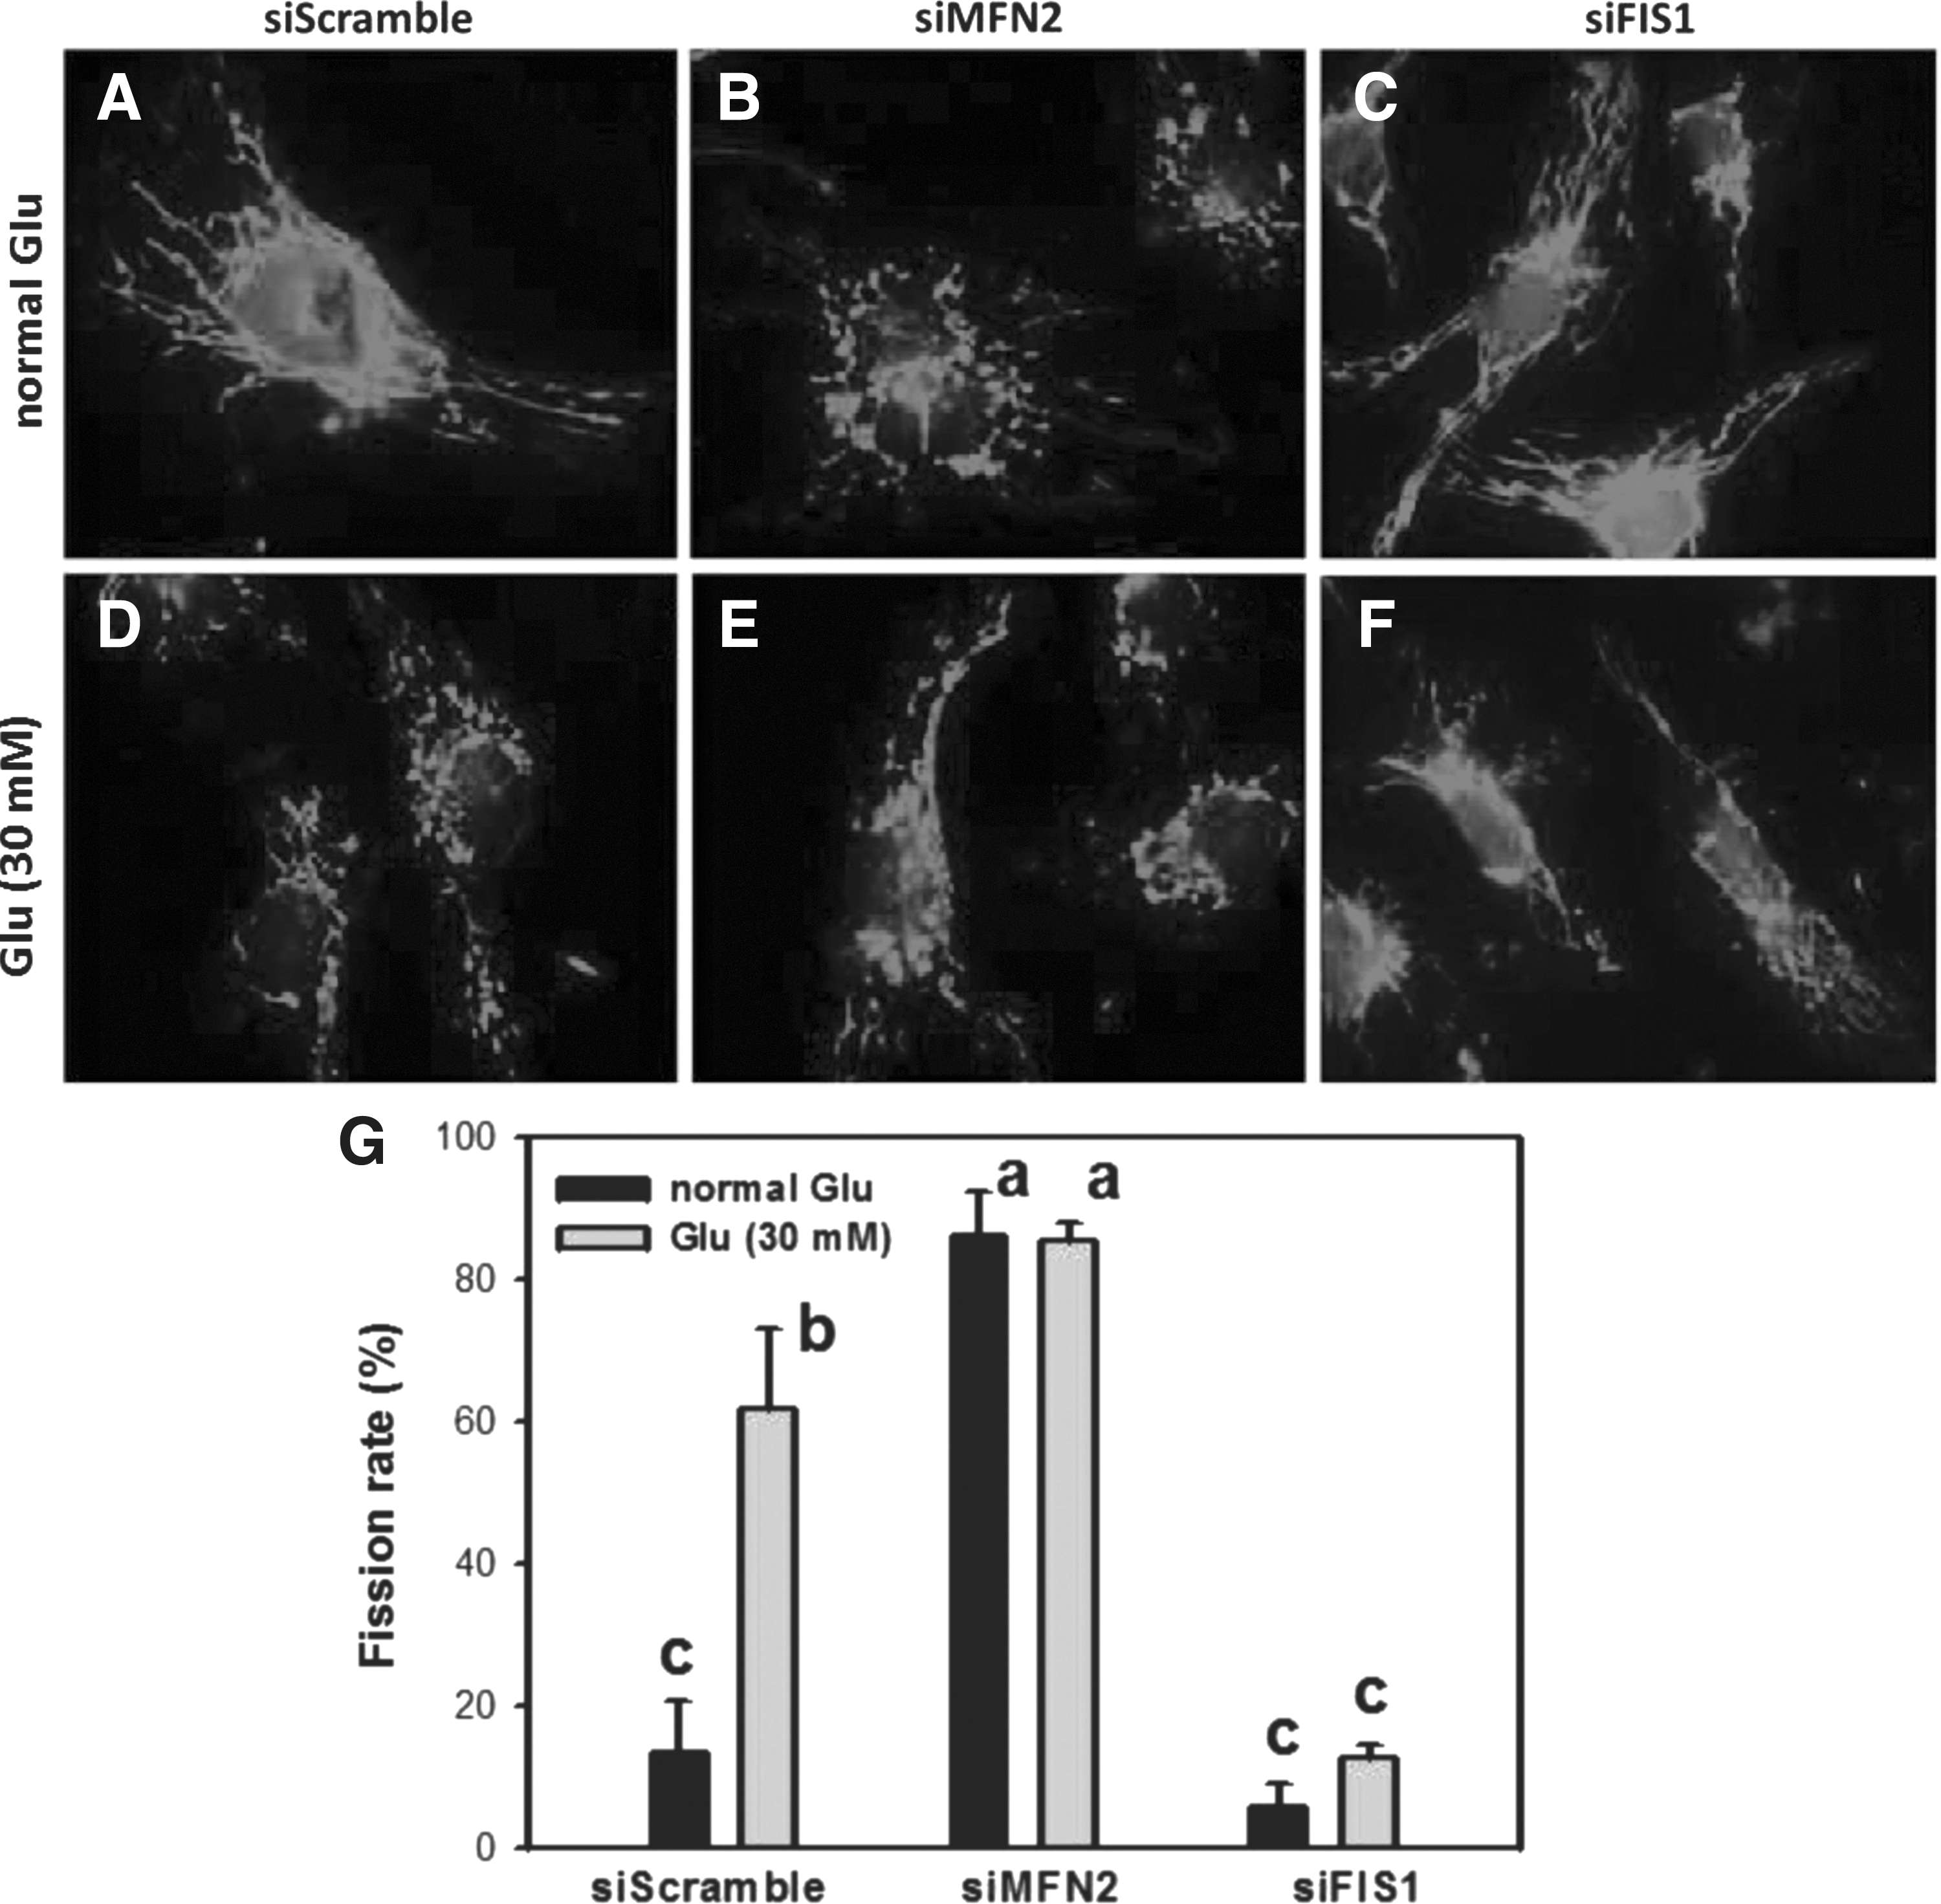
Mitochondrial morphology in siMFN2- and siFIS1-transfected HK2 cells. Mitochondrial fragmentation was detected by mitotracker staining at 24 h.
Under high glucose, mitochondria of MFN2 knockdown HK2 cells were highly fragmented, similar to siScramble controls (Fig. 4E vs. 4D). In contrast, FIS1 knockdown mitochondria were not as severely fragmented as those in MFN2 knockdown HK2 cells and siScramble control under high-glucose incubation (Fig. 4F vs. 4E, D). The fission rate difference between siMFN2, siFIS1, and siScramble-transfected HK2 cells was significant during incubation with high-glucose medium (p < 0.05) (Fig. 4G).
Autophagy in high-glucose-treated HK2 cells
We evaluated the role of autophagy in high-glucose-induced cell death. In glucose-treated HK2 cells, autophagosome formation was observed by TEM (Fig. 5A) and the key autophagy marker LC3B-II was increased, as observed by western blot (left side of Fig. 5B). The role of autophagy in cell viability of high-glucose-treated HK2 cells was further examined by the addition of autophagy inhibitors. Cell viability was significantly decreased by 3-MA or CQ cotreatment with high glucose in HK2 cells (Fig. 5C).
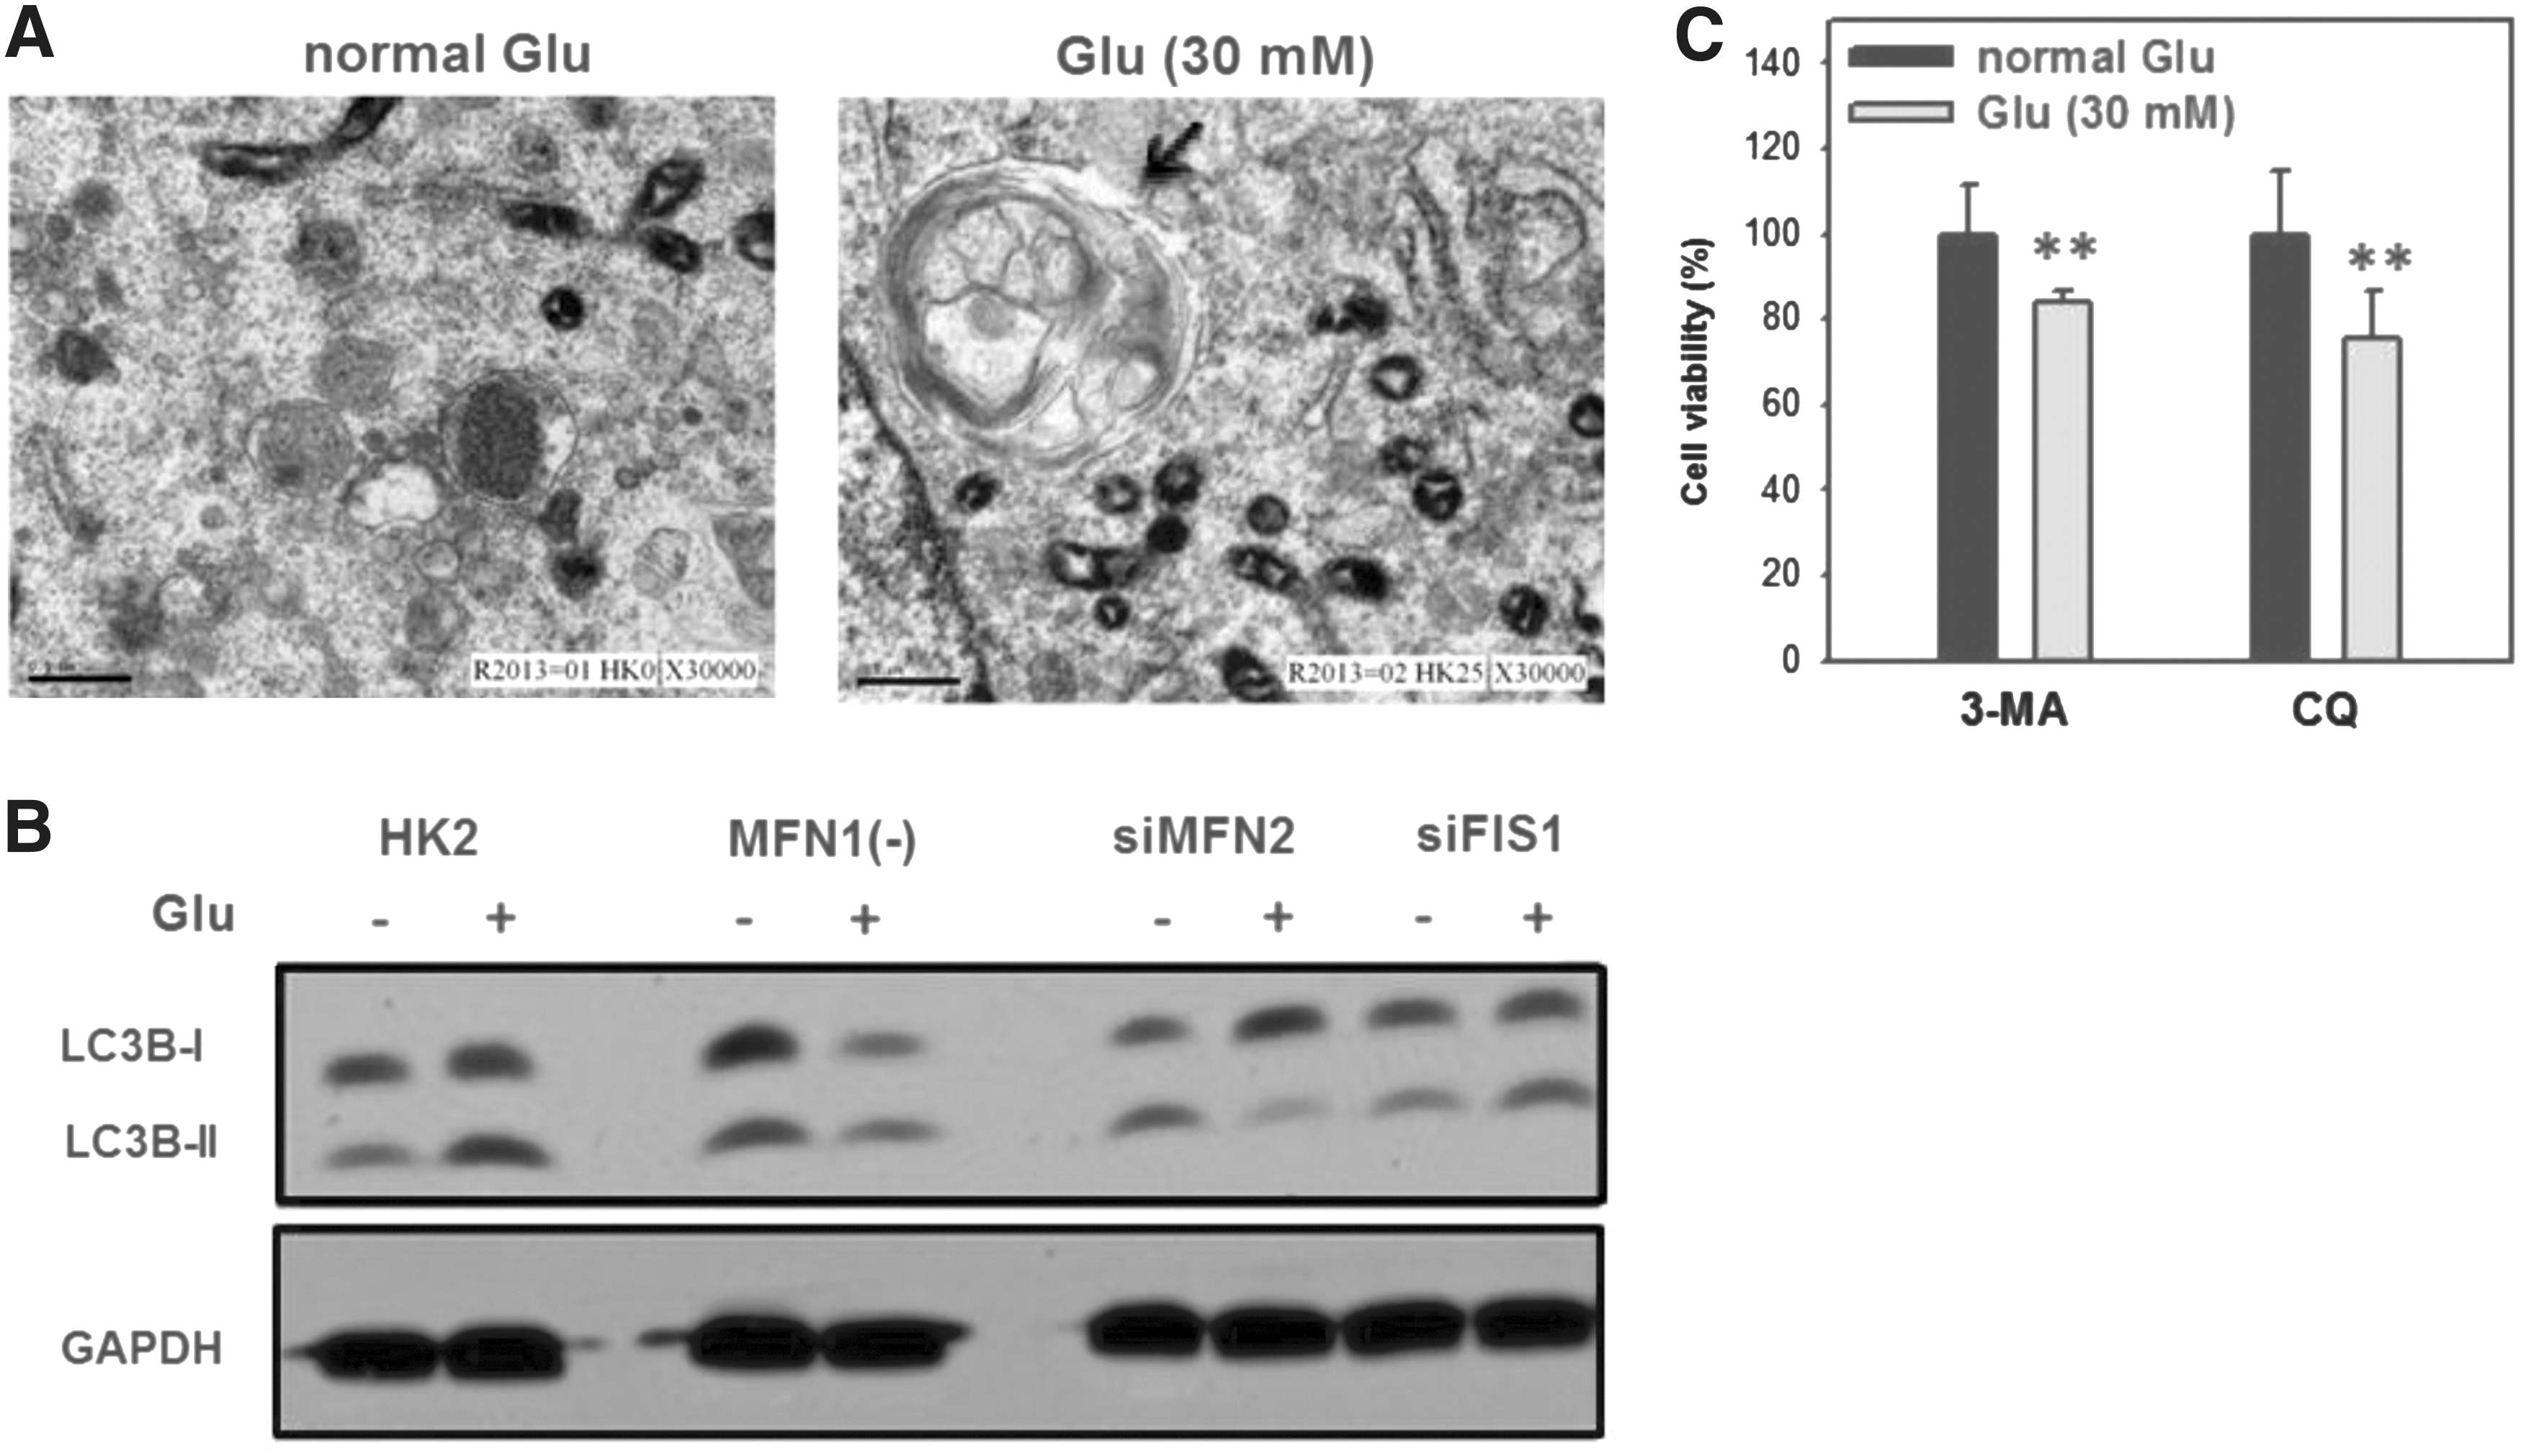
The relationship between autophagy and mitochondrial fission/fusion in glucose-treated HK2 cells. Cells were treated with normal (5 mM) and high (30 mM) glucose for 24 h.
Relationship between autophagy and mitochondrial fission/fusion in high-glucose-treated HK2 cells
We next tried to dissect the link between autophagy and mitochondrial morphogenesis. The autophagy responses of high-glucose-treated HK2 cells, siMFN2, or siFIS-1-transfected HK2 cells were compared in terms of LC3 shift. In both MFN1(−) cells and siMFN2 HK2 cells (mitochondrial fission dominant), high-glucose-induced LC3B-II levels were decreased compared with normal glucose controls (middle of Fig. 5B). In contrast, the high-glucose-induced LC3B-II levels of siFIS1 HK2 cells (mitochondrial fusion dominant) were increased compared with normal glucose controls (right side of Fig. 5B).
Discussion
In the present study, we demonstrated that high glucose could induce mitochondrial fragmentation and shift mitochondria to fission morphology in HK2 cells (Fig. 2). Similarly, mitochondrial fission was reported to mediate high-glucose-induced cell death in neonatal rat ventricular myocytes in hyperglycemic conditions (Yu et al., 2008). These results suggest that high glucose may induce mitochondrial fragmentation in various cell types.
Upon further examination of the role of mitochondrial morphogenesis in high-glucose-induced apoptosis, we found that MFN1-depleted HK2 cells [MFN1(−)] had increased levels of apoptosis compared with controls (Fig. 3). These results suggest that fission-type HK2 cells [MFN1(−)] were more sensitive to high-glucose-induced apoptosis. Moreover, mitochondrial fission is an early apoptotic event (Frank et al., 2001). Consistently, we found that another fission-type HK2 (siRNA MFN2-transfected HK2 cells) displayed increased mitochondrial fragmentation (up to 80%) with or without high-glucose treatments (Fig. 4G). In contrast, fusion-type HK2 cells (siRNA FIS1-transfected HK2 cells) displayed very little mitochondrial fragmentation. High glucose only slightly enhanced mitochondrial fragmentation in siFIS1 HK2 cells (Fig. 4G).
The fragmentation of mitochondria by fission has been reported to be an essential step for autophagy (Twig et al., 2008). The selective degradation of mitochondria (mitophagy) is connected to mitochondrial fission (Narendra et al., 2008). For example, parkin may be specifically recruited to damaged mitochondria and induce mitophagy (Narendra et al., 2008). Upon oxidative stress, mitochondrial fission may generate some daughter mitochondria with low mitochondrial membrane potential for autophagy (Gomes and Scorrano, 2008; Twig et al., 2008). Accordingly, the imbalance of mitochondrial fission and fusion may contribute to oxidative stress and apoptosis (Seo et al., 2010).
Recently, the protective role of autophagy has been reported in several types of cells with different treatments. In one study, autophagy was reported to protect kidney proximal tubular epithelial cells from mitochondrial metabolic stress by cyclosporin A, a frequently used immunosuppressant (Kimura et al., 2013). The protective role of autophagy was also reported in high-glucose-induced cell death in human retinal pigment epithelium (Yao et al., 2014) and high-glucose-promoted autophagy flux in podocyte cultures (Lenoir et al., 2015). The addition of autophagy inhibitors may further validate the protective role of high-glucose-treated kidney proximal tubular epithelial cells. For example, autophagy inhibitors such as CQ and 3-MA were reported to exacerbate Oil Red O staining-based lipid accumulation, which was closely related to autophagy (Xu et al., 2015). We provide direct evidence to demonstrate the protective role of autophagy in high-glucose-treated HK2 cells by survival assays (Fig. 5C).
Although cell stress may induce mitochondrial fission, apoptosis, and autophagy, the role of mitochondrial morphogenesis (the balance of fission and fusion) in autophagy induced by cell stress remains unclear. Recently, a fatty acyl transferase endophilin B1 was reported to regulate mitochondrial morphogenesis (Karbowski et al., 2004). Cells derived from endophilin B1−/− mice were found to be autophagy deficient. These results suggest that there is a cross talk between mitochondrial fission and autophagy. In the present study, we found that LC3B-II levels in fission type of HK2 cells [MFN1(−) and siMFN2] were decreased compared with control (Fig. 5B), suggesting that mitochondrial fission inhibits high-glucose-induced autophagy responses. In fusion-type HK2 cells (siFIS1), mitochondrial fusion enhanced high-glucose-induced autophagy responses by increasing LC3B-II levels compared with controls. Accordingly, these results highlight the potential role of mitochondrial morphogenesis (in terms of fission/fusion interchange) in autophagy modulation and subsequently apoptosis modulation in high-glucose-treated HK2 cells. Therefore, mitochondrial morphogenesis may be pivotal for autophagy, with changes in mitochondrial function modulating the autophagic process. In addition to MFN1, MFN2, and FIS1, OPA1 and DRP1 are also important in regulating mitochondrial fusion and fission, respectively (Cai and Tammineni, 2016). Consistently, our preliminary experiments found that DRP1 protein expression was increased in high-glucose-treated HK2 cells (data not shown). Accordingly, further investigation of the role of OPA1 and DRP1 in regulating high-glucose-induced apoptosis, mitochondrial morphogenesis change, and autophagy is warranted.
High glucose was reported to induce hyperosmolarity in human glomerular mesangial cells (del Nogal et al., 2014) and diabetic retinopathy (Madonna et al., 2016). High-glucose-induced hyperosmolarity also leads to apoptosis of several kinds of cells (McGinn et al., 2003; Turina et al., 2006; Yang et al., 2016). Similarly, hyperosmolarity in diabetes is mainly derived from high blood sugar levels (American Diabetes Association, 2009; Kitabchi et al., 2009). Therefore, reducing high blood sugar level with insulin or oral hypoglycemic drugs may alleviate diabetic nephropathy. Alternatively, mitochondrial fission proteins have been discussed as a therapeutic target for diseases with oxidative stress and mitochondrial dysfunction (Reddy, 2014). Since DRP1 can mediate mitochondrial fission, several chemical inhibitors of DRP1, including Mdivi-1 (Yeon et al., 2015) and the selective peptide inhibitor P110 (Qi et al., 2013), were developed. Mdivi-1 was reported to uncouple mitochondrial fission and Bax-mediated apoptosis (Tanaka and Youle, 2008). P110 was found to reduce excess mitochondrial fission and neurotoxicity (Qi et al., 2013). In the current study, we found that high glucose induced mitochondrial fission. Accordingly, pretreatment with these mitochondrial fission inhibitors may be a promising therapy in diabetic nephropathy.
Conclusions
Our results show that high glucose induces mitochondrial fragmentation and apoptosis in proximal tubular cells. In response to glucose-induced mitochondrial fragmentation, the autophagy machinery may be activated to protect the mitochondrial damages. However, severe mitochondrial damage such as that observed in fission-type cells by knocking down MFN1 or MFN2 may overwhelm the prosurvival autophagy pathway and lead to apoptosis. Valuably, we have uncovered the connection between mitochondrial morphogenesis, apoptosis, and autophagy in renal proximal tubular epithelial cells by genetically manipulating mitochondrial fusion/fission.
Footnotes
Acknowledgments
This work was partly supported by funds of the Ministry of Science and Technology, Taiwan (MOST 104-2320-B-037-013-MY3), the Kaohsiung Chang Gung Memorial Hospital (CMRPG850273, CMRPG890672, CMRPG8B1441, and CMRPG 8B0531-32), and the National Sun Yat-Sen University-KMU Joint Research Project (#NSYSU-KMU 105-p022).
Disclosure Statement
No competing financial interests exist.