
Abstract
Heterotrimeric G proteins, which are composed of Gα and Gβγ subunits, transduce signals sensed by the coupled surface receptors. Aberrant expressions of G proteins have been observed in many cancer types. This study aimed to determine the expression level of the stimulatory G protein alpha S subunit (Gαs, the main transcript encoded by the GNAS locus) and its biological function in renal cell carcinoma (RCC). Western blotting and quantitative reverse transcription-PCR results show that Gαs expression dramatically increased in RCC cell lines (ACHN, GRC-1, and 786-O) compared to normal renal epithelial cells HK-2. Knockdown of Gαs by small interfering RNA (siRNA) caused a significant inhibition on proliferation of ACHN cells as indicated by MTT assay and colony formation assay. Overexpression of Gαs in HK-2 cells promoted cell proliferation and led to a higher level of intracellular cyclic adenosine monophosphate (cAMP) in response to parathyroid hormone (PTH) compared to the cells transfected with empty vector. Notably, the growth of HK-2 cells overexpressing Gαs was efficiently inhibited in the presence of protein kinase A (PKA) inhibitor H89. Furthermore, in a xenograft model by subcutaneous injection of ACHN cells, tumor growth was also suppressed by H89. Taken together, these results suggest that Gαs plays a tumor-promoting role in RCC and possibly acts through a PKA-dependent pathway. Our findings may provide new clues for target therapy for RCC in the future.
Introduction
R
Heterotrimeric G proteins that are coupled with surface receptors relay extracellular signals to specific intracellular proteins, for example, the well-known adenylyl cyclase (AC), a cognate effector of the GTP-bound stimulatory G protein alpha S subunit (Gαs), which dissociates from G protein complex upon ligand–receptor engagement (Miao and McCammon, 2016). Activated AC catalyzes the formation of cyclic adenosine monophosphate (cAMP) using ATP as substrate. Then, the second messenger cAMP activates protein kinase A (PKA), and PKA further phosphorylates downstream effectors to regulate cellular functions (Lefkimmiatis and Zaccolo, 2014). This classic G protein-coupled receptor-PKA signaling pathway is known to play important roles in cell proliferation, survival, and motility under physiological conditions, as well as in cancer (Bar-Shavit et al., 2016). Supporting this, aberrant expressions of G proteins have been observed in many cancer types, and the presence of GNAS mutations has been reported in tumors originating from diverse tissues, including the kidney (O'Hayre et al., 2013). Although activating mutations of GNAS were observed in renal cancer (Kalfa et al., 2006), the biological consequence of a constitutive Gαs signaling remains unknown.
In this study, we aimed to determine the expression level of Gαs and its biological significance in RCC cells. Our work may provide new insights into the role of Gαs in renal cancer development and the preclinical value of Gαs in renal cancer therapy.
Materials and Methods
Cell lines
RCC cell line 786-O was ordered from American Type Culture Collection. RCC cell lines ACHN and GRC-1, human normal renal epithelial cell line HK-2, human lung carcinoma cell line A549, human ovarian carcinoma cell line OVCAR3, and human hepatocellular carcinoma cell line HepG2 were obtained from Cell Bank of Chinese Academy of Sciences (Beijing, China). ACHN, 786-O, GRC-1, HK-2, and OVCAR3 cells were grown in RPMI 1640 (GIBCO, Invitrogen, Beijing, China) with 10% fetal bovine serum (Hyclone), 2 mM
Plasmid and small interfering RNA
The mammalian expression vector harboring sequence encoding Rat (R. norvegicus) Gαs was obtained from Addgene (No. 24499). The plasmid after amplification and purification was used to transfect HK-2 cells using lipofectamine 2000 (Invitrogen, Beijing, China) according to the supplier's instructions. Small interfering RNA (siRNA) duplexes were synthesized at GenePharma (Shanghai, China).
Western blotting analysis
Cells were harvested and washed twice with phosphate-buffered saline (PBS). The cell lysis buffer contained 25 mM HEPES pH 7.5, 150 mM NaCl, 0.5% NP-40, and 0.1% sodium dodecyl sulfate (SDS) plus proteinase inhibitor cocktail (Sigma-Aldrich, St. Louis, MO). The protein concentration of cell lysate was determined using the Pierce BCA protein assay kit (Thermo Fisher Scientific, Beijing, China). Then 30 μg of proteins were loaded on premade 8–15% SDS polyacrylamide gel (Invitrogen) for separation and then electrotransferred onto a nitrocellulose membrane. The blots were incubated in PBS buffer with 5% defat milk and 0.02% Teween-20 at room temperature for 1 h before primary antibody incubation overnight at 4°C. Rabbit polyclonal antibody against human G protein alpha stimulatory subunit (Cat No. BML-SA131) was purchased from Enzo Life Science, Inc. (Farmingdale, NY). Horseradish peroxidase (HRP)-conjugated secondary antibody (Jackson Immunoresearch Laboratory) incubation was conducted at room temperature for 1 h. SuperSignal West Pico Chemiluminescent Substrate (Pierce; Thermo Scientific) was used for visualization of immunoreactive proteins.
Quantitative reverse transcription-PCR
Total RNA extraction was conducted using Trizol reagent (Invitrogen, Carlsbad, CA) according to the manufacturer's instructions. The total RNA was used for complementary DNA (cDNA) synthesis with the Super-Script II Kit (Qiagen, Hilden, Germany). Real-time polymerase chain reaction (PCR) was performed using SYBR Green PCR master mix (Roche) on the ABI StepOne Plus real-time PCR System (Applied Biosystems). GAPDH gene served as endogenous control and the relative level of GNAS messenger RNA (mRNA) was calculated using −ΔΔCT method. Specific primers were designed based on the reference mRNA sequence in GenBank (NM_006496) using NCBI primer blast tool. The primer sequences are as following: forward primer (5′->3′) TTAGCTGGCAGTGCTGAAGAA, and reverse primer (5′->3′) CCCACCATCTCGCCATAACC.
MTT assay
RCC cells were seeded in a 96-well plate at 5 × 10³ cells/well. Next day, cells were transfected with control siRNA or target siRNA. After incubation for 24 h, 20 μL MTT (5 mg/mL; Sigma-Aldrich) were added to each well and the plate was kept in a cell culture incubator for another 4 h. Then, the medium was removed by aspiration and 100 μL dimethyl sulfoxide were added into each well. The absorbance at 490 nm of each well was measured.
Soft agar colony formation assay
Soft agar colony formation assay followed the previously demonstrated protocol (Borowicz et al., 2014). With modifications, the colony was directly imaged in bright light field without crystal violet staining.
cAMP measurement
Cell lysates were prepared for measurement of intracellular cAMP level using the cAMP direct immunoassay kit (BioVision, Inc., Milpitas, CA) according to manufacturer's instructions. The cAMP level was represented as pmol/mL.
Xenograft model
The Medical Ethics Committee of Tianjin Medical University approved the protocols involving animal model in this study. 5 × 10⁶ACHN cells in 100 μL of sterilized saline were injected subcutaneously into the left armpit of 4-week-old male nude mice (n = 3 for each group). Seven days later, the mice started to be administered with PKA inhibitor H89 (1 mg/kg weight) or vehicle (1% dimethyl sulfoxide [DMSO]) twice a week by intraperitoneal injection. Four weeks upon implantation, mice were sacrificed and the tumor weight was measured.
Statistical analysis
All experiments in this study were repeated at least thrice. The numerical data were expressed as mean ± standard deviation. The unpaired two-sided t-test was performed for the comparison on mean value between two groups. p < 0.05 was considered statistically significant.
Results
Increased expression of Gαs in RCC cell lines
Western blotting results showed the high expression level of Gαs in RCC cell lines ACHN and GRC-1, followed by the medium level of Gαs in RCC cell line 786-O when compared to normal epithelial cell line HK-2 (Fig. 1A). In addition, the high expression of Gαs was also found in hepatocellular carcinoma cell line HepG2, but not in lung carcinoma cell line A549 and ovarian carcinoma cell line OVCAR3, which apparently showed a basal level of Gαs expression as that in HK2 cells. Quantitative RT-PCR results revealed that the mRNA level of GNAS in different cell lines corresponded to the protein level of Gαs in their counterparts, being high to ACHN, GRC-1, and HepG2, medium to 786-O, and low to HK2, A549, and OVCAR3 (Fig. 1B). Interestingly, besides Gαs, we also observed the elevation of Gβ subunit in RCC cell lines, showing a tendency similar to that of Gαs (Fig. 1C).

High expression of Gαs was detected in RCC cell lines.
Gαs influenced cell proliferation
Knockdown of Gαs was achieved with siRNA duplexes targeting GNAS, as evidenced by Western blotting analysis (Fig. 2A). ACHN cells transfected with Gαs siRNA or control siRNA were subjected to the MTT assay at different timings. Results showed that the growth rate of ACHN cells under Gαs siRNA treatment was much slower than that in control (Fig. 2B). Moreover, colony formation assay showed that the knockdown of Gαs led to a significant reduction of colonies formed on soft agar plate relative to the control, suggesting that Gαs may play a role in cell proliferation (Fig. 3). Furthermore, we examined the effects of overexpression of Gαs in HK2 cells on cell proliferation. The MTT assay indicated that HK2 cells transfected with vector harboring Gαs cDNA had a significantly higher growth rate than the HK2 cells transfected with an empty vector (Fig. 2C, D).
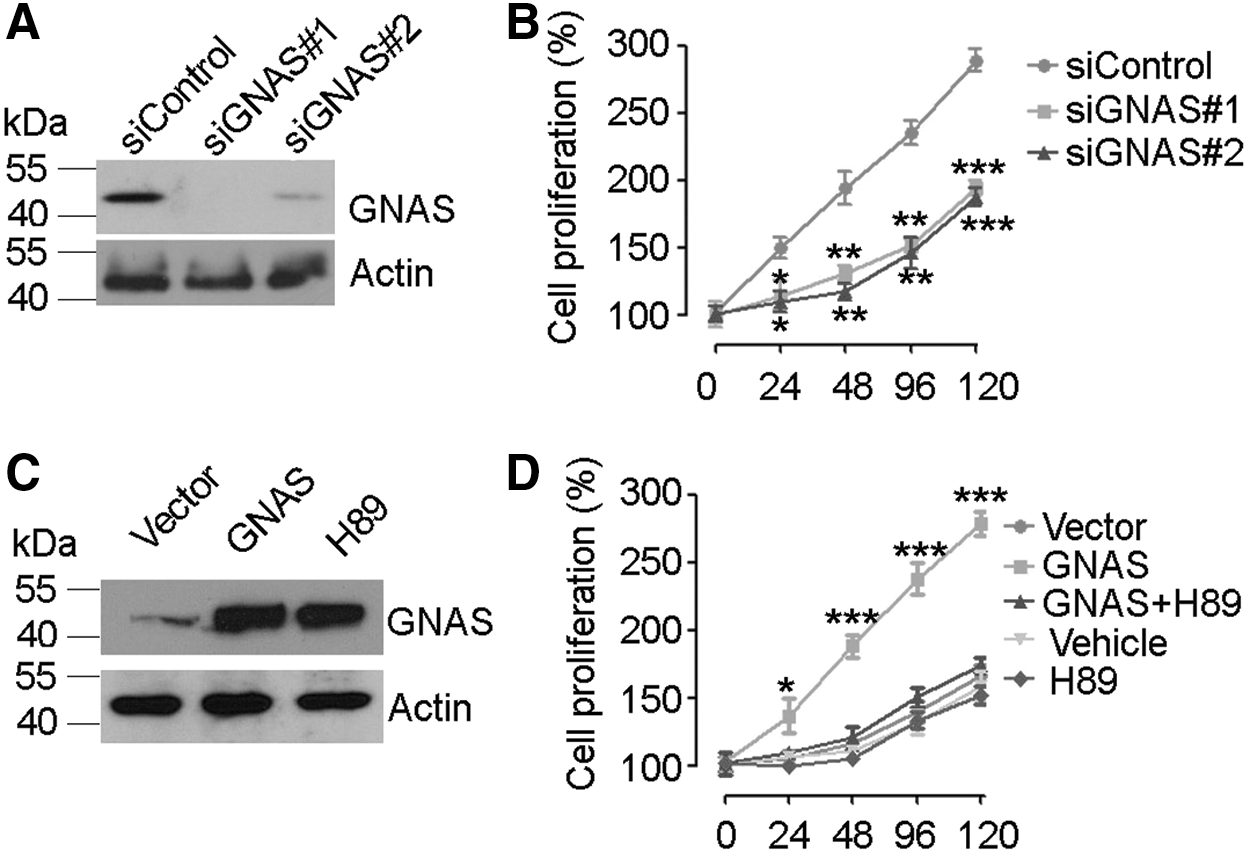
Gαs level influenced the proliferation of renal cells.
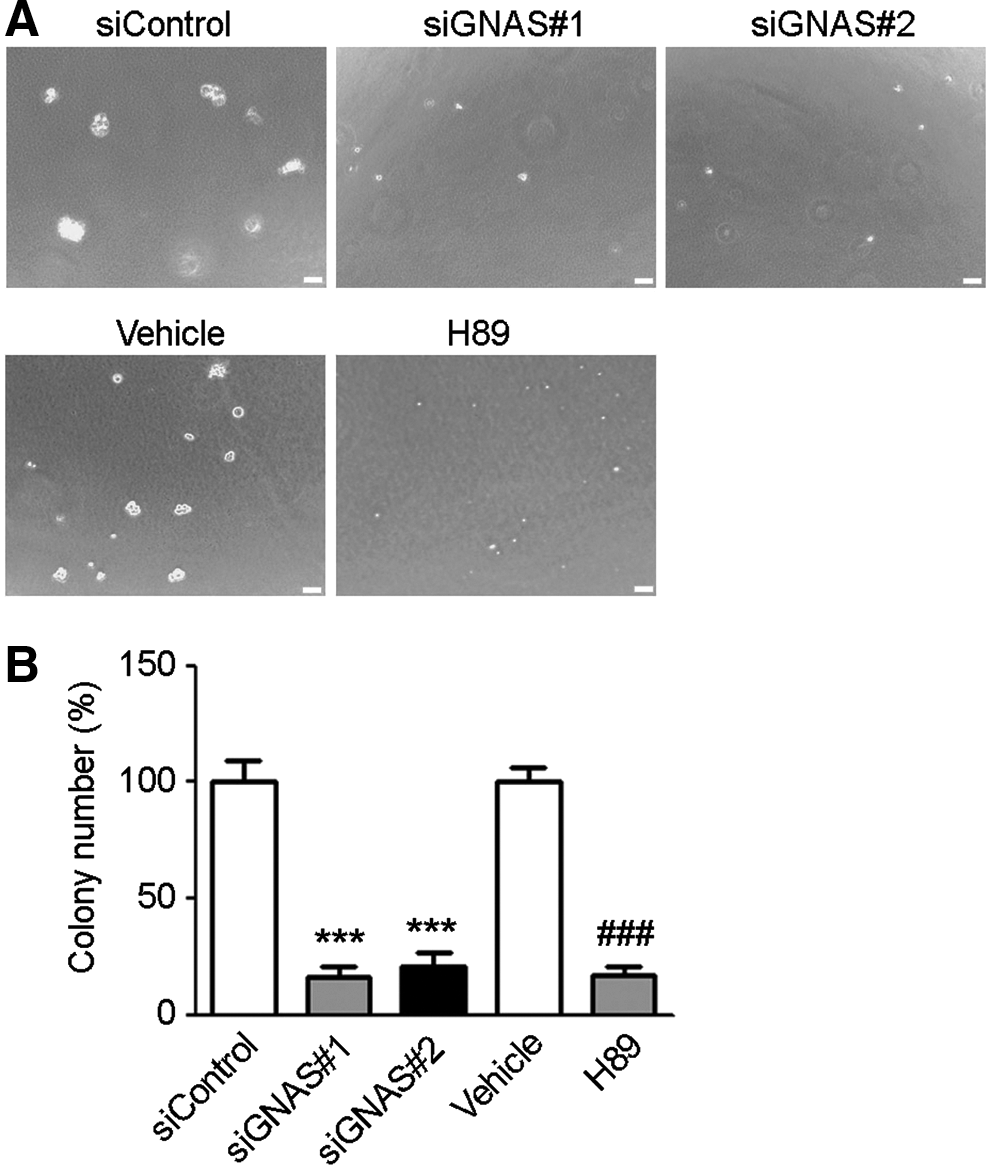
Soft agar colony formation assay.
Gαs functions through PKA-dependent pathway
With respect to the mechanism by which Gαs promotes cell proliferation in RCC, we first considered the possibility that Gαs acts through the classic G protein-coupled receptor-cAMP-PKA axis. In support of our hypothesis, we observed that in the presence of PKA inhibitor H89, the proliferation of HK2 cells overexpressing Gαs was obviously inhibited (Fig. 2D). In colony formation assay, the proliferation of ACHN cells, which showed high expression of Gαs compared to HK2 cells, was also suppressed by H89 (Fig. 3A). Western blotting results showed that H89 treatment had no effects on Gαs overexpression (Fig. 2C), which suggests that the proliferation inhibition is unlikely due to the difference in Gαs levels. Furthermore, we measured the intracellular level of cAMP by using competitive immunoassay. Results showed that the cAMP level in HK2 cells overexpressing Gαs was significantly higher than that in HK2 cells transfected with an empty vector in response to serial concentrations of parathyroid hormone (PTH) (Fig. 4A). To further validate the growth inhibitory effect of H89 on RCC, ACHN cells were subcutaneously implanted in nude mice to develop tumors. The endpoint evaluation showed that the mean tumor weight in mice administrated with H89 was appreciably smaller than that in mice treated with vehicle (1% DMSO) (Fig. 4B, C).

Overexpression of Gαs elevated intracellular cAMP level and the tumor growth was suppressed in the presence of PKA inhibitor in vivo.
Discussion
Somatic mutations on GNAS, the gene encoding the stimulatory Gαs, have been reported in tumors arising from a diversity of tissues, particularly the endocrine tissues (O'Hayre et al., 2013). In an early study, activating mutations on Gαs were identified in 5 of 30 (16.6%) patients with RCC (Kalfa et al., 2006), suggesting that Gαs might be involved in tumor development in renal cancer. However, there has been a lack of documents on the potential alterations of Gαs expression in RCC.
In this study, we observed the significantly increased expression of Gαs in RCC cell lines compared to normal renal epithelial cells. Interestingly, aberrant expression of Gαs appeared to be tissue specific because we observed an elevated Gαs level in kidney and live cancer cells, but not in human lung cancer and ovary cancer cells. These findings suggest that the Gαs may play a role in tumor development in a cellular context-dependent manner, and further that, the tissue-specific overexpression pattern of Gαs could be targeted by drug design for cancer therapy. However, the finding that Gβ subunit also increases in renal carcinoma cells reminds us that both Gα and Gβγ might be taken into account for pharmacological manipulation for treatment, as it has been demonstrated that Gβγ subunits can interact with distinct effector molecules in a manner independent of Gα subunits to regulate signaling pathways (Dupre et al., 2009).
In addition to the differential expression of Gαs in cell lines derived from different tissues, our data suggest that the oncogene or tumor suppressor role of Gαs is also context dependent. Frequent amplification mutations and activating mutations of GNAS have been reported in tumors of endocrine tissue origin (Singhi et al., 2014; Hosoda et al., 2015). In this study, Gαs confers a growth advantage to renal tumor cells, indicative of a cancer-promoting role in RCC. However, to be noticed, recent studies have demonstrated that Gαs acts as a tumor suppressor in sonic hedgehog-driven medulloblastoma (He et al., 2014; Rao et al., 2016). Gαs protein suppresses self-renewal of stem cells by inhibiting the Sonic hedgehog and Hippo pathways, and accordingly, loss of Gαs leads to remarkable proliferation of epithelial stem cells (Iglesias-Bartolome et al., 2015). Despite the two sides of Gαs in cancer development, we find that both the oncogene and tumor suppressor functions of Gαs appear to rely on PKA signaling. We believe that it will be interesting to reveal the molecular basis on which PKA distinguishes the cancer-promoting signal from cancer suppressive signal to exactly control the downstream function executors.
Based on our study, we propose an oncogenic pathway involving Gαs and PKA in RCC. The exceeding amount of Gαs in RCC cells may enhance the response to extracellular signals (e.g., hormone) and produce higher amount of second messenger cAMP to activate downstream PKA, thereby supporting cell proliferation (Fig. 5). In terms of the hypothesis, suppression of PKA activity or Gαs might be considered therapeutic strategies. In this study, our in vivo assay indicates that PKA inhibitor H89 effectively inhibited the tumor growth of ACHN cells.

Schematic illustration of the potential oncogenic Gαs-cAMP-PKA axis in renal cell carcinoma.
Conclusions
In conclusion, we have confirmed the aberrant expression of Gαs in three RCC cell lines. Our data support that Gαs promotes cell proliferation with the involvement of PKA signaling. Our study highlights an oncogenic role of Gαs in renal cancer development and a potential value of Gαs as therapeutic target for RCC.
Footnotes
Acknowledgments
This work was supported by grants from the National Natural Science Foundation of China (Nos. 81600515 and 81402121) and Natural Science Foundation of Tianjin (Tianjin Municipal Science and Technology Commission 12JCQNJC07600 and 16JCQNJC11300).
Disclosure Statement
No competing financial interests exist.