
Abstract
It has been suggested that the imprinted gene, H19, plays a crucial role in the development of cancer. In the present study, we attempted to treat the abnormal expression and methylation status of H19 in A549 cells using valproic acid (VPA), ascorbic acid (Vc), and 5-aza-Cytidine (5-Aza). The results suggested that VPA administration could alter the expression pattern of H19, while the hypomethylation status of H19 DMR was unchanged. Furthermore, overexpression of HDAC1 and DNMT1 was associated with decreased expression of H19 in VPA-treated cells. Western blot results showed that the expression of p53 protein was increased following treatment with VPA. In addition, we also investigated cellular apoptosis and the cell cycle of treated cells. Flow cytometry data indicated that VPA could increase the occurrence of cell apoptosis in A549 cells. Taken together, our results suggest that H19 expression was suppressed by VPA through HDAC1 and DNMT1 and decreased H19 expression correlated with cell apoptosis in A549 cells.
Introduction
T
In our previous study, we showed that the expression of H19 is regulated by DNA methylation in porcine embryo development (Wang et al., 2015). Compared to porcine differentially methylated regions (DMRs), human H19 also has a DMR that contains a CTCF binding site. Recent studies have indicated that inappropriate DNA methylation status may induce abnormal H19 expression (Su et al., 2011; Rotondo et al., 2013). DNA methylation, as well as histone deacetylases (HDACs), can regulate H19 expression (Zupkovitz et al., 2006).
In this study, valproic acid (VPA, a histone deacetylase inhibitor) was used in treated human lung cancer cells (A549) to evaluate H19 expression patterns. Previous studies suggested that VPA could regulate the expression of many genes by histone modification (Wood et al., 2005; Rakitin et al., 2015). However, little is known about how VPA regulates H19 expression. To determine if epigenetic changes affect the regulation of H19 expression, DNA methyltransferases (DNMTs) and HDACs were investigated using quantitative real-time polymerase chain reaction (qRT-PCR). In addition, numerous studies have suggested that ascorbic acid (Vc) and 5-aza-Cytidine (5-Aza, DNMT inhibitors) may also regulate gene expression (Zhao et al., 2012; Van Pham et al., 2016). In this study, we aimed to compare the expression and methylation pattern of H19 after VPA, Vc, and 5-Aza treatment.
Materials and Methods
Cell culture and treatment
The human lung adenocarcinoma epithelial cell line A549 and human embryonic kidney (HEK) 293FT cells were cultured in DMEM (Dulbecco's modified Eagle's medium high glucose) supplemented with 10% FBS (fetal bovine serum) at 37°C in 5% CO2. Cells (2 × 10⁵ cells/mL) were incubated for 24 h, after which VPA (1000 nM), Vc (1000 nM), or 5-Aza (100 nM) was added for 24, 48, and 72 h.
Gene expression analysis
Total RNA was isolated from A549 cells using the TRNzol reagent (TIANGEN, Beijing, China), according to the manufacturer's instructions. RNA samples were first treated with DNase I (Fermentas) and reverse transcribed to cDNA using the BioRT cDNA First Strand Synthesis Kit (Bioer Technology, Hangzhou, China). qRT-PCR was performed to determine gene expression. The primer sequences used in this study are listed in Table 1. Quantitative PCR was performed using the BIO-RAD iQ5 Multicolor Real-Time PCR Detection System with the BioEasy SYBR Green I Real Time PCR Kit (Bioer Technology). PCR conditions were 95°C for 3 min, followed by 40 cycles of denaturation at 95°C for 10 s, annealing at 60°C for 15 s, and extension at 72°C for 30 s. The 2−ΔΔCT method was used to determine relative gene expression, which was normalized to the amount of GAPDH mRNA. All experiments were repeated thrice for each gene. All data are expressed as the mean ± S.E.M. Reverse transcription–polymerase chain reaction (RT-PCR) was carried out to determine H19 expression. The primer sequences included: H19 5′-AAAGACACCATCGG AACAGC-3′ and 5′-AGAGTCGTGGAGGCTTTGAA-3′; GAPDH 5′-CCACTCCTCCACCTTTGAC-3′ and 5′-ACCC TGTTGCTGTAGCCA-3′. PCR conditions were 95°C for 3 min, followed by 35 cycles of denaturation at 95°C for 30 s, annealing at 60°C for 30 s, and extension at 72°C for 30 s. The PCR product was subjected to agarose gel electrophoresis.
Western blot analysis
Proteins were extracted from cells with 2× SDS lysis buffer. Protein concentrations were determined using the BCA Protein Assay Kit (TIANGEN). Proteins were separated on 10% SDS-polyacrylamide gels and transferred to a PVDF membrane. Membranes were blocked in 5% nonfat milk powder in TBS-T (0.1% Tween-20 in PBS) and incubated with primary antibodies overnight at 4°C. The primary antibodies used included rabbit anti-p53 (Abcam), anti-HDAC1 (Abcam), anti-HDAC2 (Abcam), and mouse anti-β-Actin (Abcam). After washing in PBS-T, membranes were incubated with HRP-conjugated secondary antibodies (Invitrogen) for 1 h at room temperature and were detected using ECL Super Signal (Pierce).
Methylation pattern of H19 DMR
The procedure for bisulfite sequencing PCR (BSP) has been previously described (Clark et al., 1994). Briefly, genomic DNA from A549 and 293FT cells was isolated using the TIANamp Genomic DNA Kit (TIANGEN) and treated using the CpGenome™ Turbo Bisulfite Modification Kit (Millipore), according to the manufacturer's instructions. Nested PCR was performed using the Taq Plus PCR MasterMix (TIANGEN) to amplify the H19 DMR. The primer sequences are listed in Table 2. PCR products were purified and subjected to BSP (10 positive clones) and Combined Bisulfite Restriction Analysis (COBRA), which have been described previously (Watanabe et al., 2010; Huntriss et al., 2013).
DMR, differentially methylated region.
Cell apoptosis and cell cycle analysis
The procedure for cell apoptosis detection has been previously described (William-Faltaos et al., 2006). Briefly, A549 cells were used for Annexin V-FITC/PI staining following treatment with VPA, Vc, or 5-Aza for 24, 48, and 72 h. Following incubation, the cells were washed with PBS twice and collected at a concentration of 1 × 10⁶ cells/mL. For each treated cell sample, Annexin V-FITC and PI were added, according to the manufacturer's instructions. These cells were incubated for 30 min and then analyzed with an Accuri™ C6 flow cytometer (BD Biosciences, Franklin Lakes, NJ).
To analyze the cell cycle, PI staining was performed. In brief, A549 cells (1 × 10⁶ cells/mL) were treated with VPA, Vc, or 5-Aza for 24, 48, and 72 h. The cells were washed with PBS and then fixed in 70% ethanol for 2 h at 4°C. These cells were incubated with PI and RNase A for 30 min, and an Accuri C6 flow cytometer was used for analysis of the cell cycle.
Statistical analysis
Quantitative RT-PCR, BSP, and flow cytometry (FCM) data were analyzed by t tests using SPSS 16.0 software (SPSS, Inc., Chicago, IL). A p-value of <0.05 was considered statistically significant. The methylation status was analyzed using the online software tool, BiQ Analyzer (
Results
The expression pattern and methylation status analysis of H19
To determine if VPA, Vc, or 5-Aza affected the expression of H19, qRT-PCR was carried out. As shown in Figure 1, the expression of H19 was upregulated by Vc; however, it was reduced by VPA treatment and did not change after treatment with 5-Aza. RT-PCR was used as an independent method to detect H19 expression, which confirmed the qRT-PCR results (Supplementary Fig. S1; Supplementary Data are available online at
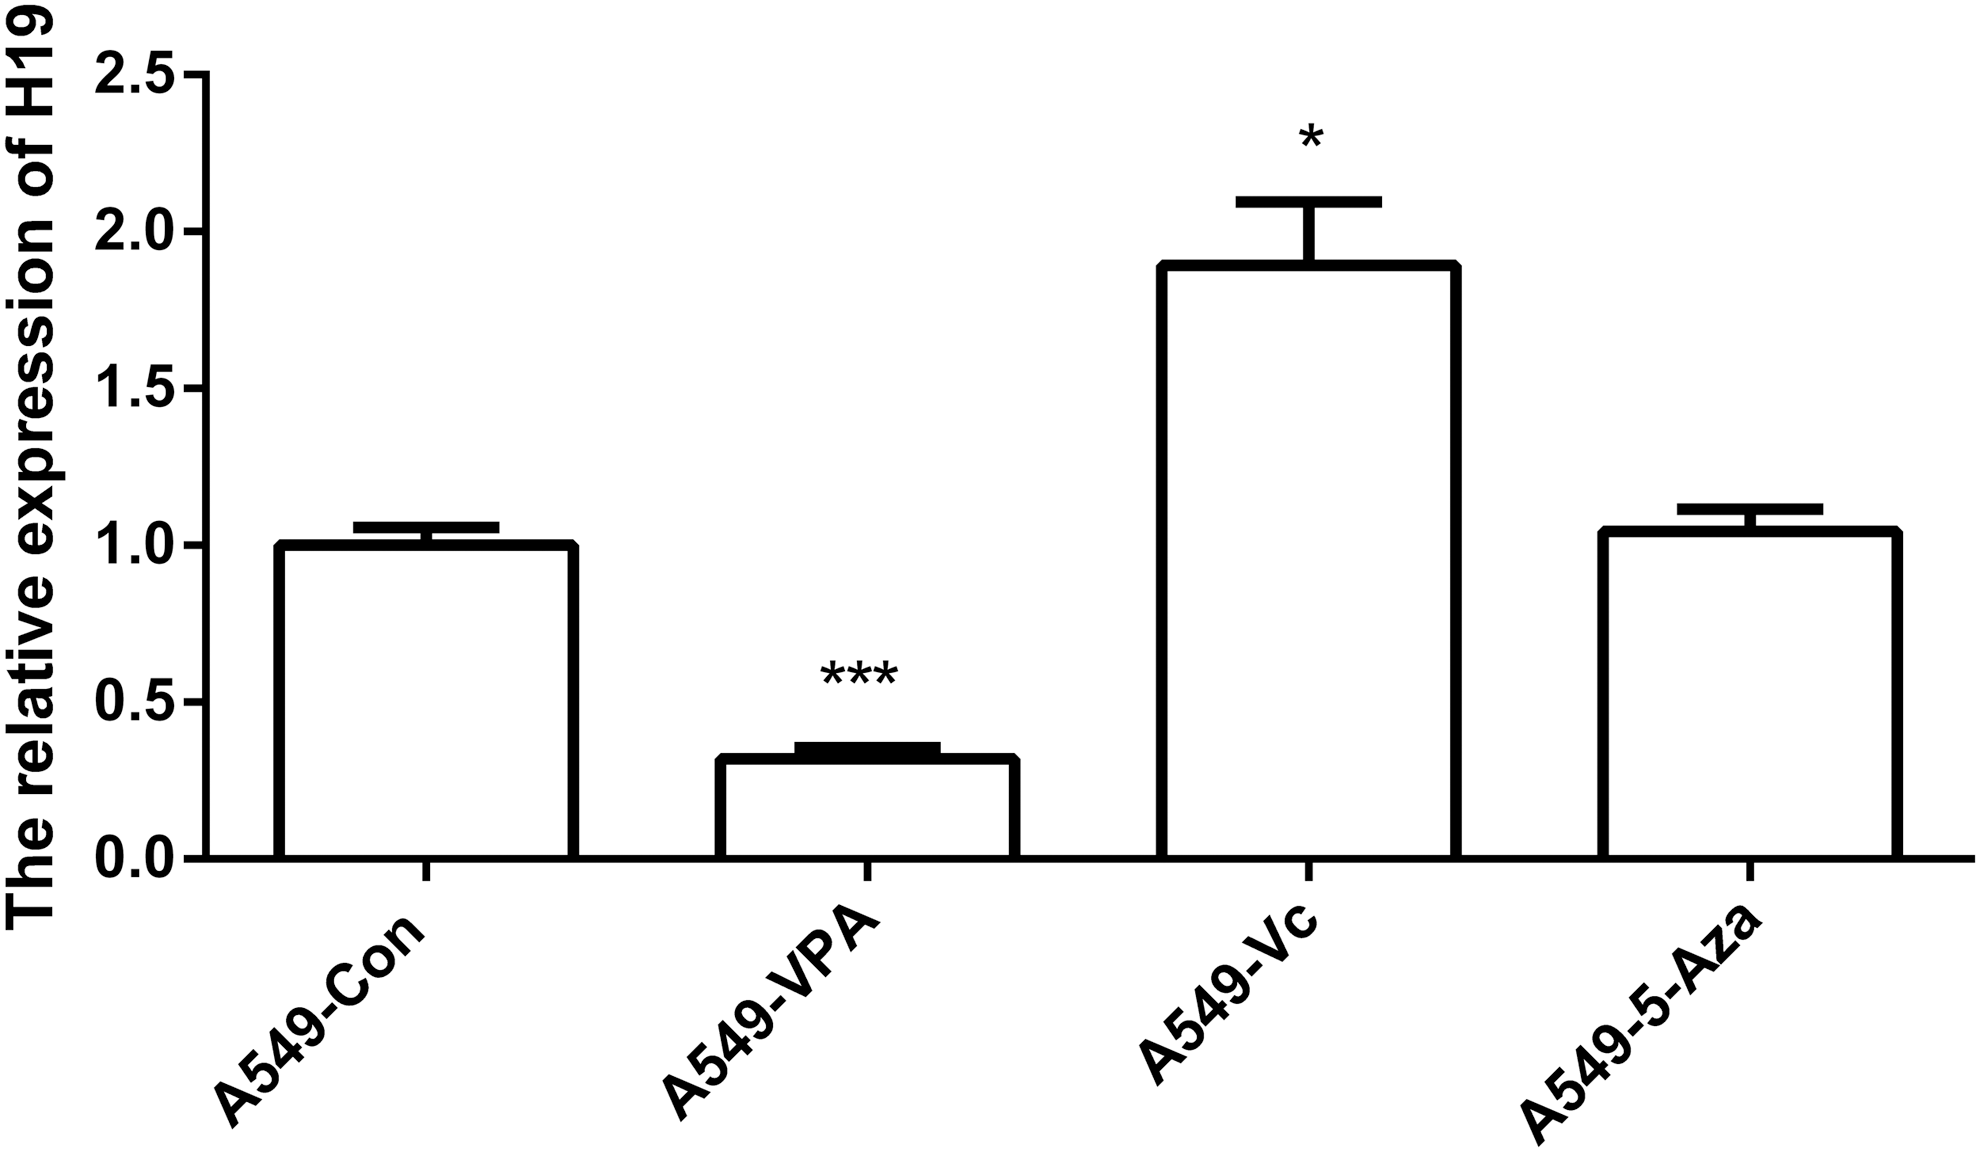
Relative expression levels of H19. The data are represented as the mean ± S.E.M. (n = 3). *(p < 0.05) and ***(p < 0.005) indicates statistically significant differences. S.E.M., standard error of the mean.
To further investigate whether the expression of H19 was associated with DMR methylation patterns, we analyzed the H19 DMR in A549 and 293FT cells using BSP and COBRA, following treatment with VPA, Vc, or 5-Aza. As expected, the H19 DMR was found to be hemimethylated in 293FT cells. In contrast, this region was hypomethylated in A549 cells. In addition, the BSP results suggested that the hypomethylation status of the H19 DMR was unchanged after treatment with VPA, Vc, or 5-Aza (Fig. 2A). The PCR products were subjected to COBRA and sequence analyses, which confirmed the BSP results (Fig. 2B, C). Statistical analyses also revealed that there were no significant differences between VPA, Vc, and 5-Aza treatments (Fig. 2D).
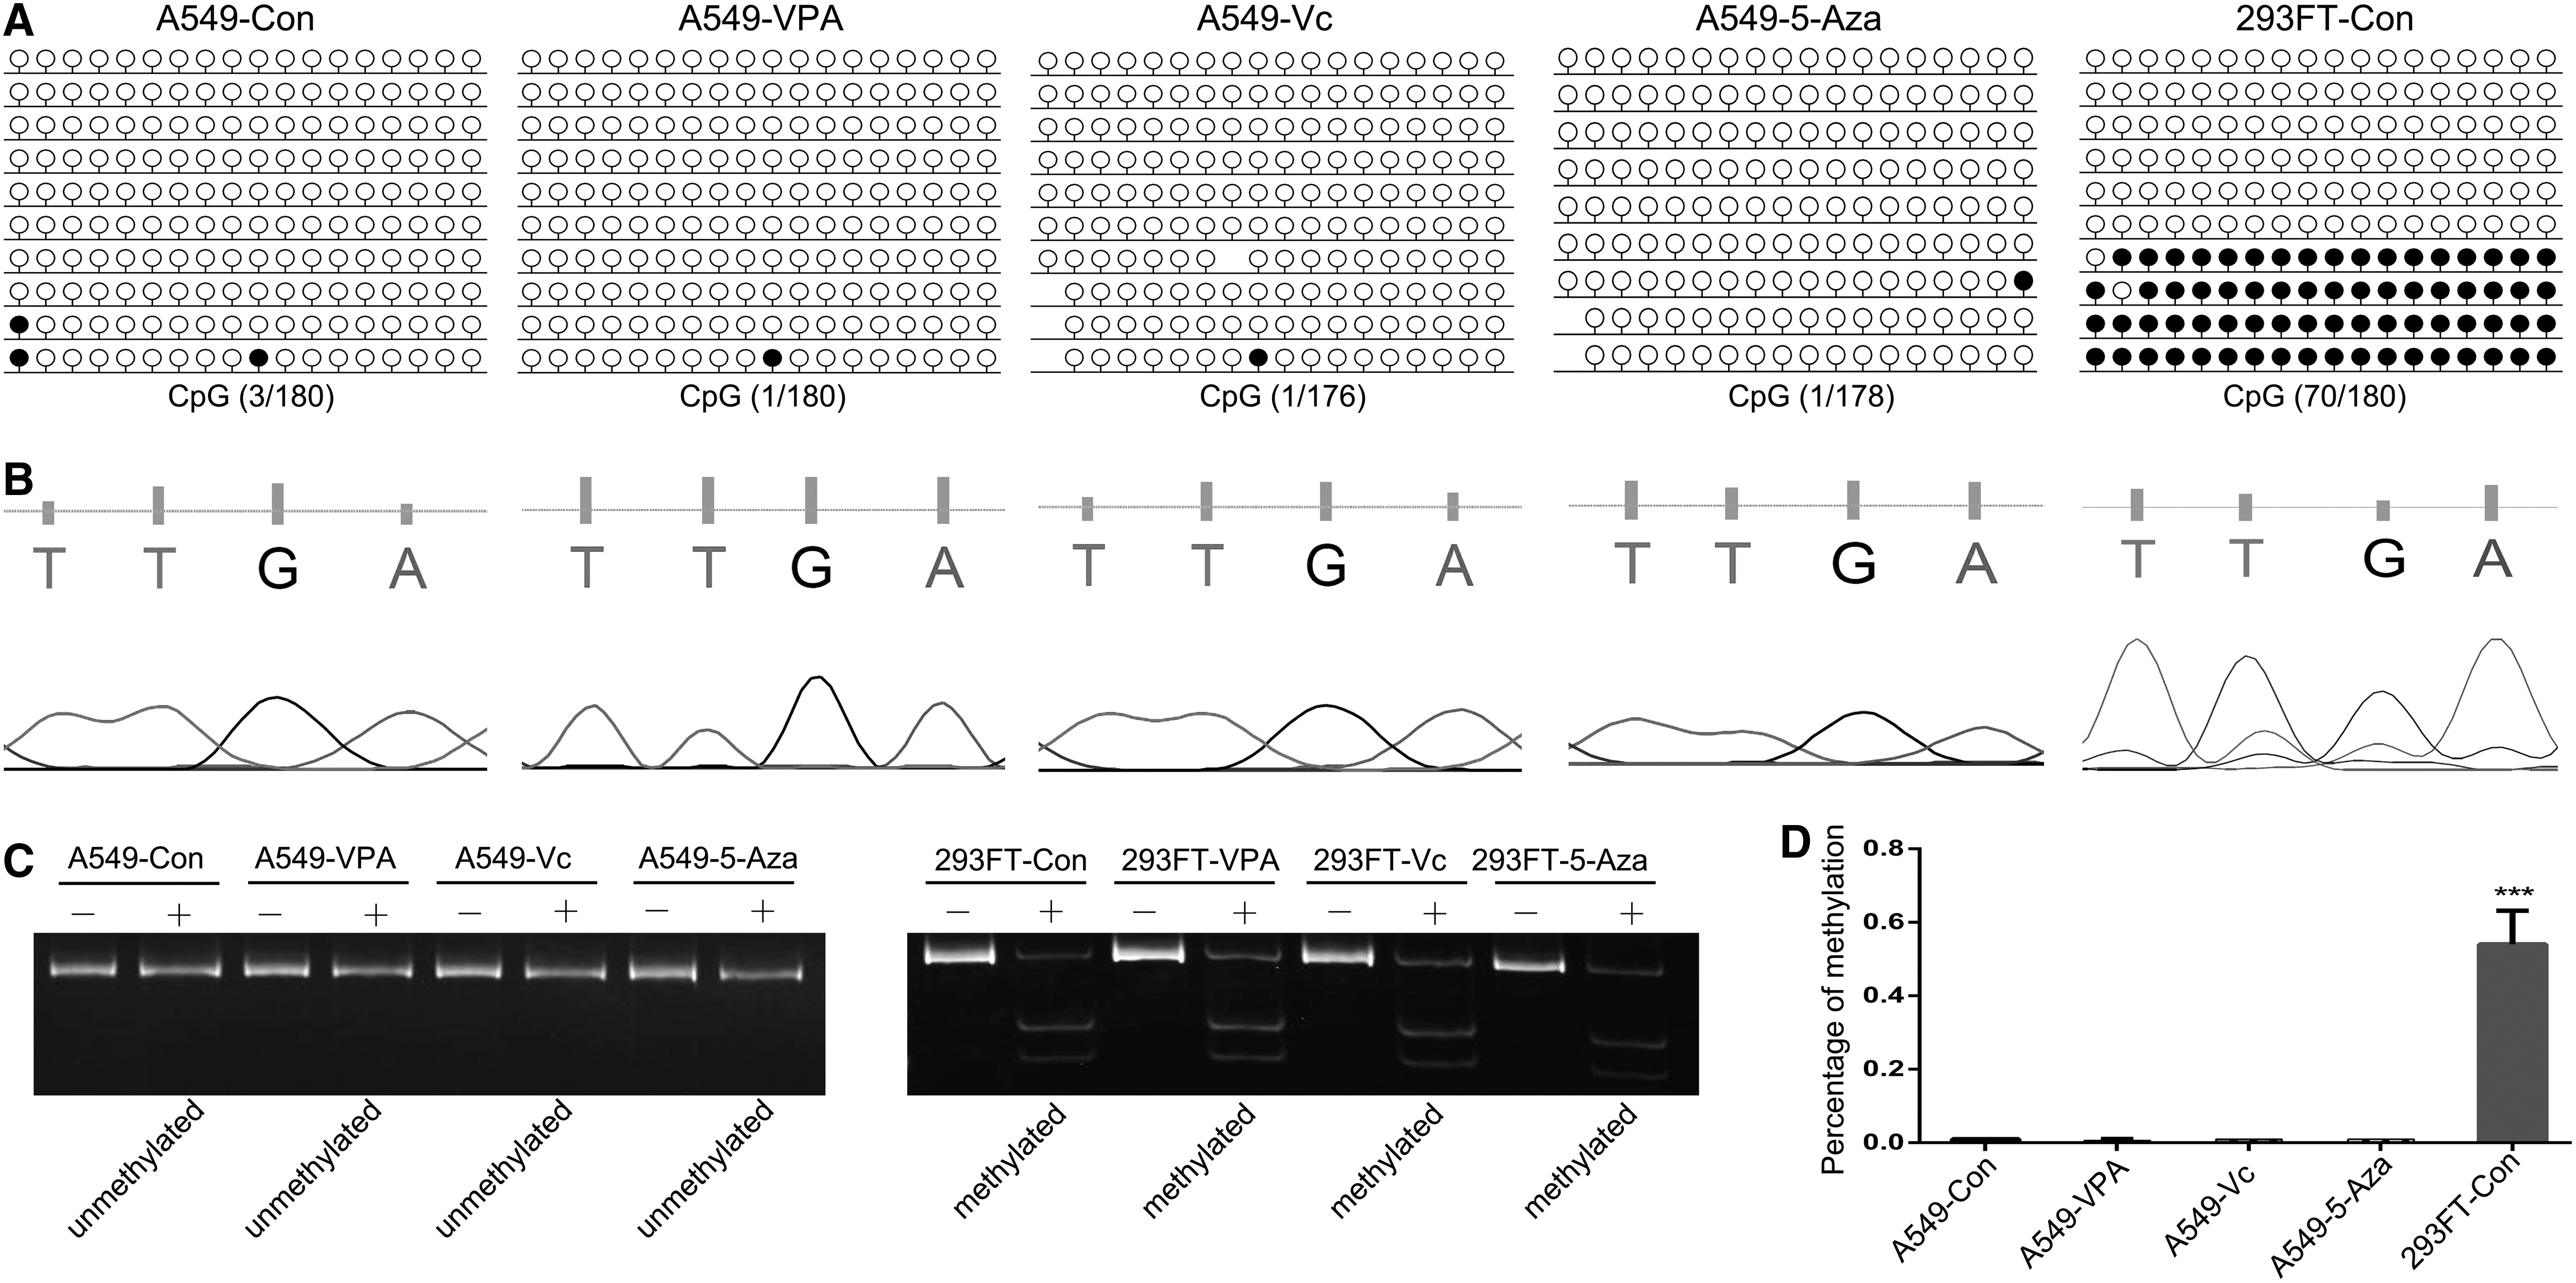
The methylation pattern of H19 DMR. CpG methylation profiles
Analysis of HDAC and DNMT gene expression profiles
HDACs play a vital role in gene expression and are associated with histone modification. As an HDAC inhibitor, VPA may inhibit HDAC1 and HDAC2 gene expression in A549 cells (Fig. 3A, B). Furthermore, the western blot results showed that there was no expression of HDAC1/2 in VPA treated cells (Supplementary Fig. S2).
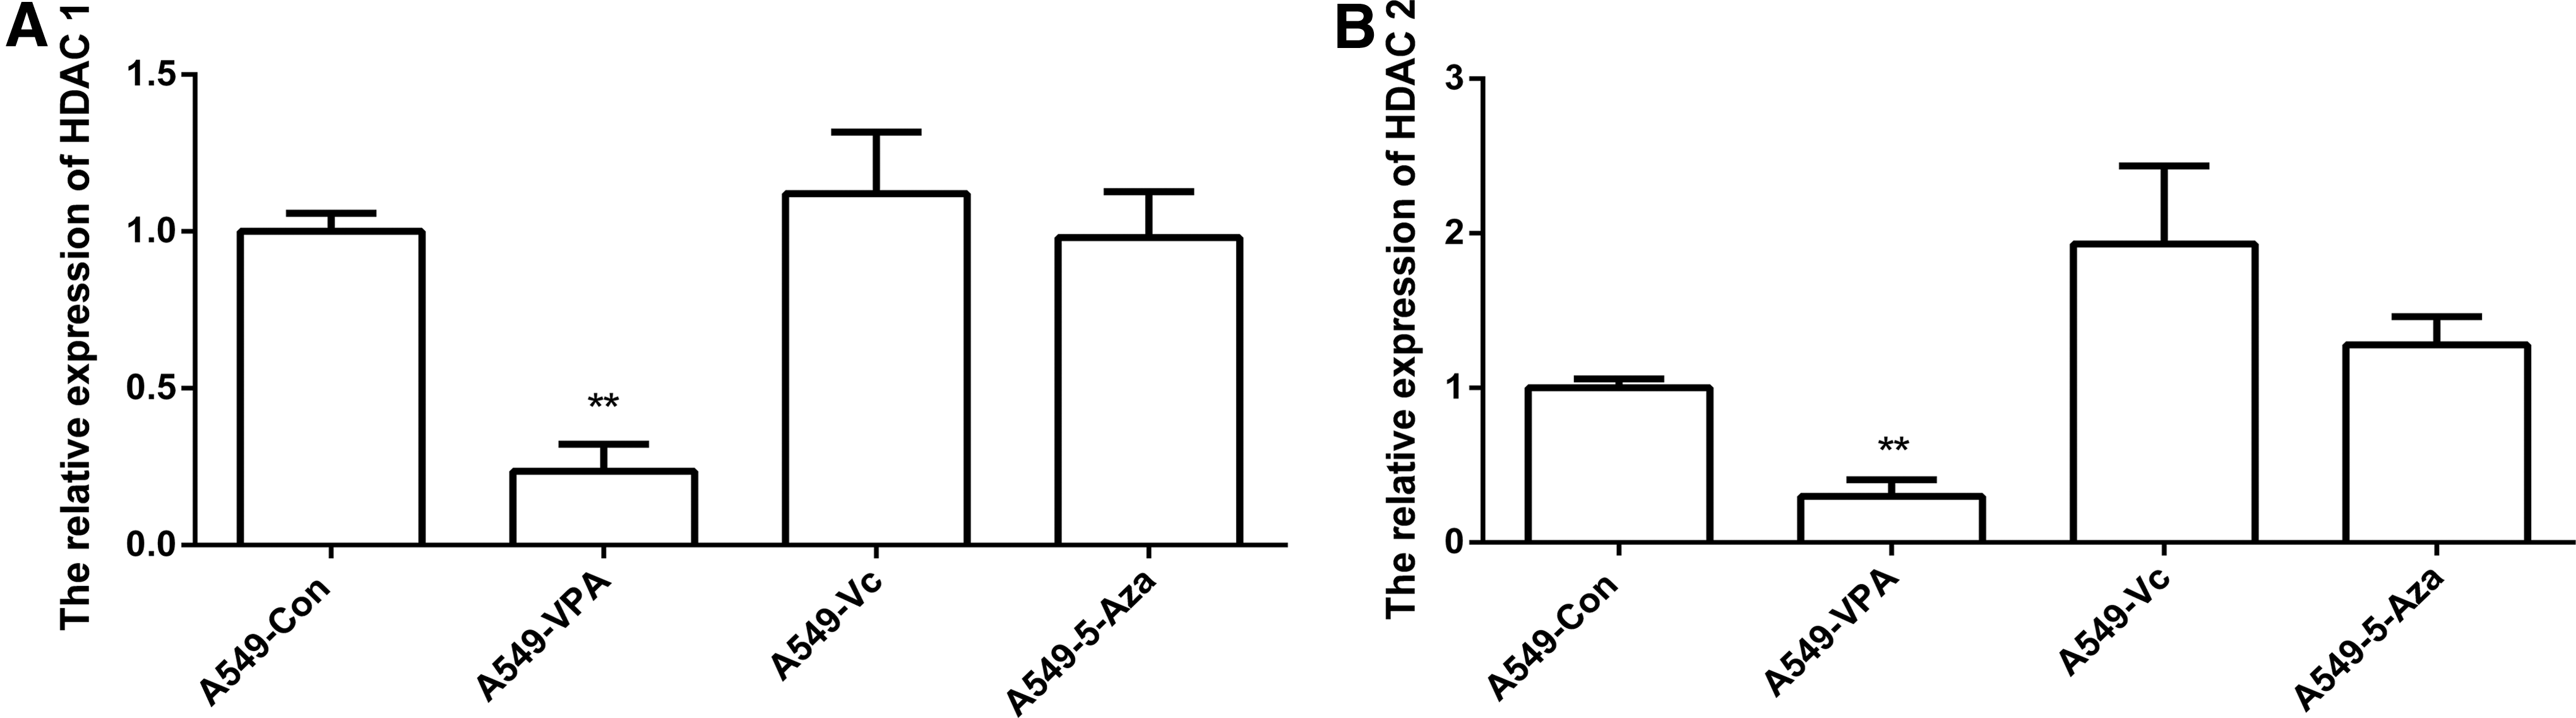
Relative expression levels of HDACs. The expression of HDAC1
DNMTs can contribute to DNA methylation. To understand the role of VPA in the expression of DNA methyltransferases, expression levels of DNMT1 and DNMT3a were determined by qRT-PCR. Expression of DNMT1 was increased after VPA treatment, but was decreased after treatment with 5-Aza (Fig. 4A). Compared with DNMT1, DNMT3a expression was not significantly increased in VPA-treated cells (Fig. 4B). These results suggest that H19 is regulated by VPA through HDAC1 and DNMT1.
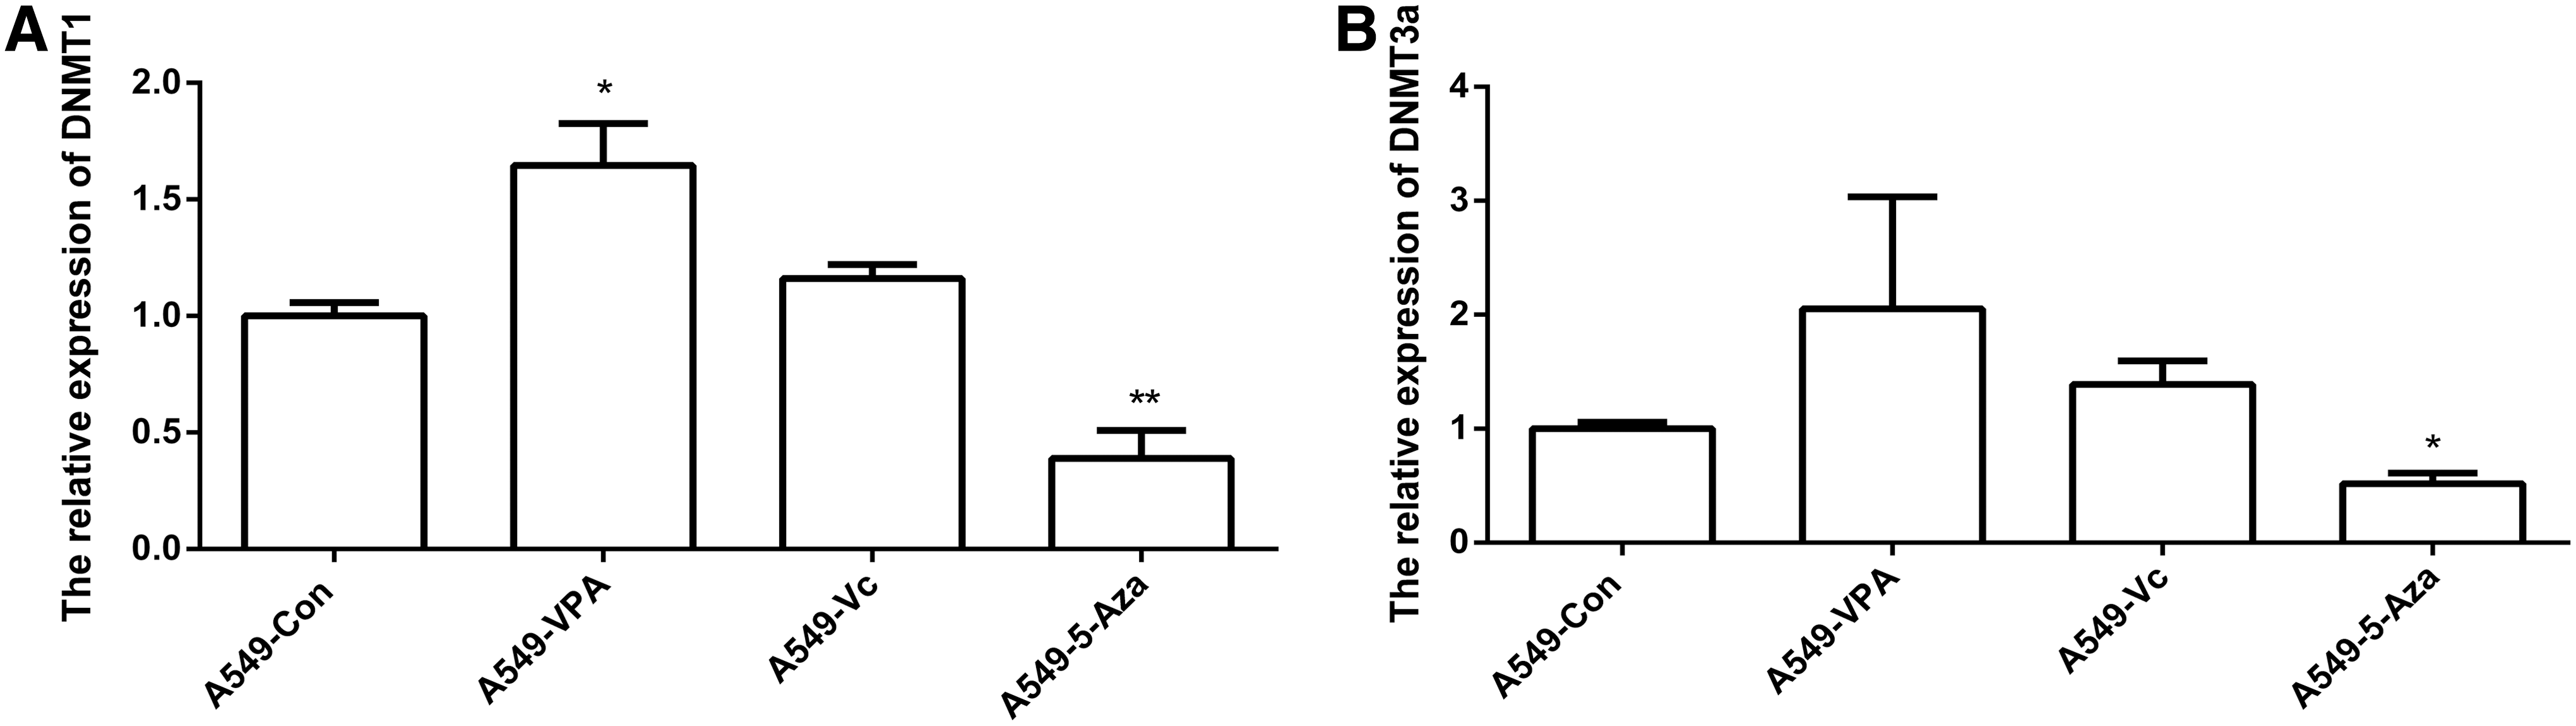
Relative expression levels of DNMTs. The expression of DNMT1
Effects of VPA, Vc, and 5-Aza on cell cycle and cell death
As shown, VPA could induce cell apoptosis, compared with the Vc and control cells (Fig. 5A and Supplementary Table S1). To determine the impact of downregulation of H19 on apoptosis, we evaluated p53 expression by western blot. The results indicated that p53 overexpression was observed after treatment with VPA (Supplementary Fig. S2). In addition, the effects of VPA, Vc, and 5-Aza on the cell cycle profile were analyzed (Fig. 5B and Supplementary Table S2). Statistical analyses confirmed our apoptosis results (Fig. 5C), which showed that there were increased numbers of VPA-treated cells in G1 phase at 24 h, while no change was observed at 48 h, and a decrease was observed at 72 h. In contrast, the proportion of VPA-treated cells in G2 was increased at 72 h and the number of cells in S phase decreased at 24 h (Fig. 5D). These results indicate that the cell cycle and cell apoptosis profile of A549 cells was altered by VPA treatment.

Analysis of cell death and cell cycle. Effects of VPA, Vc, and 5-Aza on cell death
Discussion
In the present study, VPA, Vc, and 5-Aza were used to treat A549 cells. Although many reports have indicated that Vc can stimulate the overexpression of some genes, there is little evidence to suggest that Vc can modify H19 expression (Yu et al., 2015; Van Pham et al., 2016). Our results demonstrated that Vc can increase H19 expression. The DNMT inhibitor 5-Aza did not alter H19 expression. There has been no evidence to show that VPA can regulate H19 expression, although several reports have suggested that VPA can affect the expression of some genes (Sun et al., 2015; Liu et al., 2016c). In our results, VPA suppressed H19 expression in A549 cells. These data indicate that decreased expression of H19 was associated with epigenetic modification.
Previous studies have shown that DMRs play a crucial role in the regulation of imprinted gene expression, including H19/IGF2 (Wang et al., 2015). To determine if abnormal H19 expression was regulated by DNA methylation, we analyzed the methylation status of the H19 DMR and, as seen in a previous study, confirmed that H19 was hemimethylated in 293FT cells (Nye et al., 2015). In contrast, an aberrant methylation profile of H19 DMR was detected in A549 cells. These results indicate that the hypomethylation status of DMR contributed to the overexpression of H19 in A549 cells. In our study, VPA, Vc, and 5-Aza did not change the methylation of H19 DMR.
To further determine whether H19 expression was regulated by epigenetic modification, HDACs and DNMTs were analyzed. Our results are consistent with previous reports that VPA may inhibit HDAC1 and HDAC2 expression (Castro et al., 2005). In addition, studies suggest that H19 acts as a HDAC1 target in humans (Zupkovitz et al., 2006), goats (Meng et al., 2014), bovines (Ma et al., 2015), and mice (Duren and Wang, 2016). Thus, we speculate that VPA inhibits H19 expression through HDAC1. In this study, we have addressed the question of whether DNMTs contribute to H19 expression. DNMT1 and DNMT3a are both important in the maintenance of methylation and de novo methylation. In a recent study, reduced DNMT1 and decreased H19 were detected in cloned goat fibroblasts (Wan et al., 2016). Furthermore, reduced levels of DNMT1 and DNMT3a and hypermethylated H19 DMR were detected in human spermatogenic cell stages (Marques et al., 2011). In our study, VPA stimulated an increase in DNMT1 expression in A549 cells. Thus, our results suggested that an abnormal expression pattern and methylation status of H19 is associated with overexpression of DNMT1.
It has been demonstrated that VPA can induce apoptosis in A549 cells (Gavrilov et al., 2014). However, little is known about how VPA induces apoptosis. In a previous study, VPA increased p53 protein expression (Jambalganiin et al., 2014). Moreover, upregulation of H19 expression contributed to tumorigenesis by regulating p53 activation, and H19-derived miR-675 was able to regulate p53 activation (Yang et al., 2012; Liu et al., 2016a). Thus, our results indicate that abnormal expression of H19 is associated with p53 protein and activated p53 induced apoptosis in A549 cells.
A previous study has suggested that VPA plays a key role in the regulation of the cell cycle (Kramer et al., 2008). VPA slowed cell cycle progression with A549 cells accumulating in G1 phase after 24 h (Tonelli et al., 2006). These results were confirmed in this study, as a decrease in cells in the G1 phase at 48 and 72 h was also observed, suggesting that VPA induced cell death in the G1 phase. By contrast, the number of cells in the G2 and S phases was different. This indicates that the fraction of cells in the G1 phase was reduced, and the accumulation of cells in the S and G2 phases, which correlated with increased apoptosis, shows that VPA induced cell death in the G1 phase.
In conclusion, the results of the present study demonstrate that the expression of H19 is regulated by VPA in A549 cells. In addition, abnormal methylation of H19 DMR was observed and this led to the overexpression of H19. Our results showed that H19 was regulated by HDAC1 and DNMT1 following VPA treatment in A549 cells. Furthermore, we found that decreased expression of H19 induced cell death after VPA treatment in A549 cells. Our data suggest an important role for H19 expression in cancer development and point toward H19 as a novel biomarker in cancer therapy.
Footnotes
Acknowledgment
This work was financially supported by the National Natural Science Foundation of China (Grant No. 31601003).
Disclosure Statement
No competing financial interests exist.
References
Supplementary Material
Please find the following supplemental material available below.
For Open Access articles published under a Creative Commons License, all supplemental material carries the same license as the article it is associated with.
For non-Open Access articles published, all supplemental material carries a non-exclusive license, and permission requests for re-use of supplemental material or any part of supplemental material shall be sent directly to the copyright owner as specified in the copyright notice associated with the article.