
Abstract
Fluorescence spectroscopy, ultraviolet-visible absorption spectroscopy, circular dichroism spectroscopy, viscometry, cyclic voltammetry, and differential pulse voltammetry were applied to investigate the competitive interaction of DNA with the three new cycloalkyl α-aminobisphosphonates (D1–D3) and spectroscopic probe, neutral red dye, and Hoechst (HO), in a Tris–hydrogen chloride buffer (pH 7.4). The spectroscopic and voltammetric studies showed that the groove binding mode of interaction is predominant in the solution containing DNA and α-aminobisphosphonates. Furthermore, the results indicated that α-aminobisphosphonate with the lengthy N alkyl chains and larger heterocyclic ring size had a stronger interaction. The principal component analysis and theoretical quantum mechanical and molecular mechanics (QM-DFT B3LYP/6-31+G* and MM-SYBYL) methods were also applied to determine the number of chemical components presented in complexation equilibrium and identify the structure complexes of DNA with the three new cycloalkyl α-aminobisphosphonates (D1–D3), respectively.
Introduction
O
Their mechanism of action is as follows: BPs bind preferentially to bone's active metabolism sites and are released from the sites during bone resorption (Fleisch, 2002). Zoledronic acid, pamidronate, and ibandronate belong to newer nitrogen-containing BPs, which have a unique mechanism of action and are more effective than first-generation BPs (Green, 2003). Therefore, they can prevent bone resorption at low concentrations up to micromolar.
Aminoalkylphosphonic acids are a class of BPs that are similar to amino acids structurally, in which the carboxylic group is substituted by a phosphonic or related moiety. Aminobisphosphonic acids and their derivatives have received considerable attention because of their potential biological activity in treating different diseases such as osteoporosis (Rodan and Martin, 2000; Hirabayashi et al., 2002; Widler et al., 2002; Dannemann et al., 2007; Houghton et al., 2008; Vieillard et al., 2008), cancer (Coleman, 2000; Das et al., 2001; Kiran et al., 2008; Simoni et al., 2008), Alzheimer's (Grutzendler and Morris, 2001; Makhaeva et al., 2009), and HIV (McKenna et al., 2002). In addition, there are several significant applications for these compounds such as plant growth regulators (Kafarski et al., 1997), antiparasitics (Martin et al., 2002), herbicides (Kishore and Shah, 1988; Mori et al., 1996; Obojska et al., 2004), pesticides (Kafarski et al., 2001), and antiviral agents (Chen et al., 2009). Cholesterol-lowering BP drug (e.g., alendronate) effect on the activity of cholinesterases (ChE) in rat brain and blood has been reported. Also, it has been found that cholesterol-modifying drugs regulate acetylcholinesterase activity and it is better than using a blood–brain barrier penetrating drug (Cibičkov et al., 2007). Furthermore, the effect of alendronate on lowering cholesterol levels in the central nervous system of rats has been investigated (Cibičkov et al., 2009). The phosphoryl group in these molecules is essential for biological activity. The differences in the inhibition potencies of organophosphorus agents are a manifestation of the differing molecular properties of the inhibitors involved in the interaction with the active site of the enzyme (Gholivand et al., 2010).
Taking into consideration the above points, the importance of interaction study between DNA and these compounds is clear. In this study, the spectroscopic and voltammetric methods were utilized to investigate the interactions of the three new cycloalkyl α-aminoalkylphosphonic acids D1 to D3 (Fig. 1a) and DNA with and without the aid of neutral red (NR) and Hoechst (HO) as molecular probes. The principal component analysis (PCA), quantum mechanical (B3LYP/6-31+G*) for the three cycloalkyl α-aminobisphosphonates D1–D3 quantum mechanical-density functional theory (QM-DFT), molecular mechanics-SYBYL (MM-SYBYL) for DNA designing, and the QM-MM methods for DNA–[cycloalkylα-aminobisphosphonates] interactions have also been applied to determine the number of chemical components presented in complexation equilibrium and identify the structure complexes of DNA with the three cycloalkyl α-aminobisphosphonates, respectively.

Materials and Methods
Chemicals
The highly polymerized calf thymus DNA (CT-DNA), Hoechst (HO), NR, and Tris–HCl were purchased from Sigma Co. and used as received. Disodium salt of CT-DNA was stored at 4°C. The three cycloalkyl α-aminobisphosphonates (D1–D3) were prepared according to literature methods (Gholivand et al., 2010). The buffer solution of Tris–HCl was prepared from [Tris–(hydroxymethyl)-amino-methane–hydrogen chloride] and pH was adjusted to 7.4. Deionized water was used throughout.
DNA binding measurements and instrumentation
Disodium salt of CT-DNA was prepared and stored at 4°C. The stock solution of DNA was prepared according to previous work (Gholivand et al., 2011). A solution of CT-DNA gave a ratio of ultraviolet (UV) absorbance at 260 and 280 nm more than 1.9, indicating that DNA was sufficiently free from protein. The concentration (monomer units) of the DNA stock solution (1.0 mM per nucleotide) was determined by UV spectrophotometry, in properly diluted samples, using the molar absorption coefficient 6600 M−1·cm−1 at 260 nm. Stock solutions were stored at 4°C and used no more than 4 days (Gholivand et al., 2011).
The stock solutions of the cycloalkyl α-aminobisphosphonate (3.0 mM) were prepared by dissolving appropriate amounts of each compound in Tris–HCl buffer.
The stock solutions of NR and Hoechst (3.0 mM) were prepared by dissolving appropriate amounts of each compound in distilled water.
In a typical experiment, 2.5 mL solution of DNA 50.0 μM was transferred into a cuvette. Then, a known amount of the three cycloalkyl α-aminobisphosphonate (3.0 mM) solution was added in a stepwise manner using a calibrated micropipette (0.0–0.1 mM). The UV-Vis spectra of the solution were recorded after each addition in the wavelength range of 220–300 nm.
The competitive absorption experiments between heterocyclic α-aminobisphosphonates and NR were carried out by keeping the concentration of NR constant (50.0 μM), and then, 50 μL of 1.0 mM DNA was added and after that a known amount of the heterocyclic α-aminobisphosphonate (50.0 μL of 1.0 mM) solutions was added in a stepwise manner.
In viscosimetry experiments, 15.0 mL solution of DNA (50.0 μM) was transferred into a viscosimetry cell. Then, a known amount of the three new cycloalkyl α-aminobisphosphonate (D1–D3) solutions (1.0 mM) was added in a stepwise manner using a calibrated micropipette. The flow times were measured with a digital stopwatch and the mean values of three replicated measurements were used for viscosity (η) evaluation. Relative viscosity of DNA solution in the presence or absence of the cycloalkyl α-aminobisphosphonates is calculated from the following equation:
where
The circular dichroism (CD) spectra were recorded by progressive addition of each analyst to the pure DNA solution. 2.5 mL of DNA solution (0.1 mM) was transferred into a 1 cm quartz cell, and then, a known amount of the α-aminobisphosphonate (3.0 mM) solution was added in a stepwise manner using a calibrated micropipette. The CD results in UV region were expressed as molar ellipticity [ ] (deg·cm2·dmol−1), based on a mean nucleotide residue weight (MRW) assuming its average weight for DNA to be equal to 330 D. The molar ellipticity was determined as [] = ( × 100 MRW)/(cl), where c is DNA concentration in milligram per milliliter, l is the light path length in centimeter, and is the measured ellipticity in degree at wavelength λ. The instrument was calibrated with (+)-10-Camphorsulfonate assuming []291 = 7820 deg·cm2·dmol−1 and with JASCO standard nonhygroscopic ammonia, (+)-10-Camphorsulfonate assuming []290.5 = 7910 deg·cm2·dmol−1. Noise in the data was smoothed using the JASCO J-810 software, including the fast Fourier 5 transform noise reduction routine, which allows enhancement of most noisy spectra without distorting their peak shape (Kashanian et al., 2011).
Fluorescence intensities were measured using a JASCO spectrofluorometer. In the competitive binding studies, concentrations of DNA, NR, and Hoechst 33258 were kept constant (50 μM), while varying all the cycloalkyl α-aminobisphosphonate concentrations from 0 to 50 μM. 2.5 mL of DNA solution (50.0 μM) and NR or Hoechst (50.0 μM) was transferred into a 1 cm quartz cell, and then, a known amount of the cycloalkyl α-aminobisphosphonate (3.0 mM) solution was added in a stepwise manner using a calibrated micropipette.
The cyclic voltammetry (CV) analyses and differential pulse voltammetric analyses (DPV) were performed using an Autolab PGSTAT-30 interfaced to a computer supplied by a general purpose electrochemical system software. A conventional three-electrode system comprising a glassy carbon electrode as working electrode, a saturated Ag/AgCl (inside a Luggin capillary containing 3.0 M KCl) as reference electrode, and a platinum wire as counter electrode was used. Electrochemical experiments were carried out in a 25 mL voltammetric cell at room temperature. The surface of working electrode was polished using 0.05 mm alumina before each experiment and was rinsed with double-distilled water before usage. The supporting electrolyte for investigation of the effect of the cycloalkyl α-aminobisphosphonates was Tris–HCl (pH 7.4), which was prepared in double-distilled water. Cyclic voltammograms (CV) and differential pulse voltammograms (DPV) were recorded by progressive addition of the three new cycloalkyl α-aminobisphosphonate (D1–D3) solutions from 0.0 to 50.0 μM to DNA-NR and DNA-Hoechst solutions at a constant concentration (50.0 μM).
Determining the number of chemical components in a mixture is the first step for further qualitative and quantitative analysis in all forms of spectral data treatment. Procedures for determining the chemical rank of a matrix using a variety of empirical and statistical methods based on PCA have been reported (Dean, 1992). To determine the number of light-absorbing species in the recorded spectral data matrix, the PCA (Dean, 1992) program was used.
PCA (Jackson and Mudholkar, 1979; Jackson, 1991) is a favorite tool of chemometricians for data compression and information extraction. PCA finds combinations of variables, or factors, which describe major trends in the data. This program used an iterative procedure such as nonlinear iterative partial least squares.
The calculations on the structures of the three new cycloalkyl α-aminobisphosphonates (D1–D3) and their complexes with a profile of Nucleotide-954-DNA (with nucleotide sequence: -ATGAAGACTGCT-) have been performed by the appropriate quantum mechanical and molecular mechanics QM-MM methods. This profile of Nucleotide-954-DNA was utilized for DNA modeling from a part of NCBI DNA bank data (National Center for Biotechnology Information). The structures of the compounds D1, D2, and D3 were optimized by the QM-DFT B3LYP/6-31+G* method (Spatran, 2011). The energies and structures of the hydrogen bond linkages of D1–D3 to the DNA profile were obtained by the molecular mechanics MM-SYBYL method. SYBYL line notation or SLN is a general molecular modeling method. The SYBYL method provides essential construction and analysis tools for both organic and inorganic molecular structures. The complexes of the molecules with DNA were calculated by the SYBYL method after optimization of the structures by DFT-B3LYP/6-31+G* method. The two forms (I) and (II) for the complexes were performed by two types of hydrogen bonds ducking of the structures D1 to D3 to the DNA profile. The structures, highest occupied molecular orbital (HOMO) and lowest unoccupied molecular orbital (LUMO) energy levels (Fig. 4), ΔE HOMO-LUMO (in eV), hardness, molecular volumes (in Å3), and the dipole moments (deby) of the molecules D1, D2, and D3 were optimized by B3LYP/6-31+G* method. All of the calculations have been performed by the Spartan10 package (Spatran, 2011).
Results
Spectroscopic studies
UV spectroscopic characteristics
Electronic absorption spectroscopy is an effective method to examine the binding mode of DNA with different compounds. Since the cycloalkyl α-aminobisphosphonate compounds have no absorbance in UV-Vis region, the change of absorbance of DNA at 260 nm was used to examine the interaction of DNA with these compounds (Song et al., 2006).
As seen from Figure 1b, as an example, a small change was observed when the D1 concentration was increased. The same experiments were carried out with the other α-aminobisphosphonates and the same results with some differences were observed. The plot of A/A0 versus ri (ri = [D1–D3]/[DNA]) is presented in Figure 1c. The intensity of the interaction between DNA and the three cycloalkyl α-aminobisphosphonates (D1–D3) is obtained in the order of D1 > D2 > D3.
Determination of the number of light-absorbing components in an equilibrium mixture seems to be an important point before the formulation of the hypothesis of a chemical model. The absorbance matrix monitoring the complex-forming equilibria of DNA with examined α-aminobisphosphonates was subjected to PCA that works with MATLAB media. The break on the curve may be used as a guide to selecting the primary species. As it is obvious (Supplementary Fig. S1; Supplementary Data are available online at
The competitive studies with NR as DNA intercalator probe
UV-Vis spectroscopy
Because of the absence of any significant shift in the maximum wavelength in spectra of DNA-α-aminobisphosphonate systems (Fig. 1b), competitive binding studies with DNA probes were carried out to clear the mode of binding of these compounds with DNA. In comparison with common DNA probes such as ethidium bromide, acridine orange, and diphenylamine blue, the NR ligand has a faster reaction time, lower toxicity, higher stability, and low cost. Therefore, NR was selected as the first DNA probe for studying the interaction of α-aminobisphosphonates with DNA.
At first, the UV-Vis spectrum of NR solution was recorded (Supplementary Fig. S2a). The absorption spectrum in the visible region of the NR solution is characterized by a band at 457 nm. This band was changed into a band whose maximum shifts to ∼544 nm with the addition of DNA solutions. Curves 1–4 will be assigned to spectra reflecting the changes after the addition of increasing amounts of DNA and also an isosbestic point developed at about 500 nm. Addition of the cycloalkyl α-aminobisphosphonate to this solution created no significant change in the spectrum of the NR-DNA complex (Supplementary Fig. S2b).
Fluorescence spectroscopy
The fluorescence spectroscopy was also used to determine the relative binding ability of the α-aminobisphosphonates to DNA by measuring the change in the relative fluorescence intensity of the NR-DNA system as a function of the α-aminobisphosphonate concentration.
The NR has a fluorescence emission curve maximum at 625 nm after being excited at the wavelength of 530 nm. However, it has poor fluorescence efficiency in the Tris–HCl buffer medium, but in the presence of DNA its fluorescence is enhanced (Supplementary Fig. S3 as an example) (Ni et al., 2005). The addition of α-aminobisphosphonates to the solution containing NR-DNA system has no significant effect on its fluorescence intensity, which confirmed the previous results obtained by UV-Vis spectroscopy studies.
Electrochemical study
Furthermore, an electrochemical method (cyclic voltammetry) was used for further investigation of the abovementioned systems (DNA-α-aminobisphosphonates). In the primary experiment, it was clear that α-aminobisphosphonates are not electroactive materials, so, again, NR was used as DNA probe for studying the interaction of α-aminobisphosphonates with DNA. Thus, the cyclic voltammogram of NR was recorded in a Tris–HCl buffer (pH 7.4) containing 50.0 μM NR using a glassy carbon electrode as working electrode. The potential commenced from −1.2 V and its direction was reversed at + 0.2 V. As it can be seen from Supplementary Figure S4, in the forward scan, two oxidation peaks at − 0.61 and + 0.01 V and, in the reverse scan, two reduction peaks in − 0.67 and −1.02 V appeared, and their peaks' current was reduced after addition of DNA to the solution. Furthermore, the peak potential of all cathodic and anodic peaks and their formal potentials (E ° = (E pa + E pc)/2) were shifted toward the positive values. The same behavior has been reported previously (Carter et al., 1989), which confirm that NR acts as an intercalator reagent. Addition of α-aminobisphosphonates (D3 as an example) to the resulted solution had no significant change in peaks' current and peaks' potential. These results indicate that α-aminobisphosphonates cannot be replaced by NR and confirm those finding by UV-Vis and fluorescence spectroscopies.
Also, the differential pulse voltammetry (DPV) method was used for confirmation of the results obtained by CV technique. As shown in Supplementary Figure S5, the NR produces an intense peak at −0.615 V, which not only decreases its current by addition of DNA but also the peak potential of NR shifts toward a positive value. Addition of the α-aminobisphosphonates to the solution containing the NR-DNA system (curves b and c of Supplementary Fig. S5) makes a small decrease in peak current and negatively shifts the peak potential of NR-DNA complex (Supplementary Fig. S6).
The competitive studies with Hoechst as a groove binder DNA probe
Fluorescence study
Hoechst 33258 (29-[4-hydroxyphenyl]-5-[4-methyl-1-piperazinyl]-2, 59-bi-1H-benzimidazole) is a well-known DNA binding agent and a therapeutic drug (Latt et al., 1975). By X-ray crystallographic studies of the complexes formed between Hoechst and various oligonucleotides, it has been established that this drug binds preferentially in the minor groove of AT-rich sequences of a DNA duplex (Teng et al., 1988; Clark et al., 1996). This binding mode has also been found to be the case in solution according to a high-resolution nuclear magnetic resonance (NMR) study (Parkinson et al., 1990; Searle and Embrey, 1990). For more clarification of the binding mode between DNA and the three cycloalkyl α-aminobisphosphonates (D1–D3), competitive binding experiments were carried out with Hoechst as a groove binder. At pH 7.4 (Tris–HCl), Hoechst exhibits a fluorescence emission spectrum with maximum wavelength of 510 nm after being excited with a wavelength of 430 nm (Supplementary Fig. S7). When the DNA solution is added to a fixed amount of Hoechst, there is increase in intensity of Hoechst fluorescences (Supplementary Fig. S7). If increments of α-aminobisphosphonates (D1 as an example) are added to the resulted solution, there are decreases in intensity of Hoechst–DNA fluorescences (Supplementary Fig. S7, curve 3–6), with the consequent outcome that the spectrum of the free Hoechst is nearly restored. The same experiments are carried out with the other α-aminobisphosphonates and the results are summarized in Table 1. It is obvious that the maximum and minimum decreases are associated with D1 and D3 compounds, respectively. The intensity of the interaction between DNA and the three cycloalkyl α-aminobisphosphonates (D1–D3) is obtained with the same previous trend (D1 > D2 > D3).
Electrochemical study
For more clarification in binding mode, competitive binding experiments were carried out using CV and DPV techniques. Hoechst was irreversibly oxidized on a bare glassy carbon electrode and showed two oxidation peaks at +0.5 and +0.7 V (Supplementary Fig. S8) and confirmed the previous report (Sufen et al., 2002). While the Hoechst oxidation is adsorption controlled (I p vs. scan rate plot is linear), after each experiment, the electrode surface must be cleaned. When the DNA solution was added to a fixed amount of Hoechst, the peaks' current of the Hoechst was decreased (Supplementary Fig. S8). After addition of the α-aminobisphosphonates (D2 as an example) to the resulted solution, there were increases in HO-DNA peaks' current (Supplementary Fig. S8) with the consequent outcome that the peaks' current of the free Hoechst was nearly restored (Supplementary Fig. S8, curve b and c). The increases in peaks' current of HO-DNA system in the presence of α-aminobisphosphonates are summarized in Table 1.
The same experiments were carried out with DPV technique. As can be seen from Supplementary Figure S9, Hoechst produces a peak of about 0.7 V, which its current decreases by increasing of DNA concentration, and then increases by addition of α-aminobisphosphonate compounds, which confirm the results obtained by CV. The effect of α-aminobisphosphonates/[Ho-DNA] on the peak current response of HO-DNA complex was studied and results are shown in Supplementary Figure S10. As seen, the largest interaction is associated with D1 and confirms the previous trend (D1 > D2 > D3).
CD spectral study
The CD spectroscopic technique is useful in monitoring the conformational variations of DNA in solution. In the preliminary experiments, the studies of α-aminobisphosphonates were carried out using the CD spectroscopic technique. The obtained results show that all tested compounds have no signal in their CD spectra. When the present compounds are incubated with CT-DNA, the CD spectrum of DNA undergoes no change in both positive and negative bands (Fig. 2). Other tested compounds show similar behavior.

Circular dichroism spectra of CT-DNA in the presence of increasing amounts of D1. CDNA = 0.10 mM; CD1 = 50.0 μM. CT-DNA, calf thymus DNA.
Viscometric studies
As a means for further study regarding the nature of the cycloalkyl α-aminobisphosphonate binding, viscosity measurements were carried out. As seen in Figure 3, the viscosity of the CT-DNA solution undergoes a slight change with increasing in the [α-aminobisphosphonate]/[DNA] ratios.

The effect of nine aminobisphosphonates on the viscosity of CT-DNA. CDNA = 50 μM; Ri = [aminobisphosphonate]/[DNA] = 0–2.
Computational and molecular modeling methods
The structures, HOMO and LUMO energy levels (Fig. 4), ΔE HOMO-LUMO (in eV), hardness, molecular volumes (in Å3), and the dipole moments (deby) of the molecules D1, D2, and D3 were optimized by the B3LYP/6-31+G* method. These data are demonstrated in Table 2. The energies and patterns of the two types of hydrogen bonds ducking of the structures D1 to D3 to the DNA profile by the molecular mechanics SYBYL method are optimized in Table 3 (see the hydrogen bonds and ducking of the structures D1 to the DNA profile in Figs. 5 and 6). Figures 5 and 6 have demonstrated the structural QM-MM calculations (QM-B3LYP/6-31+G* for compound D1 and MM-SYBYL method for linkages of D1 with DNA). The forms (I) and (II) have shown two different hydrogen bond linkages of D1–D3 to DNA. The structures have been demonstrated in vertical (up) and horizontal (down) dimensions. Figure 5 has shown the electron density patterns of the complex DNA with D1 in two forms (I) and (II) by QM-MM calculations (QM-B3LYP/6-31+G* for compound D1 and MM-SYBYL method for hydrogen bond linkages of D1 with DNA). These patterns in D1, D2, and D3 are similar.

The HOMO and LUMO orbitals and the energy levels of compound D1. HOMO, highest occupied molecular orbital; LUMO, lowest unoccupied molecular orbital.
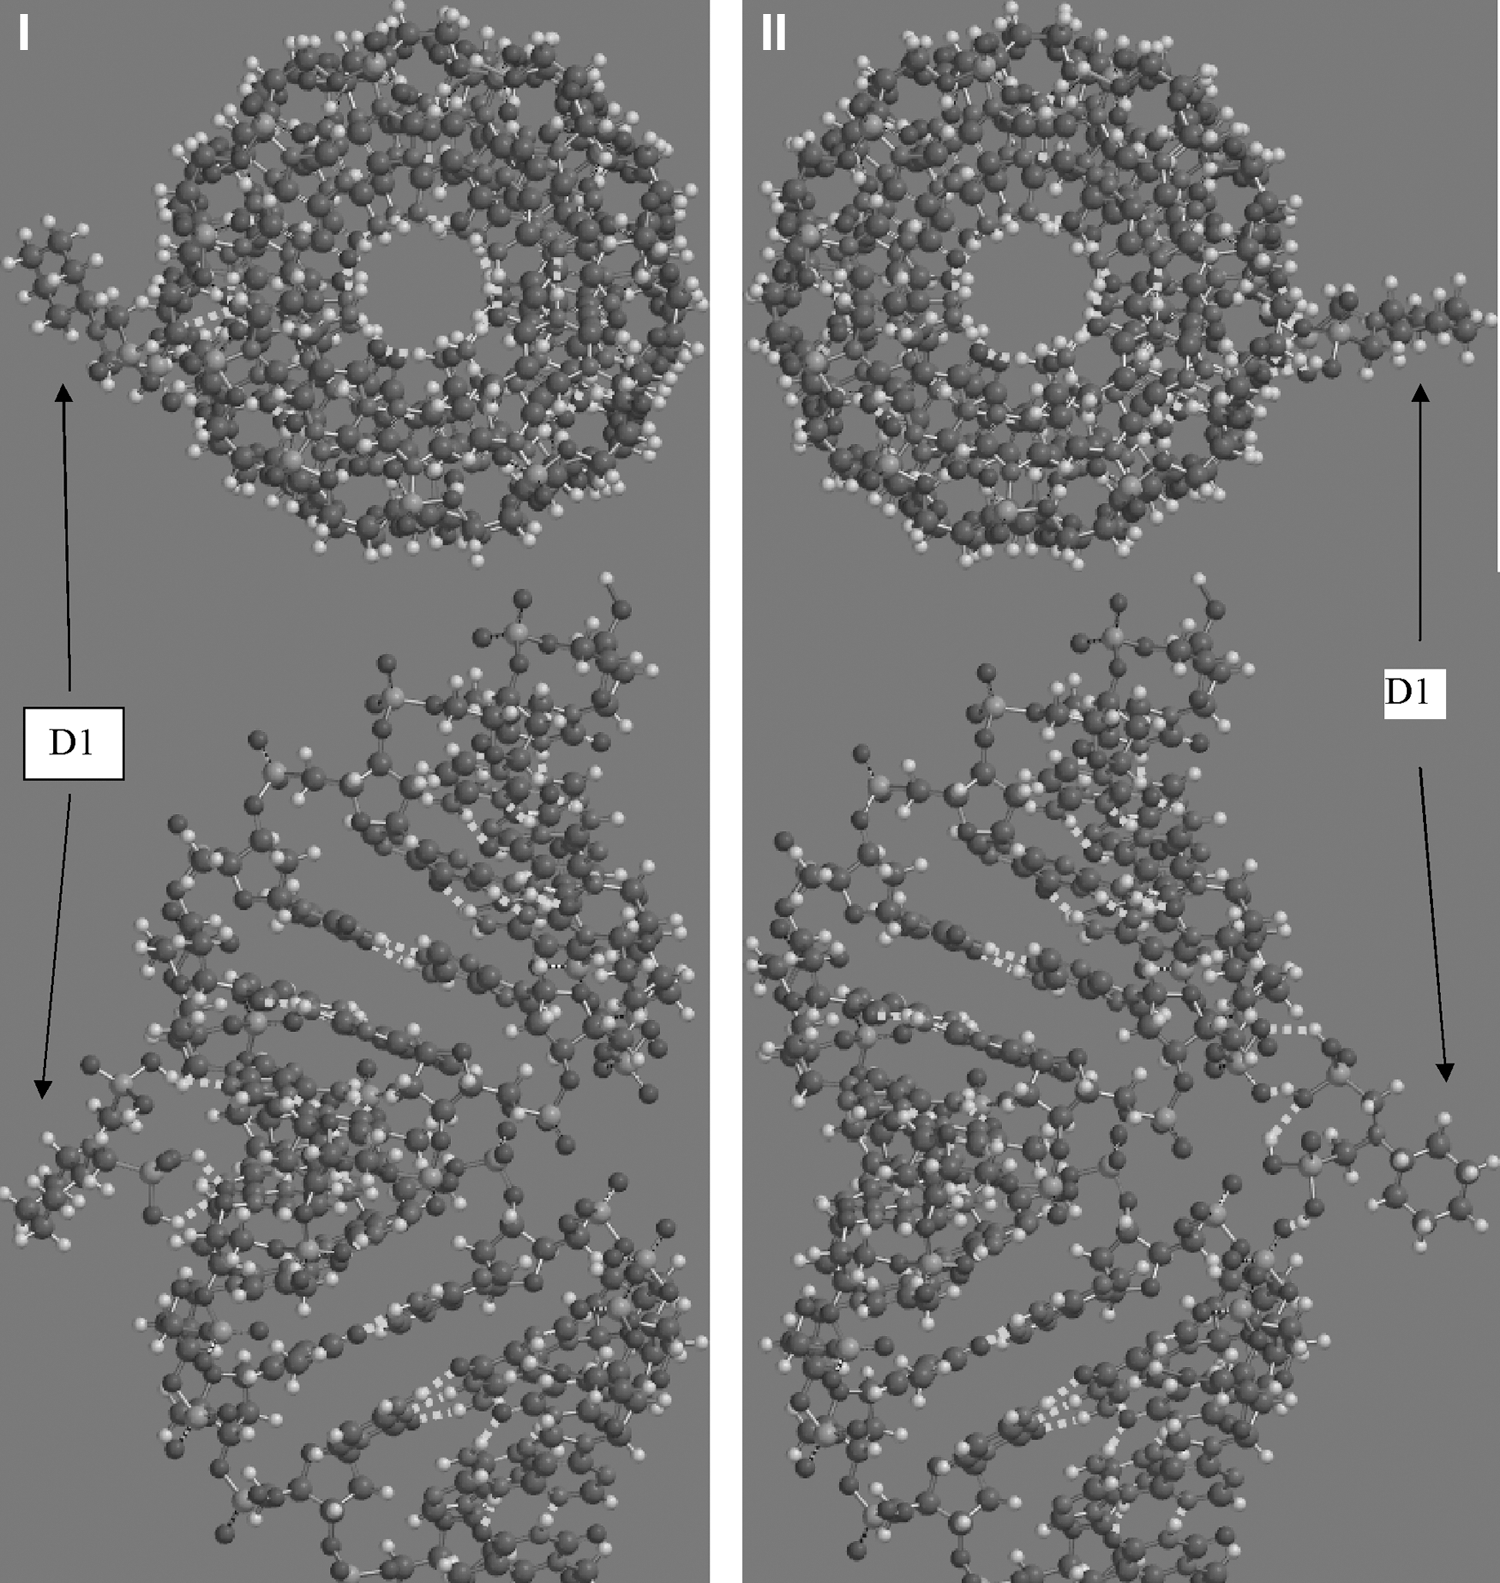
The structural QM-MM calculations (QM-B3LYP/6-31G* for compound D1 and MM-SYBYL method for linkages of D1 with DNA). The forms (I) and (II) have shown the two different hydrogen bond linkages of D1 to DNA. The structures have been demonstrated in vertical (up) and horizontal (down) dimensions. QM-MM, quantum mechanical-molecular mechanics; MM-SYBYL, molecular mechanics-SYBYL.

The electron density patterns of the complexes DNA-D1 in two forms (I) and (II) by QM-MM calculations (QM-B3LYP/6-31G* for compound D1 and MM-SYBYL method for hydrogen bond linkages of D1 with DNA).
HOMO, highest occupied molecular orbital; LUMO, lowest unoccupied molecular orbital.
The forms (I) and (II) are shown in the figures.
MM-SYBYL, molecular mechanics-SYBYL.
The values of ΔE HOMO-LUMO (in eV) in the group of compounds D1–D3 were 6.11, 6.65, and 6.66 eV, respectively. The HOMO and LUMO energy levels for D1, D2, and D3 are (−6.82 and −0.71 eV), (−7.53 and −0.88 eV), and (−7.57 and −0.91 eV), respectively. The values of the hardness (in eV) in the group of compounds D1–D3 were 3.05, 3.32, and 3.33 eV, respectively. Theoretical studies have shown that the value of LUMO energy level for D1 is more stable than D2 and D3, so D1 is a better and softer base than the two other molecules. The binding energy of D1 with DNA makes an exothermic process than D2 and D3, because of the lowest energy level of LUMO of D1 than D2 and D3. The theoretical results (D1 > D2 > D3) are similar to the experimental results (D1 > D2 > D3) (Table 2). The calculation results by B3LYP/6-31+G* demonstrated that molecule D1 has the bigger value of dipole moment (6.27 deby) among D1 to D3 (for D2; 4.65 and D3; 4.46 deby). So, the dipolar binding of D1 with DNA is better than D2 and D3 (D1 > D2 > D3). Figures 4 and 5 have demonstrated the shape of ducking of D1 with hydrogen bonding and in two different forms (I and II). The gaps of the energies between the two ducking forms of D1 to D3 with the DNA profile (I and II) were obtained by SYBYL method as 1729.33, −75.90, and −28.16 kJ·mol−1, respectively (D1 > D2 > D3) (Table 3). The aliphatic parts, that is, cyclohexyl ring and −CH2− moiety in forms (I) of the compounds D1 have made a better and nearer position to the DNA structure in comparison with the forms (II). On the other hand the binding properties between D1 and D3 with DNA getting increase by increasing the size of the cycloalkyl groups and also dipole moment in the structures of the three new cycloalkyl α-aminobisphosphonates (D1 − D3). The curvature of the aliphatic (cycloalkyl and −CH2−) moieties has made a better condition for D1 to curve toward the DNA chain. This effect was shown better in the forms of D1 than D2 and D3 (better in form D1-I). It may relate to the hydrophobicity of the bigger aliphatic parts in D1 and the suitable polarity to bind with DNA chain (Figs. 4 and 5). The calculation results have shown that forms (I) in D1 are more stable than forms (II). The theoretical results have shown good agreement with the experimental results (D1 > D2 > D3).
Discussion
In this work, the spectroscopic and voltammetric methods were utilized to determinate the binding mode of the three new cycloalkyl α-aminoalkylphosphonic acids D1 to D3 (Fig. 1a) to DNA by competition experiments with NR and HO as specific binding probes.
In UV-Vis spectroscopy investigations, the change of DNA absorption peak at 260 nm was used to study. The interaction of DNA with each compound can be distinguished from the created hyperchromic or hypochromic effect in DNA spectrum (Li et al., 1996). Hypochromism results from the contraction of DNA in the helix axis, as well as from the change in conformation on DNA, while hyperchromism is due to the damage of the DNA double-helix structure (Ni et al., 2005).
The results from Figure1b (as an example) indicate that this compound D1 is not able to change significantly the DNA double-helix structure. It is obvious that the difference in the structure of the α-aminobisphosphonates is due to N alkyl chains and the attached cycloalkyl ring size. D1 with the lengthy chain has the stronger interaction with DNA and resulted in more change in the DNA spectrum, while the lowest interaction is associated with D3, which has the shorter N alkyl chain and small ring size. On the contrary, not only the length of the chain but also the heterocyclic size associated to N alkyl chain affects the strength of the interaction of the three cycloalkyl α-aminobisphosphonates (D1–D3) with DNA. As a result, D1 with the longer N alkyl chains have the stronger interaction with DNA relative to D2 and D3. In addition, D1 and D2 with a larger cycloalkyl ring size in their structures reveal a better corresponding interaction with DNA rather than the other tested compound (D3).
The PCA calculations (Supplementary Fig. S1) show that there are three species in this complexation equilibrium of DNA with D1. Among these, free DNA and free α-aminobisphosphonates are two species that presented in the equilibrium and the other species is attributed to the DNA-α-aminobisphosphonate complex formed in solution.
In first competition study, the shift in UV-Vis absorption spectra of NR was attributed to the formation of the NR-DNA complex. Addition of the cycloalkyl α-aminobisphosphonate to this solution created no significant change in the spectrum of the NR-DNA complex. This indicates that NR binds more favorably to the DNA molecule than to the α-aminobisphosphonates and that, therefore, these compounds cannot exchange with the intercalated NR, with the consequent outcome that the spectrum of the NR-DNA complex is nearly restored (Supplementary Fig. S2b as an example). In contrast, the results indicate that NR is an intercalator whose chromophore inserts into the base pairs of DNA (Ni et al., 2005) and refuses the intercalation interaction between the cycloalkyl α-aminobisphosphonate (D1–D3) and DNA.
We saw that the addition of α-aminobisphosphonates to the solution containing NR-DNA system has no significant effect on its fluorescence intensity. We can say that if these compounds could be inserted within the DNA base pairs and released the NR, the fluorescence intensity of the NR-DNA system must be changed to spectrum of solution containing only NR. So, α-aminobisphosphonates cannot be replaced by NR as an intercalator reagent.
Moreover, electrochemical results indicate that α-aminobisphosphonates cannot replace the NR and confirm these finding by UV-Vis and fluorescence spectroscopies. On the contrary, these data refuse the intercalative mode of α-aminobisphosphonates with DNA.
Also, the differential pulse voltammetry (DPV) method confirmed the results obtained by the CV technique. The current decrease and potential shift toward positive value confirm the formation of NR-DNA complex (Supplementary Fig. S5). This behavior may be due to groove binding of the α-aminobisphosphonates with DNA (Supplementary Fig. S6).
In the next competition studies with Hoechst as groove binder, after addition of DNA solution to a fixed amount of Hoechst, the increase in intensity of Hoechst fluorescences (Supplementary Fig. S7) indicates the interaction of Hoechst with DNA via groove binding. Then, the observed decreases in intensity of Hoechst–DNA fluorescences (Supplementary Fig. S7, curve 3–6), with increments of α-aminobisphosphonates (D1 as an example), indicate that α-aminobisphosphonate binds more favorably to the DNA molecule and releases the Hoechst. It is obvious from Table 1. The maximum and minimum decreases are associated with D1 and D3 compounds, respectively. The intensity of the interaction between DNA and the three cycloalkyl α-aminobisphosphonates (D1–D3) is obtained with the same previous trend (D1 > D2 > D3), which is related to the variation in the structure of the α-aminobisphosphonates. D1 with the lengthy chain and larger heterocyclic size has the stronger interaction with DNA and resulted more decrease in the HO-DNA spectrum, while the lowest interaction is associated with D3 that has the shortest chain and smaller cycloalkyl ring size.
Also, the electrochemical results (Supplementary Fig. S8) indicated the formation of the HO-DNA complex via groove binding. The resulted changes after addition of the α-aminobisphosphonates (D2 as an example) indicated that Hoechst can be replaced by the α-aminobisphosphonates with the consequent outcome that the peaks' current of the free Hoechst was nearly restored (Supplementary Fig. S8, curve b and c).
The results in Supplementary Figure S10 showed that the largest interaction is associated with D1 and confirm the previous trend (D1 > D2 > D3).
After competition studies, we used two more techniques that can expect the binding mode directly.
The observed CD spectrum of CT-DNA consists of a positive band at 275 nm (UV λmax 260 nm) due to base stacking and a negative band at 245 nm due to helicity, which are characteristics of DNA in right-handed B form (Collins et al., 1994).The simple groove binding and electrostatic interaction of a small molecules with DNA show less or no perturbations on the base stacking and helicity bands, while intercalation enhances the intensities of both the bands stabilizing the right-handed B conformation of CT-DNA as observed for the classical intercalator methylene blue (Collins et al., 1994).
The lack of considerable change in definite CD spectrum of DNA (Fig. 2) confirms outside binding to DNA (Fig. 2, data for D1). Other tested compounds show similar behavior (Zhang et al., 2013).
Viscosity measurements that are sensitive to length change are regarded as the least ambiguous and the most critical tests of binding model in solutions in the absence of crystallographic structural data or NMR. A classical intercalation model results in lengthening the DNA helix, as base pairs are separated to accommodate the binding compound, leading to DNA viscosity increase. In contrast, groove-face or electrostatic interactions typically cause less pronounced or no change in the DNA solution viscosity (Johnson and Mukhtar, 2007).
These observations (Fig. 3) reveal that interaction of the cycloalkyl α-aminobisphosphonates with DNA molecule is due to outside binding of mentioned compounds to DNA (Johnson and Mukhtar, 2007; Zhang et al., 2014).
Conclusion
This analytical investigation using CV and DPV, as well as viscometry, UV-visible, CD and fluorescence spectroscopies, in conjunction with chemometrics methods, showed that α-aminobisphosphonates bind to DNA via grooves. In UV-Vis spectroscopy, the result indicates that these compounds are not able to change significantly the DNA double-helix structure.
The PCA method showed three species in complexation equilibrium of DNA with α-aminobisphosphonates.
As our compounds do not have any intrinsic peak in fluorescence, CV, and DPV, we use competition studies for more clarification. For this, NR as intercalation and Hoechst as groove binding probes were used. It was seen that α-aminobisphosphonates cannot replace the NR in DNA bases, while they replace the Hoechst in DNA grooves.
These observations along with slight changes in CD spectrum and viscosity of DNA, with increasing in compound concentration, reveal that interaction of the α-aminobisphosphonates with DNA molecule is due to outside binding of mentioned compounds in DNA grooves.
Furthermore, our findings confirm a relationship between change intensity and α-aminobisphosphonate structure. The intensity of the interaction between DNA and α-aminobisphosphonates is obtained in the order of D1 > D2 > D3. It is obvious that the difference in the structure of α-aminobisphosphonates is due to N alkyl chains. D1 with the lengthy chain has the stronger interaction with DNA and resulted more change in the DNA spectrum, while the lowest interaction is associated with D3, which has the shorter chain. Furthermore, not only the length of the chain but also the heterocyclic size associated to N alkyl chain affects the strength of the interaction of the three cycloalkyl α-aminobisphosphonates (D1–D3) with DNA. As a result, D1 with the longer N alkyl chains have the stronger interaction with DNA relative to D2 and D3. In addition, D1 and D2 with a larger heterocyclic size in their structures reveal the better corresponding interaction with DNA rather than the other tested compound (D3).
The energies and structures of the hydrogen bond linkages of D1 to D3 to the DNA profile were obtained by molecular mechanics QM-SYBYL method. The theoretical results have shown good agreement to the reaction and the relationship between the three new cycloalkyl α-aminobisphosphonate (D1–D3) structures and DNA (D1 > D2 > D3) and the experimental results (D1 > D2 > D3).
Footnotes
Disclosure Statement
No competing financial interests exist.
References
Supplementary Material
Please find the following supplemental material available below.
For Open Access articles published under a Creative Commons License, all supplemental material carries the same license as the article it is associated with.
For non-Open Access articles published, all supplemental material carries a non-exclusive license, and permission requests for re-use of supplemental material or any part of supplemental material shall be sent directly to the copyright owner as specified in the copyright notice associated with the article.