
Abstract
The aim of this study is to discuss the hypothesis that expression of plasma atherosclerosis-associated microRNAs (miRNAs) in hyperhomocysteinemia (Hhcy) patients could predict the presence of atherosclerosis from different channels. Six plasma miRNAs (miR-145, miR-155, miR-222, miR-133, miR-217, and miR-30) selected for our study have been confirmed as critical gene regulators involved in atherosclerosis and can be steadily determined in plasma. Expression of the above six plasma circulating miRNAs revealed significant upregulation of two miRNAs (miR-133 and miR-217) and downregulation of three miRNAs (miR-145, miR-155, and miR-222). Six candidate miRNAs showed a significant correlation with homocysteine (Hcy) or lipid parameters. The results of this study indicated that miR-217 was further significantly upregulated in Hhcy + ATH groups than in normal control, Hhcy-, and atherosclerosis-alone (ATH) groups and it showed a significant negative correlation with Hcy and triglycerides. More specifically, miR-217 showed the most specific expression patterns in all patients with atherosclerosis (ATH and Hhcy + ATH groups), which may have been a diagnostic value for Hhcy complicated with atherosclerosis, and predicted the progress of atherosclerosis in Hhcy patients effectively.
Introduction
A
The development of atherosclerosis is known to have determined other metabolic risk factors, such as hypertension, diabetes mellitus, and dyslipidemia. Hyperhomocysteinemia (Hhcy) has been regarded as an emerging risk factor for the development of atherosclerosis (Tribouilloy et al., 2000; Schaffer et al., 2014). Hhcy increases the risk of carotid artery plaque. The potential mechanism is related with homocysteine initiating an inflammatory response in vascular smooth muscle cells (VSMCs), migration of VSMCs, and triggering proliferation (Jeon et al., 2014; Meng et al., 2016). Although the role of Hhcy in atherosclerosis is documented, the regulatory mechanism is still nebulous. Recent studies have suggested that microRNAs (miRNAs) work as a key factor in atherosclerosis development and dyslipidemia (Urbich et al., 2008; Zhang et al., 2015; Baldan and Fernandez-Hernando, 2016; Gao et al., 2016). However, the exact correlation on the expression of atherosclerosis-associated miRNAs in Hhcy patients remains to be elucidated further.
miRNAs are ∼22 nucleotide-long noncoding RNAs and post-transcriptionally inhibit gene expression usually by binding the three prime untranslated regions (3′-UTR) of target messenger RNAs (mRNAs) in mammals (Deddens et al., 2013; Maegdefessel, 2014; Gao et al., 2016). miRNAs have proven major roles in almost all biological processes by influencing the stability and translation of their target mRNAs. In previous years, emerging evidences have demonstrated that circulating miRNAs could be considered novel and potential biomarkers for the diagnosis and prognosis of diseases (Lee et al., 2017; Liu et al., 2017; Matsuzaki et al., 2017). Therefore, confirming the expression patterns of atherosclerosis-associated plasma miRNAs in patients with Hhcy may help us reanalyze the association between atherosclerosis and Hhcy from different perspectives.
We aimed to address the hypothesis that expression of plasma atherosclerosis-associated miRNAs in Hhcy patients could predict the presence of atherosclerosis from different channels. Six plasma miRNAs confirmed as critical gene regulators involved in atherosclerosis and can be stably determined in plasma were selected for our study. miR-217 promotes endothelial senescence and it has been shown to express in human carotid plaques (Duan et al., 2016). miR-222 is an antiangiogenic gene regulating miRNAs involved in VSMC growth (Dentelli et al., 2010). miR-133 inhibited the proliferation of endometrial epithelial cells (Gao et al., 2016). miR-30 induces cell senescence (Huang et al., 2016). miR-145 promotes differentiation and prevents the proliferation of VSMCs (Zhao et al., 2015). miR-155 facilitated the inflammatory response of macrophages (Du et al., 2014; Tian et al., 2014).
Materials and Methods
Informed consent
The study followed the protocol for sample collection, which was approved by the Ethics Committee of First Affiliated Hospital of Shihezi University Medical College. All requirements were met according to the Declaration of Helsinki. Patients were fully informed of the study procedures before they provided their consent.
Research subjects
For this study, hyperhomocysteinemia (Hhcy) is taken as plasma homocysteine (Hcy) level above 15 μm/L (Kesherwani et al., 2015). Carotid artery atherosclerosis is characterized by carotid artery ultrasonography (USG) for plaque formation to categorize the subjects into plaque or no plaque groups. About 310 newly diagnosed Hhcy-alone subjects were screened in the Department of Cardiovascular Diseases in First Affiliated Hospital of Shihezi University Medical College from January 2012 to December 2015. Patients with history of hypertension, ischemic heart disease, diabetes mellitus, chronic liver diseases, chronic renal diseases, and those patients with excessive drinking and smoking were excluded. Finally, only 167 Hhcy patients were involved in the study. Out of these, 30 Hhcy and carotid artery atherosclerosis combined (Hhcy + ATH) subjects and 25 Hhcy stand-alone patients were picked. Both groups were matched for age, sex, body mass index (BMI), and blood pressure (BP). In addition, 25 carotid artery atherosclerosis-alone (ATH) subjects and 25 normal control (NC) subjects were picked and matched to the Hhcy + ATH group for age, sex, BMI, and BP. These subjects were drawn from 860 individuals who were already receiving health checkups at a physical examination center of the First Affiliated Hospital of Shihezi University Medical College during the same period.
Carotid artery USG for plaque formation
All patients underwent carotid artery USG to identify plaque formation. Individual patients were asked to lie down in a semidark room in a supine position, with their neck slightly extended and turned from the imaging sensor. Both the right and left carotid arteries and the bifurcation were visualized by an experienced radiologist via an USG device (Hitachi) using a 9 MHz linear ultrasound probe. According to study criteria, the absence of atherosclerotic plaque was considered “normal,” whereas positive results are indicative of atherosclerotic plaque (Arslan et al., 2016).
Biochemical assays
Whole blood samples were collected from each patient in ethylene diamine tetraacetic acid (EDTA) tubes, by fasting within 8 h, in the morning. Plasma Hcy, triglycerides (TG), total cholesterol (TC), high-density lipoprotein (HDL), low-density lipoprotein (LDL), apolipoprotein A, apolipoprotein B, apolipoprotein A/B, fasting blood glucose, alanine aminotransferase, aspartate aminotransferase, uric acid, and serum creatinine (Cre) were measured by using Hitachi 7600 automated biochemistry analyzer in the First Affiliated Hospital of Shihezi University Medical College.
In conclusion, whole blood samples were collected in tubes containing EDTA, by fasting within 8 h, in the morning. These samples were immediately centrifuged at 3000 rpm for 10 min at room temperature. After separation phase, plasma was collected and divided into two aliquots and it was frozen at −80°C later for RNA isolation.
RNA isolation and quantitative real-time PCR for miRNA expression
The miRNAs were extracted from a serum volume of 400 μL by using the miRcute miRNA Isolation Kit (Tiangen, Beijing, China) following the manufacturer's instructions and the guide from previous methods (Lv et al., 2015). Briefly, samples were supplemented with 3.5 μL miRNeasy Serum/Plasma Spike-In Control (1.6 × 10⁸ copies/μL working solution) (Qiagen, Germany). We demonstrated that the cel-miR-54 could be used for normalization of the RNA preparation (Baraniskin et al., 2013; Kuhlmann et al., 2014). Spike-in normalization with synthetic Caenorhabditis elegans-derived cel-miR-54 sequence was performed to allow relative comparison across the analyzed plasma samples (Mitchell et al., 2008). The cDNA was generated using the miRcute miRNA First-Strand cDNA Synthesis Kit (Tiangen), which was performed based on the protocols. Real-time PCR of miR-217, miR-222, miR-30, miR-133, miR-145, and miR-155 was performed to utilize the miRcute miRNA qPCR Detection Kit (SYBR Green) (Tiangen). The reaction volume was 20 μL along with a 3.0 μL cDNA used as a template. PCR was performed under the following conditions: initial denaturation at 94°C for 2 min followed by 45 cycles of denaturation at 95°C for 5 s and annealing and extension at 65°C for 40 s. The comparative Ct method (ΔCt) was exploited to calculate the relative expression level of miR. Relative quantification of miRNA expression was calculated by using the 2−ΔΔCt method (Wang et al., 2010).
Statistical analysis
SPSS software for Windows version 20.0 (SPSS, Inc., Chicago) and GraphPad Prism 5.0 software (GraphPad Software, Inc., La Jolla, CA) were used in statistical analysis. For baseline characteristics of patients and controls, continuous variables were summarized as mean ± standard, and discrete variables as counts and proportions. For the normally distributed data, one-way analysis of variance (ANOVA) and multiple comparison least significant difference (LSD) tests were applied. The Kruskal–Wallis test was carried out to compare data that were not normally distributed. The significance of miRNA level differences between the carotid artery plaque group and no-plaque group was assessed by the independent sample Student's t-test. The χ
2 test was used to compare gender distributions. Pearson's correlations were used to examine relationships between miRNAs and Hcy, lipid parameters, as well as carotid atherosclerotic plaque value. HemI Heatmap illustrator version 1.0 (
Results
Significant differences of clinical features among four groups
The basic characteristics and clinical features of the studied groups are provided in Table 1. Serum Hcy, TG, TC, and LDL-cholesterol (LDL-c) show differences among the groups (p < 0.05). No significant differences were found in other clinical factors, including gender distribution, BMI, age, and HDL-cholesterol. As demonstrated in Figure 1, serum TC level in the Hhcy + ATH group was significantly higher than that in the Hhcy, ATH, and NC groups. In addition, serum TG level in the Hhcy group was higher than in the Hhcy + ATH and NC groups. Serum LDL-c levels in Hhcy, Hhcy + ATH, and ATH groups were all significantly higher than the NC group, while no differences in serum TG and LDL-c levels were found between the Hhcy + ATH and ATH subjects.

Multiple comparisons of baseline characteristics (Hcy
Continuous and categorical variable data are expressed as mean ± SEM. The statistical p-value was generated by the one-way ANOVA test or Kruskal–Wallis test. χ 2 test was used to compare gender distribution. * p < 0.05 or ** p < 0.001 was considered significant.
ALT, alanine aminotransferase; ANOVA, analysis of variance; ApoA, apolipoprotein A; ApoB, apolipoprotein B; Apo(A/B), apolipoprotein A/B; AST, aspartate aminotransferase; ATH, atherosclerosis; BMI, body mass index; Cre, creatinine; FBG, fasting blood glucose; Hcy, homocysteine; Hhcy, hyperhomocysteinemia; HDL-c, high-density lipoprotein-cholesterol; LDL-c, low-density lipoprotein-cholesterol; NC, normal control; SEM, standard error of the mean; TC, total cholesterol; TG, triglycerides; UA, uric acid.
All six miRNAs can be stably detected in plasma samples from all subjects
Six miRNAs were stably detected in serum samples of all subjects. No significant differences were discovered in the total RNA concentration among the four groups (Fig 2A: NC 11.10 ± 10 ng/μL, Hhcy 10.78 ± 1.41 ng/μL, Hhcy + ATH 11.18 ± 1.41 ng/μL, and ATH 10.88 ± 1.88 ng/μL). The primers for six candidate miRNAs and cel-miR-54 are listed in Supplementary Table S1 (Supplementary Data are available online at

In the quantitative real-time PCR (qRT-PCR) analysis (Fig. 2B), all six miRNAs and cel-miR-54 showed reliable Ct values in all subjects. The spike-in control miRNA mimic (cel-miR-54) demonstrated both stable and moderate abundance in all subjects and no differences among the four groups.
Five of six candidate miRNAs have significantly different expression levels among the four groups
As shown in Figure 2C, the relative expression of miR-145 showed significant downregulation in NC (4.13 ± 0.85), Hhcy (3.07 ± 0.77), Hhcy + ATH (0.96 ± 0.98), and ATH (1.23 ± 0.38) groups, respectively, especially in the Hhcy + ATH group. No significant difference was observed between the Hhcy + ATH and ATH subjects. miR-155 showed a significant gradual decrease trend from NC (4.55 ± 0.67) to Hhcy (4.05 ± 0.43) and then to Hhcy + ATH (2.93 ± 0.54) and ATH (1.73 ± 0.51). miR-222 showed a significant stepwise decrease trend from NC (1.11 ± 0.45) to Hhcy (0.99 ± 0.52) and then to Hhcy + ATH (0.57 ± 0.42) and ATH (0.53 ± 0.45), no significant difference was found between the Hhcy + ATH and ATH subjects, as well as that between NC and Hhcy groups. Both miR-133 and miR-217 showed a significant stepwise increase trend from NC (0.68 ± 0.39 and 1.43 ± 0.63, respectively) to Hhcy (0.98 ± 0.46 and 2.29 ± 0.57, respectively) and then to Hhcy + ATH (1.84 ± 0.56 and 2.72 ± 0.70, respectively) or ATH (1.37 ± 0.64 and 2.51 ± 0.99, respectively) group. Finally, miR-30 showed no significant difference in all subjects.
Correlations between miRNAs and Hcy as well as lipid parameters
Detailed data on correlations between six candidate miRNAs and Hcy as well as lipid parameters of all subjects are presented in Table 2. As showed in Supplementary Figure S1, Pearson's correlation analysis demonstrated that Hcy was positively correlated with TC and LDL-c, respectively. miR-145 expression level showed a significant negative correlation with Hcy, TC, and LDL-c (Supplementary Fig. S2). miR-155 expression level also showed a significant negative correlation with Hcy (Supplementary Fig. S3), whereas no associations were found between miR-155 and lipid parameters. Similarly, expression level of miR-222 displayed a significant negative correlation with TC only (Supplementary Fig. S4). Upregulated miRNAs (miR-133 and miR-217) were positively correlated with Hcy and blood lipids (TC or LDL-c) (Supplementary Figs. S5 and S6).
Pearson's correlations were presented as correlation coefficients (r) and significance (p), p < 0.05 or p < 0.001 was considered significant.
Hierarchical clustering based on the five differentially expressed plasma miRNAs among four groups could separate a majority of subjects of each group
Hierarchical clustering analysis can find linear combinations of miRNAs, that is, maximizing the probability of correctly assigning subjects (Sturn et al., 2002). The five miRNA expression levels are different among the four groups included to generate a heatmap diagram shown in Figure 3. Hierarchical clustering analysis based on five differentially expressed plasma miRNAs could separate a majority of subjects from each group. NC subjects (n = 25) were clustered together with only four Hhcy patients mixed in it. Twenty-one of 25 (21/25) Hhcy-alone subjects were clustered together without any other subjects mixed in it. All of Hhcy + ATH (n = 30) subjects with 10 ATH subjects mixed in it. Fifteen of 25 (15/25) ATH subjects were clustered together without any other subjects mixed in it. With regard to variable clustering, miR-145 was clustered with miR-155, and miR-133 was clustered with miR-217, respectively (Fig. 3).
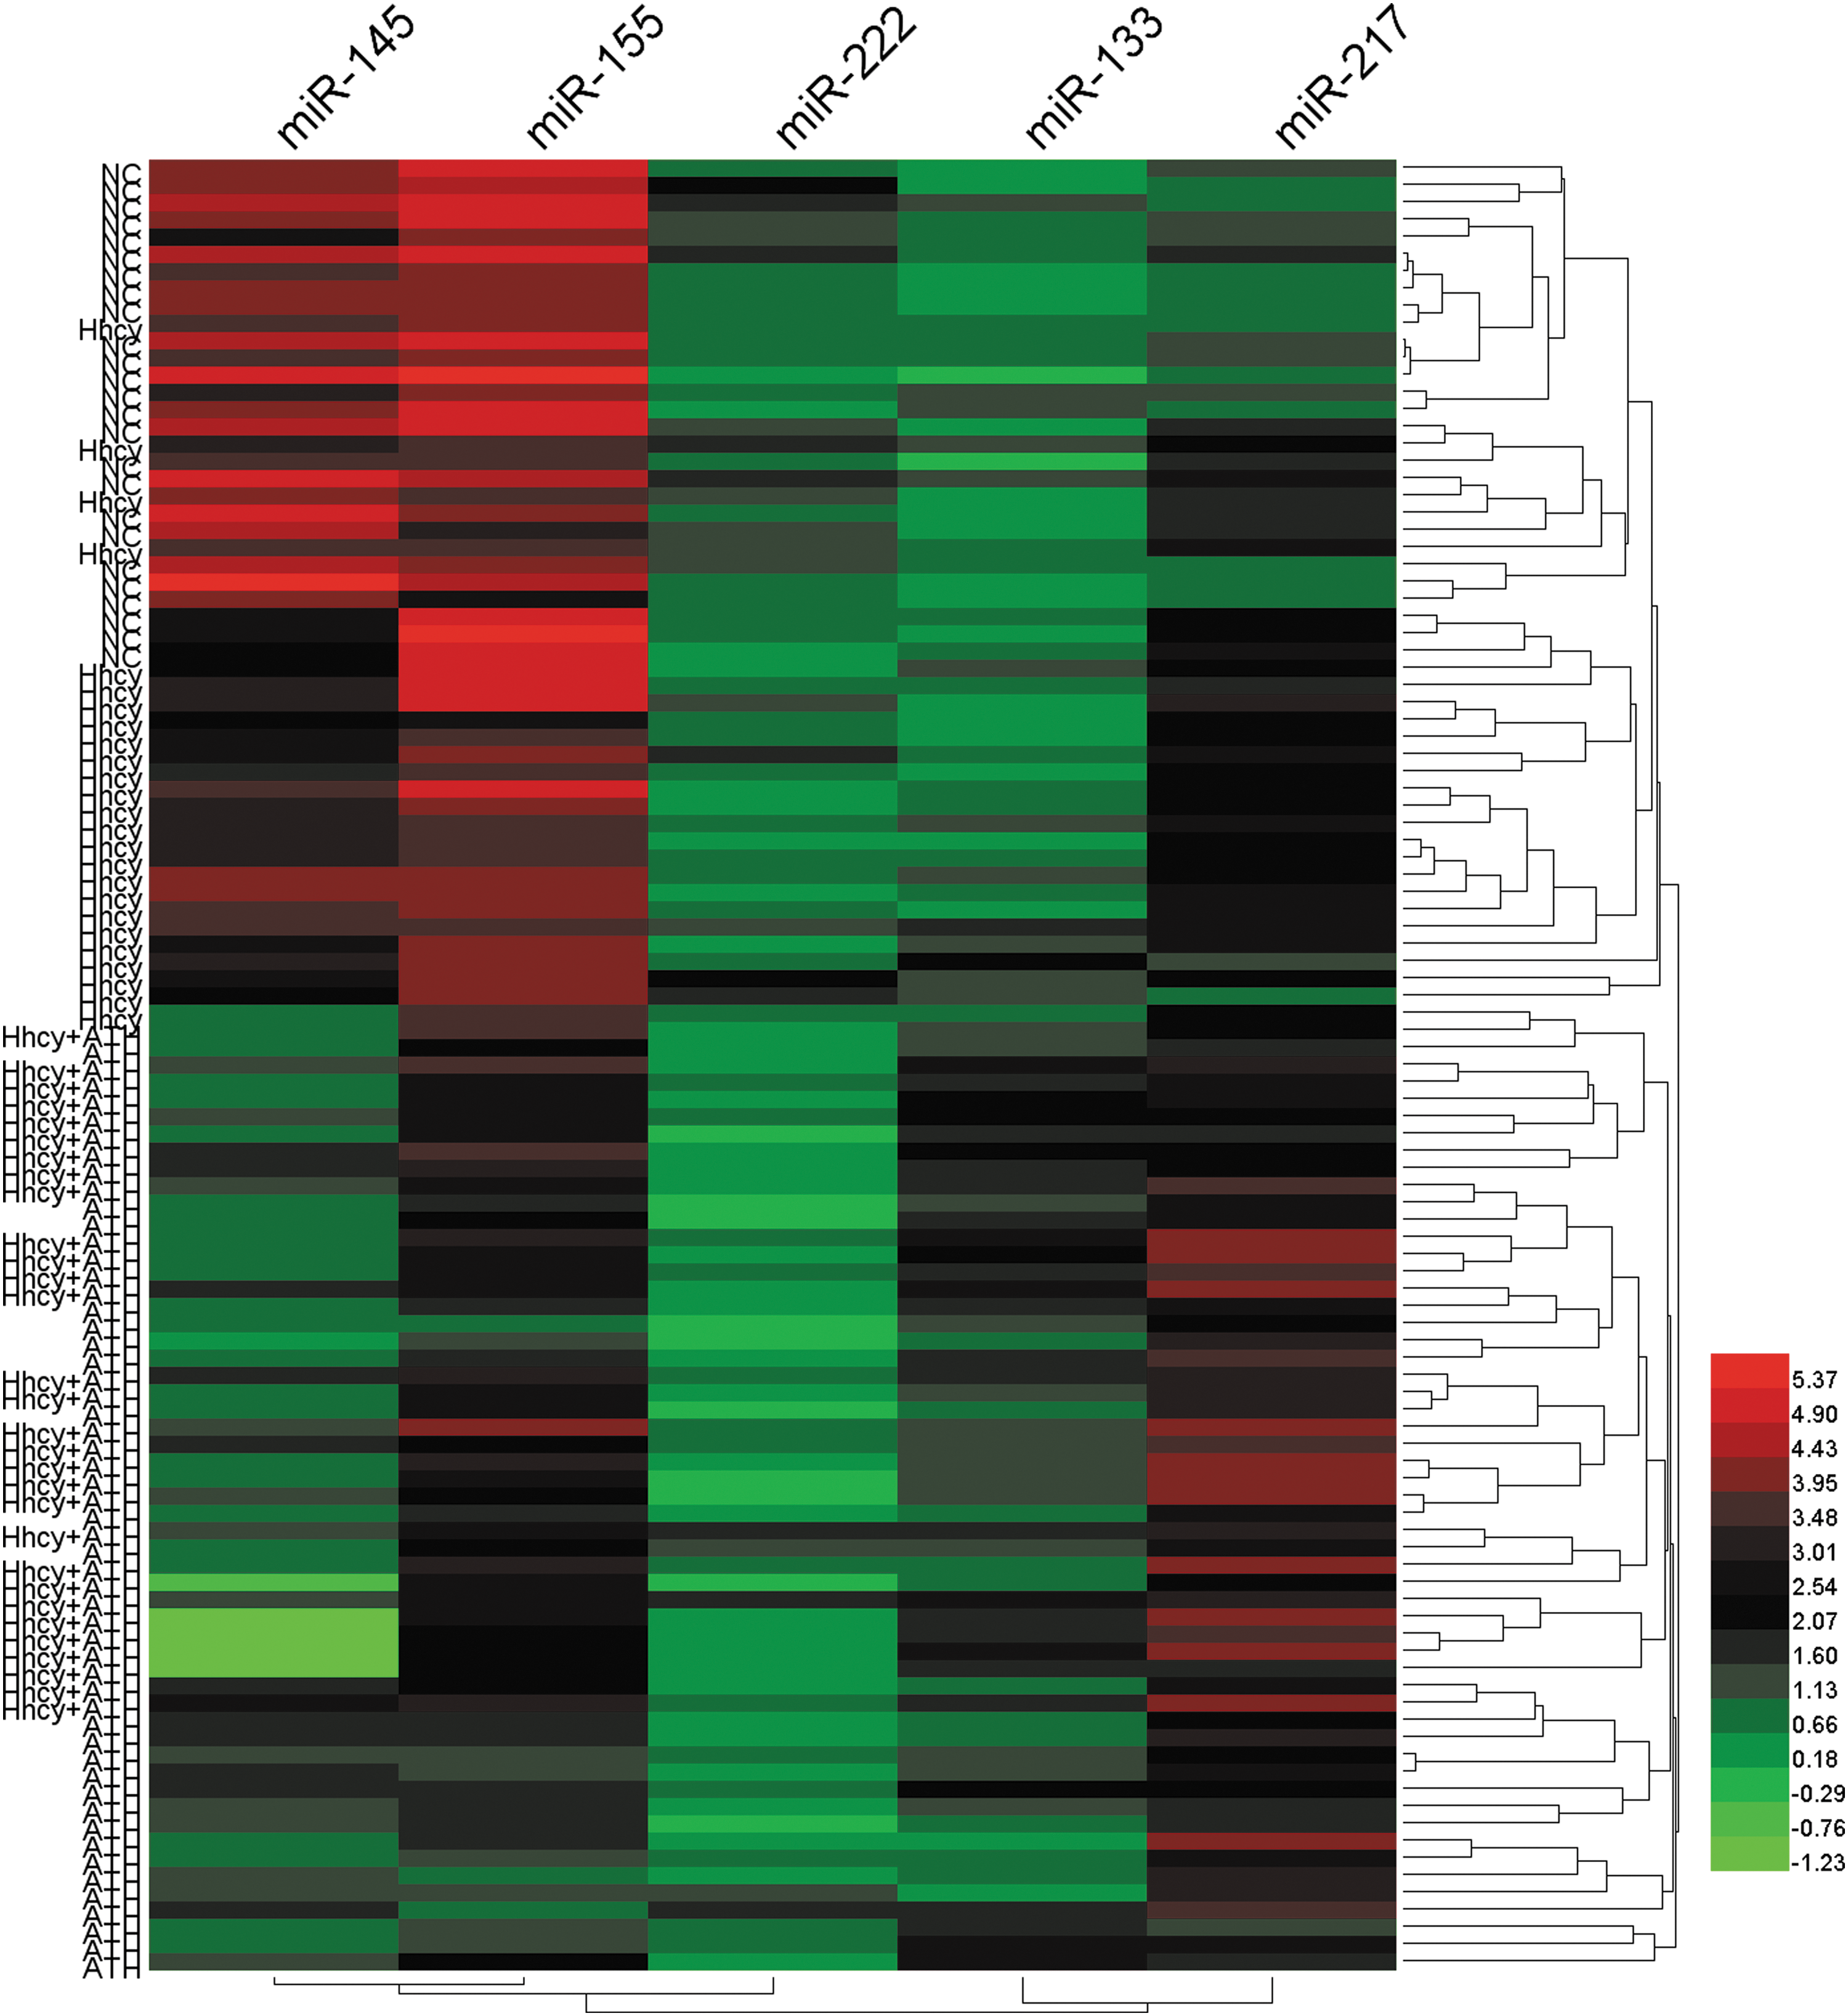
A majority of subjects of each group clustered together in the hierarchical clustering analysis based on five differentially expressed plasma miRNAs. Each column represents an individual plasma miRNA, and each row represents an individual subject. Red, black, and green colors indicate upregulation, unchanged expression, and downregulation compared to spike-in control, respectively. The color bar displays different colors that correspond to the relative expression levels of miRNAs. Color images available online at
ROC curves of six candidate plasma miRNAs for detection of all Hhcy patients or all ATH patients
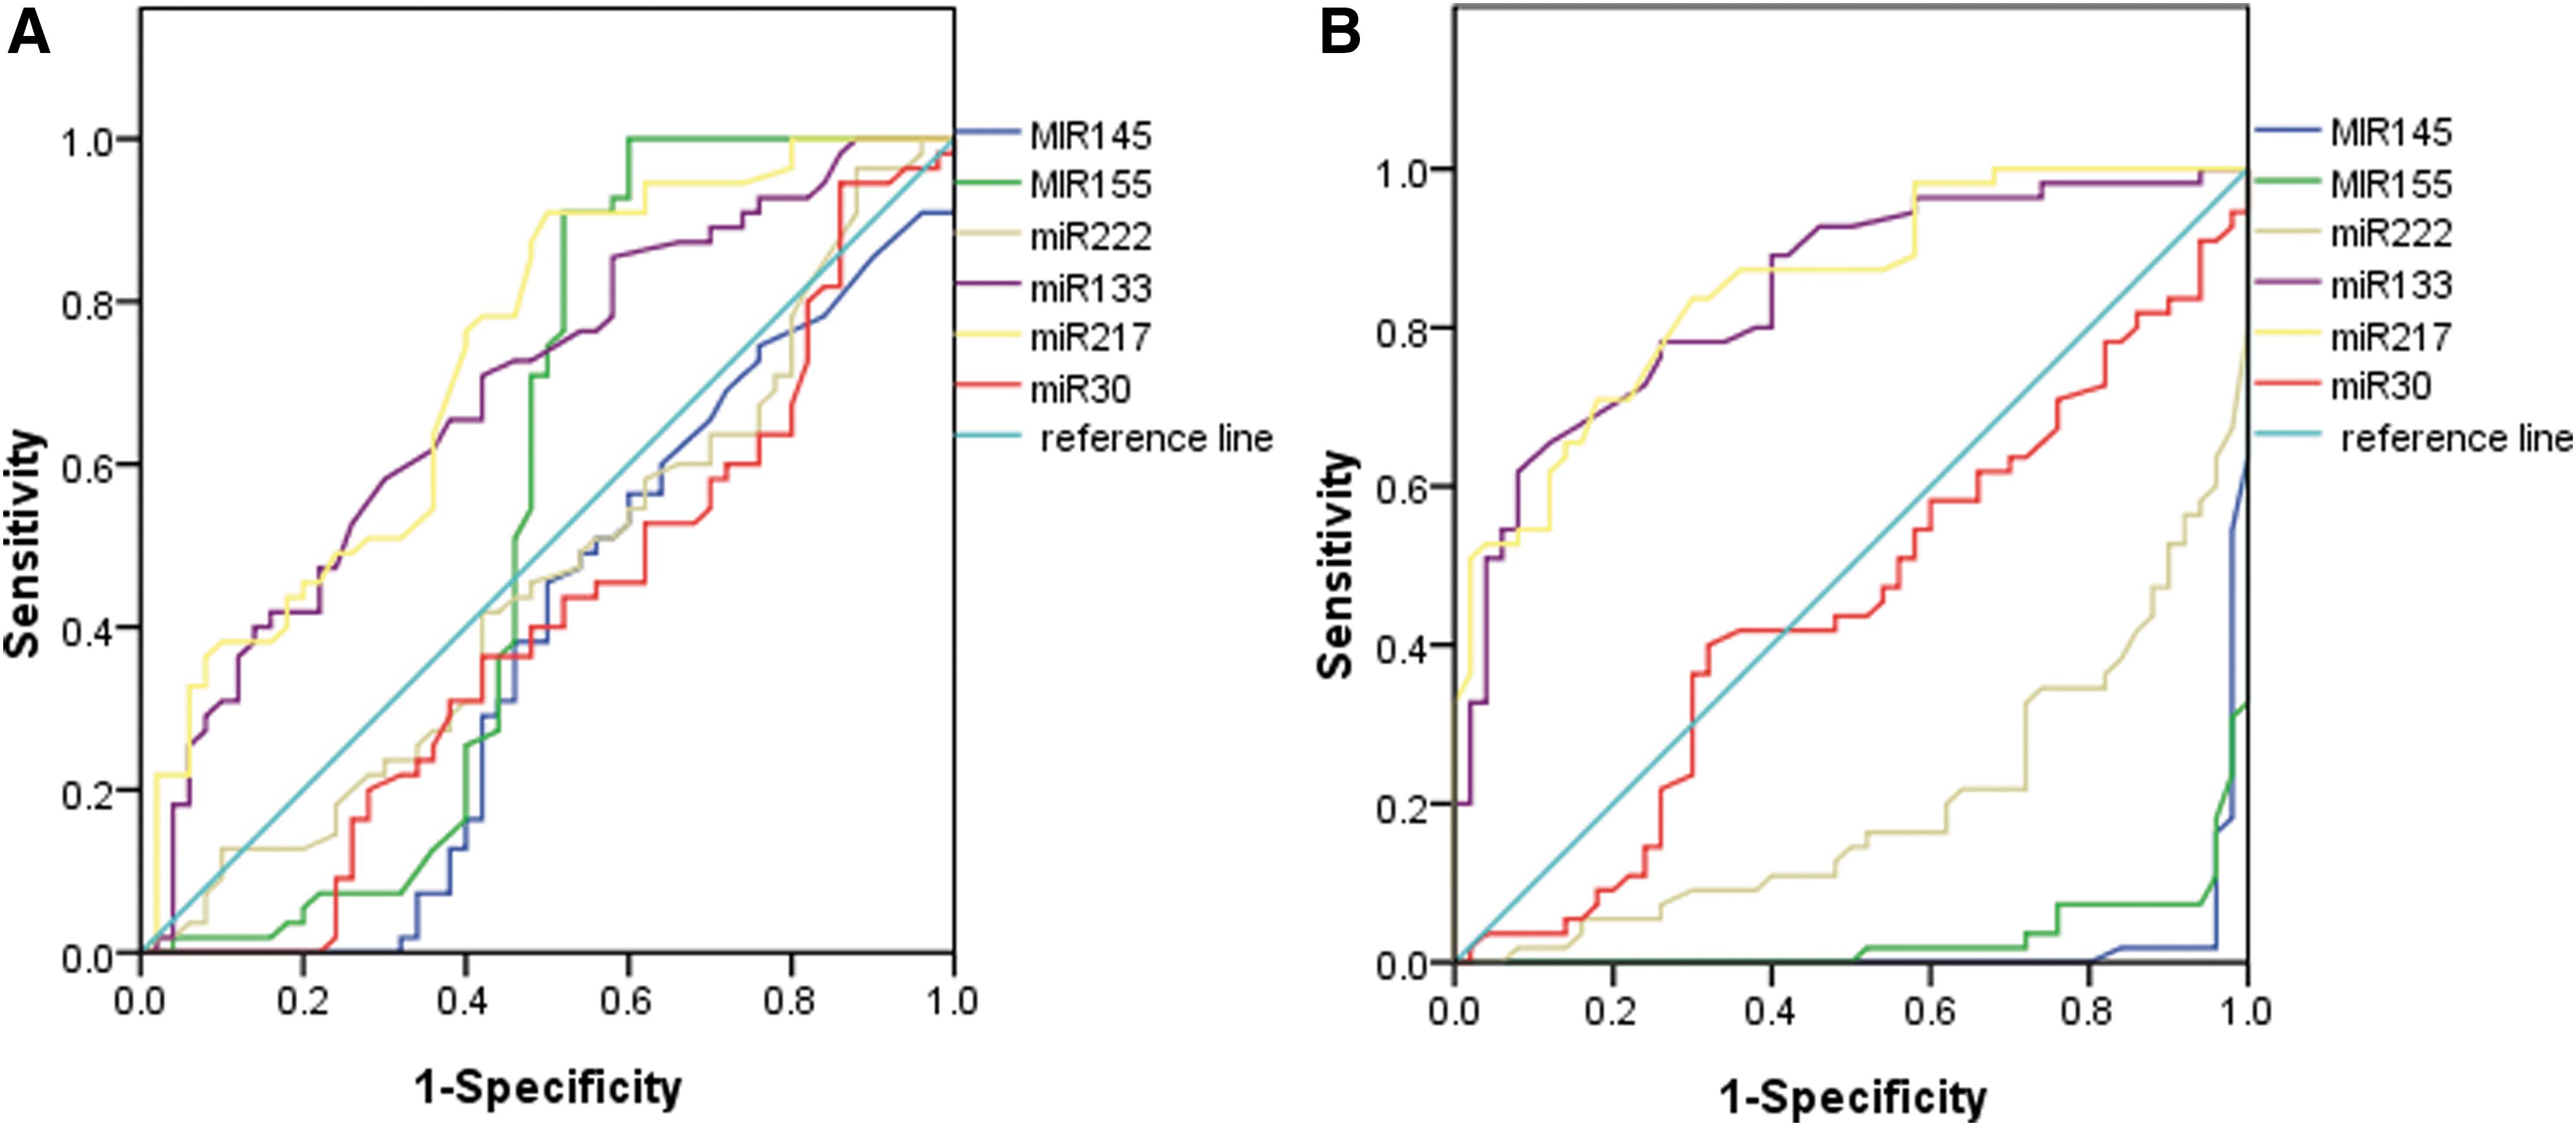
For all of those subjects who were divided into Hhcy patients (Hhcy + ATH and Hhcy) and ATH patients (Hhcy + ATH and ATH), ROC curves were constructed to estimate the sensitivity and specificity of six candidate plasma miRNAs for the detection of all Hhcy and ATH patients. The areas under the curve (AUC) of the six miRNAs are displayed in Figure 11. miR-217 has the largest AUC among the six candidate miRNAs for the detection of entire Hhcy patients (AUC = 0.731, 95% confidence interval [CI], 0.634–0.827, p < 0.001) (Fig. 4A). While miR-217 has the largest AUC in all ATH patients (AUC = 0.851, 95% CI, 0.781–0.922, p < 0.001) (Fig. 4B) from all of the subjects.
Discussion
In this study, we investigated the association of six candidate plasma circulating miRNAs with Hhcy and atherosclerosis patients. We characterize the circulating miRNA profile in patients having Hhcy complicated with ATH and identify circulating miRNAs that can best reflect the level of blood lipids in Hhcy patients at the risk of atherosclerosis and further tested whether those miRNAs assist in detecting the presence of atherosclerosis in Hhcy patients. Expression of six specific plasma circulating miRNAs revealed significant upregulation of two miRNAs (miR-217 and miR-133) and downregulation of three miRNAs (miR-145, miR-155, and miR-222). All of the studied plasma circulating miRNAs can be stably detected in plasma samples from subjects under study using qRT-PCR. Importantly, we were especially interested in whether the patterns of all examined miRNAs treated together as a panel could provide more information than individual miRNAs. Hierarchical clustering analysis based on five differentially expressed miRNAs could separate a majority of subjects of each group indicating a better recognition of subjects through miRNAs treated as a panel. The results pointed out that the five candidate plasma circulating miRNAs treated as a panel featured specific expression pattern and could correctly assign the subjects of each group.
This study can be considered as the only one that is able to show the link between atherosclerosis-associated miRNAs and Hhcy in humans. In this study, all the subjects were newly diagnosed as hyperhomocysteinemia patients and had never undergone any therapeutic interventions. Our data showed that patients in Hhcy, Hhcy + ATH, and ATH groups differed from NC individuals in the mean values of TG, TC, and LDL-c. Moreover, TC and LDL-c were positively correlated with Hhcy, indicating that Hcy may contribute to an increase in the circulating lipid levels. This result is consistent with the results of other studies that have assessed these associations (Liao, 2006; Chernyavskiy et al., 2016). Circulating LDL-c levels are a major risk factor for atherosclerosis, and cholesterol metabolism is currently an important pharmacologic target to promote prevention of atherosclerotic cardiovascular disease (Giral et al., 2016).
Our qPCR analysis identified that five of the six atherosclerosis-specific miRNAs had significantly different expressions among the four groups, and their levels were correlated with Hcy or blood lipids. The results suggest that candidate plasma miRNAs may be involved in the process of atherosclerosis.
Initially, miR-145 was significantly downregulated in the Hhcy + ATH group than in NC, Hhcy, and ATH groups. The level of miR-145 expression showed a significantly negative correlation with Hcy, TC, and LDL-c. miR-145 was downregulated in injured or atherosclerotic vessels containing proliferating and less differentiated smooth muscle cells (Navickas et al., 2016). Climent et al. (2015) found that miR-145 acts as communication molecules between endothelial cells and smooth muscle to enhance the angiogenic and vessel stabilization properties of endothelial cells. Furthermore, miR-145 represses Kruppel-like factor-4 (Klf4), which proved to be involved in multiple events, including neointimal proliferation. Klf4 plays a key role in regulating the VSMC phenotype because it facilitates VSMC migration and downregulates VSMC differentiation marker genes (Garvey et al., 2010). These findings imply that miR-145 can stabilize plaques through a communication between vascular smooth muscle and endothelial cells, regarded as crucial processes in the pathogenesis of cardiovascular disease. Another study indicated that miR-145 is regarded as a potential biomarker of acute coronary syndrome with higher sensitivity for ST-segment elevation myocardial infarction and worse outcome for acute myocardial infarction (Dong et al., 2015).
Furthermore, miR-155 was significantly downregulated in the ATH group than in NC, Hhcy, and Hhcy + ATH groups. The level of miR-155 expression showed a significantly negative correlation with Hcy. A single study reported that miR-155 was inversely associated with complicated proatherogenic metabolic risk factors (Zhu et al., 2014). Several researchers have revealed that miR-155 is positively related to proinflammatory cytokine expression in macrophages during atherosclerosis development. In addition, Nazari-Jahantigh et al. (2012) showed that miR-155 promoted atherosclerosis in a partial carotid ligation ApoE−/− mice by repressing B cell lymphoma 6 protein in macrophages, thus enhancing vascular inflammation. However, further studies used … mice on a high-fat Western diet to suggest dual behavior of miR-155. The above study showed an atheroprotective effect in earlier stages, which is attributed to inhibition of macrophage proliferation. Also, the study plays an opposite atherogenic role in later stages, which is described in previous studies (Wei et al., 2015). Our study has underlined an anti-inflammatory role of miR-155 in accordance with the above studies. Previous study has suggested that increased miR-155 expression is mediated by an anti-inflammatory effect presumably through targeting the calcium-regulated heat stable protein (CARHSP1), which regulates the stability of TNF-amRNA (Li et al., 2016). It suggested that miR-155 acted in an antiatherogenic role, which is much similar to the fact that was shown in our data.
Moreover, miR-222 was significantly downregulated in atherosclerosis groups (AHT + Hhcy and ATH) than in nonatherosclerosis groups (NC and Hhcy). Also, the level of miR-222 expression showed a significantly negative correlation with TG. Zhu et al. (2011) revealed that miR-222 was highly expressed in human umbilical vein endothelial cells. miR-222 regulated Ang II-induced endothelial inflammation and migration and exerted antiangiogenic effects. It has been reported that miR-222 inhibits angiogenesis via targeting c-Kit, signal transducer, activator of transcription (STAT) 5A, and zinc finger E-box-binding homeobox (ZEB) 2 (Poliseno et al., 2006; Dentelli et al., 2010). It promoted VSMC proliferation and neointimal hyperplasia by targeting p57(Kip2) (Liu et al., 2009), and indirectly reduced endothelial nitric oxide synthase expression. Thus, miR-222 may regulate inflammation, neointimal formation, and neovascularization of the plaque, leading to coronary artery disease right from the initiation of atherosclerosis to acute coronary syndrome.
Next, miR-133 was significantly upregulated in Hhcy + ATH groups than in NC, Hhcy, and ATH groups. The level of miR-133 expression showed a significantly negative correlation with Hcy, TG, and LDL-c. miR-133 suppressed angiogenesis properties of endothelial cells such as proliferation rate, cell viability, and migration activity by targeting vascular endothelial growth factor receptor 2 and fibroblast growth factor receptor 1 (Soufi-Zomorrod et al., 2016). Similar to our results, miR-133 is considered as protective and antifibrotic in smooth muscle and is elevated in patients with coronary atherosclerosis (Torella et al., 2011; Hulsmans and Holvoet, 2013).
Finally, miR-217 was significantly upregulated in Hhcy + ATH groups than in NC, Hhcy, and ATH groups. The level of miR-217 expression showed a significantly negative correlation with Hcy and TG. It is more important that miR-217 showed the most specific expression patterns in all patients with atherosclerosis (ATH and Hhcy + ATH groups). Recently, miR-217 was pinpointed to expression in human carotid plaques, which promotes endothelial senescence via the regulation of silent information regulator (SIRT) 1 expression (Menghini et al., 2009; Duan et al., 2016). SIRT1 has been reported to serve as a key regulator of vascular endothelial homeostasis controlling angiogenesis and endothelial dysfunction (Menghini et al., 2009). Therefore, miR-217 participates as an early step in the pathogenesis of atherosclerosis. According to our study, miR-217 has a diagnostic value in Hhcy patients and ATH patients, which may be useful in predicting the progress of atherosclerosis in Hhcy patients.
By all means, some limitations of our study should be necessarily acknowledged. First, miR-30 showed no significant difference for all subjects because of smaller sample size. This study was a single-center study and consequently multicenter studies with larger sample sizes are needed. Second, carotid intima-media thickness cannot apply as an evaluation index for atherosclerosis due to the lack of equipment in the hospital. Finally, the ultrasonic resolution is based on the operator's experience and level of technical skills and so may bring great influence on diagnosis and lead to a greater error.
In summary, this study provided a substantial clinical significance. To our knowledge, this study can be regarded as the first to evaluate atherosclerosis-specific circulating miRNA expression profiles in patients with Hhcy. We have shown that five of the six atherosclerosis-related circulating miRNAs had significantly different expressions among NC, Hhcy, Hhcy + ATH, and ATH subjects. Our study identified that miR-217 may be helpful in predicting the progress of atherosclerosis in Hhcy patients. We are providing a novel way of identifying the severity of atherosclerosis, which can also work as potential biomarkers for Hhcy. Moreover, the results of the current studies highlight a further insight into the function of circulating miRNAs in the process and progression of atherosclerosis. However, prospective large-scale studies are required to determine the potential value of circulating miRNAs for atherosclerosis in patients with Hhcy.
Footnotes
Acknowledgments
This work was supported by the National Natural Science Foundation of China (grant no. 81160001). We thank Dr. Azeem from Pakistan for assistance in reviewing the language.
Disclosure Statement
No competing financial interests exist.
References
Supplementary Material
Please find the following supplemental material available below.
For Open Access articles published under a Creative Commons License, all supplemental material carries the same license as the article it is associated with.
For non-Open Access articles published, all supplemental material carries a non-exclusive license, and permission requests for re-use of supplemental material or any part of supplemental material shall be sent directly to the copyright owner as specified in the copyright notice associated with the article.