
Abstract
This study was aimed to figure out the association of single-nucleotide polymorphisms (SNPs) within miR-30a and its downstream molecules (i.e., Notch1, Snail1, p53, CD73, and TET1) with susceptibility to and prognosis of nephrotic syndrome (NS). In the aggregate, 265 patients and 281 healthy controls were gathered, and related laboratory indicators were examined. The miR-30a, Notch1, Snail1, TET1, p53, and CD73 expressions were also evaluated by quantitative real-time polymerase chain reaction (qRT-PCR), immunohistochemistry, or enzyme-linked immunosorbent assay. Besides, the SNPs were genotyped by RT-PCR with aid of ABI-PRISM™ 377 DNA sequencing instrument. As a result, the NS patients were correlated with remarkably higher 24-h protein excretion, random urine protein/creatinine (UPCR), and serum creatinine, along with lower estimated glomerular filtration rate and serum albumin, when compared with normal subjects (p < 0.05). Furthermore, significant correlations were present between miR-30a expression and the expressions of Notch1 (r s = −0.350), p53 (r s = −0.339), CD73 (r s = −0.300), TET1 (r s = −0.249), and Snail1 (r s = −0.829) (all p < 0.05). The SNPs of miR-30a [i.e., rs2222722 (C>T)], Notch1 [i.e., rs3124599 (G>A), rs3124591 (C>T), and rs139994842 (G>A)], Snail1 [i.e., rs6020178 (T>C)], p53 [i.e., rs1042522 (C>G)], and CD73 [i.e., rs9444348 (G>A) and rs4431401 (T>C)] were significantly correlated with both differed NS risk and altered hormone sensitivity to NS (all p < 0.05). Moreover, haplotype AC of CD73 and haplotype ATG of Notch1 were the helpful factors against NS (p < 0.05), yet haplotype GT of CD73 functioned oppositely (p < 0.05). The haplotype AT of CD73 was beneficial to the NS patients for that the carriers could be treated with hormones without severe complications (p < 0.05). Conclusively, the SNPs situated within miR-30a and its downstream molecules (i.e., Notch1, Snail1, p53, CD73, and TET1) could become the promising biomarkers for both NS diagnosis and prediction of NS prognosis.
Introduction
N
Over 1000 types of miRNAs discovered within the human genome were estimated to regulate 74–92% of protein-coding genes, and they broadly participated in diverse physiological processes, including cell proliferation, cell apoptosis, cell differentiation, immunity, and metabolism (Ferland-McCollough et al., 2010). The role of miRNAs in regulating the kidney function has also been gradually deepened (Bhatt et al., 2011). For instance, miR-30a expression level was significantly boosted within children who were at the initial stage of PNS, yet it dropped after conduction of inductive therapy that contained adequate hormones. Thus it was suggested that miR-30a expression could be correlated with hormone responsiveness and prognosis of PNS (Luo et al., 2013).
Of note, it has been documented that Notch1, Snail1, p53, CD73, and TET1 were the targeted molecules of miR-30a, although so far the investigated diseases were confined to colorectal cancer, myocardial fibrosis, or idiopathic pulmonary fibrosis (Li et al., 2010; Wang et al., 2015; Yuan et al., 2015; Xie et al., 2017; Zhang et al., 2017). Nonetheless, within the renal tissues of diabetic rats, a remarkable correlation could be discovered between the Snail1 protein level and the urine protein level, which was a major etiology of NS (Fang et al., 2008). Moreover, NS was also a disorder bred by renal cancer (Kuroda et al., 2004), and Notch1, Snail1, p53, CD73, and TET1 were all indicated to participate in the progression of renal cell carcinoma (Erdem et al., 2013; Westerhoff et al., 2014; Fan et al., 2015; Song et al., 2017; Wang et al., 2017). Therefore, it was hypothesized that miR-30a could function to modify the five molecules and regulate the prevalence of NS, and it could be further suspected that the crucial single-nucleotide polymorphisms (SNPs) located within miR-30a, Notch1, Snail1, p53, CD73, and TET1 were probable to elevate the NS incidence by altering the expressional levels of miR-30a, Notch1, Snail1, p53, CD73, and TET1.
On the whole, this investigation was aimed to explore several SNPs of miR-30a, Notch1, Snail1, p53, CD73, and TET1 that were gathered from the previously published reports, and to figure out if their aberrations were associated with dysfunctional kidney and NS development. Through this way, a highly accurate technique could be designed to assist in diagnosing NS and in predicting the NS prognosis.
Materials and Methods
Basic clinical characteristics
This study retrospectively collected 265 PNS patients confirmed with renal biopsy and 281 healthy controls from Liaocheng People's Hospital within the period from February 2016 to November 2016. In line with the laboratory examination, the incorporated subjects should (1) possess ≥3.5 g 24-h urine protein; (2) obtain ≤30 g/L plasma albumin; (3) be accompanied with edema or hyperlipidemia; (4) be at the age of 18–65 years; and (4) have <176.8 μmol/L serum creatinine (SCr). Moreover, the participants would be excluded if (1) they were attacked with secondary and hereditary nephropathy, including diabetic nephropathy, lupus nephritis, hepatitis B-related renal disease, and anaphylactic purpura nephritis; (2) they were conflated with severe primary diseases in heart, brain, liver, and hematopoietic system; (3) they were women at the stage of gestation or sucking; and (4) they had mental abnormalities and did not cooperate with the treatment. The implementation of this study has obtained the approval of Liaocheng People's Hospital and the ethics committee of Liaocheng People's Hospital.
Laboratory measurements
About 3 mL elbow vein blood were gathered from the subjects at early morning when the subjects' stomachs were empty. A fully automatic biochemical analyzer (model number: 7600; Hitachi Corp.) was employed to detect urine protein and 24-h protein excretion levels. Gas chromatography-propyl ethylene diamine thin-layer chromatography was arranged to quantify SCr, and serum albumin was determined applying bromocresol green method. Moreover, the estimated glomerular filtration rate (eGFR) was calculated following the equation, eGFR = 175 × (SCr/88.4)−1.154 × age−0.203 × 0.742.
Assessment of miR-30a, Notch1, and Snail1 expressions with quantitative real-time polymerase chain reaction
The miR-30a, Notch1, and Snail1 levels were determined by quantitative real-time polymerase chain reaction (qRT-PCR) with the primers displayed in Supplementary Table S1 (Supplementary Data are available online at
Evaluation of the p53 and CD73 levels with enzyme-linked immunosorbent assay
Human p53 and CD73 expressions were measured with the ELISA kit manufactured by R&D Biotech Systems, Inc. (Minneapolis).
Determination of the TET1 levels with immunohistochemistry
The immunohistochemistry results relevant to TET1 level were quantified according to the immunoreactive score (IRS) scoring method recommended by Remmele and Stegner (1987). In particular, staining intensity (SI) and percentage of positive cells (PP) were comprehensively taken into account. SI was graded into four grades of 0 (staining: colorless), 1 (staining: faint yellow), 2 (staining: claybank), and 3 (staining: sepia), and PP was classified into four grades of 1 (PP: 1–24%), 2 (PP: 25–49%), 3 (PP: 50–74%), and 4 (PP: 75–100%). IRS, the product of SI and PP, was finally categorized into four grades of − (0–3 score), + (4 score), ++ (6 score), and +++ (≥8 score).
Genotyping
About 5–10 mL peripheral blood of each subject were fetched, and 1% potassium oxalate was prepared for anticoagulation. The standard salting-out method was performed to extract the genome DNAs. The primers (Supplementary Table S1) were designed with the Primer Premier 6 software and were synthesized with assistance of Sangon Biotech (China). The PCR reaction system (25 μL) consisted of 50 ng genomic DNA, 0.2 μmol/L forward primer, 0.2 μmol/L reverse primer, 100 μmol/L dNTPs, 1.5 mmol/L, and 1.25 U Taq polymerase (Perkin Elmer Corp.). Based on the GeneAmp2400 PCR system (Perkin Elmer Corp.), the PCR reaction went along the following procedures: (1) predegeneration at 95°C for 5 min; (2) 35 cycles of degeneration at 94°C for 1 min, annealing at 53°C for 1.5 min, and extension at 72°C for 1.5 min; and (3) extension at 72°C for 5 min. Exactly 1 μL PCR product for each sample was prepared for electrophoresis within the 1.0 g/L agarose gel and ethidium bromide was then applied for staining. To construct heteroduplex DNAs, per-tube PCR product was first degenerated at 95°C for 3 min and was then renaturated at the speed of −0.5°C/min. Subsequently, all the PCR products were directly sequenced on the ABI-PRISM™ 377 DNA sequencing instrument.
Treatment
All the patients were guaranteed with adequate rest, light diet, and intake of low-salt and low-fat food. The hormone treatment was managed as 1.0 mg/(kg · day) prednisone at the initial stage (the maximum) or 0.8 mg/(kg · day) methylprednisolone for an 8-week treatment course. If the subjects' urine protein level recovered, the NS patients would be classified into the hormone-sensitive group; otherwise, they would be categorized into the hormone-resistant group.
Statistical analysis
The whole statistical analyses were managed with SPSS11.5 software package. The measurement data were expressed as mean ± standard deviation, and inter-group comparisons were conducted with application of t test. The enumeration data were described with case number or percentage, and they were compared with chi-square test among groups. The haplotypes of related genes would be analyzed if their frequencies within cases and controls were both larger than 0.03. The haplotype analyses were all performed based on Shesis software (
Results
Clinical features of the subjects
The NS patients and normal controls were well matched concerning their ages and sex ratio (p > 0.05) (Table 1). However, the patients' 24-h protein excretion, random urine protein/creatinine (UPCR), and SCr were generally higher than the control group (p < 0.05), and the eGFR and serum albumin levels of normal subjects significantly outnumbered those of NS patients (p < 0.05). Moreover, the NS participants could be pathologically classified into 94 with mesangial proliferative glomerulonephritis (MPGN), 67 with podocyte lesion (PCL), 58 with glomerular interstitial nephritis (IGN), and 46 with glomerular lesions (GMC). Among the 265 NS patients, ∼57.35% of the investigated ones showed symptoms of hormone sensitivity, while the rest were resistant to hormone.
The bold font indicates a result with statistical meaning.
SCr, serum creatinine; eGFR, estimated glomerular filtration rate; MPGN, mesangial proliferative glomerulonephritis; PCL, podocyte lesion; IGN, glomerular interstitial nephritis; GMC, glomerular lesions; UPCR, urine protein/creatinine.
Comparison of the expressional levels relevant to miR-30a, Notch1, Snail1, p53, CD73, and TET1 between NS patients and healthy controls
As Table 2 was illustrated, the expression levels of miR-30a, Notch1, Snail1, p53, and CD73 were greatly upregulated within the NS group, when compared with the healthy controls (all p < 0.05). In contrast, the TET1 level followed the trend that the expressional levels of the above-mentioned molecules in the control group were largely beyond those of the case group (p < 0.05). Besides, miR-30a expression was remarkably correlated with the expressions of Notch1 (r s = −0.350), p53 (r s = −0.339), CD73 (r s = −0.300), TET1 (r s = −0.249), and Snail1 (r s = −0.829) (all p < 0.05) (Fig. 1).
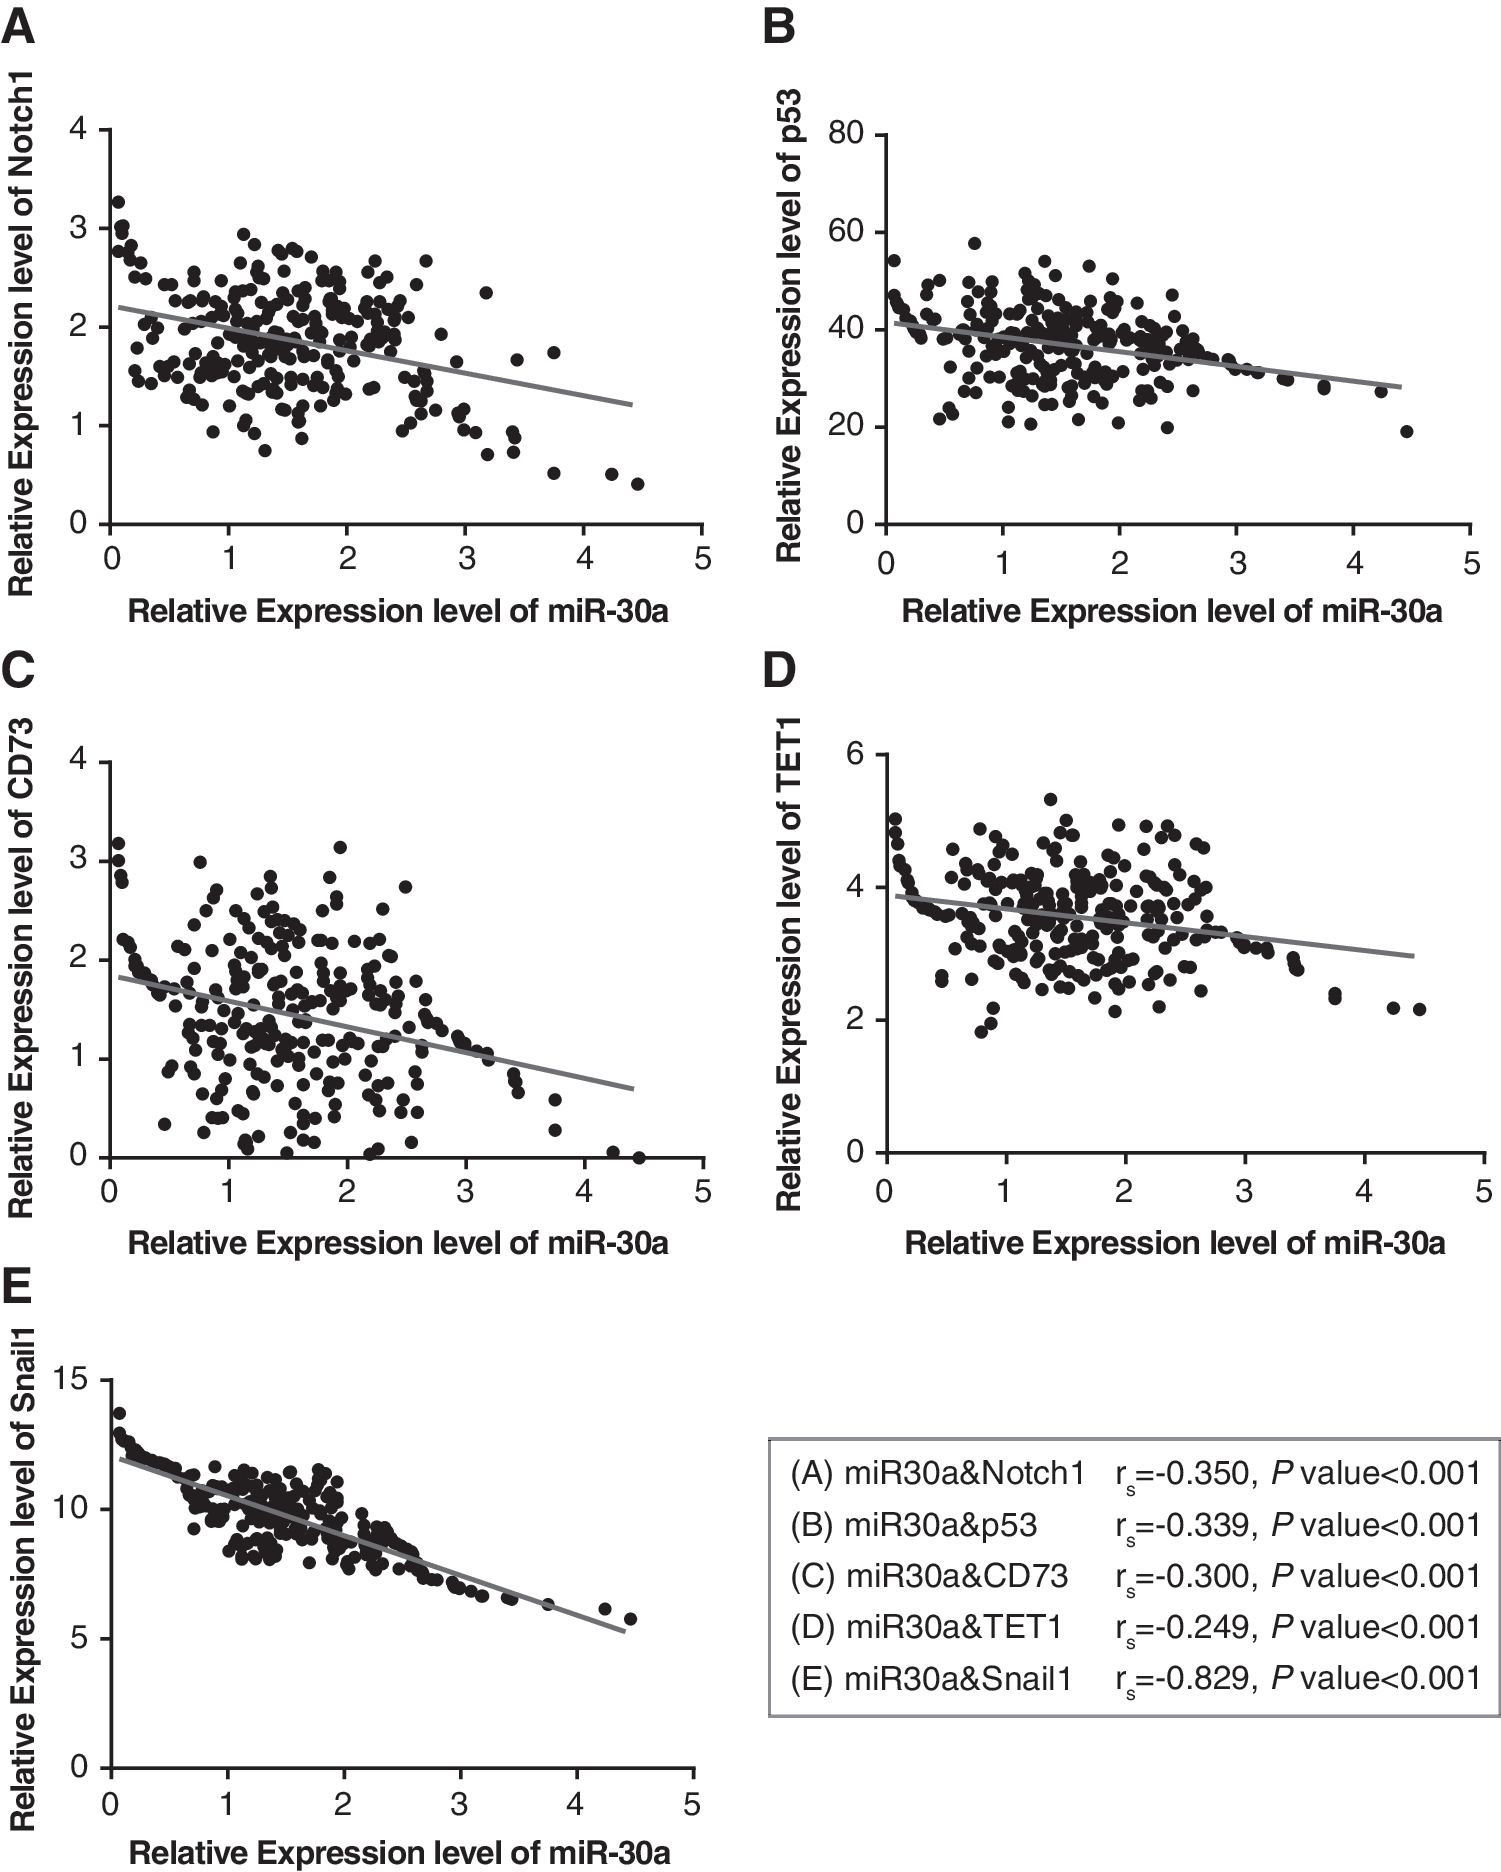
miR-30a expression was negatively correlated with the expressions of Notch1
The bold font indicates a result with statistical meaning.
The OR results reflect the regression analysis between expression level of the factors and the risk of nephrotic syndrome.
OR, odds ratio; CI, confidence interval.
Association of SNPs and haplotypes within miR-30a, Notch1, Snail1, p53, CD73, and TET1 with the onset of NS
Regarding the rs2222722 (C>T) of miR-30a, its T allele was associated with reduced NS prevalence in comparison to the C allele (odds ratio [OR] = 0.55, 95% confidence interval [CI]: 0.42–0.72, p < 0.001) (Table 3). Considering Notch1, the mutant alleles of rs3124591 (C>T) and rs139994842 (G>A) tended to significantly increase NS risk when compared with their wild alleles (OR = 1.42, 95% CI: 1.07–1.90, p = 0.016; OR = 1.33, 95% CI: 1.03–1.72, p = 0.031), while the mutant allele of rs3124599 functioned oppositely (OR = 0.47, 95% CI: 0.37–0.61, p < 0.001). In addition, both Snail1 rs6020178 (T>C) and p53 rs1042522 (C>G) were tightly linked with incremental susceptibility to NS under the allelic model (OR = 1.36, 95% CI: 1.06–1.73, p = 0.014; OR = 1.41, 95% CI: 1.10–1.80, p = 0.007). As far as CD73 was concerned, the mutant alleles of either rs9444348 (G>A) or rs4431401 (T>C) were regarded as the protective elements for NS (OR = 0.69, 95% CI: 0.52–0.91, p = 0.008; OR = 0.63, 95% CI: 0.49–0.81, p < 0.001), whereas TET1 rs5030882 (C>T) probably acted as the hazardous factor for NS (OR = 1.64, 95% CI: 1.19–2.26, p = 0.003). Furthermore, haplotype AC of CD73 and haplotype ATG of Notch1 were both indicated as the advantageous factor in fighting against NS, yet haplotype GT of CD73 might enable the subjects to more easily suffer from NS (Table 4).
The bold font indicates a result with statistical meaning.
LL, lower limit; UL, upper limit.
The bold font indicates a result with statistical meaning.
The distribution of genotypes located within miR-30a, Notch1, Snail1, p53, CD73, and TET1 among the pathological types of NS
The heterozygote CT of miR-30a rs2222722 was scattered quite dissimilarly from homozygote CC among NS patients with MPGN, PCL, IGN, and GMC (p = 0.002) (Table 5). With respect to p53 rs1042522, the percentages of genotypes CG and GG were, respectively, considerably distinct among the four pathological types when compared with genotype CC (p < 0.05). Besides, the heterozygotes of CD73 rs9444346 (i.e., GA) and rs4431401 (i.e., TC) appeared to be distinctly distributed among the pathological types, with wide genotypes as the reference (both p = 0.001). Finally, it was observed that the mutant homozygote TT of TET1 rs5030882 could possibly endow the NS subjects with significantly different pathological types (p < 0.05).
The bold font indicates a result with statistical meaning.
1 means wild allele; 2 means mutant allele.
Association of SNPs and haplotypes within miR-30a, Notch1, Snail1, p53, CD73, and TET1 with the hormone sensitivity to NS
In accordance with Table 6, heterozygote TC of miR-30a rs2222722 was accompanied with enhancive hormone sensitiveness when compared with the homozygote CC (OR = 1.82, 95% CI: 1.07–3.10, p = 0.027). Similarly, genotype GA of CD73 rs9444348 was more likely to encourage the occurrence of hormone sensitiveness than genotype GG (OR = 2.58; 95% CI: 1.42–4.69; p = 0.002). The homozygotes AA of Notch1 rs139994842 and CC of Snail1 rs6020178 could render the NS subjects more susceptible to hormone treatments (AA vs. CC, OR = 2.89, 95% CI: 1.29–6.44, p = 0.008; CC vs. TT, OR = 2.30, 95% CI: 1.04–5.09, p = 0.037). Also, the haplotype AT of CD73 made up of rs9444348 and rs4431401 served as the positive aspect for NS patients who were treated with hormones (OR = 2.19, 95% CI: 1.04–4.59, p = 0.036), since the hormone therapy could work quite well owing to their sensitivity to hormones (Table 7).
The bold font indicates a result with statistical meaning.
1 means wild allele; 2 means mutant allele.
The bold font indicates a result with statistical meaning.
Discussion
Podocytes, the terminally differentiated epithelial cells, reside in the visceral layer of the Bowman's capsule (Waters et al., 2008). Various molecules (e.g., α1β3 integrin, integrin ligase, and dystroglycan) located within the basement membrane of podocytic process are crucial to maintain the accurate localization of podocytes, and they appear to be pivotal for the presence of proteinuria (Kojima et al., 2004; Yang et al., 2005; Kanasaki et al., 2008). For instance, the abnormally expressed α1β3 integrin could lead to irregular assembling of podocytes, fragmentation of GBM, and finally proteinuria (Chen et al., 2006). Apart from functioning as the static molecular sieve to prevent proteinuria, podocytes could also restrain the passing of negatively charged proteins (e.g., podocalyxin and podoplanin) in a charge-barrier manner (Song et al., 2010). In addition, the skeletal proteins of podocytes are also linked with alleviated or aggravated development of proteinuria, including actin, α-actinin-4, and synaptopodin (Letavernier et al., 2007; Arias et al., 2009; Ferrandi et al., 2010). All in all, since proteinuria served as a prominent characteristic of NS, the normal functioning of podocytes was suspected to contribute much to the reduced prevalence of NS by maintaining the absence of proteinuria.
miR-30a expressions were enriched in the kidney, lung, liver, and heart of mice, and they were also existent within the kidney of humans, rats, and zebra fish (Sun et al., 2004; Naraba and Iwai, 2005; Wienholds et al., 2005; Agrawal et al., 2009). It was authenticated that podocyte-specific mice whose Dicer was knocked out were observed with foot process fusion, vacuolization, and formation of crescents. Then, the mice presented symptoms of proteinuria and rapidly progressed into end-stage renal disorder. Correspondingly, miR-30a expressed within tubular epithelial cells and sertoli cells were nearly unobservable about 3 weeks after knockout, insinuating that miR-30a was crucial to maintain the normal functions of sertoli cells (Harvey et al., 2008). Moreover, miR-30 family could modify the growth and development of Xenopus laevis protonephridium, especially the differentiation and proliferation of renal tubules (Agrawal et al., 2009). Furthermore, miR-30a-5p was upregulated within the urine of focal segmental glomerular sclerosis patients, and the patients sensitive to hormone therapy were associated with the remarkably dropped miR-30a-5p expression about 8 weeks after the treatment. It was implied that miR-30 could be an injury-related biomarker, and it might predict the treatment efficacy of hormones (D'Agati, 2003; Zhang et al., 2014b).
Interestingly, miR-30 family could lessen the apoptosis of podocytes by directly suppressing the activity of Notch1 and p53 signaling pathways (Fig. 2) (Shi et al., 2013). The conformational variation of Notch receptors owing to combination with ligands would emit the intracellular domain of Notch and hinder the expressions of genes relevant to cell differentiation, cell proliferation, and cell apoptosis (Niranjan et al., 2008; Waters et al., 2012). Furthermore, Lin et al. (2010) discovered that under hyperglycemic conditions, the activated Notch signaling pathway within immortal podocytes would cut down the podocalyxin expressions and induce podocyte lesions. Besides, the highly activated Notch pathway induced by high glucose could be inhibited, after rendering Janus activator 2 and I-type depressor of transforming growth factor (TGF) 2 (Niranjan et al., 2008). Since Janus kinase/activating transcription factor pathway synthesized with Notch signaling to regulate the apoptosis of enterocytes, and TGFβ1 mediated the Notch signaling-modified retarded growth of epithelial cells, it was hypothesized that Notch signaling might coordinate with multiple pathways to cause podocyte lesions (Niimi et al., 2007; Jiang et al., 2009).

miR-30a interacted with CD73, TET1, Notch1, p53, and Snail1 to inhibit cell apoptosis. Black arrows represented the hindering action, and gray arrows were symbolic of the promoting action.
In addition, p53, a crucial nuclear transcription factor, not only impacted cell apoptosis in a Snail1-dependent manner (Kim et al., 2011) but also interacted with Notch1 and mastered its expression (Lefort et al., 2007). The zinc finger domain of Snail1 could combine with the CAGGTG sequence within E-cadherin promoter region, thereby downregulating the E-cadherin expression and initiating the epithelial mesenchymal transition (EMT) process (Barrallo-Gimeno and Nieto, 2005). Snail1 was also upregulated within the renal tubular cells of diverse nephropathy models, and it was involved with elevated prevalence of EMT within renal tubular epithelial cells and renal fibrosis (Lange-Sperandio et al., 2007; Ohnuki et al., 2012). Moreover, overexpressed Snail1 was observed within the injured podocytes of the puromycin amino nucleoside nephritis mouse models, which was suggestive of its role in encouraging the podocyte lesions (Matsui et al., 2007). Besides, p53 was subject to the modulation of TET1 in contributing to altered proliferation of gastric cancer cells, and this procedure was completed by demethylation-coupled DNA repair, implying that TET1 was also implicated in changing the apoptotic frequency of podocytes for its effect on p53 (Fu et al., 2014).
As for CD73, which was anchored onto the outside surfaces of cell membrane by glycosylphosphatidylinositol, it participated in both the salvage synthesis pathway metabolized by purine nucleotides and such physiological functions as transmembrane signal transduction and cell adhesion (Naito and Lowenstein, 1981; Airas et al., 2000; Zhou et al., 2001; Niemela et al., 2004). More than that, CD73, the surface marker of mesenchymal stem cells, was found to be expressed within the urine-derived stem cells (USCs) (Zhang et al., 2008). The USCs were superior to other somatic stem cells in treating chronic kidney disease (CKD), and they were potential indicators for early-stage renal damages that were related with CKD (Zhang et al., 2014a). Thus, it was suspected that CD73 might also be symbolic of the renal lesions caused by NS.
Even though there appeared a reaction trajectory among the studied molecules (i.e., miR-30a, CD73, Snail1, Notch1, p53, and TET1), it was only a conjecture, and certain systematic analyses were in demand to explain them based on in vivo and in vitro studies. With respect to the clinical study itself, the limited sample size and constrained ethnicities of the subjects were employed to account for the interrelationship between biomarkers and NS, which could generate bias when the study results were applicable to other populations. Finally, we could not neglect one aspect that the miR-30a was also the downstream molecule of lncRNAs or even circRNAs, and the functional mechanism should be expanded, so that the desirable biomarkers could be explored to assist in the early diagnosis and treatment for NS.
All in all, several works have been done to test the role of miR-30a, CD73, Snail1, Notch1, p53, and TET1 for NS diagnosis and prognosis, further in-depth investigations were still in demand.
Footnotes
Authors' Contributions
Conceived and designed the experiments: R.Y., H.H., M.W., and Z.M.; performed the experiments: R.Y., H.H., and M.W.; analyzed the data: R.Y. and H.H.; drafted the article: Z.M. All authors read and approved the final article.
Disclosure Statement
No competing financial interests exist.
References
Supplementary Material
Please find the following supplemental material available below.
For Open Access articles published under a Creative Commons License, all supplemental material carries the same license as the article it is associated with.
For non-Open Access articles published, all supplemental material carries a non-exclusive license, and permission requests for re-use of supplemental material or any part of supplemental material shall be sent directly to the copyright owner as specified in the copyright notice associated with the article.