




Abstract
Plants possess an innate immune system comprising of a complex network of closely regulated defense responses involving differential gene expression mediated by transcription factors (TFs). The WRKYs comprise of an important plant-specific TF family, which is involved in regulation of biotic and abiotic defenses. The overexpression of JcWRKY resulted in improved resistance in transgenic tobacco against Macrophomina phaseolina. The production of reactive oxygen species (ROS) and its detoxification through antioxidative system in the transgenics facilitates defense against Macrophomina. The enhanced catalase activity on Macrophomina infection limits the spread of infection. The transcript expression of antioxidative enzymes gene (CAT and SOD) and salicylic acid (SA) biosynthetic gene ICS1 showed upregulation during Macrophomina infection and combinatorial stress. The enhanced transcript of pathogenesis-related genes PR-1 indicates the accumulation of SA during different stresses. The PR-2 and PR-5 highlight the activation of defense responses comprising of activation of hydrolytic cleavage of glucanases and thaumatin-like proteins causing disruption of fungal cells. The ROS homeostasis in coordination with signaling molecules regulate the defense responses and inhibit fungal growth.
Introduction
P
Plant resistance to pathogens is a collective or sequential activation of a diverse set of defense mechanisms. The response involves transcriptional activation of different defense-related genes/transcription factors (TFs), opening of ion channels, modification of protein phosphorylation status, and activation of preformed enzymes to accordingly modify the primary and secondary metabolism of the plant. Phytohormones play a vital role in regulating the plant immune signaling network (Schenk et al., 2000), particularly the role of primary defense hormones, salicylic acid (SA), jasmonic acid (JA), and ethylene (ET), have been well studied (Denancé et al., 2013). The other phytohormones involved in plant growth and development, such as abscisic acid (ABA), auxins, cytokinins, brassinosteroids, gibberellins, etc., also regulate plant defense, either alone or in conjunction with the primary defense hormones (Kazan and Lyons, 2014). The systemic acquired resistance (SAR) is a broad-spectrum plant resistance against a variety of pathogenic fungi, bacteria, and viruses (Durrant and Dong, 2004). Accumulation of SA, leads to the activation of SAR (Vallad and Goodman, 2004) and the downstream signaling protein NON EXPRESSOR OF PR1 (NPR1; Durrant and Dong, 2004). NPR1 facilitates crosstalk between SA and JA-dependent defense pathways, depending on the nature and the stage of infection (Koornneef and Pieterse, 2008). SAR is controlled by an interaction between MeSA (methyl salicylate) and lipid-based long-distance signaling; furthermore, the dependency of SAR on MeSA is also determined by the light factor (Liu et al., 2011a, 2011b).
A number of TFs, such as basic leucine zipper containing domain proteins (bZIP), WRKY, myelocytomatosis-related proteins (MYC), myeloblastosis-related proteins (MYB), APETALA2/Ethylene-Responsive Element-Binding Factors (AP2/EREBP), and NAC, no apical meristem (
A number of WRKY TFs have been characterized for providing resistance against different fungi and bacterial pathogens; however, no report studied the role of WRKY TFs toward tolerance against Macrophomina. Macrophomina phaseolina (Tassi) Goid, is a Botryosphaeriaceae soilborne, plant fungal pathogen causing heavy economic loss to different agronomically important crops (Mihail and Taylor, 1995) by causing damping off, seedling blight, collar rot, stem rot, charcoal rot, basal stem rot, and root rot diseases. The M. phaseolina growth is favored during heat and drought conditions, producing microsclerotia within the roots/stems of the host plants. The microsclerotia are the primary source of inoculum and can survive for longer durations in dry soils as compared with wet soils. Although, different management strategies, such as solarization, organic amendments, crop rotation, use of fungicides, etc. are employed, nevertheless, restricting losses due to Macrophomina infection still remains a challenge to agriculture scientists. Considering the difficulties in management of diseases caused by Macrophomina by traditional methods, genetic engineering employing the genes/TFs of plant defense system may be the best alternative.
Earlier, we have reported the binding of JcWRKY protein to cis-elements of PR-1 gene promoter (Agarwal et al., 2014) and also the potential of the JcWRKY tobacco transgenics toward improved salinity tolerance (Agarwal et al., 2016). In the present work, we report enhanced resistance of JcWRKY tobacco transgenics against Macrophomina through SA-mediated reactive oxygen species (ROS) signaling.
Materials and Methods
Plant growth and stress treatments
To evaluate the role of JcWRKY in biotic stress, the seeds of wild-type (WT) and tobacco transgenics (Agarwal et al., 2016; L41, L43, L46) were surface sterilized and germinated on Murashige and Skoog (MS) medium (Murashige and Skoog, 1962). Germinated seeds were transferred to plastic pots containing soil and allowed to grow under 16-h light–8-h dark cycles at 25°C for 15 days. After acclimatization, well-grown plants were subjected to water (as control), 150 μM SA, M. phaseolina, and combined treatment of M. phaseolina and SA (150 μM SA). M. phaseolina was first grown on potato dextrose agar (PDA) for 3–4 days at 25°C. Then M. phaseolina treatment was given by placing four, 20 mm diameter PDA disc with Macrophomina close to the plant at four points ∼1 cm below. Plants were allowed to grow 72 h and then the leaves were collected for biochemical analysis and real-time gene expression analysis.
In vivo localization and quantification of O2 and H2O2
In vivo localization of O2 •− and H2O2 was carried out by histochemical staining with Nitro Blue Tetrazolium (NBT) and 3,3′-diaminobenzidine (DAB) reagent, respectively, as per Shi et al. (2010) with minor modification. Two sets of excised leaves were prepared. One set of the leaves were immersed in NBT solution (1 mg/mL) prepared in 10 mM phosphate buffer (pH 7.8). Then they were illuminated for 4 h until the appearance of the dark spots of blue formazan precipitation. For localization of H2O2, another set of leaves was immersed in DAB solution (1 mg/mL, pH 3.8) freshly made in 10 mM phosphate buffer (pH 7.8) and illuminated for 8 h until brown spots appeared. After staining, the chlorophyll was bleached out in absolute ethanol two times and visualized for the presence of the blue and brown spots, for O2 •− and H2O2, respectively.
The quantification of O2 •− radical was carried out as per Sanadhya et al. (2015). The collected leaves were homogenized in 10 mL of 65 mM potassium phosphate buffer (pH 7.8). The extract was collected by centrifugation at 5000 rpm for 10 min. The reaction mixture was prepared using 1 mL of extract, 0.9 mL of 65 mM phosphate buffer (pH 7.8), and 0.1 mL of 10 mM hydroxyl amine hydrochloride followed by an incubation at 25°C for 20 min. Then 17 mM sulfanilamide and 7 mM a-naphthylamine were added and further incubated at 25°C for 20 min. Sodium nitrite was used as a standard (10–200 nmol). The absorbance of the samples and standards was recorded at 530 nm and O2 •− content was calculated from the standard curve.
The hydrogen peroxide (H2O2) was quantified by preparing acetone extract as described by Sanadhya et al. (2015). Tissue was homogenized in cold acetone and centrifuged at 5000 rpm for 10 min. Reaction mixture was prepared by adding 1 mL of the extract and 0.5 mL of titanium reagent (0.1% titanium dioxide dissolved in 20% H2SO4) and centrifuged at 6000 rpm for 15 min. The specific absorbance was measured at 415 nm and the concentration of H2O2 was calculated against the standard curve of H2O2.
Analysis of antioxidative enzymes
To measure the activity of SOD and CAT, leaf tissue was homogenized in 10 mL of 100 mM phosphate buffer (7.5 pH) containing 0.5 mM EDTA. SOD activity was measured as described by Dhindsa et al. (1981) with minor modification. Final volume (3 mL) of reaction mixture contained 50 mM phosphate buffer (7.5 pH), 6.6 mM methionine, 0.075 mM NBT, 0.1 mM EDTA, 50 μL enzyme extract, and 2 μM riboflavin. All reaction preparations were carried out in dark condition. Riboflavin was added in the end and then immediately reaction was transferred under 15 W light lamp for 15 min. One control reaction was also prepared lacking the enzyme extract. The absorbance was measured at 560 nm. One unit of SOD is defined as the amount required to inhibit the photoreduction of NBT by 50%.
CAT assay was carried out based on the reduction of H2O2 by CAT enzyme present in the sample extract. The method was followed as per Dhindsa et al. (1981) with some modification. Reaction mixture contained 50 mM phosphate buffer (7.5 pH), 12.5 mM H2O2, and 50 μL enzyme extract. After 1 min, the absorbance was measured at 240 nm. The decrease in H2O2 was inversely proportional to the CAT enzyme present in the sample. The activity was expressed in units, where one unit of catalase converts one micromole of hydrogen peroxide per minute.
In vitro antifungal activity of JcWRKY transgenics
To evaluate an antifungal activity of JcWRKY transgenics a whole leaf and leaf extract assay were carried out from in vitro-grown plants on MS basal medium as per Agarwal et al. (2016). The healthy and fully expanded leaf was kept on 0.8% agar (with 100 mg/mL of carbenicillin) plate and about 2 mm diameter PDA plug containing M. phaseolina was placed upside down on the mid vein region of the leaf to facilitate the infection more effectively. Simultaneously, the PDA plug without M. phaseolina was also kept on transgenic leaf in the same way as a control. All plates were kept at 28°C under normal light condition. After 3 dpi (days postinoculation), the leaf surface was observed under stereomicroscope (LeicaL2) and photographs were captured at the same magnification. Each experiment was repeated thrice.
RNA extraction and cDNA synthesis
Total RNA from control and stress-treated tissue was extracted using Tris-SDS buffer (Agarwal et al., 2015) and quantified with Epoch spectrophotometer (BioTek, India). DNaseI (MBI Fermentas) treatment was given for removing genomic DNA contamination. Five microgram of total RNA was used for first-strand cDNA synthesis following the manufacturer's protocol (Thermo Scientific).
Quantitative real-time polymerase chain reaction analysis
The real-time quantitative reverse transcriptase (RT)-polymerase chain reaction (PCR) of selected genes was performed with specific oligonucleotide primers (Table 1), using the first-strand cDNA synthesized from WT and transgenic leaf tissue exposed to different treatments and from their corresponding control. The actin gene was used as an internal gene control (Table 1). The PCRs was carried out using 1 × supermix (Bio-Rad) and 30 ng of each gene-specific primers in iCycler (CFX96; Bio-Rad) at 94°C for 2 min, 55°C for 1 min, and 72°C for 1 min for 39 cycles. At the end of the PCR cycles, the products were analyzed through a melt curve analysis to check the specificity of PCR amplification. Three replicates of each reaction were performed, and data were analyzed by Livak method (Livak and Schmittgen, 2001) and expressed as normalized expression ratio (2−ΔΔCT) of particular gene to specific stress treatment. Expression ratio was calculated as ΔΔCT = ΔCT (treated plant) − ΔCT (control plant); ΔCT (treated plant) = ΔCT of treated plant (gene) – ΔCT of treated plant (actin); ΔCT (control plant) = ΔCT of control plant (gene) – ΔCT of control plant (actin).
Statistical analysis
Each experiment was repeated thrice and the mean values and standard errors were calculated. Analysis of variance was calculated using Fisher's Least Significant Difference by Infostat software at p ≤ 0.05 to determine the significance of difference between the mean of control and different stress treatments. Mean values of treatments that were significantly different from each other were indicated by different alphabets.
Results
JcWRKY transgenics exhibit reduced susceptibility toward M. phaseolina
To investigate the potential of JcWRKY toward playing a regulatory role in improving resistance to pathogen, leaf bioassay was performed in vitro employing M. phaseolina discs as inoculum. At 3 dpi, the wild-type plants exhibited decay and blackening at the base of the detached leaf, and the infection started to spread along the midrib as was evident by the blackening in the vicinity of the midrib from proximal to distal end of the leaf. However, the transgenic lines showed slower infection and the growth of fungus was less on leaves as compared with WT leaves (Fig. 1).

Severity of infection on wild-type (WT) and JcWRKY transgenics (L41, L43, and L46) leaf incubated with Macrophomina phaseolina. Color images available online at
Regulation of ROS in JcWRKY transgenics
ROS directly interacts with different signaling molecules to initiate defense response for minimizing cellular damage. The O2 •− and H2O2 content of WT and transgenics was differentially regulated with all the treatments. The WT showed similar O2 •−content with water and SA treatment; however, the transgenic lines showed significant increase of 1.4- to 2.30-fold in O2 •−content on SA treatment as compared with WT. Interestingly, the Macrophomina treatment resulted in maximum accumulation of O2 •−content (0.237 nmol/mg fresh weight [FW]) in WT, which showed significant decrease to 0.182 nmol/mg FW with combined stress of M+SA. However, the JcWRKY transgenics showed significantly reduced (0.44- to 0.52-fold with Macrophomina and 0.5- to 0.7-fold with combinatorial stress), almost similar O2 •−content with both Macrophomina only as well as with combinatorial stress (M+SA) treatments as compared with WT. The accumulation of O2 •−content ranged from 0.106 to 0.124 nmol/mg FW with Macrophomina treatment and ranged from 0.1043 to 0.128 nmol/mg FW with combined stress of M+SA in the transgenics (Fig. 2A).

In vivo quantification of
The H2O2 content of WT and transgenics showed similar range (24–25 μmol/mg FW) under control conditions. The WT showed maximum accumulation of H2O2 with combinatorial stress (34 μmol/mg FW) followed by Macrophomina (31 μmol/mg FW) and SA (29 μmol/mg FW) treatments. However, in transgenics maximum H2O2 content was observed with SA (32–35 μmol/mg FW) followed by combinatorial (27–31 μmol/mg FW) and Macrophomina stress treatments (Fig. 2B). A similar qualitative result was observed as blue- and brown-colored spots for O2 •− and H2O2 content, respectively, toward response to different stresses in WT and transgenics (Fig. 3A, B).
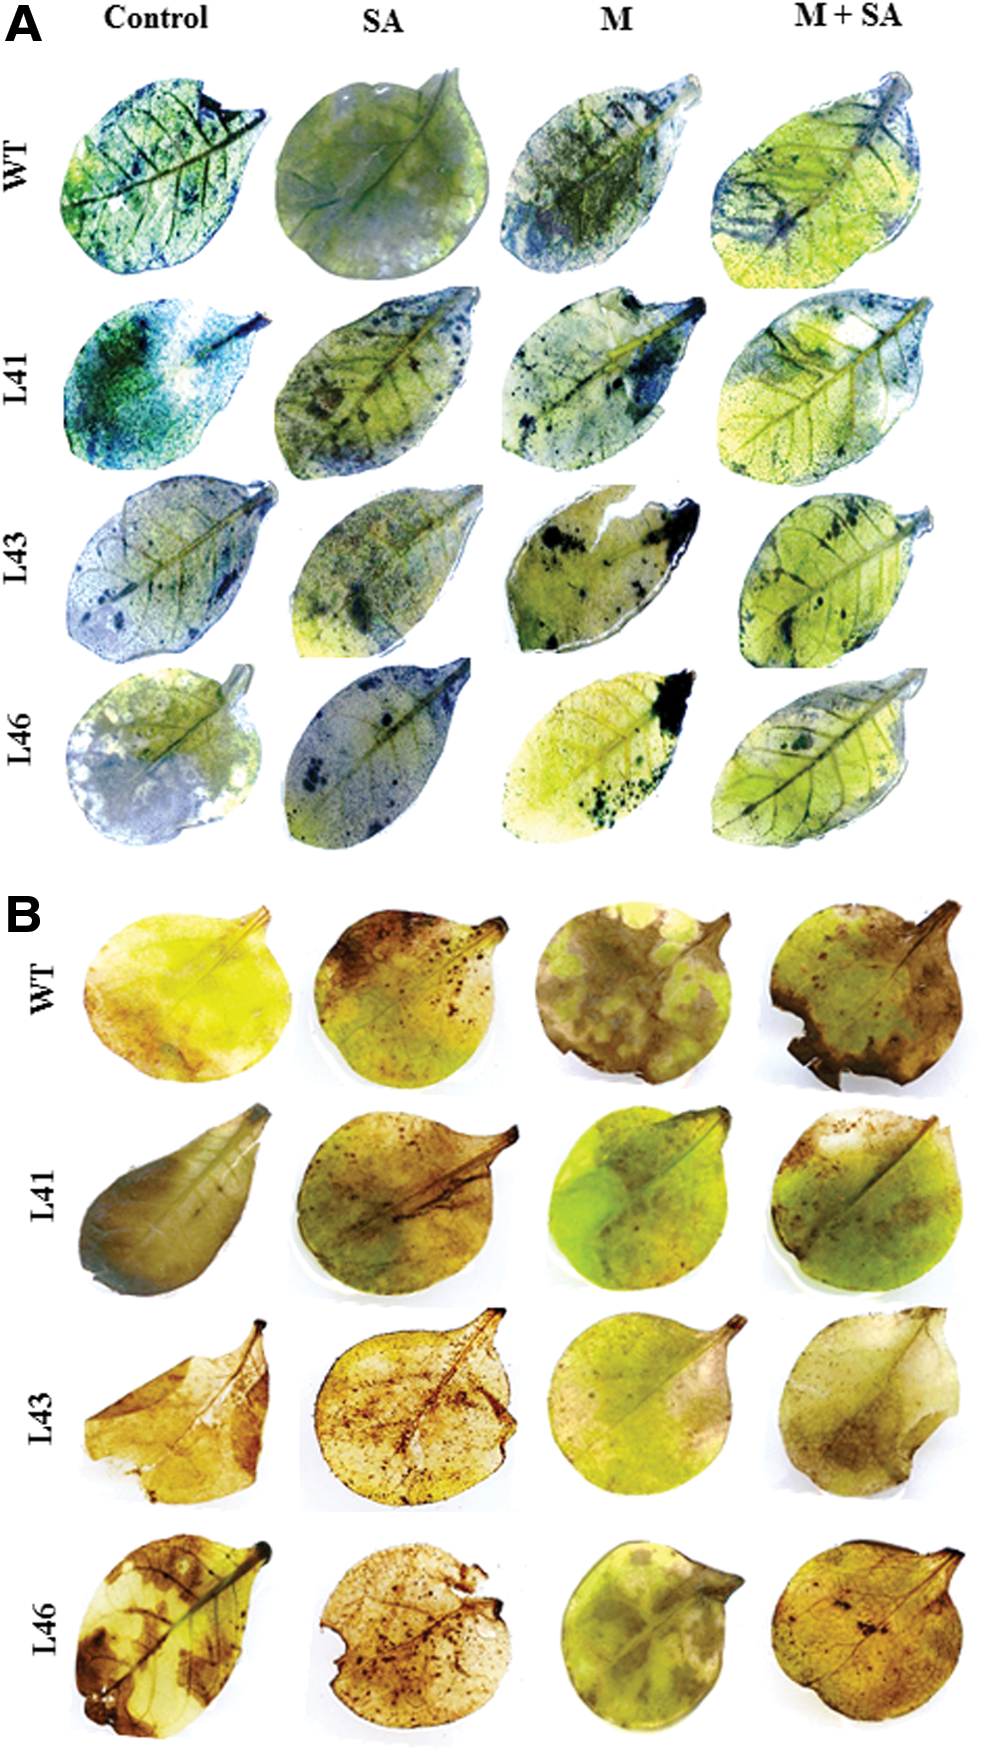
In vivo localization of O2
•− and H2O2 in leaves of WT and transgenic lines,
Antioxidative status of JcWRKY transgenics
The JcWRKY transgenics showed enhanced SOD activity with Macrophomina (0.88–0.9 units/mg FW) and combinatorial stress (2.0–2.3 units/mg FW) treatment as compared with WT. However, with SA treatment the SOD activity of the transgenics showed a decline of 1.2- to 1.3-fold as compared with WT (Fig. 4A).
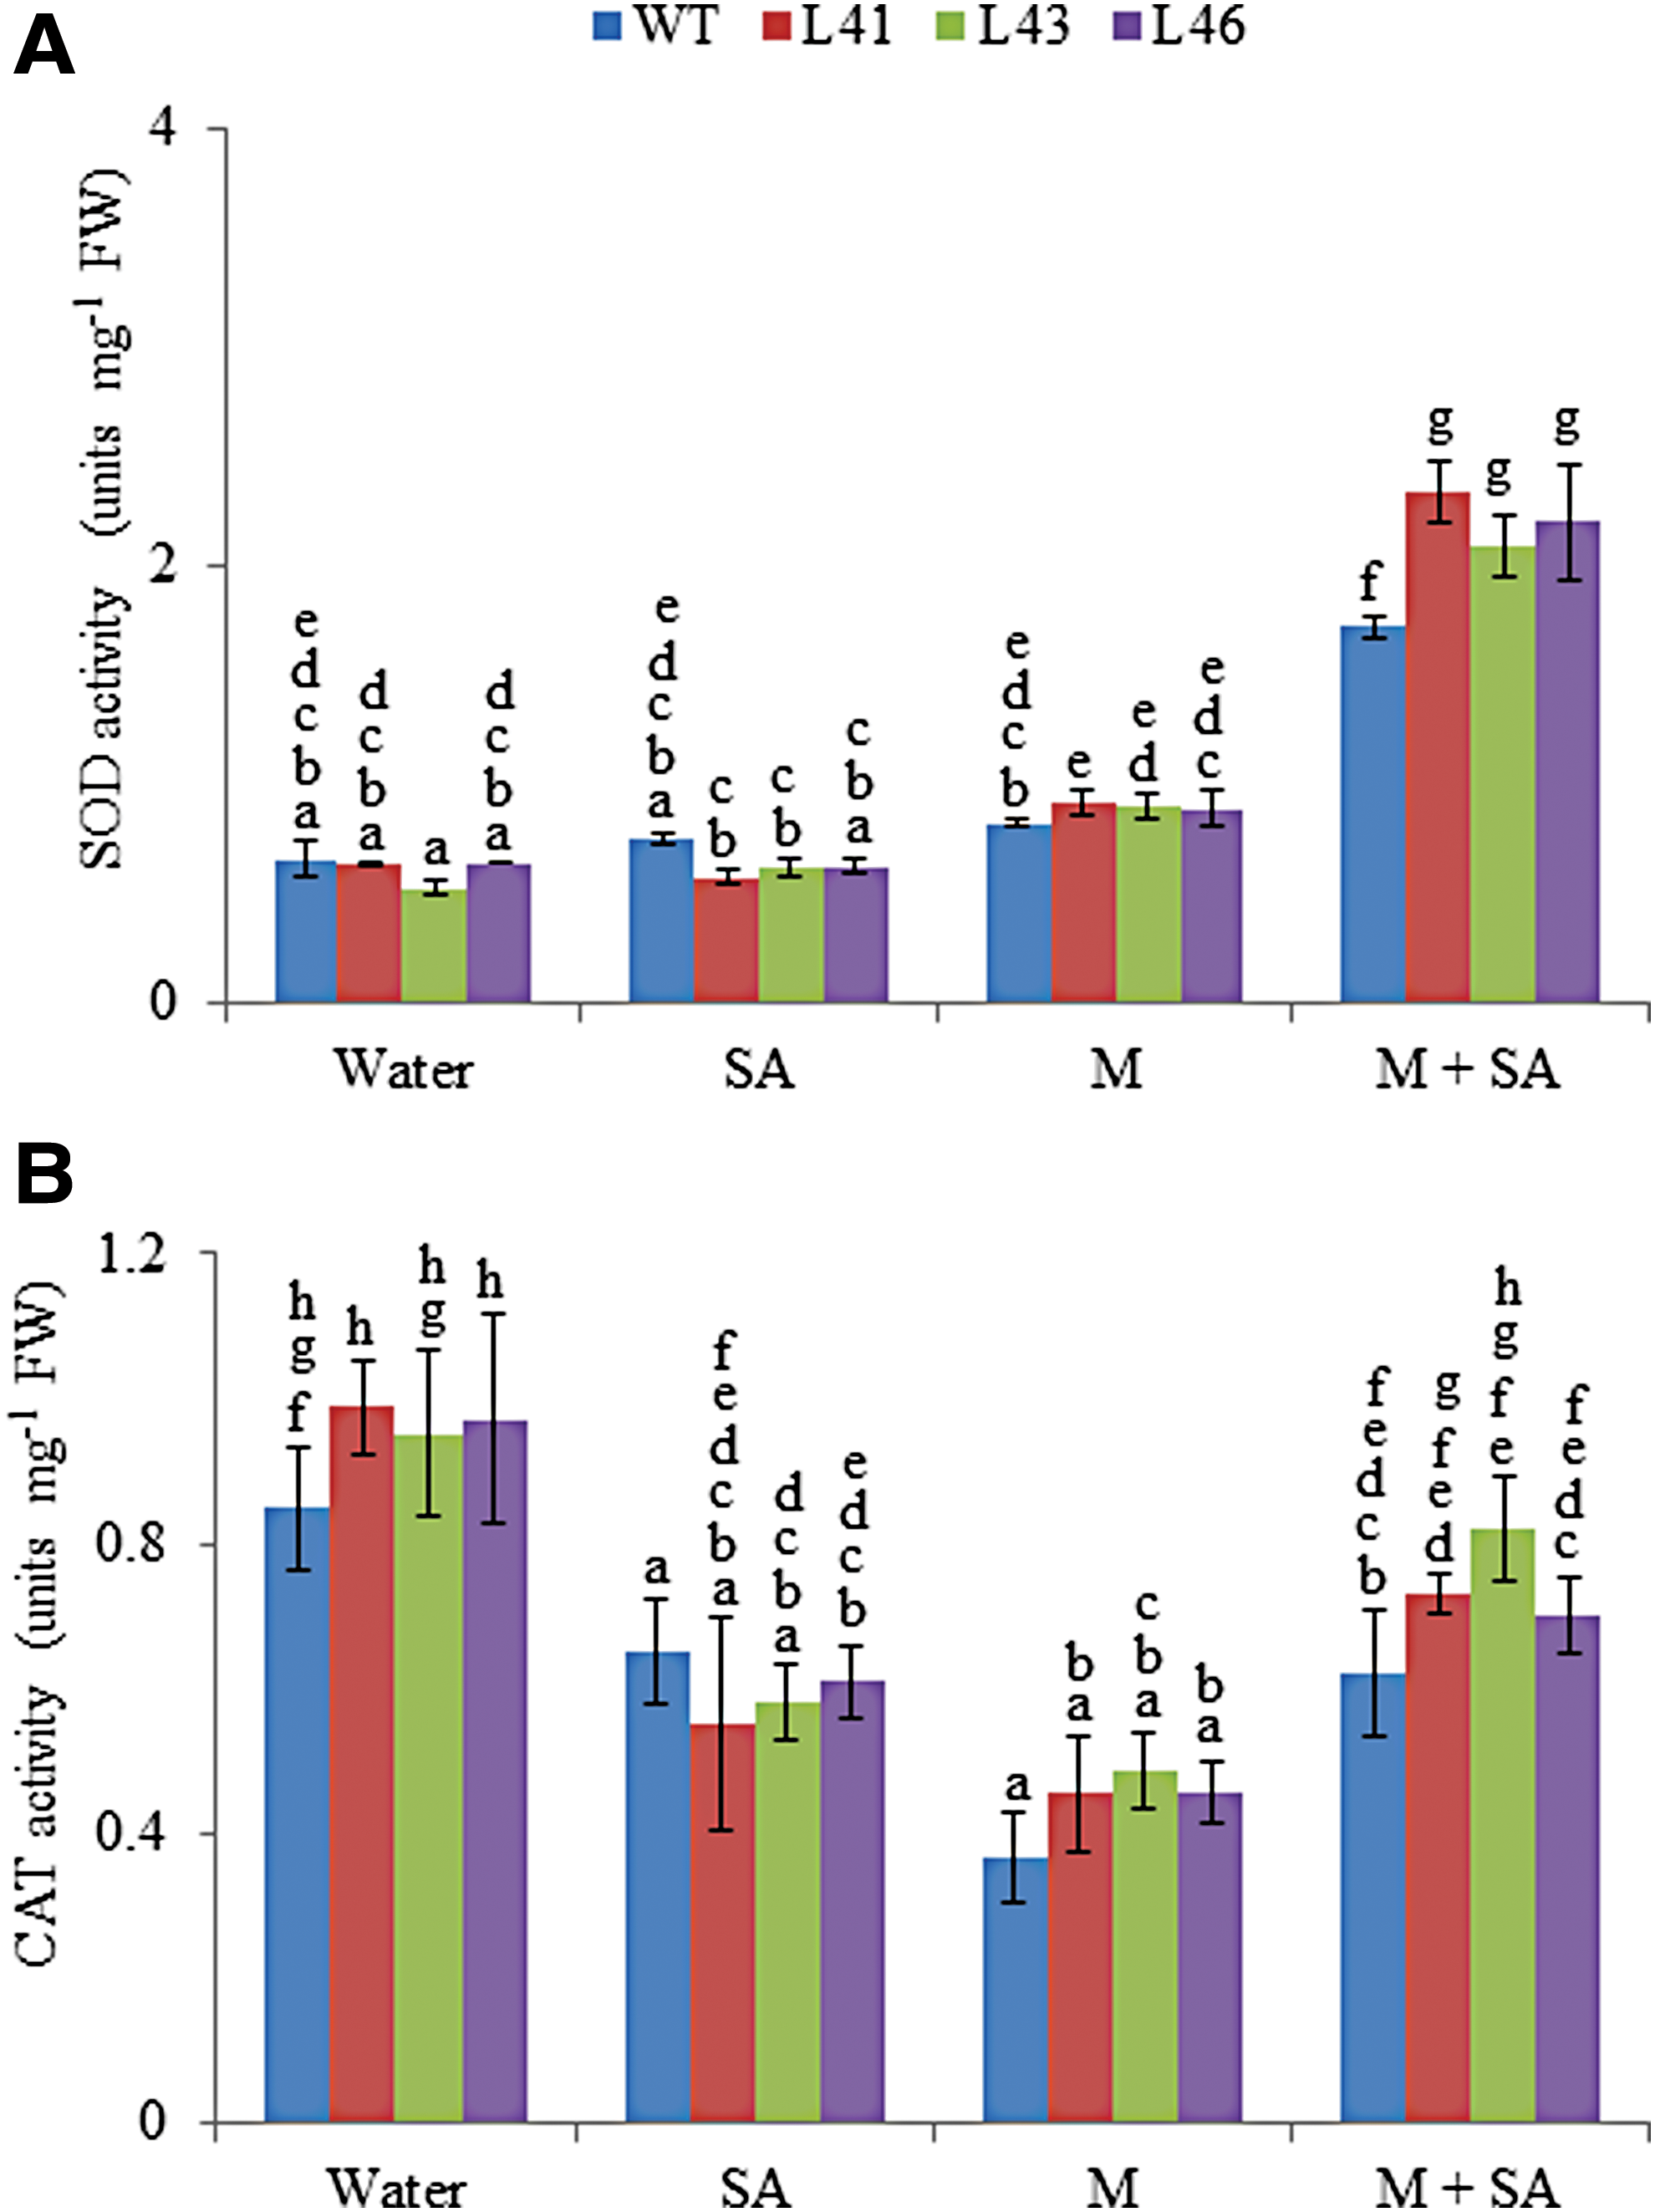
Activity of
Another antioxidative enzyme, CAT, was analyzed, and the CAT activity of the WT as well as transgenics decreased on different treatments as compared with control conditions (water). The transgenics showed maximum CAT activity with combinatorial stress (0.7–0.8 units/mg FW), followed by SA and Macrophomina treatments (0.45–0.48 units/mg FW, Fig. 4B).
The radar diagram was built by comparing all the biochemical parameters between WT and transgenic plants under control, SA, Macrophomina, and combinatorial treatments (Fig. 5). The highest accumulation of O2 •− and H2O2 is observed in WT with Macrophomina and with combinatorial stress, respectively. The maximum SOD activity is observed in transgenics with combinatorial stress, whereas, the maximum CAT activity is observed under control conditions.
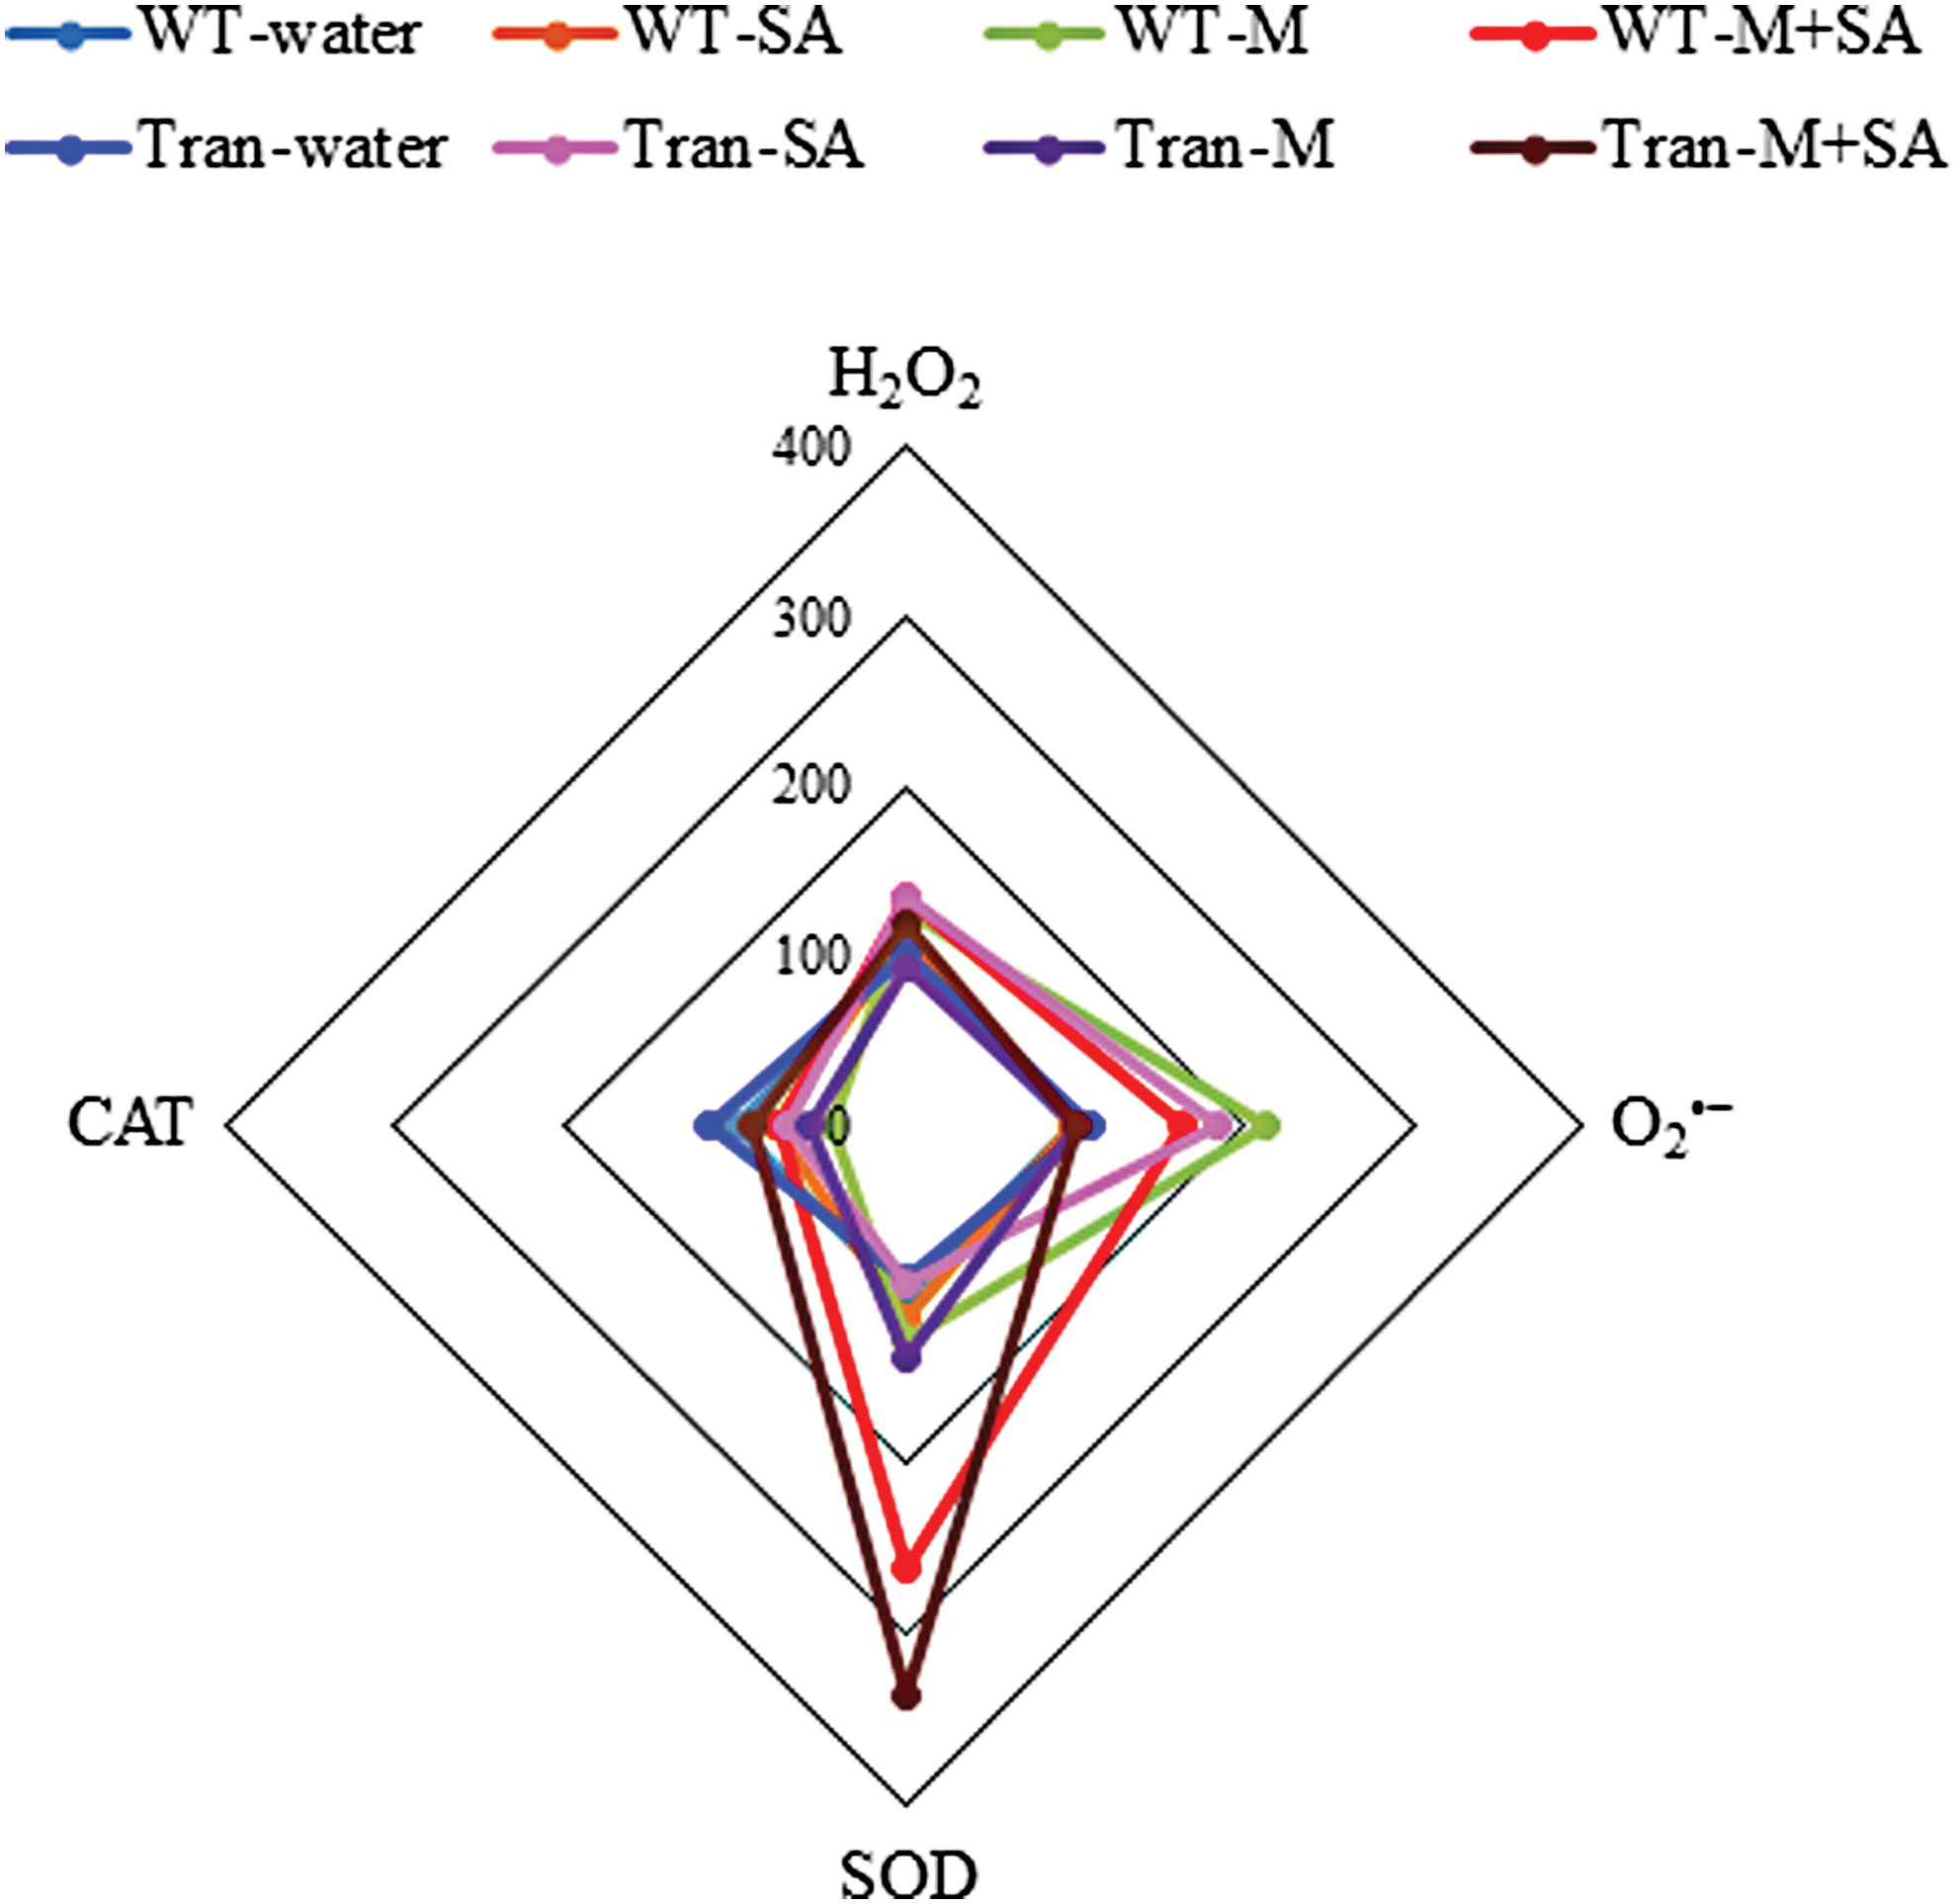
The radar diagram showing comparison of all the biochemical parameters between WT and transgenic plants (average of three transgenic lines) with water, SA, M, and SA+M. Color images available online at
Differential expression of antioxidative, phytohormone, and biotic stress-responsive genes
To assess the role of JcWRKY TF in disease resistance, the transcript levels of antioxidative (SOD, CAT), SA biosynthesis (isochorismate synthase [ICS1]) genes, and PR gene families PR-1, PR-2, PR-5, and PR-10 were investigated by quantitative real-time (qRT)-PCR analysis. The SOD transcript of the transgenics was higher than WT with both Macrophomina infection and combinatorial stress. The SOD transcript was found to have 2.1- to 2.7-fold increase on combined stress (Fig. 6A). Interestingly, the CAT transcript was higher (1.52- to 3.1-fold) in the transgenics on Macrophomina treatment and only 1.18- to 1.52-fold with combinatorial stress (Fig. 6B). The ICS1 transcript showed higher accumulation in all transgenic lines as compared with WT under all the treatments; however, with Macrophomina stress only L46 showed higher transcript (2.12-fold, Fig. 6C).

Relative-fold expression of downstream genes in JcWRKY transgenics under different stress by qPCR;
The pathogenesis-related genes, PR-1, PR-2, and PR-5, were upregulated in the transgenics in response to all treatments (Fig. 6D–F). The maximum accumulation of 17.24- to 24.9-fold of PR-1 transcript was observed for SA treatment in the transgenics. The PR-2, PR-5 transcript accumulated in the range of 2- to 3.5-fold and 1.7- to 5.0-fold, respectively. The PR-10 transcript of WT ranged >2.2-fold, whereas, for the transgenics it ranged only 1- to 2-fold in response to all treatments compared with control conditions (Fig. 6G).
Discussion
Plants modulate a diversity of molecular signaling pathways underlying plant defense responses to protect themselves against pathogen infection and colonization. The pathogen's lifestyle depends on how it utilizes its host plant as substrate; the biotrophs on infection maintain the plant cells alive for their growth, the necrotrophs kill the host cells and then colonize the dead tissue, whereas the hemibiotrophs initially keep cells alive (biotrophy), but kill them at later stages of infection (necrotrophy). M. phaseolina is one of the most harmful necrotrophic fungal pathogen, producing a large number of sclerotia that plugs the vessels, causing the plant to wilt/dehydrate. The effector targets have been identified for biotrophic and hemibiotrophic fungal pathogens; however, the necrotrophic fungal pathogen secrete a large number of effectors, which regulate a number of cellular responses and, therefore, plant defense is not well understood for necrotrophs (Kazan and Lyons, 2014). The resistance to biotrophs or necrotrophs is mediated through production of three major phytohormones (JA, ET, and SA) and there exist, independent signal transduction routes; however, certain pathways show crosstalk (Glazebrook, 2005).
The WRKY TFs participate in plant defense response both as positive and negative regulators. These TFs are induced by SA and also regulate SA biosynthesis and thereby SAR. WRKY TFs are central components of many aspects of innate immunity system of the plants, which includes PTI, ETI, basal defense, and SAR (Eulgem and Somssich, 2007). There are several examples where overexpression or knockdown of WRKY gene effects the plant defense mechanism and alters some components of signaling mechanism (Pandey and Somssich, 2009; Qiu et al., 2009).
In the present study, the JcWRKY transgenics show reduced susceptibility toward M. phaseolina. A comprehensive analysis revealed the induction of 15 rice WRKY genes in response to fungus Magnaporthe grisea (Ryu et al., 2006). The Arabidopsis WRKY proteins play a positive role in plant resistance to necrotrophic pathogens (WRKY4, WRKY33, WRKY18, WRKY40, and WRKY60; Xu et al., 2006; Zheng et al., 2006). WRKY70 functions as the node of convergence for SA-mediated and JA-mediated defense signaling pathways, and it positively regulates SAR (Li et al., 2004, 2006; Wang et al., 2006; Hu et al., 2012). The WRKY3 and WRKY4 also function as positive regulators in plant resistance to necrotrophic pathogens (Lai et al., 2008). The At WRKY75 and Fa WRKY1 positively regulate defense during compatible and incompatible interactions in Arabidopsis. A family of WRKY genes was seen to associate with pathogen defense in strawberry fruit plant. Fa WRKY1 is an important mediator of defense responses to Colletotrichum acutatum in strawberry and increases resistance (Encinas-Villarejo et al., 2009).
Further studies in Capsicum annum reveals that there are several WRKY TFs that are associated with pathogen tolerance. CaWRKY1 and CaWRKY2 were seen to show negative regulation of tolerance toward P. syringae and Xanthomonas anoxopodis infection (Oh et al., 2006, 2008). HvWRKY1 and HvWRKY2 shows enhanced tolerance toward Blumeria graminis (Shen et al., 2007). GhWRKY3 function in defense against fungal infection from Rhizoctonia solani, Colletotrichum gossypii, and Fusarium oxysporum (Guo et al., 2010). NbWRKY8 helps in defense against Colletotrichum orbiculare (Ishihama et al., 2011). PtWRKY23 shows resistance toward Melampsora infection (Levée et al., 2009).
The response of ROS generation during plant–microbe interactions depend on the intensity of the ROS signals (Kotchoni and Gachomo, 2006). High ROS leads to hypersensitive response (HR) and oxidative damage, whereas, balanced ROS content induces the expression of defense genes, antimicrobial compounds, and cell wall fortification through oxidative crosslinking (Brisson et al., 1994; Lamb and Dixon, 1997; Brown et al., 1998; Kotchoni and Gachomo, 2006). The JcWRKY transgenics show differential regulation of ROS through SA, Macrophomina, and combinatorial stress treatments. The Macrophomina and combinatorial stress treatments resulted in low accumulation of ROS in transgenics as compared with WT, probably due to regulation of SA signaling in transgenics. Earlier, we have reported that JcWRKY transgenics show coordination with SA signaling to alleviate salinity stress (Agarwal et al., 2016). The production of ROS was observed during interaction between R. solani and wheat (Foley et al., 2016). SA is an important plant-signaling hormone/molecule involved in defense responses to pathogen attack (Durrant and Dong, 2004). SA content increases at and around the infection sites and it is postulated that ROS acts synergistically in a signal amplification loop with SA for maintaining the systemic plant defenses (Draper, 1997). ROS regulates the MAPK-signal cascade, which plays a key role in ROS detoxification and resistance (Chung, 2012). The MAPK-mediated phosphorylation plays an important role in the defense response of WRKY through activation of downstream defense-related genes (Ishihama et al., 2011). The strawberry FaWRKY1 results in a strong oxidative burst and glutathione-S-transferase (GST) induction to increase resistance to P. syringae (Encinas-Villarejo et al., 2009). Furthermore, the JcWRKY transgenic fungal resistance could also be attributed toward its potential to bind to W-box of pathogenesis related-1 (PR-1, Agarwal et al., 2014), a marker gene for SAR.
The maintenance of cellular redox balance is essential for healthy survival and is realized by manifesting the redox signals to regulatory outputs, at the transcription level, allowing adaptive response to oxidative stress through modulating the secondary metabolism profile. The SOD enzyme is known to catalyze the production of H2O2 by scavenging radicals O2 •−. The resistant JcWRKY transgenics show enhanced SOD activity on Macrophomina and combinatorial stress. Increased SOD activity is observed in tolerant germplasms of pearl millet after inoculating the seedlings with Sclerospora graminicola (Babitha et al., 2002). The Sorghum cultivars also showed increased SOD activity on M. phaseolina-inoculated plants as compared with control (Kumari et al., 2015); thus, SOD plays an important role in antioxidant defense system against pathogen infection. Similarly, catalase are the major H2O2 scavengers modulating in planta H2O2 content. The JcWRKY transgenics showed higher catalase activity with Macrophomina treatment as compared with WT; similarly, it has been reported that during P. nicotianae infection, the host catalase activity is lowered, to facilitate successful infection (Blackman and Hardham, 2008), thereby, indicating that WT with low catalase activity are more susceptible to infection. The combinatorial stress improves the CAT activity of both WT and transgenics, indicating the role of SA toward improving resistance.
The SOD gene is involved in disease resistance other than HR also; the H2O2 participates in resistance through crosslinking of cell wall proteins or phenolic substances (Vallélian-Bindschedler et al., 1998; Kwon and Anderson, 2001). The increased SOD transcript in transgenics contributes to the reduced susceptibility of the transgenics. The transcript expression of CAT gene in transgenics was higher with both Macrophomina and combined stress, indicating that the resistance of the transgenics can be attributed toward enhanced CAT expression. Similarly, sugarcane catalase was upregulated in the resistant variety after inoculation with Sporisorium scitamineum, suggesting a positive correlation between the catalase and the smut resistance in sugarcane (Su et al., 2014). Yu et al. (1999) have shown the involvement of plant class II catalases in resistance against the late blight fungal pathogen Phytophthora infestans in transgenic potato plants.
The WRKY genes regulate the expression of genes involved in the biosynthesis of defense-related phytohormones. The JcWRKY transgenics show increased transcript of ICS1 gene. van Verk et al. (2011) reported that WRKY28 and WRKY46 are transcriptional activators of ICS1 and PBS3 (AVRPPHBSUSCEPTIBLE 3), involved in SA biosynthesis and metabolism, respectively. The conversion of chorismate to isochorismate through the action of isochorismate synthase (ICS), is an important step of SA biosynthesis.
The PR proteins are induced by various types of pathogens, such as viruses, bacteria, fungi, also by abiotic stress, HR, and SAR (Liu and Ekramoddoullah, 2006). The transcript accumulation of PR-1, PR-2, and PR-5 was upregulated in transgenics as compared with WT. PR-1 genes are induced by SA and pathogen and is commonly used as a marker for SAR (Mitsuhara et al., 2008). The PR-2 family consists of b-1,3-glucanases (glucan endo-1,3-b-glucosidases) and catalyzes the hydrolysis of b-1,3-glucans. They act in fungal defense by hydrolyzing fungal cell walls and also by generating elicitors. The PR-5 family of proteins includes permatins, osmotins, zeamatins, and thaumatin-like proteins (TLP). TLPs cause osmotic breakage of transmembrane pore on the fungal plasma membranes. The transcript of PR-10 gene was, however, not upregulated in transgenics, indicating that JcWRKY does not activate the PR-10 gene, which is considered to have RNase activity that supports its antimicrobial activity either directly or indirectly (Agarwal and Agarwal, 2014, 2016). The overexpression of GhWRKY40 significantly inhibited the expression of PR genes and enhanced the susceptibility of transgenics to bacterial pathogens (Wang et al., 2014), thus activation of PR genes facilitates disease resistance.
The enhanced resistance of JcWRKY transgenics toward Macrophomina is largely corelated with its redox homeostasis, enhanced SOD and CAT activity, and increased transcript expression of PR genes facilitating the disruption/hydrolysis of fungal cell wall/plasma membrane. ROS homeostasis and the interaction of ROS with different signaling molecules orchestrate the different resistance responses against pathogens.
Footnotes
Acknowledgments
CSIR-CSMCRI Communication No.-PRIS 152. P.A. acknowledges the financial support from DSTWOS-A scheme. K.P. was supported by DST-SERB. The CSIR-CSMCRI is acknowledged for research support.
Disclosure Statement
No competing financial interests exist.