
Abstract
The dominant white phenotype in domestic pigs is caused by two mutations in the KIT gene: a 450 kb duplication containing the entire KIT gene together with flanking sequences and one splice mutation with a G:A substitution in intron 17. The purpose of this study was to establish a simple, rapid method to determine KIT genotype in pigs. First, to detect KIT copy number variation (CNV), primers for exon 2 of the KIT gene, along with a TaqMan minor groove binder (MGB) probe, were designed. The single-copy gene, estrogen receptor (ESR), was used as an internal control. A real-time fluorescence-based quantitative PCR (FQ-PCR) protocol was developed to accurately detect KIT CNVs. Second, to detect the splice mutation ratio of the G:A substitution in intron 17, a 175 bp region, including the target mutation, was amplified from genomic DNA. Based on the sequence of the resulting amplified fragment, an MGB probe set was designed to detect the ratio of splice mutation to normal using FQ-PCR. A series of parallel amplification curves with the same internal distances were obtained using gradually diluted DNA as templates. The CT values among dilutions were significantly different (p < 0.001) and the coefficients of variation from each dilution were low (from 0.13% to 0.26%). The amplification efficiencies for KIT and ESR were approximately equal, indicating ESR was an appropriate control gene. Furthermore, use of the MGB probe set resulted in detection of the target mutation at a high resolution and stability; standard curves illustrated that the amplification efficiencies of KIT1 (G) and KIT2 (A) were approximately equal (98.8% and 97.2%). In conclusion, a simple, rapid method, with high specificity and stability, for the detection of the KIT genotype in pigs was established using TaqMan MGB probe real-time quantitative PCR.
Introduction
T
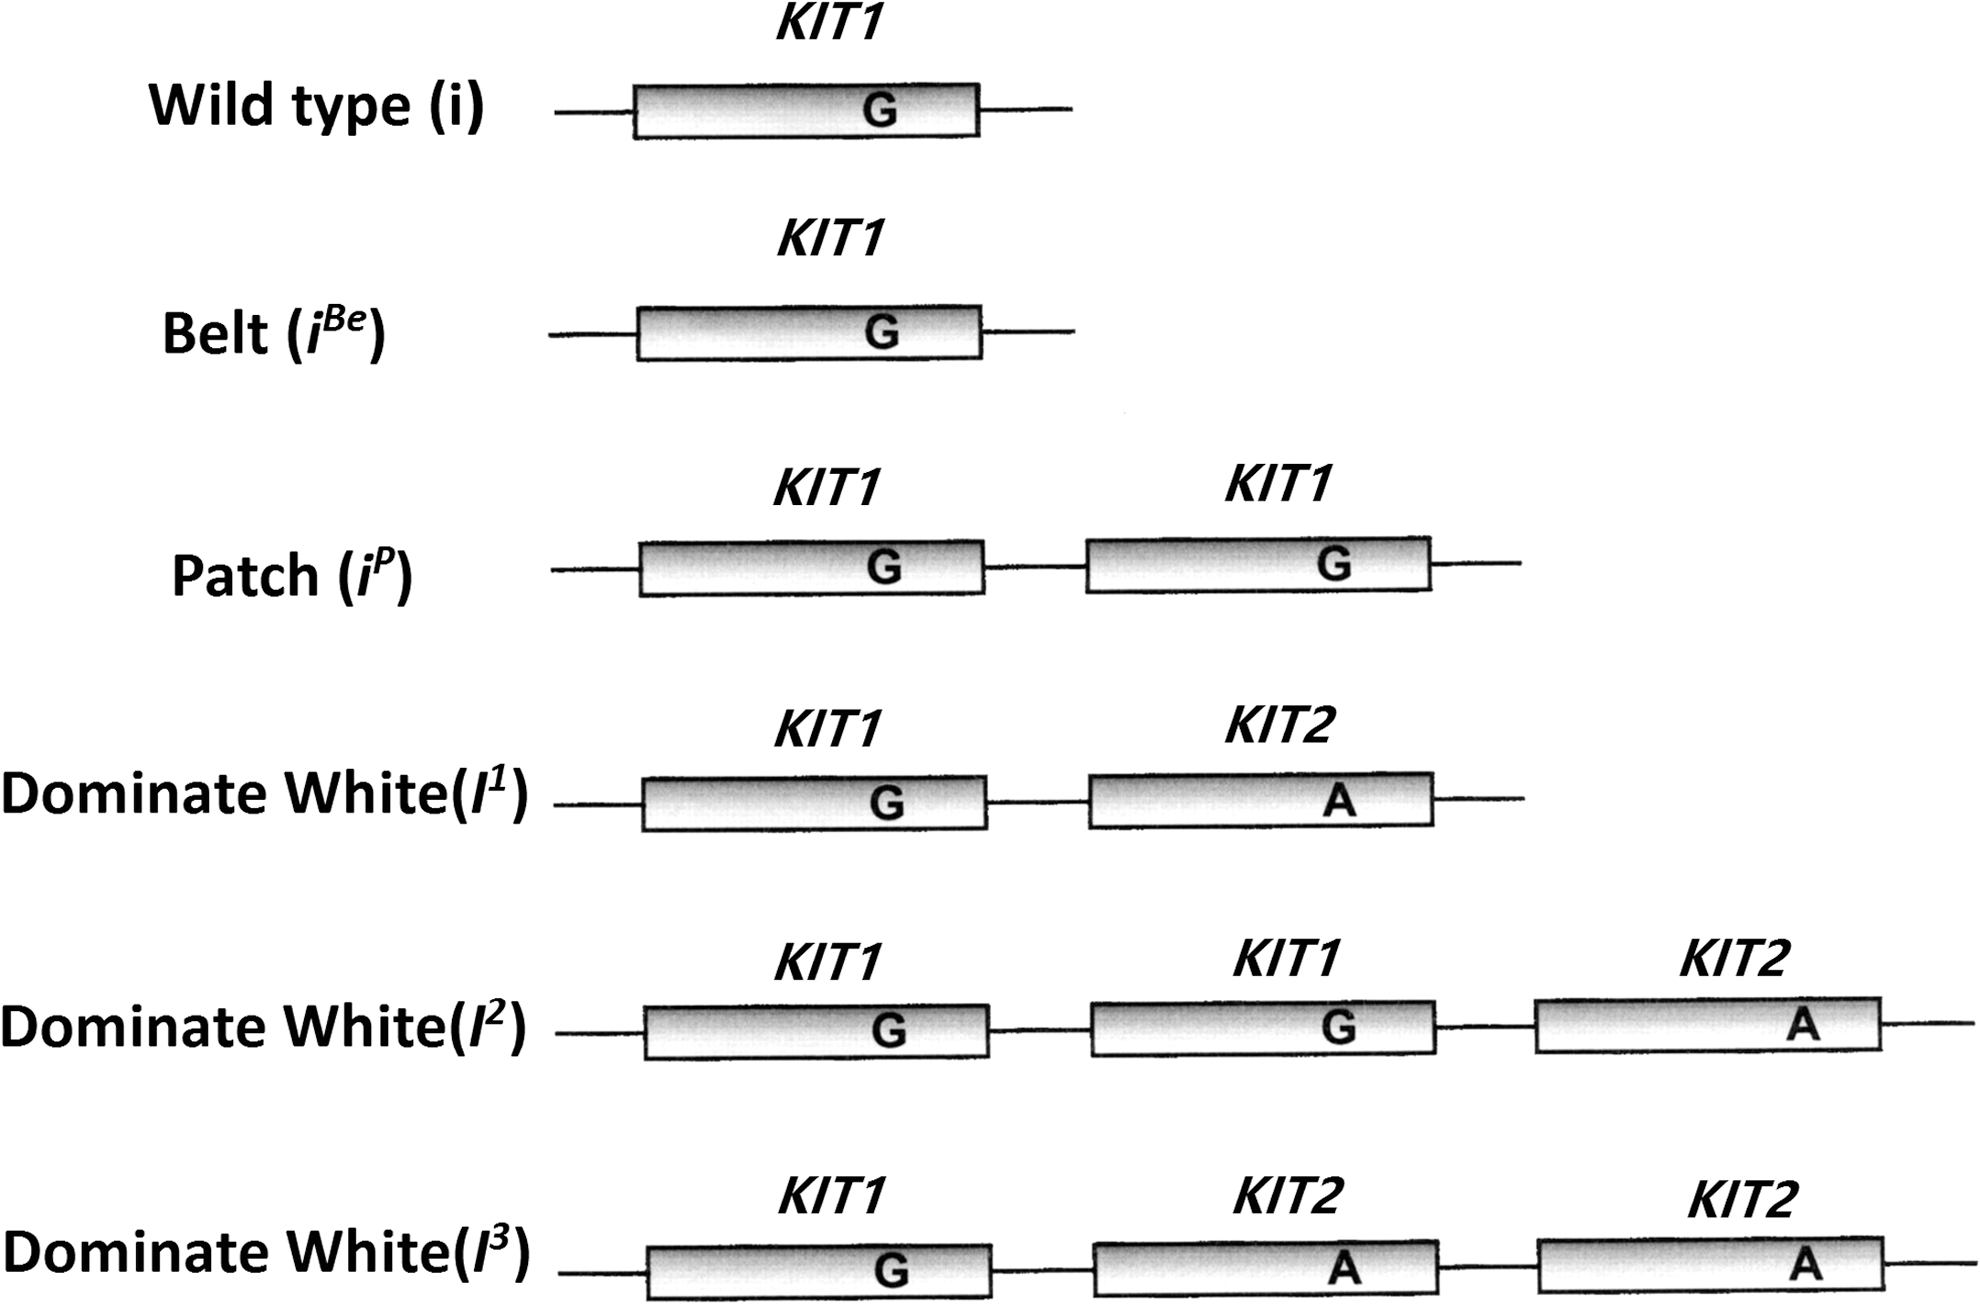
Schematic description of dominant white/KIT alleles in the pig.
Methods, such as real-time quantitative PCR, invader assay (Giuffra et al., 1999; Pielberg et al., 2002), pyrosequencing (Pielberg et al., 2003), and quantitative oligonucleotide ligation assay (Seo et al., 2007), have been used for the determination of CNVs. Compared with other methods, real-time quantitative PCR can quantify products directly by detecting fluorescent signals, resulting in an easy, accurate, highly automated, and environment-friendly assay (Heid et al., 1996). TaqMan minor groove binder (MGB) probes are better than general probes in terms of specificity and sensitivity. TaqMan MGB probes are new and were first reported in 2000 (Kutyavin et al., 2000). In TaqMan MGB probes, the traditional Tamra at the 3′end of the probe is replaced with MGB as a quencher. TaqMan MGB probes have been widely applied in pathogen detection and single nucleotide polymorphism (SNP) diagnosis recently. Examples of recent uses for TaqMan MGB probes include the detection of equine herpes virus 5 (EHV-5) (Akkutay et al., 2014) and infectious bursal disease virus (IBDV) (Tomas et al., 2012), and differentiation of virulent vaccine strains of avian paramyxovirus type 1 (Fratnik et al., 2010; Zhang et al., 2017). However, as far as we know, there are no reports concerning the use of TaqMan MGB probes for the detection of CNVs and splice mutation ratios of KIT.
The objective of this study was to establish a TaqMan MGB probe real-time quantitative PCR method for detection of CNVs and the splice mutation ratio of KIT to determine the KIT genotype. We developed a method for the detection of the KIT genotype in pigs that is simple and rapid, with high specificity and stability. This method can be extensively utilized in general laboratories.
Materials and Methods
Animals and DNA samples
Samples were collected from pigs at the Jiangquan Swine Breeding Corporation in Shangdong province. A total of 50 pigs with two different coat color phenotypes from three breeds were sampled: 6 Large White pigs, 6 reddish-brown Duroc pigs, and 38 Jiangquan White pigs developed by crossing Duroc pigs with Large White pigs. Ear tissue samples were obtained and stored in ethanol at −20°C for DNA extraction. All animal experiments were approved by the National and Institutional Animal Care and Use Ethics Committee. All efforts were made to minimize suffering. Small pieces of ear tissues were shred in a centrifuge tube with surgical scissors to obtain a cell suspension. Genomic DNA was extracted by using the TIANamp Genomic DNA Kit (Tiangen Biotech, Beijing) according to the manufacturer's protocol. After concentrations were determined using ultraviolet spectrophotometry (Eppendorf, Germany), the DNA samples were stored at −20°C.
TaqMan MGB probes and primers design
KIT gene sequences were downloaded from the Ensembl (ENSSSCG00000008842) database and compared with the KIT mRNA (NM_001044525.1) sequence accessed in GenBank to distinguish the 21 exons. The TaqMan MGB probes and primers were designed using Primer Express 2.0 (Applied Biosystems) according to the sequence of exon 2 of KIT. The probes and primers were named KITPro, KITF, and KITR, respectively. A TaqMan MGB probe was designed to amplify the DNA sequence near the mutation site and detect mutations. Primers designed by Marklund et al. (1998) were used to amplify the 175 bp segment of exon 17 and intron 17 of the KIT gene containing the mutated sites (KIT17). According to the principle of SNP site mutation detection, two different TaqMan MGB probes (only different at the mutation sites) and a pair of common amplification primers were designed for the target mutation site. By detecting fluorescence of the two probes, the ratio of target site mutations was determined. The single-copy gene, estrogen receptor (ESR), was selected as an endogenous reference gene (Giuffra et al., 1999; Pielberg et al., 2002). Detailed information about the primer sets and probes are listed in Table 1. All probes and primers were synthesized by Shanghai Gene Core BioTechnologies Co., Ltd.
KIT-F, KIT-R, and KIT-Pro are forward primer, reverse primer and TaqMan MGB probe for PCR amplification of the exon 2 in KIT, respectively. KIT1 (G) and KIT2 (A), F and R are probes, forward and reverse primers for amplifying the 175 bp segment (KIT17) containing a splice mutation—a G to A substitution—in the first nucleotide of intron 17 in one KIT copy, respectively. ESR-F, ESR-R and ESR-Pro are forward primer, reverse primer and probe for the single copy control gene (ESR), respectively.
Real-time PCR
The real-time PCR mixture (total volume 20 μL) was set up as follows: 2× TaqMan Genotyping Master Mix 10 μL, Forward primer (10 μM) 1 μL, Reverse primer (10 μM) 1 μL, Probe (10 μM) 0.5 μL, Template DNA 4 μL, and ddH2O 3.5 μL. The amplification reaction program was as follows: initial denaturation at 95°C for 10 min, 40 cycles at 95°C for 15 s, and 60°C for 1 min.
Sensitivity assessment of TaqMan MGB probe
To assess the sensitivity of the MGB probe, a DNA template from a Duroc pig, at a starting concentration of 16 ng/μL and diluted five times in a twofold manner (2−0 to 2−4), was used to establish a standard curve. Reactions were performed in triplicate, and a negative control without template (NTC) was included.
Amplification efficiency assessment
The single-copy gene, ESR, was used as a control for copy number of the varied gene KIT. The gradually diluted DNAs (used for standard curve) were also used to amplify ESR and KIT simultaneously. Reactions were performed in triplicate, and a NTC was included.
Quantitative detection of the KIT gene
KIT and ESR from 50 samples were amplified quantitatively. Standard DNAs and NTCs were included in all amplifications. Each sample was analyzed in triplicate. The copy number of the KIT gene for each sample was equal to 2−ΔΔCt, when the amplification efficiencies of the target and reference were approximately equal. Here ΔΔCt = ΔCtsam – ΔCtcal, where ΔCtsam is equal to the difference in threshold cycles between the target gene and the reference gene in the unknown samples, whereas ΔCtcal is equal to the difference in threshold cycles for the target gene and the reference gene in standard samples (Livak and Schmittgen, 2001). The relative values for copy numbers were a series of real numbers that showed continuous distribution.
Statistical analysis
R was used for statistical analysis and graph making. To make the rational classification easier, the copy numbers of the 50 unknown samples were clustered using hierarchical cluster analysis.
Results
DNA extraction and purification from pig ear tissue
We obtained a 175 bp fragment from porcine genomic DNA using PCR (Fig. 2) (5′-GTATTCACAGAGACTTGGCGGCCAGAAATATCCTCCTTACTCATGGTCGAATCACAAAGATTTGTGATTTTGGTCTAGCCAGAGACATCAAGAATGATTCTAATTACGTGGTCAAAGGAAACrTGAGTACCCACGCTCTCCTGACAGTCCCGTGAAGGATTTTCCTTGCAGGTTT-3′). DNA was extracted using the TIANamp Genomic DNA Kit (Tiangen Biotech) according to the manufacturer's protocol. The fragment was sequenced by Shanghai Bo Ya Technology Company. We found that the locus of r was the location of the G → A mutation (Fig. 3), which is consistent with the Marklund article (Marklund et al., 1998).

Products of target fragment amplification. M, DL2000 Marker.
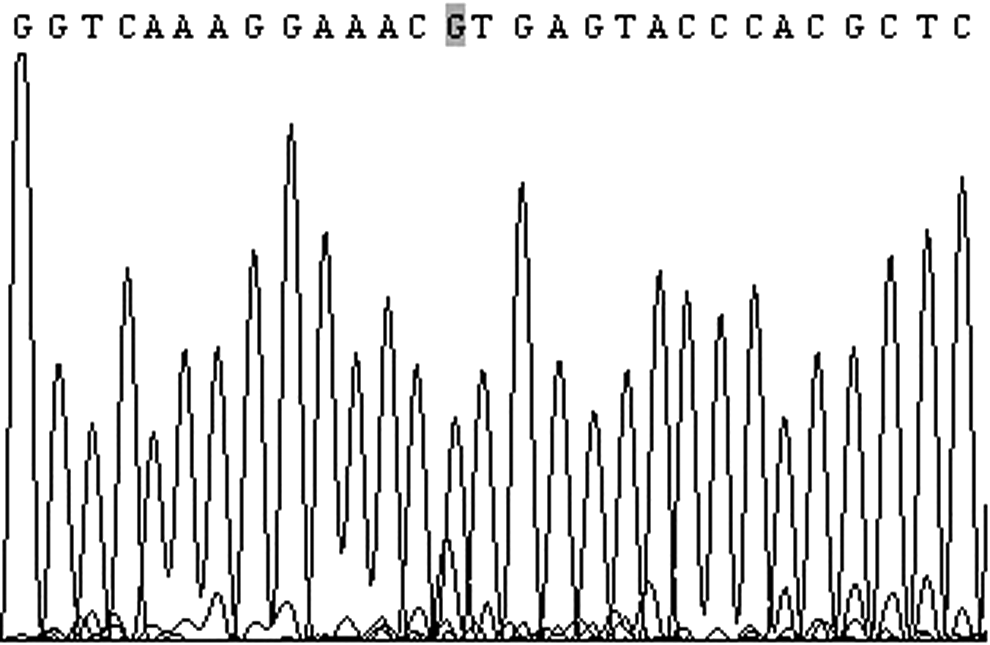
Partial sequencing results of the target sequence (the shaded base indicates the target mutant nucleotide).
Effectiveness analysis of the TaqMan MGB probe
Average Ct values (
C.V., coefficients of variance; SD, standard deviation.
We also found that the method had good linear range for the detection of gene copy numbers (Figs. 4 and 5). Further analysis showed that the correlation coefficient of the standard curve was r2 = 0.999, demonstrating a good linear relationship. The sequencing results of the amplification products matched the desired gene perfectly, demonstrating good specificity of the method.
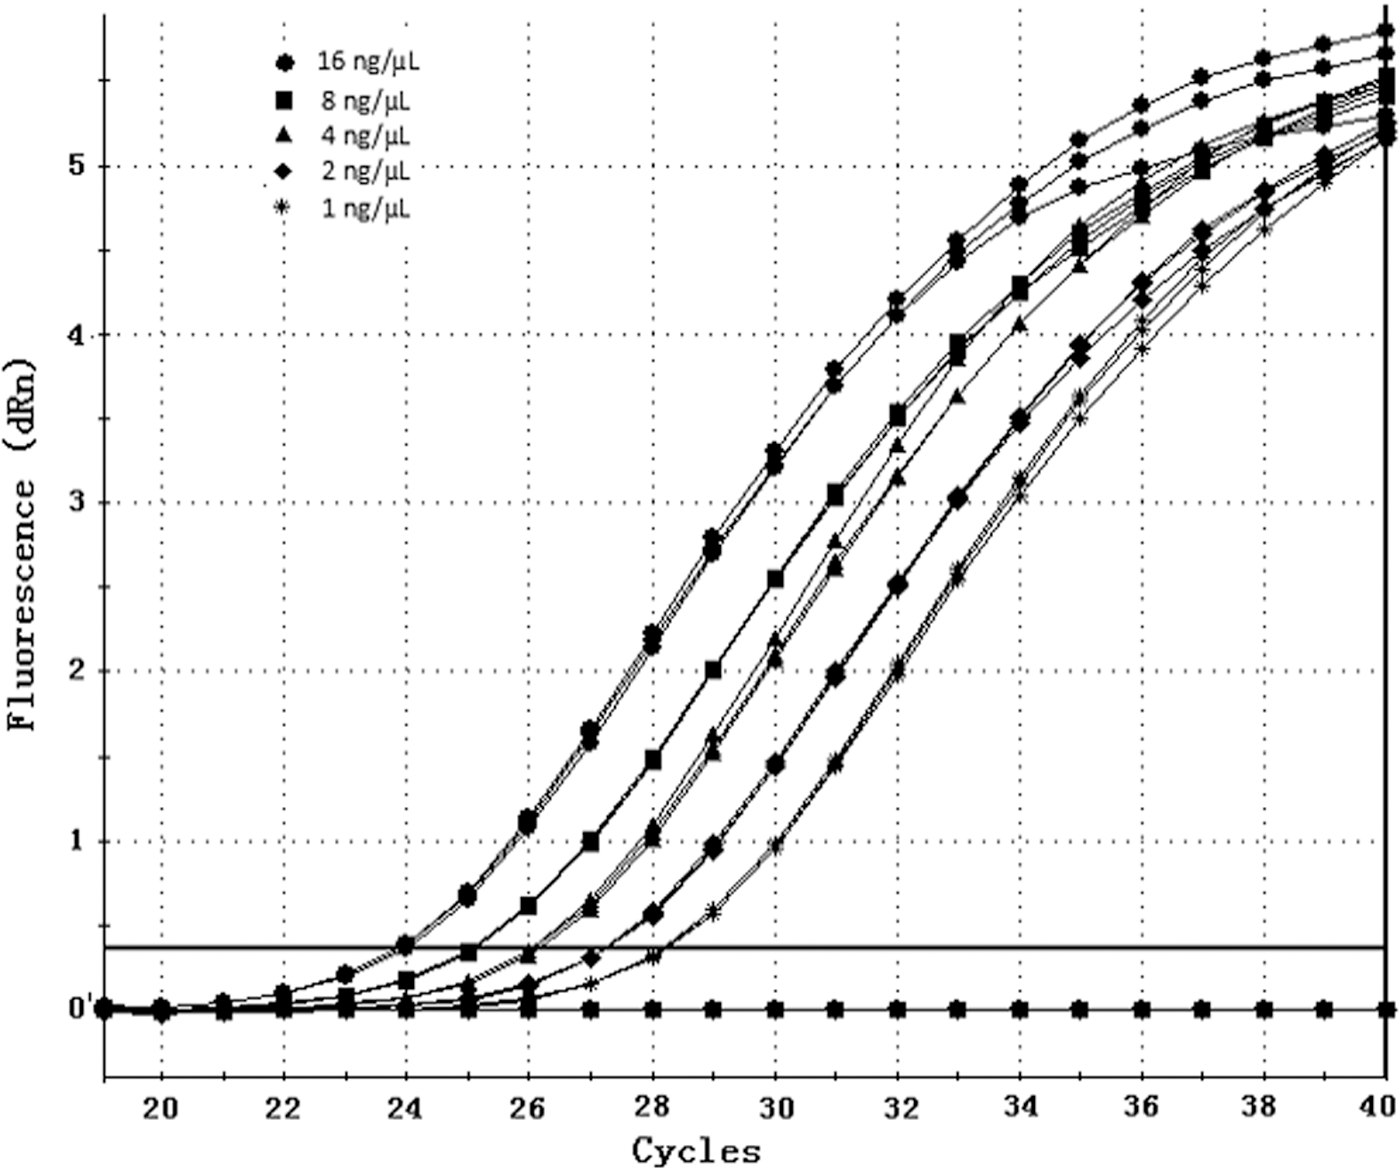
Amplification curves of KIT obtained by twofold serial dilutions of DNA samples.
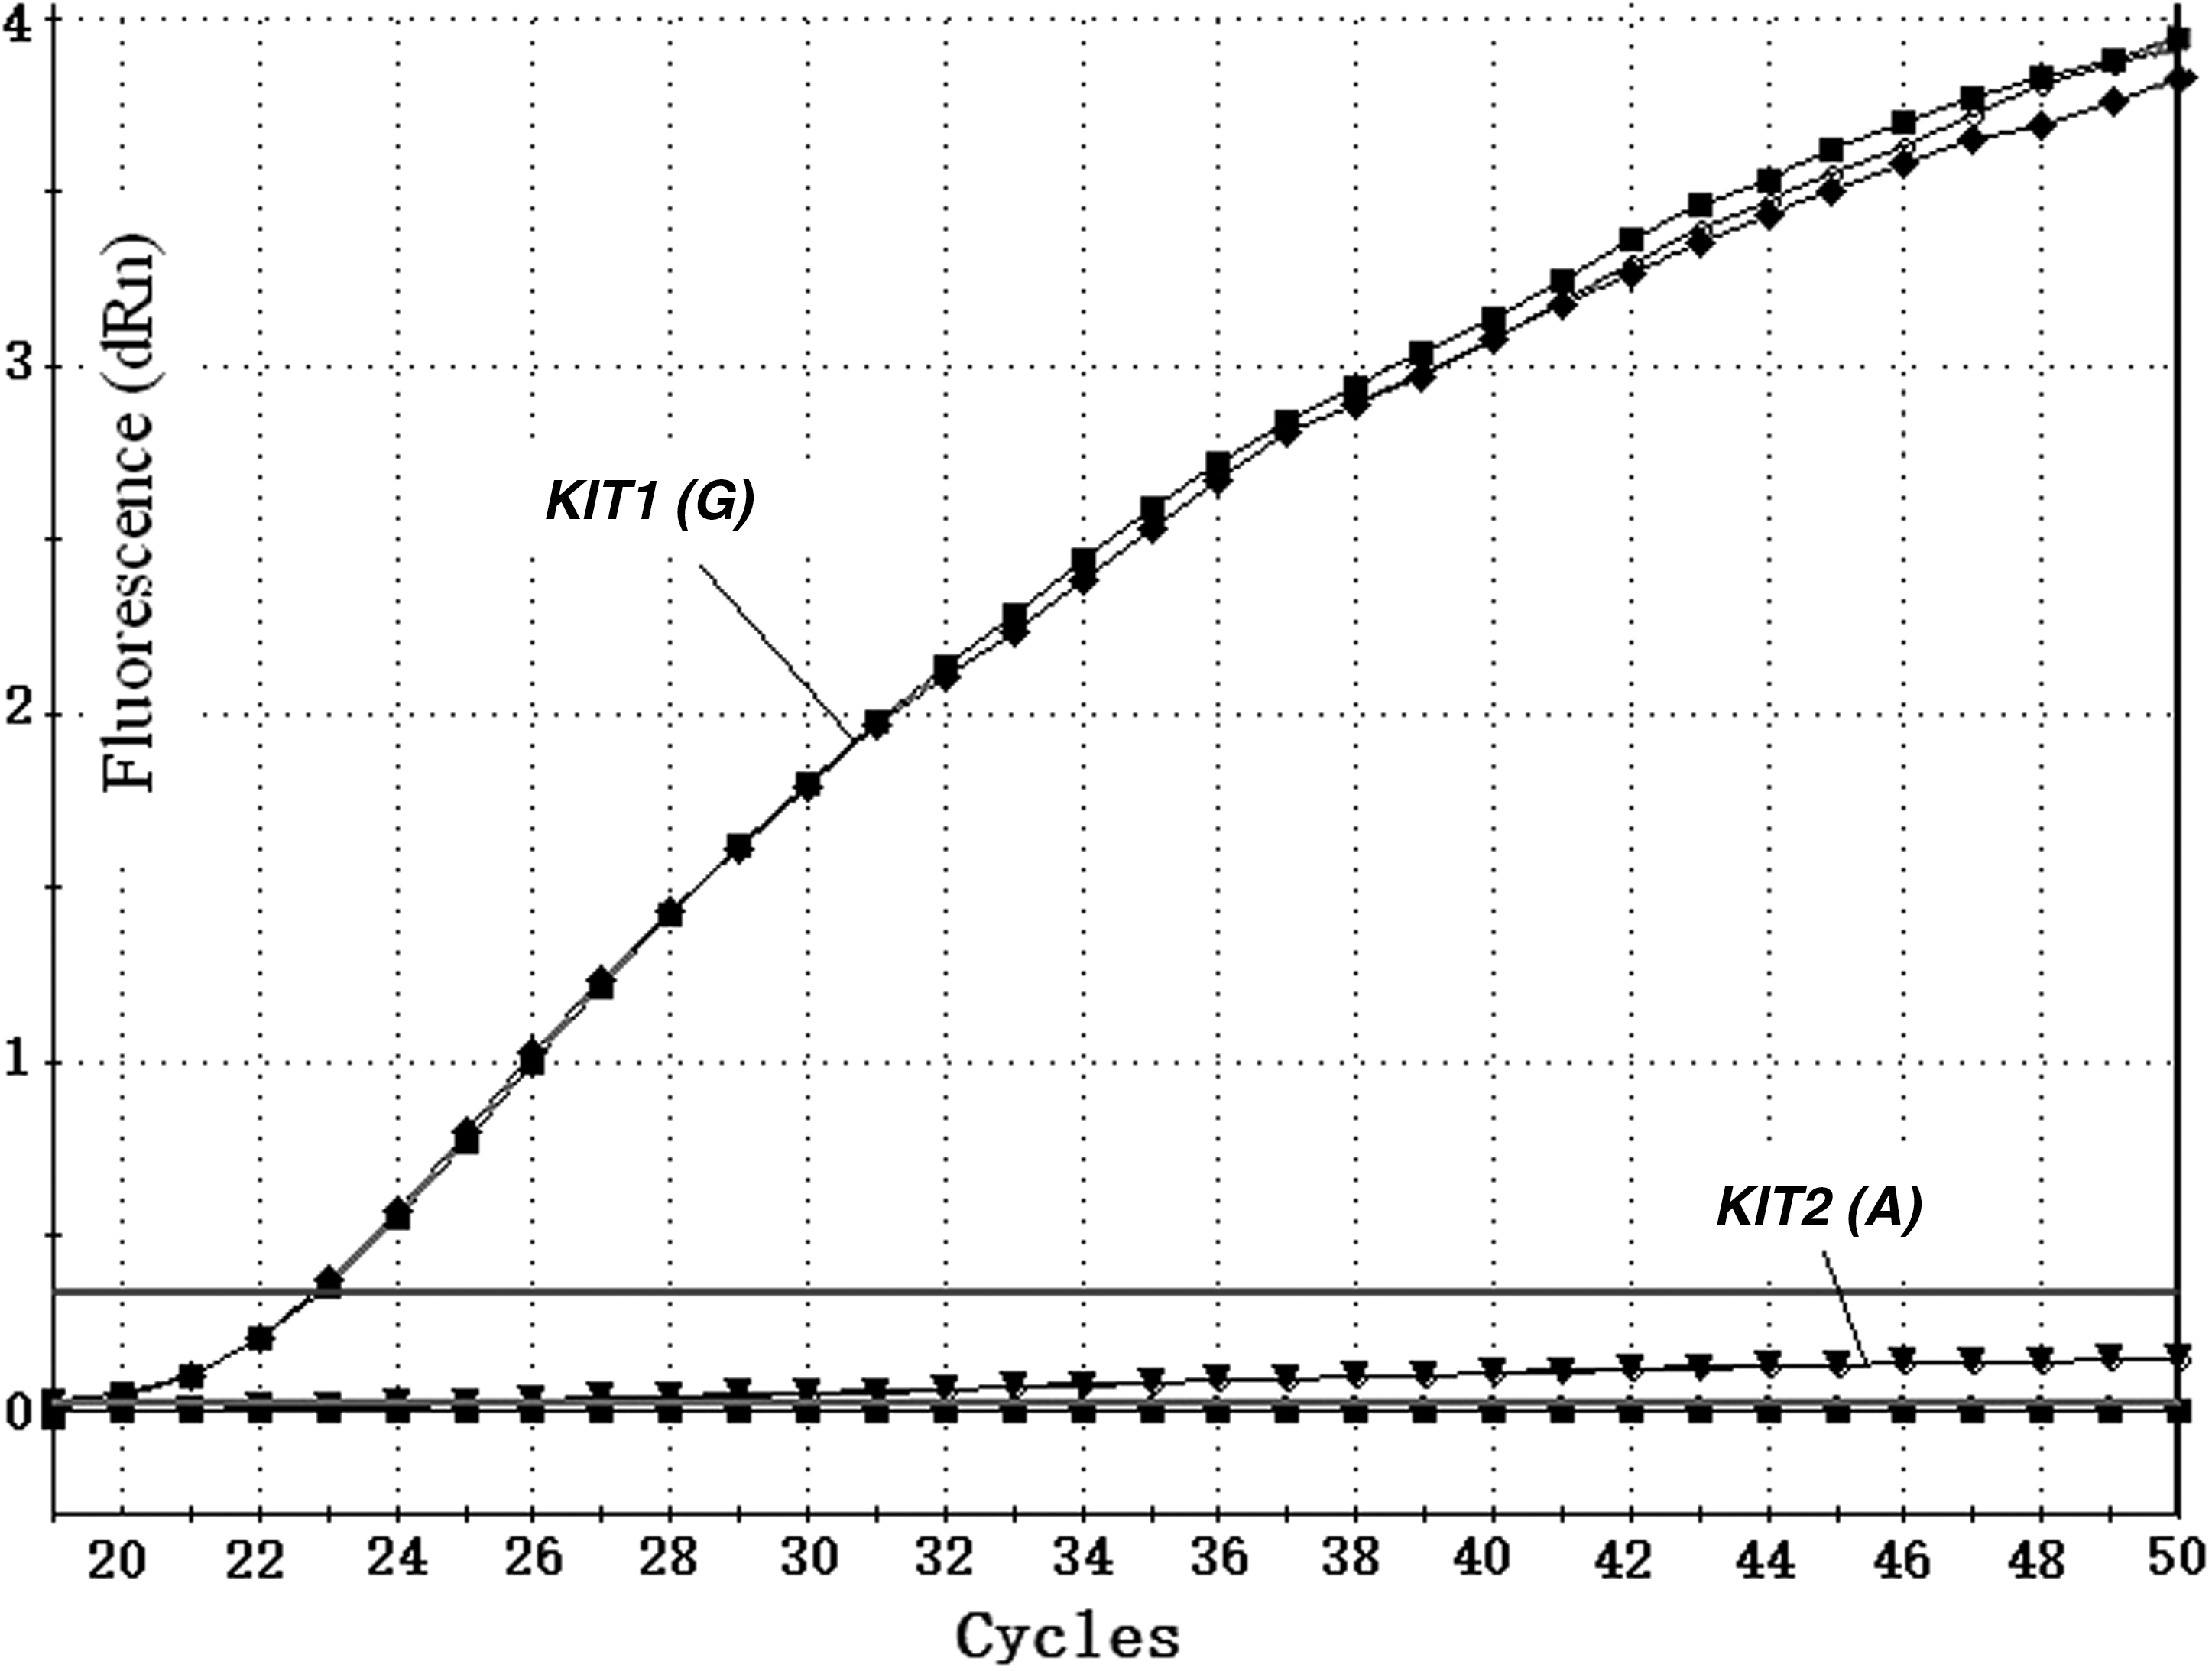
Amplification curves for KIT1 (G) and KIT2 (A) from a Duroc pig. Note: The upper horizontal line is the fluorescence threshold (dRn).
Amplification efficiency assessment
Standard curves are shown for KIT and ESR and KIT1 (G) and KIT2 (A) (Figs. 6 and 7, respectively). The graphs show Ct values versus the relative concentrations of the dilutions. The slope differences between the two standard curves were 0.061 and 0.04 (3.397 vs. 3.336, 3.392 vs. 3.352) for KIT and ESR and KIT1 and KIT2, respectively. Both slope differences were less than 0.1. The amplification efficiency differences were 2.4% and 1.6% (97% vs. 99.4%, 97.2% vs. 98.8%), for KIT and ESR and KIT1 and KIT2, respectively, which were less than 5%. In other words, the amplification efficiencies of the target genes and the reference genes were approximately equal, thus the 2−ΔΔCt method was appropriate for the calculation of relative quantities of unknown samples.

Standard curves for KIT (lower) and ESR (upper).
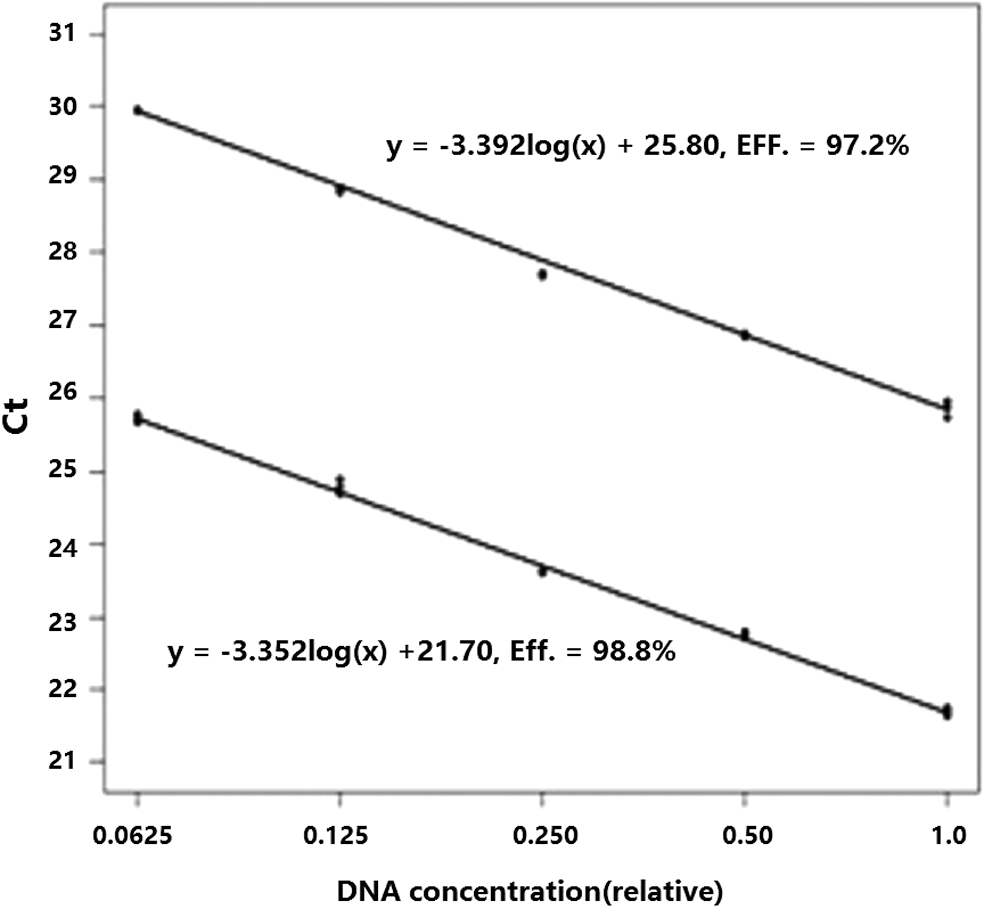
Standard curves for KIT1 (G) (lower) and KIT2 (A) (upper).
Quantitative detection of KIT genes in unknown samples
The KIT copy numbers and the A/(G+A) ratios of the splice mutation in KIT intron 17 from 50 pigs were detected using real-time PCR with TaqMan MGB probes. The Ct values were recorded at the same time. The 2−ΔΔCt method was used to calculate relative quantities of KIT gene and cluster analysis was performed to distinguish the KIT copy numbers for the unknown samples (Fig. 8). When the sample distance was less than 0.4, the 50 samples separated into five groups, named Copy 2, 3, 4, 5, and 6. Figure 9 shows the corresponding 2−ΔΔCt values for each copy number group. The average 2−ΔΔCt value and standard error for each group were 0.95 ± 0.08, 1.47 ± 0.09, 1.92 ± 0.08, 2.45 ± 0.10, and 3.09 ± 0.11, corresponding to Copy 2, 3, 4, 5, and 6, respectively. The averages between groups were significantly different (p < 0.001). The results from CNV detection of the KIT gene in different pig breeds were as follows: 6 Duroc pigs possessed 2 copies; 6 Large White pigs possessed 5 or 6 copies; 38 white Duroc pigs possessed 3 to 6 copies.
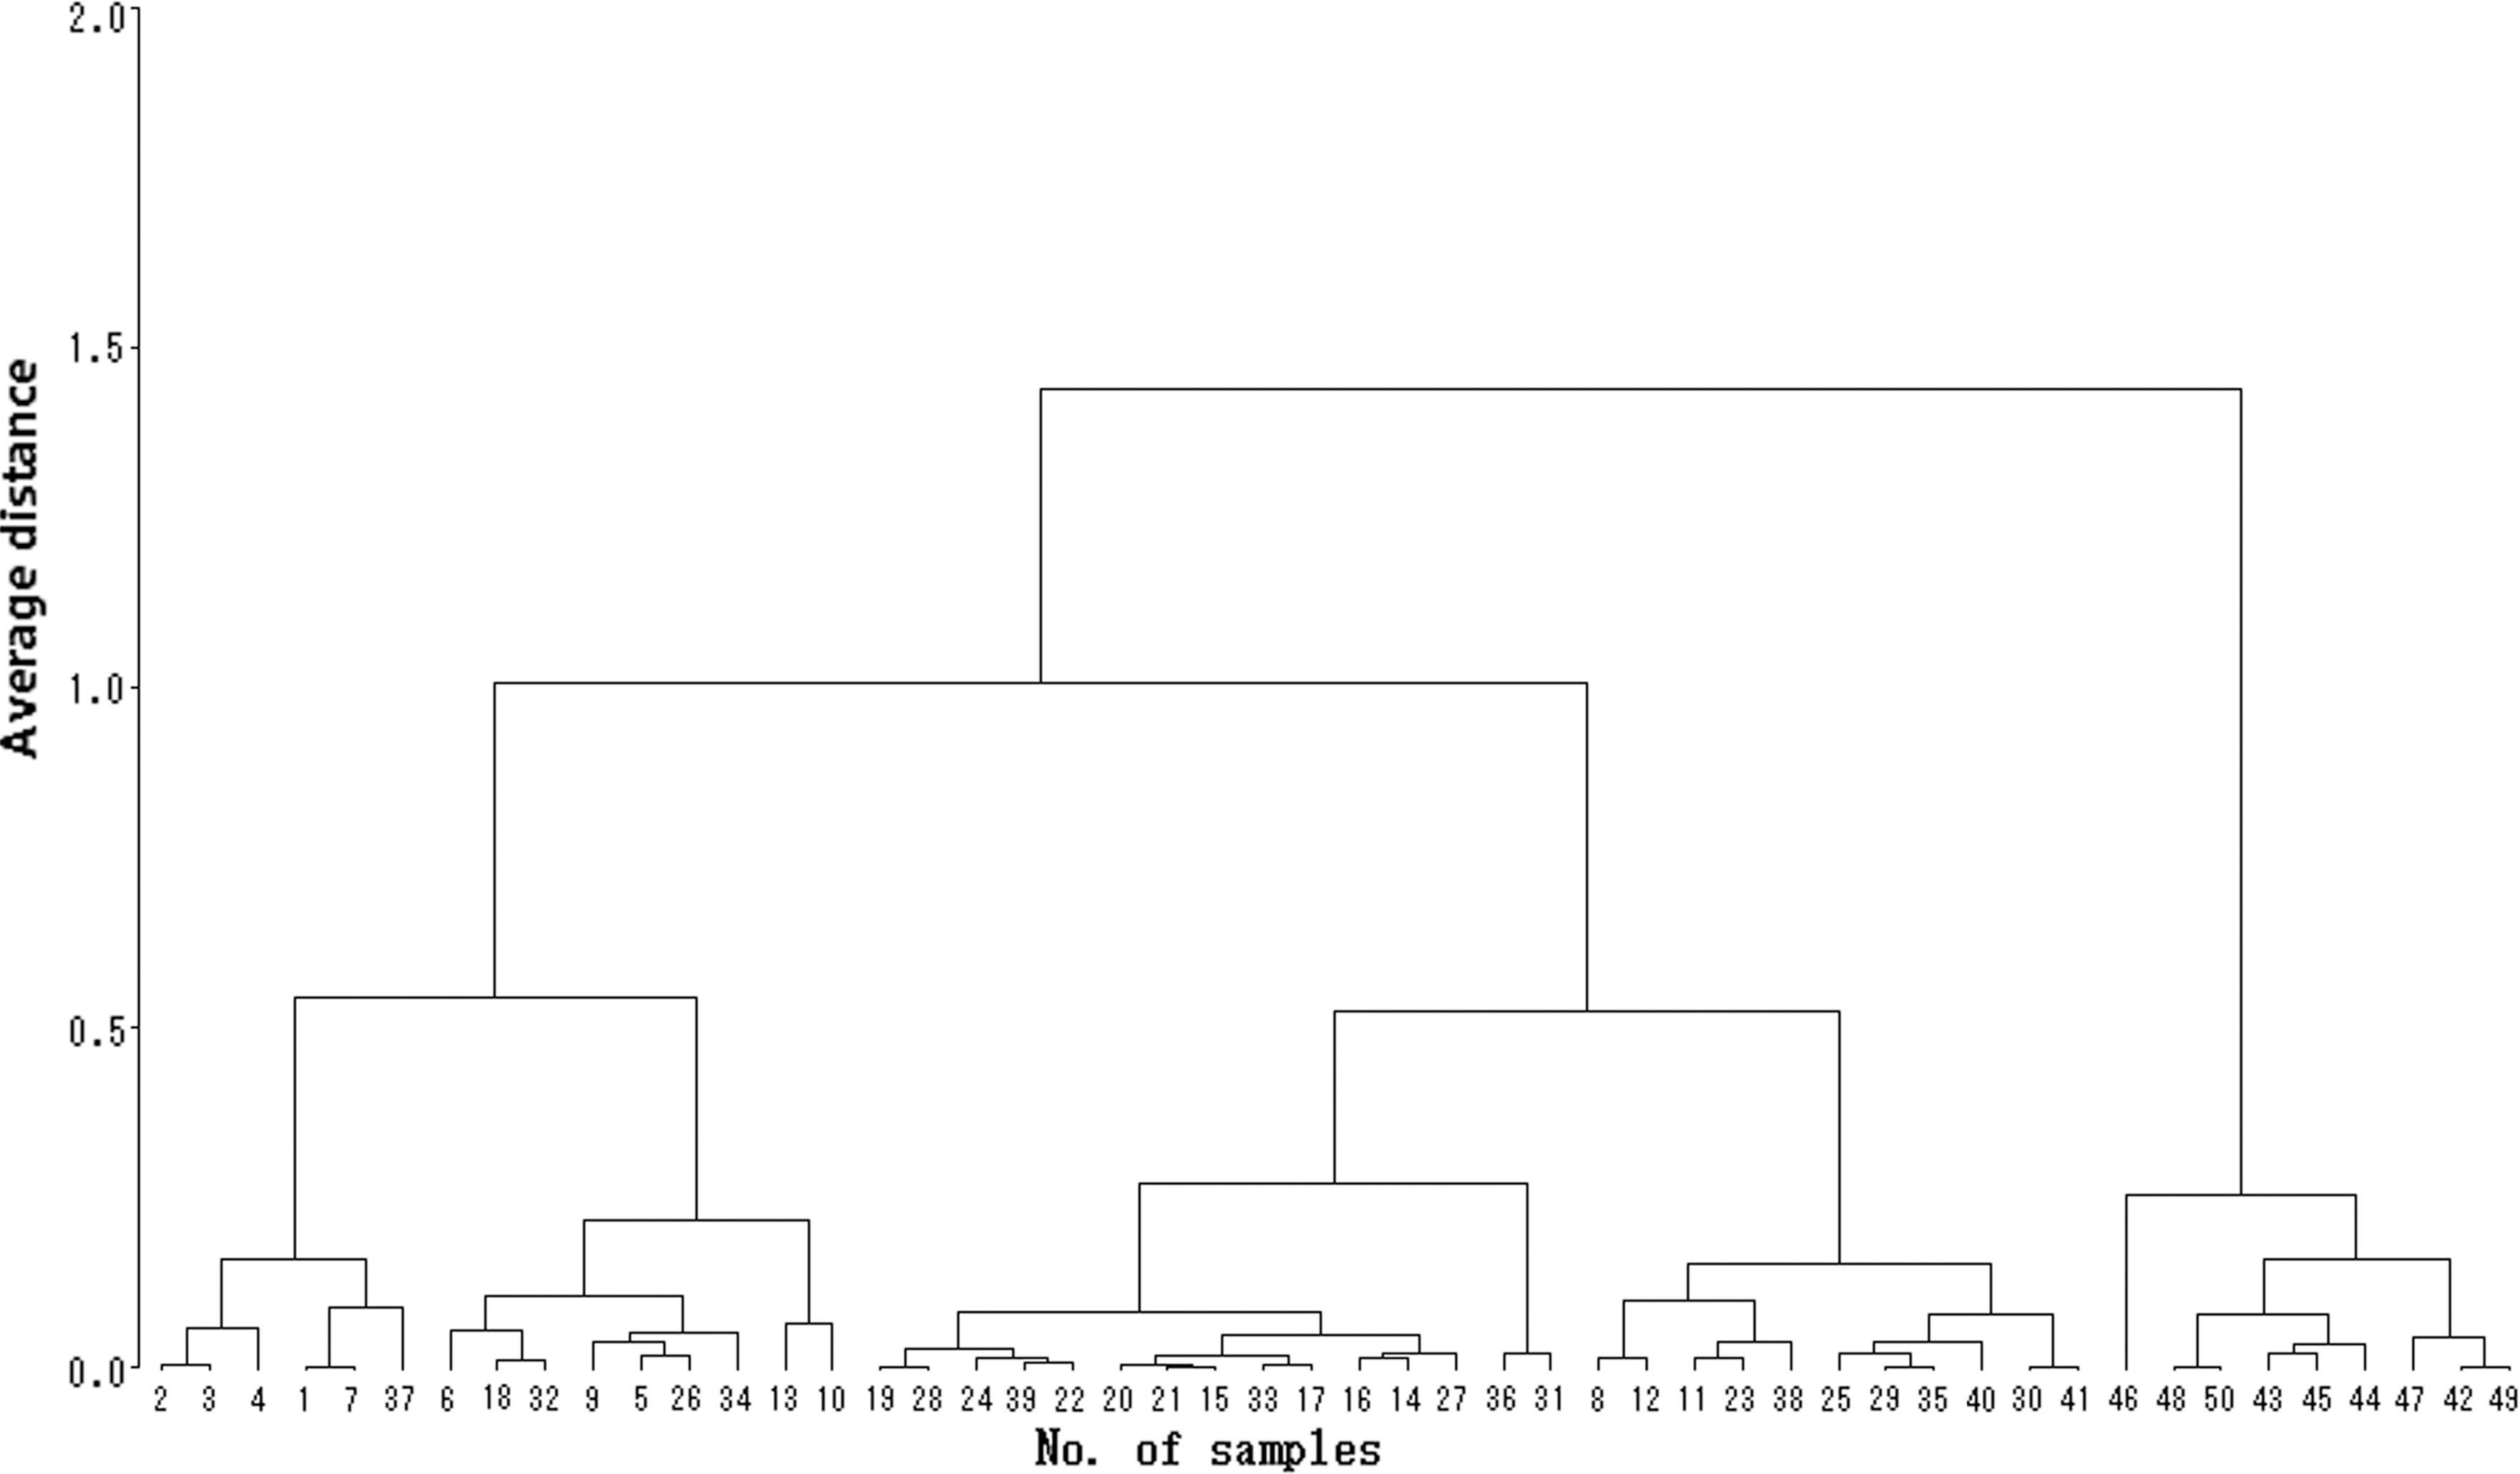
Hierarchical clustering results of the unknown samples using 2−ΔΔCt (n = 50).
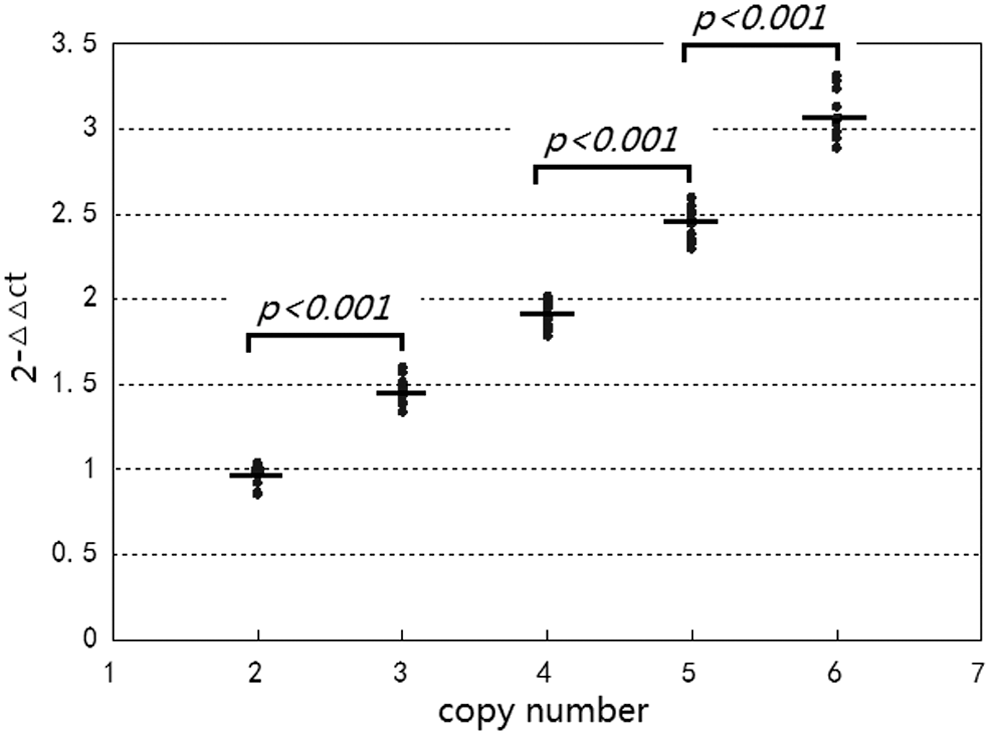
Relative quantification (2−ΔΔCt) of the copy numbers for KIT (n = 50).
Determination of KIT genotype in unknown sample
The quantitative detection of KIT copy number and KIT intron 17 splice mutation ratios were used to determine porcine KIT genotype (Pielberg et al., 2002). The genotypes of the unknown samples (n = 50) were estimated by combining the measured values of the two-part test (Fig. 10). The results showed that the unknown samples corresponded to 12 of the 15 theoretical KIT genotypes listed in Table 3. Two genotypes were sometimes possible when they shared the same number of gene copies or splice ratios. For instance, pigs with the number of copies 4 and with a splice ratio of 1:4, had two genotype possibilities, I1IP or I2i (IBe); pigs with the number of copies 5 and with a splice ratio of 2:5 had two genotype possibilities, I1I2 or IPI3; pigs with the number of copies 4 and with a splice ratio of 2:4 had two genotype possibilities, I1I1 or I3i (IBe). Other genotypes were associated with only one splice mutation ratio and one or more copy number.
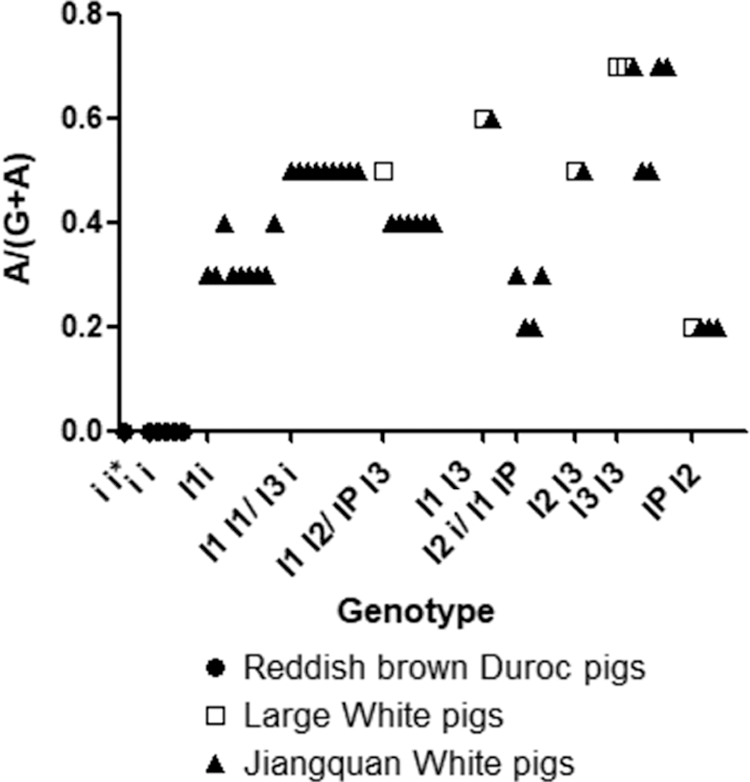
The splice mutation ratio versus genotype of unknown pig samples (n = 50). The splice mutation ratio is shown as the ratio [A/(G+A)] of splice mutation (A) to normal (G) at the first nucleotide of intron 17 in the KIT gene.
Discussion
Determining the number of repeats of the gene copy is an important step in KIT genotyping. Of course, determining splice mutation ratios in intron 17 of KIT (similar to the study of Allele Frequency Determination) is also important in KIT genotyping (Quesada et al., 2004; Mattei et al., 2009; Kim et al., 2010). Methods commonly used for genotype determination include PCR-restriction fragment length polymorphism analysis (Shitara et al., 2017), DNA sequencing methods, Kinetic PCR (Rutledge and Cote, 2003), and TaqMan probe methods (Zhuo et al., 2015; Furutani et al., 2016). Compared with common probes, the TaqMan MGB probes are superior, in terms of specificity, sensitivity, and stability, due to their special design. In this study, excellent amplification curves were obtained with TaqMan MGB probes, indicating good specificity, stability, and high amplification efficiency. Thus, TaqMan MGB probes are a good foundation for quantitatively detecting copy numbers and splice mutation ratios of the KIT gene.
In recent years, minisequencing, pyrosequencing (Pielberg et al., 2002), and oligonucleotides were used to determine the porcine KIT genotype to eliminate nondominant white-colored individuals from the population and form dominant white homozygous lines. Oligonucleotide linkage analysis (Seo et al., 2007) has been used for KIT genotyping, as well. However, these methods are often not suitable for the general laboratory, and are time consuming, inadequate, and/or expensive. The quantitative PCR method is simple, convenient, and accurate, and has now become the main method of quantitative testing.
The values of 2−ΔΔCt obtained from unknown samples showed continuous variations, although we knew that the 2−ΔΔCt value positively correlated with the true relative gene copy number. Therefore, a cluster analysis was performed to classify the samples according to their different distance. The results showed five different copy groups (Table 3), classified based on their significantly different 2−ΔΔCt values and small standard errors. The 2−ΔΔCt value of the group with the highest copy number was relatively high, which indicated that pigs in this group possessed more than 6 copies of the KIT gene. The results obtained from this study are similar to a previous report (Pielberg et al., 2002). However, better results were obtained using MGB probes in real-time quantitative PCR because there is no overlap between groups and the error of the experiment is small.
There are six alleles in the KIT gene (the two alleles, I and IBe, cannot be distinguished because of the mechanism of the i to IBe mutation), and the alleles are free to assemble. In theory, KIT can form 15 genotypes (Table 3). The samples tested in this study corresponded to 12 (or15) KIT genotypes (Fig. 10). The six red-haired Duroc pigs were all recessive homozygous ii genotype; thus, there was no KIT2 (A) in the copy repeats. The number of KIT2 (A) carried by I1, I2, and I3 were different. The white swine belonged to five genotypes of 5 and 6 copies. The white hair Duroc pigs were more complicated and contained many genotypes; however, because of the I allele (I1, I2, I3), they were all the white coat color phenotype. There were I1IP or I2i genotypes with a copy number of 4 and a splice ratio of 1:4. There were individuals with the genotype of I1 I2 or IP I3 with a copy number of 5 and a splice ratio of 2:5. Individuals with the copy number of 4 and a splice ratio of 2:4 had two possible genotypes, the I1 I1 or I3 i genotypes (as shown in Table 3). The copy number and splice mutation ratio for these individuals were the same, and the KIT genotype of these individuals could not be determined accurately with our method, but only by pedigree records.
In this study, a TaqMan MGB probe real-time quantitative PCR method was established to detect the copy number of the KIT gene. This method had the following advantages: easy, secure, highly automated, environment friendly, and inexpensive. Furthermore, the high accuracy and sensitivity make this method applicable to general laboratories. We found that the KIT genotype was in line with the expected value, and thus the method can be accurately used to determine KIT genotype.
Footnotes
Acknowledgments
This work was supported by the Funds of Shandong “Double Tops” Program; the Funds of Shangdong Science and Technology Program (Grant No. 2009GG10009036); the National Natural Science Foundation of China (31702093), and the National Natural Science Foundation of China (31572361).
Disclosure Statement
No competing financial interests exist.