
Abstract
F-box proteins are a core component of Skp1-Cul1-F-box (SCF) ubiquitin/ligase complexes and are involved in a lot of cellular processes in yeasts. However, the current knowledge of the molecular evolution of the F-box gene family in yeasts remains unclear. In this study, 136 F-box genes were identified in 10 yeast species of the Saccharomycetaceae. In addition to the F-box domain, the other six domains were identified in these F-box proteins. The evolutionary history of F-box gene numbers in 10 Saccharomycetaceae yeasts was reconstructed. Whole-genome duplication, interspersed repeats, and gene loss events were inferred. These events contributed to F-box gene number variation in the 10 yeast species. Eighty-seven and 33 positively selected sites were detected in program Selecton and Datamonkey web-server, respectively. Three of them were considered the significant positively selected sites, and 23 of them had changed radically in amino acid properties by using TreeSAAP. We investigated F-box gene number variation and underlying mechanisms, and selection patterns, all of which were beneficial to deeply understand genome evolution and figure out the function of the F-box proteins.
Introduction
The ubiquitin/proteasome system (UPS) plays an essential role in the regulation of eukaryotic cellular processes through timely degradation of a variety of proteins (Hershko and Ciechanover, 2000). Protein ubiquitination is carried out by the sequential activity of three enzymes: E1 ubiquitin-activating enzyme, E2 ubiquitin-conjugating enzyme, and E3 ubiquitin ligase. F-box protein is a core component of an E3 ligase, the SCF (Skp1-Cul1-F-box) complex, which mediates the ubiquitin transfer from E2 to a targeted substrate (Ho et al., 2008). It has been confirmed that F-box proteins are the substrate recognition modules of the SCF ubiquitin/ligase complexes, and determine the substrate specificity of the ubiquitin ligase (Skaar et al., 2009). The F-box proteins are the core component of UPS, related to various cellular processes in yeasts, such as DNA replication, amino acid synthesis, and mating type switching (Kaplun et al., 2006; Carrillo et al., 2011; Kim et al., 2012). The characteristic feature of the F-box proteins is the presence of F-box domain (∼40 amino acids) at N-terminus. The F-box proteins are recruited to the SCF complex by adaptor protein SKP1 that interacts with the F-box domain (Nakayama and Nakayama, 2006). The C-terminus of the F-box proteins is less conserved, which can interact with the targets.
F-box genes are widely distributed in the eukaryotes, but the number of F-box genes varies dramatically even among the closely related species (Bellieny-Rabelo et al., 2013). In Arabidopsis thaliana, Oryza sativa, Populus trichocarpa, and Vitis vinifera, 692, 779, 337 (Xu et al., 2009), and 156 (Yang et al., 2008) F-box genes were reported, respectively. Previous data suggested that the gene number differences among the species influenced gene expression, phenotypic variation, and adaptation by disrupting genes and altering gene dosage (Redon et al., 2009). Nevertheless, most of the former researches only concentrated on the evolutionary pattern of F-box genes in plants and Euarchontoglires, a clade that comprises the orders Primates, Dermoptera, Scandentia, Rodentia, and Lagomorpha (Hua et al., 2011; Schumann et al., 2011; Bellieny-Rabelo et al., 2013; Navarro-Quezada et al., 2013; Wang et al., 2014). Although yeast is often used as a model to study the role of F-box proteins, the knowledge of mechanisms underlying F-box gene number variation in yeasts is still limited. Considering the important role of F-box proteins in yeast and the huge difference in gene number that exists among the species, paying attention to the research on evolution of the F-box gene number in yeasts is meaningful.
The F-box gene family represents one of the largest and fastest evolving gene families in the plant kingdom (Navarro-Quezada et al., 2013), and thus, it may expand or contract in response to evolutionary selection (Ames et al., 2014). In nematodes, plants, and Euarchontoglires, some F-box genes exhibit signals of strong positive selection pressure at a limited number of sites (Thomas, 2006; Schumann et al., 2011; Navarro-Quezada et al., 2013; Wang et al., 2014). Therefore, if we could discover certain positive selected sites in the F-box genes of yeasts, to some extent, it would be beneficial to study the functional sites in F-box proteins. Given that the size of yeast is small and the reproduction speed of it is fast, it is convenient for us to verify the functions of positively selected sites in yeast through various approaches.
In this study, we investigated the different number of F-box genes in 10 of the related yeast species in Saccharomycetaceae, and the mechanism controlling this number. Meanwhile, we studied the adaptive selection for the sites of F-box genes. Our study provides the basis for the functional verification of the F-box genes in Saccharomycetaceae.
Materials and Methods
Genome-wide identification of F-box genes in 10 Saccharomycetaceae species
All the sequence data of 10 yeast species were downloaded from NCBI and Génolevures (Sherman et al., 2009). The 10 species were distributed in 10 different genera in Saccharomycetaceae, which included Ashbya gossypii (strain ATCC10895), Candida glabrata (strain CBS138), Kluyveromyces lactis (strain CLIB210), Lachancea thermotolerans (strain CBS6340), Naumovozyma castellii (strain CBS4309), Saccharomyces cerevisiae (strain S288c), Torulaspora delbrueckii (strain CBS1146), Tetrapisispora phaffii (strain CBS4417), Vanderwaltozyma polyspora (strain DSM70294), and Zygosaccharomyces rouxii (strain CBS732). All the protein sequences from the 10 strains were analyzed to identify the domain structures by the InterProScan software, a tool that combines various protein signature recognition methods into 1 resource (Jones et al., 2014). The proteins containing F-box domains (PF00646) or F-box-like domains were considered F-box proteins, and the corresponding genes were regarded as F-box genes. F-box-like domains included F-box-like (PF12937) and F-box-like_2 (PF13013), and both were the variants of F-box domains.
Phylogenetic analysis
Multiple sequence alignments of full-length protein sequences were performed by MUSCLE 3.8.31 (Edgar et al., 2004) with default parameter settings. All the poorly aligned regions were removed with trimAl v1.4 (gt = 0.3) (Capella-gutiérrez et al., 2009). The maximum-likelihood (ML) tree was constructed using the FastTree with the JTT model (Price et al., 2010). The local support values were computed by resampling the site likelihoods 1000 times and performing the Shimodaira/Hasegawa test. Based on phylogenetic relationships and domain structures, orthologous groups (also known as orthogroups) were inferred. Afterward, homology relationships of F-box genes from the same orthogroup were verified and manually adjusted through the data acquired from eggNOG 4.0 (Powell et al., 2014).
Evolutionary change of F-box gene number
The reconciled tree based on species tree and gene tree was created manually to assess the amount of gene gains and losses (Nam and Nei, 2005). The reference species tree of the 10 yeast species was modified from Yeast Gene Order Browser 1 (Byrne and Wolfe, 2005). The homology relationships of F-box genes from each orthogroup were considered with the species tree, for the purpose of deducing the evolutionary history in that orthogroup. The information on orthologs (from outgroups Debaryomyces hansenii and Tetrapisispora blattae) was used to adjust the reconciled tree and estimate the number of genes in the most recent common ancestor on the basis of tree topology.
Analysis of selective pressure
For each orthogroup, the amino acid sequences were aligned with MUSCLE 3.8.31, and then manually checked and trimmed with trimAl v1.4 (Capella-gutiérrez et al., 2009). To remove spurious sequences from the input alignment, three specified thresholds (-resoverlap 0.75, -seqoverlap 80, -gt 0.7) were set in trimAl. Thus, in the final alignment results, only those sequences that passed the thresholds were kept, which were used to indicate the alignments of the corresponding coding sequences.
We assessed positive selection in the web-based program Selecton (Stern et al., 2007). The MEC (Mechanistic/Empirical Combination) model, which took into account the differences between amino acid replacement rates implemented in the Selecton software package, was used to calculate the ω value for each codon. The second-order Akaike information criterion (AICc) was used for comparing the MEC model and the Ma8 model (a null model that only allowed neutral and purifying selection) [26]. The sites (with ω values >1) in the MEC model were considered the positively selected sites. On the Datamonkey web-server (
Results
Identification of F-box genes and domain structures
A total of 136 protein-coding F-box genes were identified in 10 genomes (Supplementary Table S1). There was no intron in these F-box genes, and each F-box protein contained only one F-box domain. The mean number of F-box genes in the 10 genomes was 14 (Supplementary Table S2). The average percentage of F-box genes in yeasts was 0.25%, which was extremely close to that reported in Euarchontoglires (Wang et al., 2014). Especially, the number of F-box genes in K. lactis was 18, and the percentage of F-box genes in the whole genome was 0.33%. Both indicators were the largest in these 10 yeasts.
Apart from the F-box domain, other six domains were identified in these F-box proteins (Fig. 1). These domains were located at the C-terminus, except cNMP_db_dom and TPR domains. The number of domains in different species varied enormously. In each species, the amount of F-box proteins with not-yet-defined (or unknown) C-terminal domains was the most prevalent followed by WD40 and LRR. RCC1 and TPR were small in number but distributed in each species. The remaining domains were presented in small subsets of F-box proteins.
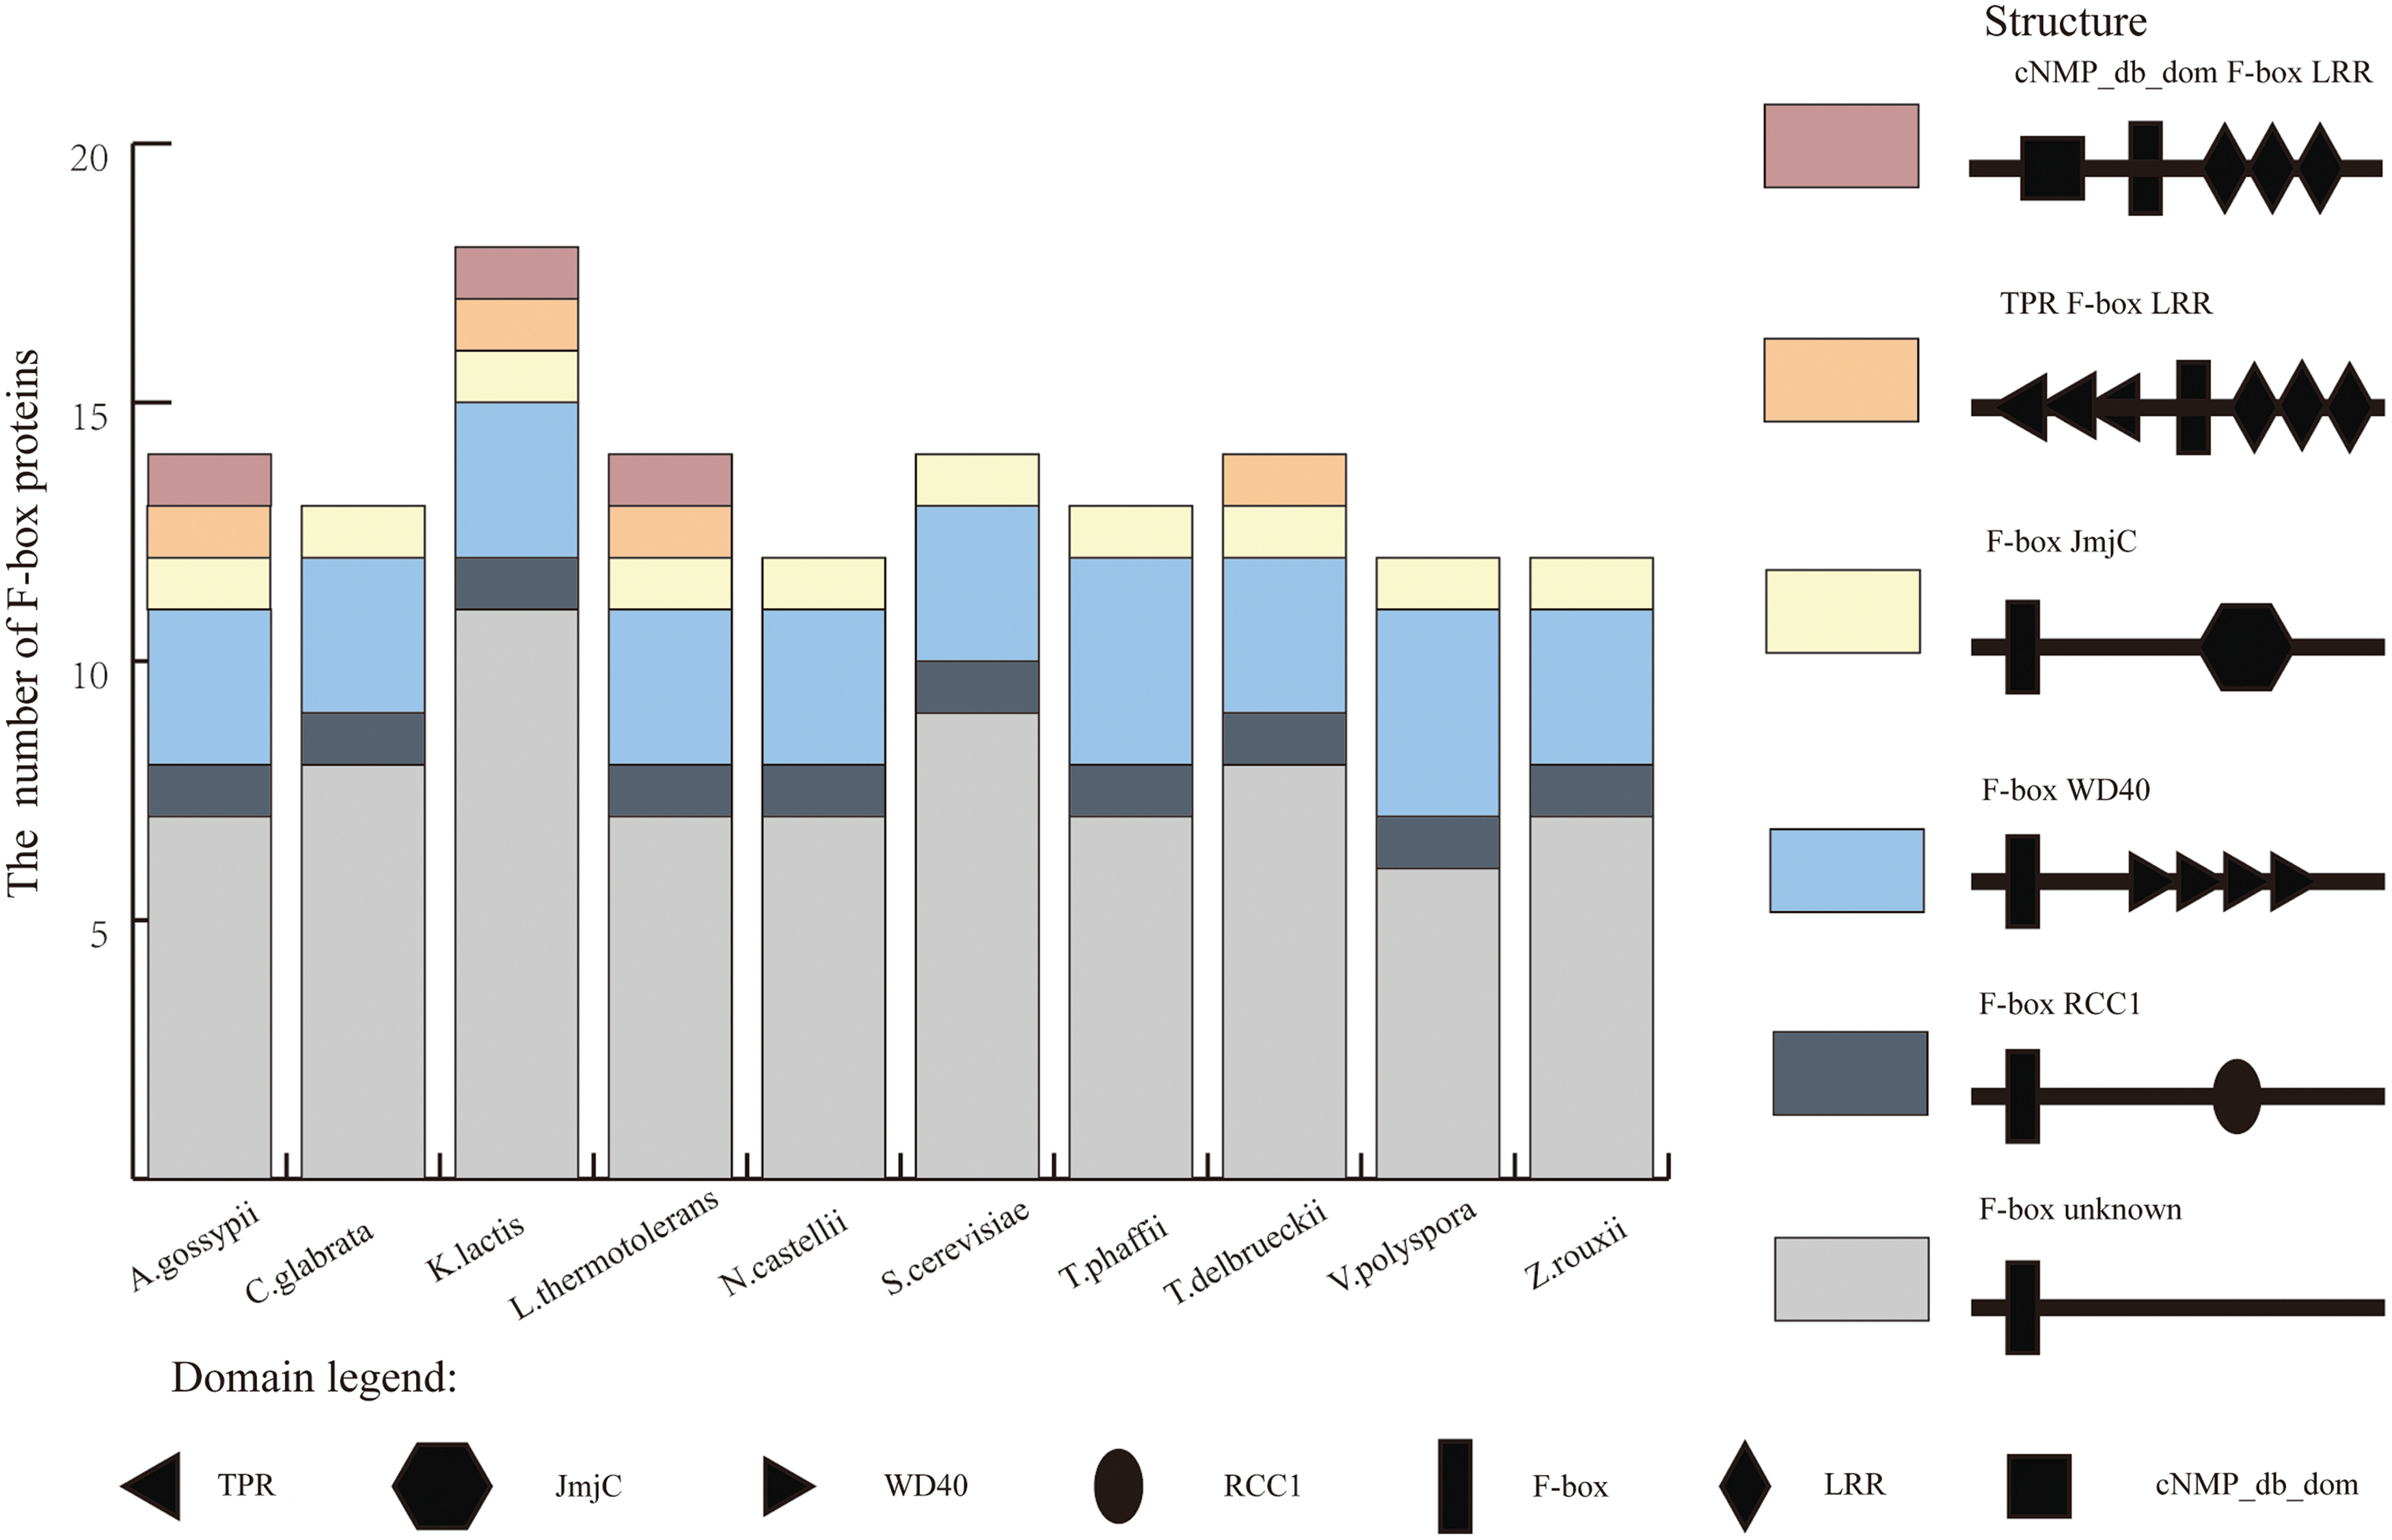
Number and domain structure of F-box proteins from 10 yeast species. Six colors represented different structures of F-box proteins, which consisted of different domains represented with seven shapes. Color images are available online.
Clustering orthogroups
According to phylogenetic relationships and domain architectures, all the F-box genes were clustered into 20 groups (Supplementary Table S3). The majority of F-box proteins in the same orthogroup were located in the same clade with the same interior leaf background color (Supplementary Fig. S1). The figure showed that the origin of F-box genes was earlier than the divergence of the yeasts. The groups of some F-box genes with low local support values (such as KLLA0B09856, KLLA0E23079, KLLA0B07865, and CAGL0G04939) were adjusted by the data about the orthologous groups in Saccharomycetaceae from eggNOG. In the eight groups G2, G3, G4, G7, G9, G12, G15, and G18, each species had one F-box gene. G19 and G20 contained only one F-box gene because no orthologous F-box genes were identified in this study. G16 was the largest group that contained 12 F-box genes, because both V. polyspora and T. phaffii had 2 copies in it. The proteins in each orthogroup had the same domain structure (Supplementary Table S4), and their orthologous relationships were verified by the data acquired from the eggNOG.
Evolutionary change in the number of F-box genes and underlying mechanisms
The change in the number of F-box genes within the evolutionary history of the 10 yeast species showed the events of gene gain and loss that occurred in the 10 yeast genomes. To better understand how the F-box gene numbers have been related to Saccharomycetaceae, the evolutionary history of F-box gene numbers in 10 Saccharomycetaceae yeasts was reconstructed (Fig. 2). Although the number of F-box genes in the yeast genomes stayed around 12–18, as a general trend, the events of lineage-specific gene gain and loss still took place in the process of evolution of Saccharomycetaceae.
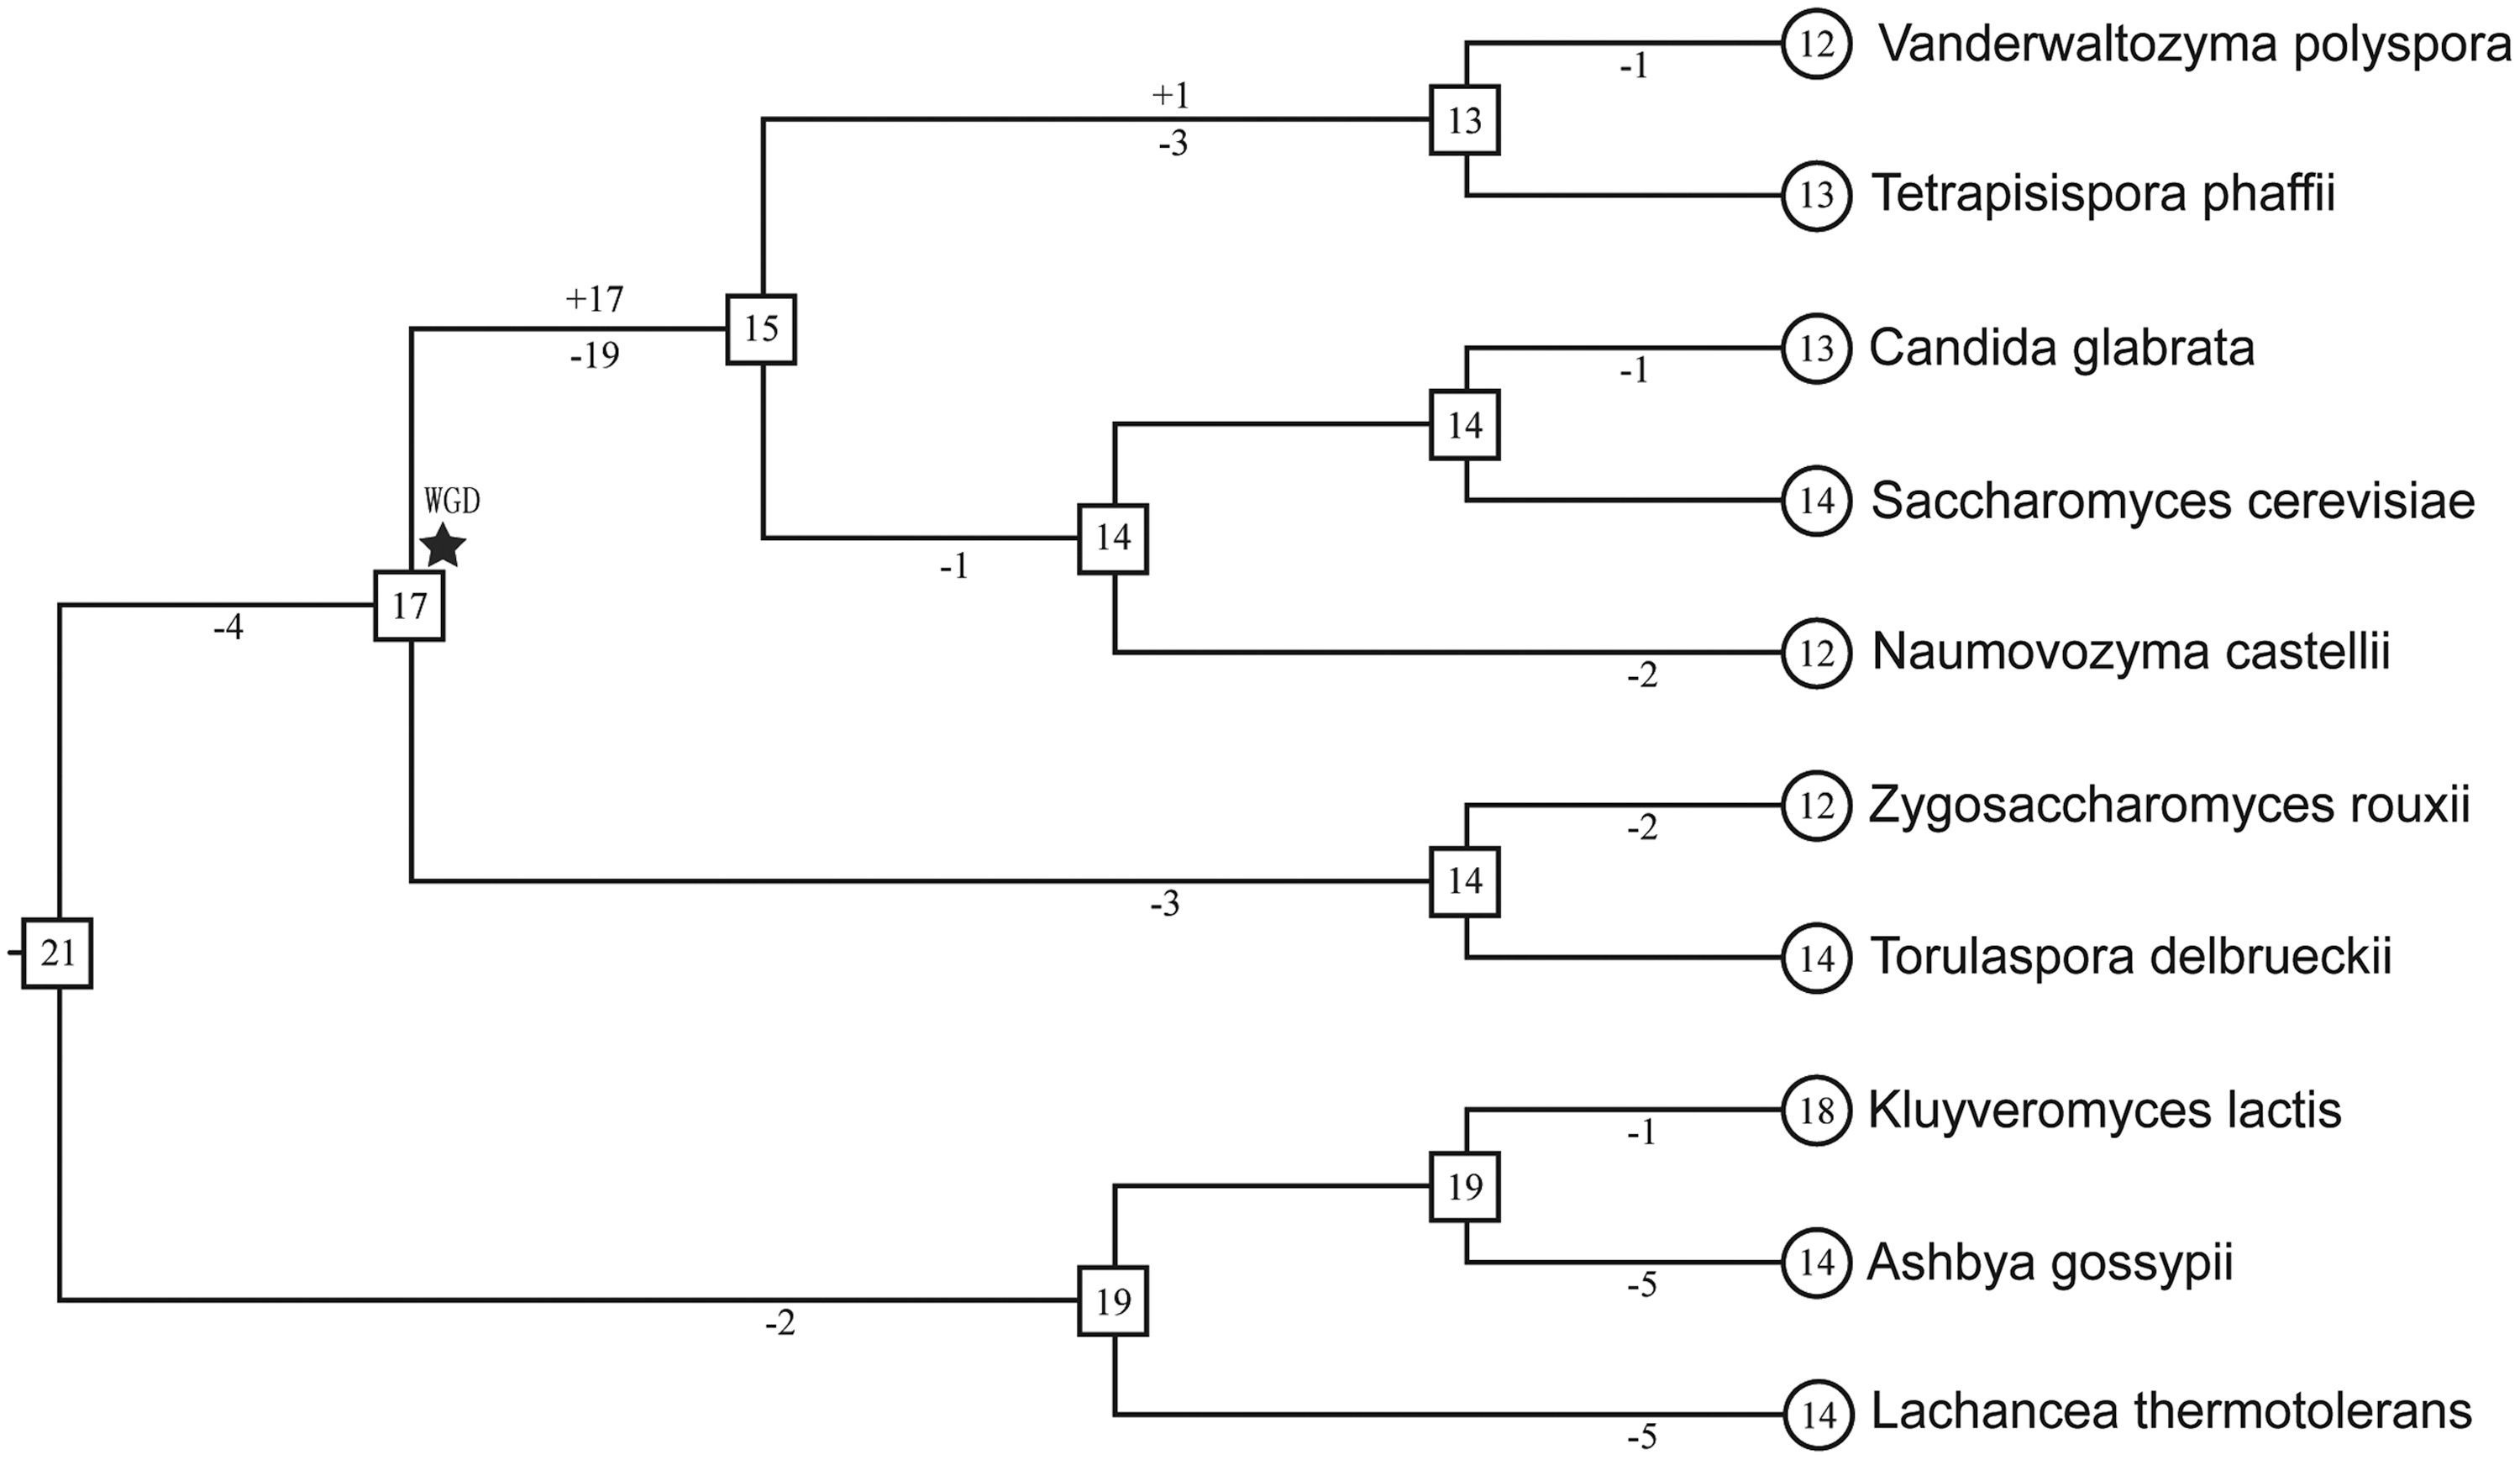
Evolutionary change of the number of F-box genes in the 10 yeasts. The phylogenetic tree of the 10 yeast species was modified from Yeast Gene Order Browser. 1 The numbers in circles and rectangles represent the numbers of genes in extant and ancestral species, respectively. Branches are not drawn according to their length scale. For each branch, the numbers with plus and minus signs indicate the numbers of gene gains and losses, respectively.
In Figure 2, the star indicated the whole-genome duplication (WGD) event. However, this event did not make a contribution to the growth of the copies of F-box genes because one copy of F-box genes was lost after the WGD events. The numbers with minus signs were significantly more than the numbers with plus signs, which indicated that F-box genes had experienced loss events more frequently than gain events.
In addition to the WGD event, two pairs of paralogous genes were found in V. polyspora (Kpol_1011p6 and Kpol_1058p31) and T. phaffii (TPHA0D00580 and TPHA0P00330), respectively. The two pairs of paralogous genes did not result from tandem duplication, because they were not located in the same chromosome. No long homologous regions (>90% identity and >1 kb in length) were identified between the regions that the paralogous genes were located. So paralogous genes did not result from segmental duplications. No signatures of retrosequences were found such as stretches of poly (A) at the 3′ end or short direct repeats at both ends, so they did not result from retrosequences. Thus, we thought they were resulted from interspersed repeats. The situation of tandem duplication, segmental duplication, or retrotransposition did not play roles in the extension of the F-box gene family in this study.
In fact, the gene loss events did not mean the genes really completely disappeared in the genomes. According to the data obtained from eggNOG, the orthologous genes of 27 F-box genes were not predicted as F-box genes in this study, and we called them non-F-box genes (Fig. 3 and Supplementary Table S5). Compared with those F-box genes that were predicted as F-box genes in the research, the non-F-box genes had these characteristics as follows: (1) too many mutations existed in the F-box domain so that the domain could not be identified correctly; (2) the structure was no longer complete because of the insertion and deletion in F-box domain; and (3) the F-box domain was completely lost.
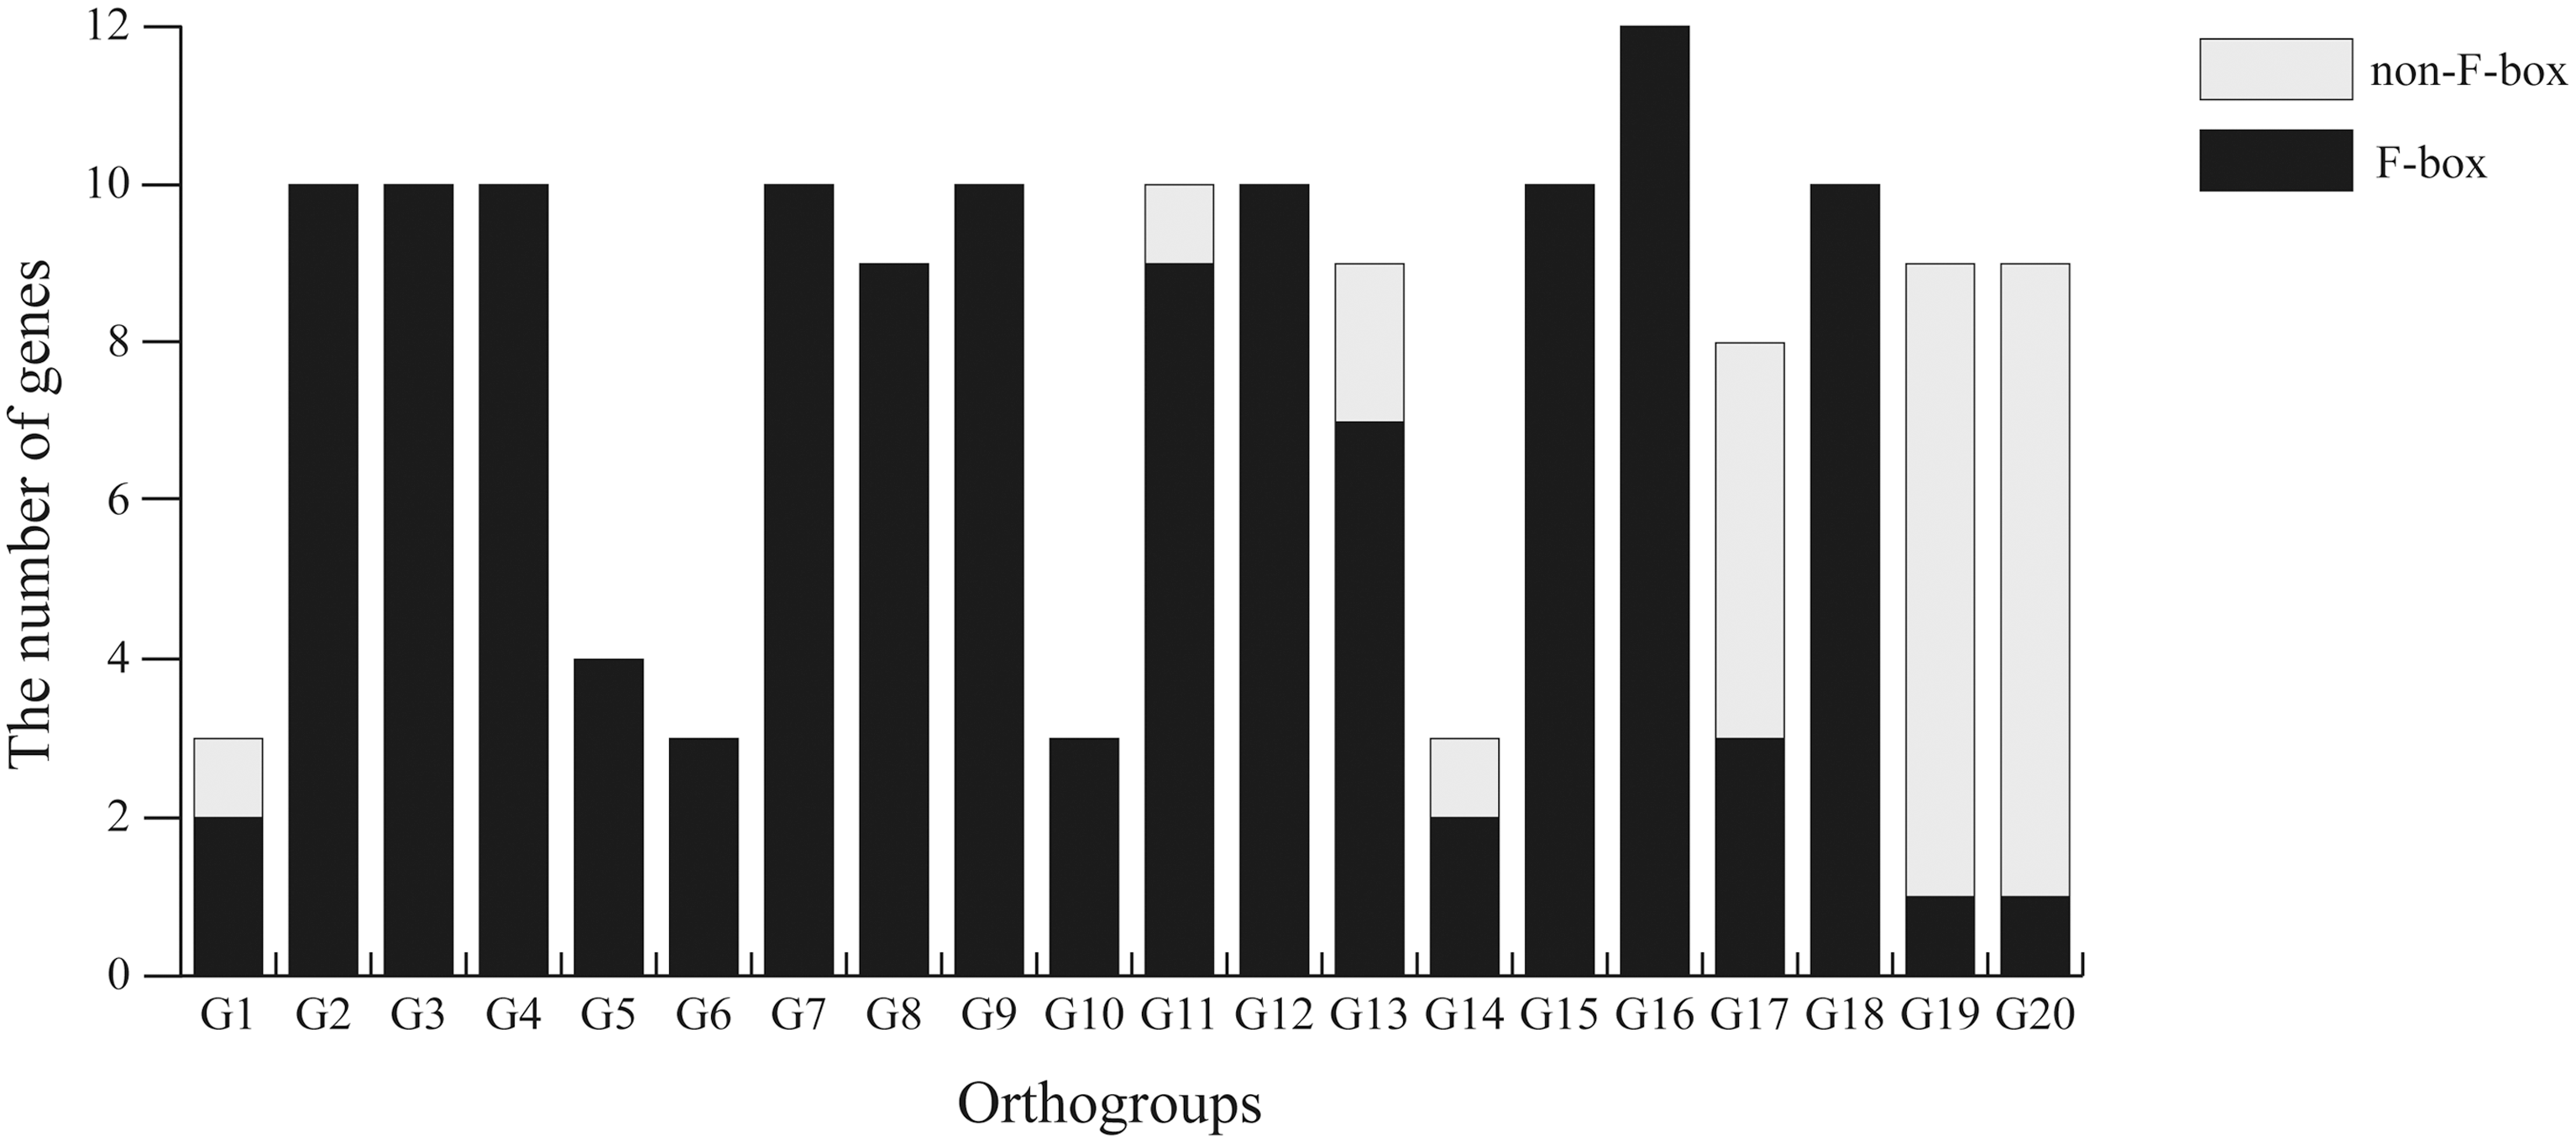
The number of F-box and non-F-box genes in each orthogroup.
Inference of positive selection in F-box proteins
Ten orthogroups, which passed the thresholds in trimAl, were selected for the subsequent analysis, and they are orthogroup 2, 4, 7, 8, 9, 11, 12, 13, 15, and 18.
Through MEC model implemented in program Selecton, the evaluation of positive selection showed that five orthogroups had experienced adaptive evolution, which was demonstrated by the presence of a few positively selected residues in them (Table 1). The MEC model had the lower AICc, and it meant that the MEC model was fitter than the null model M8a. Eighty-seven positively selected sites were detected and four of them (written in bold letters or in italic type in Table 1) were located in the identified functional domains. The ω values and 95% confidence intervals are presented in Supplementary Table S6. All of the positively selected sites were not statistically significant (the lower bound of the 95% confidence interval was not >1).
Detection of Positive Selection at Individual Sites by Bayesian Method with MEC Model Using Selecton
The genes in Saccharomyces cerevisiae were regarded as reference sequences. The MEC model had the lower AICc, and it meant MEC model was fitter than the null model M8a. The hyphen represents the gaps in the corresponding position of reference gene. The residues written in bold letters are located in functional domains except F-box domain, and the residues written in italic type are located in F-box domain.
AICc, Akaike information criterion; MEC, Mechanistic/Empirical Combination.
Meanwhile, some positively selected sites are listed in Table 2 by using SLAC, FEL, and MEME methods on the Datamonkey web-server. The p-values, which were corrected for multiple testing of the positively selected sites, are presented in Supplementary Table S7. Thirty-three sites were detected and distributed in each group. Only two sites were identified by the SLAC method, and the majority of positively selected sites were identified by the FEL method. Three sites (written in bold letters in Table 2) were also situated in the verified functional domains. Three sites underlined were identified by more than one ML method, so they were more credible to undergo adaptive selection and were considered the significant positively selected sites. Only a few of the positively selected sites had radically changed the amino acid properties by using TreeSAAP. These sites were distributed among five groups (Supplementary Table S8). The number of these sites in G12 was the largest and shown in Figure 4, which demonstrated that the amino acids at these sites underwent great changes. Especially, codons 134, 383, and 411 could cause alteration of three or more amino acid properties.

The positively selected sites detected by TreeSAAP in G12 and respective amino acid properties in each yeast species. The sites with three or more amino acid properties under selection in TreeSAAP are marked with an asterisk. The background colors represent amino acid properties: polar positive (yellow), polar negative (orange), polar neutral (green), nonpolar neutral (purple), nonpolar aliphatic (blue), and nonpolar aromatic (pink). Color images are available online.
Selection Pressure Analysis Using SLAC, FEL, MEME Methods
The genes in Saccharomyces cerevisiae were regarded as reference sequences.
Codons identified by more than one ML method are underlined.
Codons with P values <0.1. The hyphen represents no positive sites identified in this method. The residues written in bold letters are located in functional domains.
FEL, fixed effects likelihood; MEME, mixed effects model of evolution; ML, maximum-likelihood; SLAC, single likelihood ancestor counting.
Discussion
Evaluation of identification methods of F-box genes in yeast genomes
The number of F-box genes in yeast (S. cerevisiae) has been controversial for a long time (Willems et al., 1999; Kipreos and Pagano, 2000; Hwang et al., 2006). Compared with the identification methods of F-box genes in previous studies, we found three factors influencing the identification of F-box genes: (1) there are few conserved regions and very few invariant positions in the F-box domain; (2) the necessary protein databases were not fully developed in the early stages of research on F-box genes; and (3) some methods based on the alignment of conserved sites may ignore the influence of insertions, deletions, and mutations in the domain. A protein that has an F-box domain, and whether it acts as an F-box protein in the UPS, does not depend on sequence analysis or protein domain identification, but this still needs further experimental verification.
Evolutionary conservation and variation in the number of F-box genes
In these 10 yeast genomes, an average of 14 F-box genes per genome were identified. This is much less than the almost 70 F-box genes in Euarchontoglires (Wang et al., 2014) and the hundreds of known F-box genes found in plants (Yang et al., 2008; Xu et al., 2009; Bellieny-Rabelo et al., 2013; Navarro-Quezada et al., 2013). The percentage of F-box genes in total protein-coding genes in yeasts, however, is quite close to that reported in Euarchontoglires (Wang et al., 2014). Furthermore, the expansion in the numbers of F-box genes was not frequent in Euarchontoglires and yeast; the difference in number of F-box genes between them may be due to the different genome sizes. Nevertheless, many events resulting in gene gain such as segmental duplications, tandem duplications, and WGDs exist in the plant genome (Yang et al., 2008). These events may be the reason that the number of F-box genes in plants was much higher than that in yeasts and Euarchontoglires. A large number of F-box genes can regulate processes from hormone signaling to stress response to adapt to the sessile lifestyle of plants (Bellieny-Rabelo et al., 2013).
The WGD event did not make a contribution to increasing the copies of F-box genes in yeast, because after the WGD event took place in a common ancestor of those yeasts, the common ancestor went through a period of rapid gene loss (Scannell et al., 2006). This mode of gene loss provides strong evidence for speciation by the mechanism of Bateson–Dobzhansky–Muller, and the loss of alternative copies in duplicated genes contributes to reproductive isolation (Lynch and Force, 2000). After the WGD event, the loss of duplicate gene pairs probably leads to a burst of speciation (Scannell et al., 2006).
To understand the relationship between copy number variation and the function of F-box genes, we analyzed F-box genes that have been verified through various approaches. There was a wealth of information about gene functions in S. cerevisiae, so we focused on the F-box proteins in that species. Currently, 13 F-box genes of S. cerevisiae have been studied. Nine of the 13 genes did not show differences in number in the 10 yeast species, including Grr1 in G11, which contained 9 genes and 1 non-F-box gene. These nine genes are mainly related to basic physiological processes such as DNA replication, mitochondrial morphogenesis, and mating type switching (Skaar et al., 2009).
The remaining four F-box genes have been divided into three categories. The first category is the Ela1 gene in G6, which was required for Pol II polyubiquitylation, and degradation in cells when the DNA was damaged (Ribar et al., 2007). This process is necessary to maintain normal life activities. However, we have not found the orthologous genes in seven yeast species, meaning it is possible that some other genes take part in this process or the process has changed in these species. The second category includes the genes Hrt3 in G13 and Cos111 in G17. Homologues of these genes (including F-box genes and non-F-box genes) have not been found in studies on two yeast species. The Hrt3 gene is involved in resistance to methylmercury in S. cerevisiae (Hwang et al., 2006), but the gene such as Hrt3 was lost in A. gossypii. Generally, the number of gene copies in the gene families was initially determined by functional requirements (Nei, 2007). A. gossypii is a filamentous fungus that infects agricultural crops (Lin and Li, 2011). The content of methylmercury in crops is probably much lower than that in wine, juice, and dairy, for example, so the homologous gene of Hrt3 was likely lost in evolutionary history. The gene such as Cos111, which is required for antifungal drug ciclopirox olamine resistance, was lost in both V. polyspora from human lungs and A. gossypii (Leem et al., 2003; van Woerden et al., 2013). It is predicted that the selective pressure of ciclopirox olamine in the natural habitats is weak, so the gene was lost in both species. The last category is Cdc4 in G16, which contains 12 genes. Two copies of Cdc4 have been identified in V. polyspora and T. phaffii. The gene Cdc4 participates in regulating multiple processes, for instance, DNA replication, cell cycle, chromosome cohesion, and calcium signaling (Skaar et al., 2009). The duplicate genes may have been maintained in the genome because they had diverged in function. Increased gene copies can provide more opportunities for the phenotypic evolution.
Positively selected sites in F-box proteins
F-box proteins may have mainly evolved under strong purifying selection, but some positively selected sites were also conferred under adaptive evolution. Some of these sites are located in protein/protein interaction domains except for the F-box domain. These locations suggest that substrates and F-box proteins coevolved, or that the ability of F-box proteins to bind the target proteins has changed under enviromental pressure. The result is consistent with previous reports in other organisms (Thomas, 2006; Schumann et al., 2011; Navarro-Quezada et al., 2013; Wang et al., 2014). Many positively selected sites are located in F-box proteins with not-yet-defined C-terminal domains. Previous research showed that some of these F-box proteins had many target proteins (Skaar et al., 2009). It is likely that these F-box proteins can identify multiple substrates (Yang et al., 2008) and that the C-terminal protein/protein interaction domain has changed a lot to recognize multiple substrates.
The positively selected sites chosen by the program Selecton and Datamonkey web-server were different. There are two reasons that may explain the differences from the two bioinformatic tools. (1) The tools had different mechanisms. Selecton was based on an empirical Bayesian approach, while SLAC, FEL, and MEME methods all depended on the ML approach. (2) The positive selective pressure of the sites was not strong enough to be detected by both methods. For instance, only three sites were considered significant using Datamonkey, and no significant positively selected sites were identified by Selecton. That meant the evidence of the positive selective pressure on these sites was not easy to get using any strategy.
In the positively selected sites, we found that only a few sites had changed radically in amino acid properties, and many sites were unlikely to influence the function of the protein. The results indicated that the assessment of selective pressures only at the nucleotide level and the hypothesis that all mutations affect the fitness of the organism equally could be inaccurate (Maldonado et al., 2014). In this study, we could not get an accurate 3D structure of the proteins, otherwise, it would be possible to gain further information about how the structure or function is affected by changes in certain residues.
Footnotes
Acknowledgments
This work was supported by the National Natural Science Fund Program (31271917) and Fundamental Research Funds for the Central Universities (Z109021201).
Authors' Contributions
M.Y.Y., Y.L.L., A.W., and S.H.T. conceived and designed the experiments; S.U.R. and M.Y.Y. performed all experiments. S.U.R., T.M., and M.Y.Y. designed and analyzed the data. S.U.R., M.Y.Y., S.H.A.R., and R.M. drafted the article. S.H.A.R. and R.M. helped us to analyze the data again and revise the article. All authors read and approved the final article.
Ethical Approval
This article does not contain any studies with human participants or animals performed by any of the authors.
Disclosure Statement
No competing financial interests exist.
Supplementary Material
Supplementary Table S1 .
Supplementary Table S2.
Supplementary Table S3.
Supplementary Table S4.
Supplementary Table S5.
Supplementary Table S6.
Supplementary Table S7.
Supplementary Table S8.
Supplementary Figure S1.
References
Supplementary Material
Please find the following supplemental material available below.
For Open Access articles published under a Creative Commons License, all supplemental material carries the same license as the article it is associated with.
For non-Open Access articles published, all supplemental material carries a non-exclusive license, and permission requests for re-use of supplemental material or any part of supplemental material shall be sent directly to the copyright owner as specified in the copyright notice associated with the article.