
Abstract
Breast cancer has a high mortality rate for females. Aberrant DNA methylation plays a crucial role in the occurrence and progression of breast carcinoma. By comparing DNA methylation differences between tumor breast tissue and normal breast tissue, we calculate and analyze the distributions of the hyper- and hypomethylation sites in different function regions. Results indicate that enhancer regions are often hypomethylated in breast cancer. CpG islands (CGIs) are mainly hypermethylated, while the flanking CGI (shores and shelves) is more easily hypomethylated. The hypomethylation in gene body region is related to the upregulation of gene expression, and the hypomethylation of enhancer regions is closely associated with gene expression upregulation in breast cancer. Some key hypomethylation sites in enhancer regions and key hypermethylation sites in CGIs for regulating key genes are, respectively, found, such as oncogenes ESR1 and ERBB2 and tumor suppressor genes FBLN2, CEBPA, and FAT4. This suggests that the recognizing methylation status of these genes will be useful for the diagnosis of breast cancer.
Introduction
B
Studies have demonstrated that DNA methylation has an extremely important influence on the prognosis of breast cancer (Szyf, 2012; Jia et al., 2014; Hao et al., 2017). For instance, breast invasive carcinoma (BRCA1) methylation is significantly correlated with poor overall survival of breast cancer patients (Wu et al., 2013; Qiu et al., 2015). ALKBH3 promoter methylation can be used as a prognostic marker in breast cancer. ALKBH3 is inactivated in breast tumors and was found in association with poor disease outcome (Stefansson et al., 2017). Thus, in addition to traditional therapy targets (Shi et al., 2016), DNA methylation can be a promising target for the clinical diagnosis and treatment of breast cancer, such as methylation of HIN-1, O-6-methylguanine-DNA methyltransferase (MGMT), RASSF1A, and S100P (Fleischer et al., 2014a; Zhang et al., 2016). The methylation status of HIN-1, RASSF1A, and MGMT promoter indicates the field cancerization of breast cancer (Spitzwieser et al., 2015; Liu et al., 2016b). S100P methylation may be used as a biomarker in the early stage of detection for breast tumor patients (Yang et al., 2017a).
In addition, DNA methylation status in genome-wide distinct regions is different and has different effects on gene expression for breast carcinogenesis (Chen et al., 2018; Feng et al., 2018), which may consequently lead to distinct biological and clinical implications in the development of breast cancer (Jones, 2012; Qiu et al., 2016b; Xu and Chou, 2016). Promoter hypermethylation could lead to transcriptional silencing and gene inactivation, or reduce gene expression. However, DNA hypomethylation not only affects the stability of the chromosomes, which induces common chromosomal abnormalities in cancer cells (Raddatz et al., 2012), but also activates the expression of proto-oncogene (such as Ras, Myc, and HOX11), which promotes the occurrence of cancer (Luo et al., 2010; Hon et al., 2012). CpG island (CGI) methylation is related to gene transcriptional silence and microsatellite instability (Ahuja et al., 1997). It can silence the expression of Nox4 during hepatocarcinogenesis in rats (Lopez-Alvarez et al., 2017).
In addition to promoter and CGI, DNA methylation at enhancer and other function regions also has important impacts on cancer progress and heterogeneity (Fleischer et al., 2014b; Gao et al., 2015). Fleischer et al. (2017) found enhancer methylation identified breast cancer subtype-specific phenotype. Holm et al. (2016) showed that hypomethylation is connected to DNA repeats and subtelomeric regions in luminal breast cancer. Heyn et al. (2016) discovered abnormal super-enhancer methylation in tumors. These studies have suggested that DNA methylation of function regions plays important roles in cancers (Wang et al., 2014).
In this study, we systematically and comprehensively investigate methylation changes of whole-genome 13 regions in breast cancer and the inhibition or promotion of the expression of breast cancer-related genes by methylation changes in various regions, including TSS1500, TSS200, 5′UTR, 1stExon, gene body, 3′UTR, DNAse hypersensitive site (DHS), enhancer, CGI, N_Shore, S_Shore, N_Shelf, and S_Shelf. We identified DNA methylation shifts in key regions related to breast cancer. In the present study, first, the distributions of hyper- and hypomethylation CpG sites of different regions were analyzed in human breast tumor tissue. Then, combining with RNASeqV2 data, we studied the effect of DNA methylation in each region on gene expression in breast cancer to identify significant methylation sites associated with gene expression increase or decrease. Finally, the analyses of molecular function enrichment and pathways for the specific genes in which methylation and expression had been changed in breast cancer were performed. Our results reveal the relationship between DNA methylation aberrant alterations in 11 regulatory regions and tumor-related gene expression in breast carcinoma, possibly improving the understanding of transcription mechanism in tumor. Our work also indicates that methylation changes in specific regions of cancer-associated genes may be applied to the clinical diagnosis and therapy of breast cancer.
Materials and Methods
Illumina Infinium HumanMethylation450 data
The DNA methylation and gene expression data of human BRCA tissues were downloaded from the publicly available The Cancer Genome Atlas database (
With the explosive growth of biological sequences in the postgenomic era, one of the most important but also most difficult problems in biology is how to analyze information in biological sequences with discrete models or other statistical methods, yet still keep considerable sequence-order information or key pattern characteristic. Therefore, to obtain all the sequence-pattern information, the concept of Chou's PseAAC (Lin and Lapointe, 2013; Jia et al., 2016d; Qiu et al., 2016a; Khan et al., 2018) was proposed, and it has been widely used in nearly all the areas of computational proteomics (see e.g., Arif et al., 2018; Ju and Wang, 2018; Krishnan, 2018; Qiu et al., 2018; Rahman et al., 2018; Sabooh et al., 2018; Zhang and Duan, 2018; Zhang and Kong, 2018a, 2018b) and a long list of references cited in Chou (2017). Moreover, encouraged by the success of PseAAC (Xie et al., 2013; Xu et al., 2014a; Zhang et al., 2014), the concept of PseKNC (Pseudo K-tuple Nucleotide Composition) (Chen et al., 2014) was developed for generating various feature vectors for DNA/RNA sequences that have proved very useful as well (Chen et al., 2015b). Particularly, recently a very powerful web server called “Pse-in-One” (Liu et al., 2015) and its updated version “Pse-in-One2.0” (Liu et al., 2017a) have been established, providing great convenience for the users' studies. In this study, we use Illumina Infinium HumanMethylation450 Beadchip data to study the changes of genome-wide DNA methylation in tumors.
Illumina Infinium HumanMethylation450 Beadchip data were released in 2011, also known as the 450k array (Bibikova et al., 2011). The 450K array uses the bisulfite conversion of genome DNA to discriminate methylated from unmethylated cytosine bases within the sequences at single-based resolution (Wen et al., 2017). It contains more than 480,000 interrogated CpG probe sites (Bibikova et al., 2011). In this study, these sites were mapped to the human reference genome hg19. In each sample, each site corresponds to a beta (β) value to denote the DNA methylation level of this CpG locus. This value is calculated as follows:
where M is the methylated signals, U is the unmethylated signals, and 100 is a small correction term to regularize probes of low total signal intensity (Teschendorff et al., 2013). The β value ranges from 0 to 1, in which 0 represents unmethylated, a value close to 0 indicates a low level of DNA methylation, 1 represents completely methylated, and a value close to 1 indicates a high level of DNA methylation.
To validate the methylation patterns of important CpG sites and the expression patterns of corresponding genes, we downloaded another independent data set from The Cancer Genome Atlas, which contains the HM450 data of paired tumor and normal tissues from 73 breast cancer patients, and RNASeq data of paired tumor and normal tissues from 61 of 73 breast cancer patients. We compared our findings with the study results for the data set.
Identification of different methylation CpG sites
Linear model for microarray data (Limma) is used for analyzing the different methylation CpG sites between tumor and normal tissues (Ritchie et al., 2015). Differential methylation CpG sites are selected using adjusted p-value and the difference of average β values between tumor and normal tissues. The p-value is calculated using Bayes test and adjusted for multiple testing by controlling for the false discovery rate using the Benjamini–Hochberg method. So, we regard those sites with adjusted p < 0.01 and average β value difference (Δβ) < −0.20 or >0.20 in tumor compared with normal tissues as differently methylated CpG sites in subsequent analysis (Yang et al., 2017b). When Δβ is greater than 0.2, these sites are defined as the hypermethylated sites. When Δβ is less than −0.2, these sites are defined as the hypomethylated sites.
For Illumina Infinium HumanMethylation450 Beadchip level three data, each sample has 485,577 CpG sites and corresponding β values. The 450K array data of 72 human breast tumor and 15 normal breast tissue samples form an 87 × 485,577 matrix. The rows with “NA” in this matrix were removed. Eventually, a total of 388,512 CpG sites were retained. Using the β values of 388,512 CpG sites in 87 samples, we identified the 39,254 differently methylated sites (p < 0.01 and |Δβ| > 0.20) between breast tumor and normal breast tissues. The 39,254 sites were separated into 23,377 hypermethylated (p < 0.01 and Δβ > 0.2) and 15,877 hypomethylated sites (p < 0.01 and Δβ < −0.2).
Analysis of DNA methylation samples
Using β values of 39,254 differently methylated sites between breast tumor and normal breast tissues, the DNA methylation 87 samples (including 72 tumor and 15 normal samples) were clustered by using principal component analysis (PCA) and unsupervised hierarchical clustering methods. For PCA, there are four breast tumor tissue samples that are more closely with normal samples. When the 4 tumor samples were deleted, the remaining 68 tumor samples and 15 normal samples were used for further clustering. It is found that the remaining 68 tumor samples and 15 normal samples are obviously separated into two categories, tumor and normal. Of these, normal samples clustered more closely with less variation, while tumor samples clustered relatively scattered.
For unsupervised hierarchical clustering, the “hclust” function in R/Bioconductor software packages (
Differential expression gene screening
Gene expression data are generated from the IlluminaHiSeq_RNASeqV2 platform. “DESeq2” R package provides the method to test differential expression by using of negative binomial generalized linear models (Love et al., 2014). This package is used to identify the differential expression genes between tumor and normal samples. Genes showing adjusted p < 0.01 and | log2(FoldChange) | > 1 are selected for differently expressed genes. Those genes with a higher mean expression level [log2(FoldChange) >1] in tumor tissue than normal tissue are characterized as the upregulated genes. Those genes with a lower mean expression level [log2(FoldChange) < −1] in tumor tissue than normal tissue are characterized as the downregulated genes.
Gene ontology and pathway analysis
The DAVID database functional annotation tool (
Statistical analysis
Statistical analysis and data visualization are carried out mainly using the Perl programming language and R_3.3.0 statistical software, including the R/Bioconductor packages (
Results
The distribution characteristics of hyper- and hypomethylation in breast tumor tissue
The distributions of hyper- and hypomethylation sites in chromosomes
We analyzed the distributions of the hyper- and hypomethylation CpG sites on each chromosome (except chromosome Y) (Fig. 1a). It is observed that the distribution densities of methylation are inconsistent both within and between each chromosome. For example, there are almost no methylation CpG sites at 125 of chromosome 1. This may be due to the specific structure of chromosomes. For hypermethylation, compared with other chromosomes, the methylation distributions in chromosome 9, 18, and X disperse obviously, and the methylation distributions in chromosome 1, 17, and 19 are relatively dense. Most of the methylation β values are greater than 0.5 in each chromosome. Also, the distributions of hypomethylation sites in chromosome 9, 18, and X are obviously dispersed, and the methylation sites in chromosome 1, 14, 15, 16, and 17 are denser. The β values of most hypomethylation sites are less than 0.5 for each chromosome. Moreover, in contrast with the distribution of the total methylation sites (388,512 sites) on each chromosome, the hyper- and hypomethylation sites in some chromosomes are clearly less in breast cancer tissue, such as chromosome X and 22. This reveals that methylation changes may be correlated with chromosome property in breast cancer.

The distributions of hyper- and hypomethylation among the six regions
According to Illumina Infinium HM450 array annotation file (hg19), we computed, respectively, the proportions of hyper- and hypomethylation sites located in each of the six genome regions, including TSS1500, TSS200, 5′UTR, first exon (1stExon), gene body, and 3′UTR (Fig. 1b, c). For the distributions of hypermethylated CpG sites in the six regions, the proportion of gene body region is the highest, which reaches at 45.59% of the total number of hypermethylation sites of the six regions. However, TSS1500, TSS200, 5′UTR, 1stExon, and 3′UTR account for 16.11%, 11.22%, 14.59%, 9.34%, and 3.15%, respectively. The distributions of hypomethylated CpG sites of the six regions are that gene body region is also the highest proportion, 56.73% of the total number of hypomethylation sites of the six regions. Second, TSS1500 is 13.32%. Nevertheless, the proportion of 1stExon in hypomethylation is the lowest, 4.69%. Then, TSS200 is 5.67%. 5′UTR is 12.77%, and 3′UTR is 6.82%. Gene body region enriches the highest of hyper- and hypomethylation sites compared with the other five regions in breast tumor tissue.
Compared with the distributions of total sites in the six regions, we observe the proportions of hyper- and hypomethylation increase, respectively, by 4.94% and 16.08% in gene body region (Fig. 1d). The methylation of gene body region makes remarkable alterations in breast tumor tissue, suggesting that gene body methylation changes have important influences during breast carcinogenesis (Yang et al., 2014). For 3′UTR, the hypomethylation proportion is higher than total sites, showing 3′UTR is biased toward hypomethylation in the development of breast cancer.
Hypomethylation of enhancer regions in breast cancer
To investigate the behavior of hyper- and hypomethylation on genome-specific sites in breast cancer, the methylation status in three regions, including CGI, DHS, and enhancer, was studied (Supplementary Fig. S1a). In contrast with DHS and enhancer regions, the hypermethylation proportion of CGI is highest. A total of 11,677 hypermethylation sites are mapped to CGI, accounting for 46.51% of the total. The number of hypermethylation sites of DHS and enhancer regions is 6111 (24.34%) and 7317 (29.15%), respectively. For the hypomethylation sites, enhancer region enriches the most sites, accounting for 77.45% (5184 sites) of the total. The proportions of DHSs and CGIs are 11.50% (770 sites) and 11.04% (739 sites), respectively. These results indicate that CGI is a frequently hypermethylated region, and enhancer region is highly frequently hypomethylated in breast cancer.
Furthermore, we analyzed the distributions of hyper- and hypomethylation of CGI flanking (shores and shelves regions). Shores are defined as the 2000 bp regions upstream and downstream of CGI boundaries, respectively, N_Shore and S_Shore. Shelves are defined as the 2000–4000 bp regions upstream and downstream of CGI, respectively, N_Shelf and S_Shelf (Bibikova et al., 2011). Interestingly, we find that hypomethylation mainly occurs in shelves and shores regions (accounting for 85.92%), and CGI hypomethylation proportion is the lowest, only 14.08% (Supplementary Fig. S1b right). CGI is majorly hypermethylated, and its proportion accounts for 63.66%, far higher than shelves and shores regions (Supplementary Fig. S1b left). Results indicate that shelves and shores regions prefer to be hypomethylated in breast carcinoma.
The relationship between DNA methylation and gene expression in breast cancer
Through the above analysis, our results demonstrate that the distributions of hyper- and hypomethylation of various regions are notably different for breast cancer. Then, whether DNA methylation patterns in different regions are related to gene expression and how they affect gene expression in breast cancer? To explore these problems, we studied the DNA methylation changes of different regions in the differential expression genes between breast tumor and normal breast tissues, and regulation of gene expression by hyper- and hypomethylation within diverse regions, including the six genome regions (TSS1500, TSS200, 5′UTR, 1stExon, gene body, and 3′UTR), three special positions (CGI, enhancer, DHS), and relation to CGI (shores and shelves).
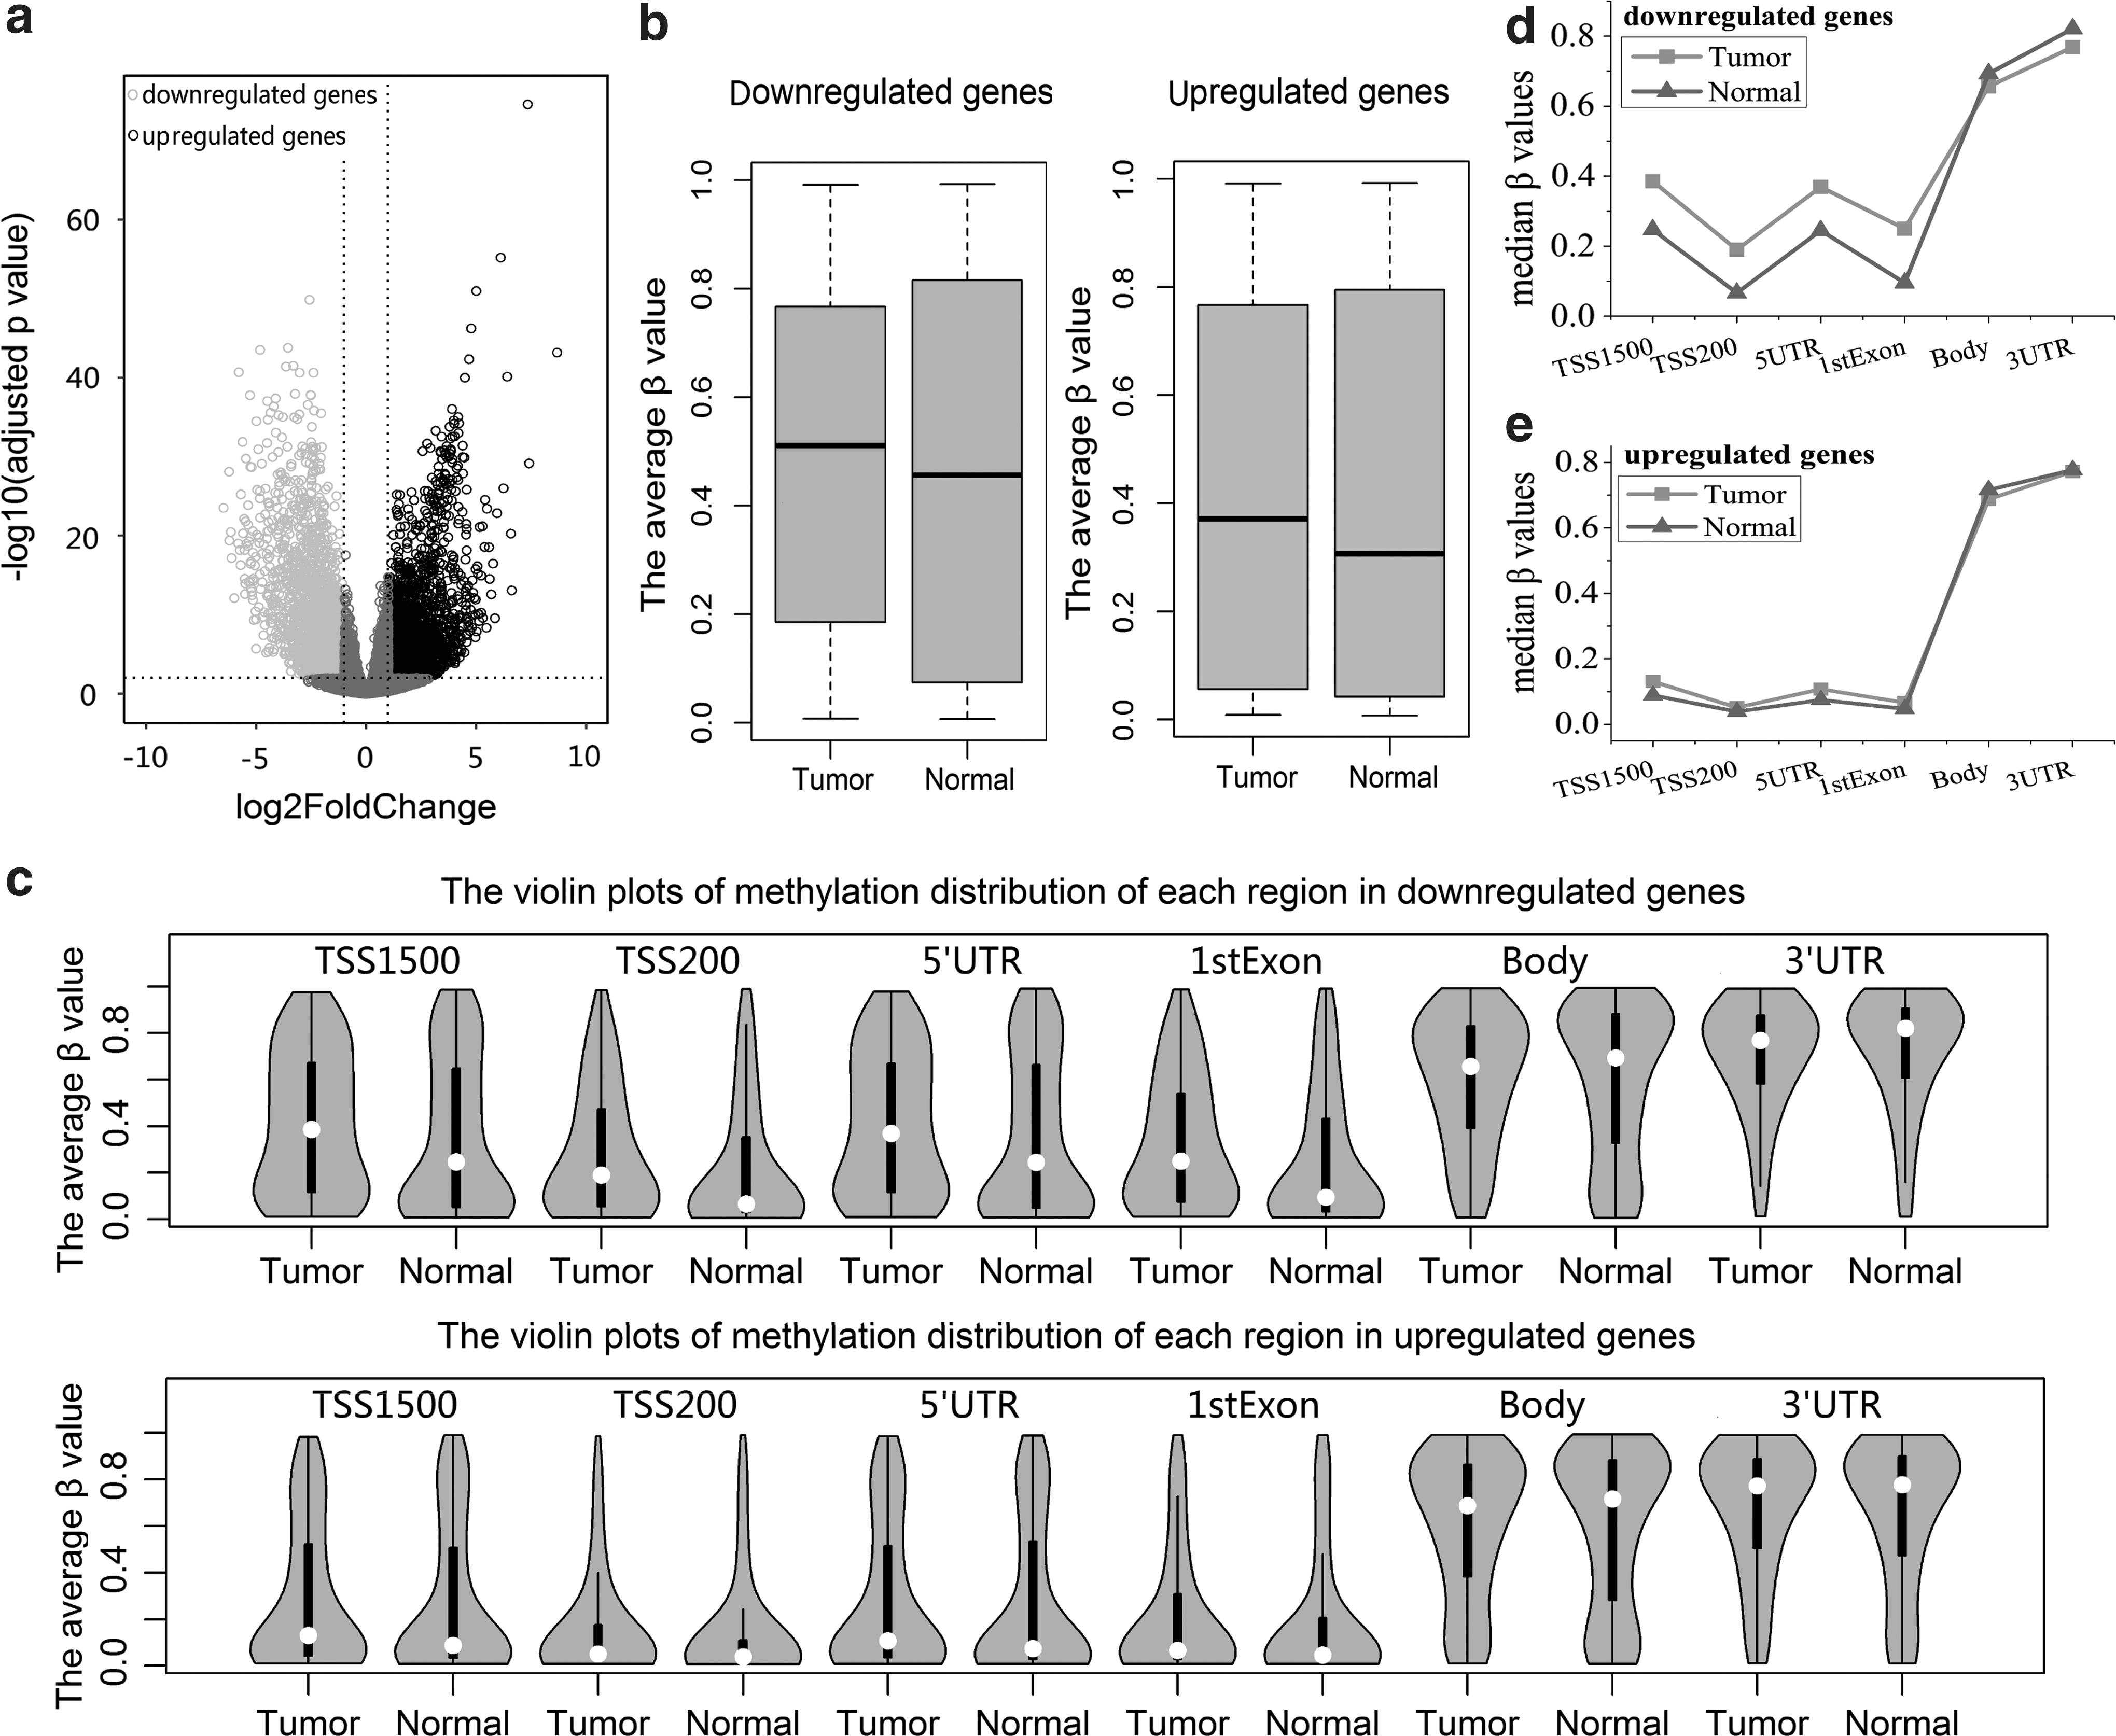
We first identified 4527 significantly differential expression genes between breast tumor and normal breast tissue samples using RNASeqV2 data (Fig. 2a). Of these genes, 2316 genes are upregulated and 2211 genes are downregulated. According to the corresponding relationship between genes and CpG probe sites in array of HM450 data, we extracted the corresponding methylation CpG sites for up- and downregulated genes, respectively. The average β value of each site was calculated across all tumor and normal samples, respectively. For the downregulated genes, the average β values in tumor tissue are significantly different from that of normal tissue (p < 2.2e-16), as shown in Figure 2b. As well, the upregulated genes also have significant methylation differences between tumor and normal tissues (p < 2.2e-16). In breast cancer, the down- and upregulated genes are influenced by DNA methylation, but the distribution differences between tumor and normal tissues in the downregulated genes are greater.
DNA methylation alterations in the six regions for differentially expressed genes
Next, for the down- and upregulated genes, we calculated their corresponding methylation sites located on each of the six regions and the distributions of average β values of these sites in breast tumor and normal breast tissue for each region (Fig. 2c). The methylation distribution difference between the two tissues in each region is more visible in downregulated genes than upregulated genes, particularly promoter region (including TSS1500, TSS200, 5′UTR, and 1stExon regions). DNA methylation has a very strong effect on the downregulation of gene expression in breast cancer, especially promoter methylation. It is noted that the average β values in TSS1500, TSS200, 5′UTR, and 1stExon regions are lower, whereas gene body region and 3′UTR are higher for down- and upregulated genes in breast cancer tissue. In the downregulated genes, we observe that the methylation distributions of the two tissues are markedly different at TSS1500, TSS200, 5′UTR, and 1stExon regions. For instance, the distributions of TSS1500 region and 5′UTR are more dispersed, their density of high methylation is greater in tumor than normal tissue (Fig. 2c), and their methylation medians in tumor are higher than that of normal tissue (Fig. 2d). Meanwhile, we also calculated the statistical significance of methylation difference between the two tissues for each region. The statistical significance is p = 1.418e-15 for 3′UTR and p < 2.2e-16 for other five regions. The results demonstrate that the change of DNA methylation in each region is associated with the decline of gene expression in human breast carcinogenesis (especially DNA methylation of the above five regions in Fig. 2c). Therefore, methylation alteration of each region plays important roles in breast cancer by regulating the expression of tumor suppressor genes. In upregulated genes, the methylation distribution differences between the two tissues (including their medians) are subtle in each of the six regions (Fig. 2c and e). For example, the methylation distributions in tumor and normal tissues are all more concentrated and their average β values are lower in TSS1500 region. At the same time, to further confirm the methylation differences between the two tissues, the statistical significance of p-value was calculated in each region. 1stExon, TSS200, and TSS1500 regions are p < 2.2e-16, 5′UTR is p = 1.522e-14 < 0.01, gene body is p = 0.002,301 < 0.01, and 3′UTR is p = 0.7483 > 0.01. This indicates that the changes of DNA methylation of other regions are significant in upregulated genes for breast tumor tissue except 3′UTR.
The methylation alteration in enhancer regions for upregulated genes
To study the relationship between CGI, DHS, and enhancer regional DNA methylation and gene expression in breast cancer tissue, we also calculated the methylation sites (corresponding to down- and upregulated genes) located in CGI, DHS, and enhancer regions, and analyzed the distributions of average β values of these sites in tumor and normal tissues for each region (Supplementary Fig. S2). For the downregulated genes, methylation differences between the two tissues are significant in CGI and DHS, with p < 2.2e-16. Nevertheless, in enhancer region, methylation between the two tissues is not significantly different (p = 0.076). However, for the upregulated genes, the methylation differences between the two tissues are significant in enhancer region (p = 2.375e-06). The changes of DNA methylation in CGI and DHS regions are significantly related to downregulation of genes, and DNA methylation alteration of enhancer region only significantly affects upregulation of gene expression in breast carcinoma.
Moreover, we investigated DNA methylation distributions of tumor and normal tissues in shores and shelves regions for the up- and downregulated genes (Supplementary Fig. S3). In N_Shelf, N_Shore, CGI, S_Shore, and S_Shelf regions, the methylation distributions in up- and downregulated genes are similar, that is, the methylation distributions of shelves regions are relatively centralized and most of the average β values (nearly three-quarters) are greater than 0.6, the distributions of shores regions are more scattered, and CGI methylation distributions are relatively concentrated and about three-quarters of average β values are less than 0.4. However, the methylation differences between the two tissues in each region are significant for the downregulated genes (p < 0.01). This result demonstrates the role of DNA methylations of flanking CGI regions (shores and shelves) in gene expression and reveals a possible mechanism of gene expression inactivation in breast cancer. For example, Manjegowda et al., (2017) suggested that hypermethylation of the upstream CGI shore region is a potential mechanism of GPER1 silencing in breast cancer cells by experiment. In the upregulated genes, the methylation differences between the two tissues in shelves and N_Shore regions are significantly different (p < 0.01), but there are no significant differences between tumor and normal tissues for S_Shore region (p = 0.14 > 0.01).
Hypermethylation of downregulated genes and hypomethylation of upregulated genes
The effect of hyper- and hypomethylation in the six regions on gene expression
Utilizing the Illumina Infinium HM450 data annotation information, genes corresponding to each CpG site can be obtained. A total of 23,377 hypermethylated sites are mapped to 5200 unique genes and 15,877 hypomethylation sites are mapped to 4714 unique genes. The intersection of 5200 genes and downregulated genes has 1102 genes, and the intersection of 4714 genes and upregulated genes has 578 genes (Supplementary Fig. S4). One thousand hundred two downregulated genes contain 3978 hypermethylation CpG sites, and 578 upregulated genes contain 1286 hypomethylation CpG sites. To understand the effect of hyper- and hypomethylation in diverse regions on gene expression, we calculated the distributions of 3978 hypermethylation sites in 1102 downregulated genes and of 1286 hypomethylation CpG sites in 578 upregulated genes at distinct function regions. First, we computed the distributions of these hyper- and hypomethylation sites of the six regions (Supplementary Fig. S5a, b). Taking the distributions of the total sites in six regions as reference, we notice that hypermethylation proportions in TSS1500, 5′UTR, and 1stExon regions are increased. However, for gene body region, the proportions of hypomethylation are increased (Supplementary Fig. S5c). From the above results, we can draw the conclusion that hypermethylation of TSS1500, 5′UTR, and 1stExon regions is correlated with downregulation of genes, contributing to weak gene expression in breast cancer. Besides, hypomethylation of gene body region plays important regulation roles in upregulation of genes. That is to say, gene body hypomethylation is helpful to reinforce or activate gene expression during breast carcinogenesis.
Hypomethylation in enhancer regions increases gene expression
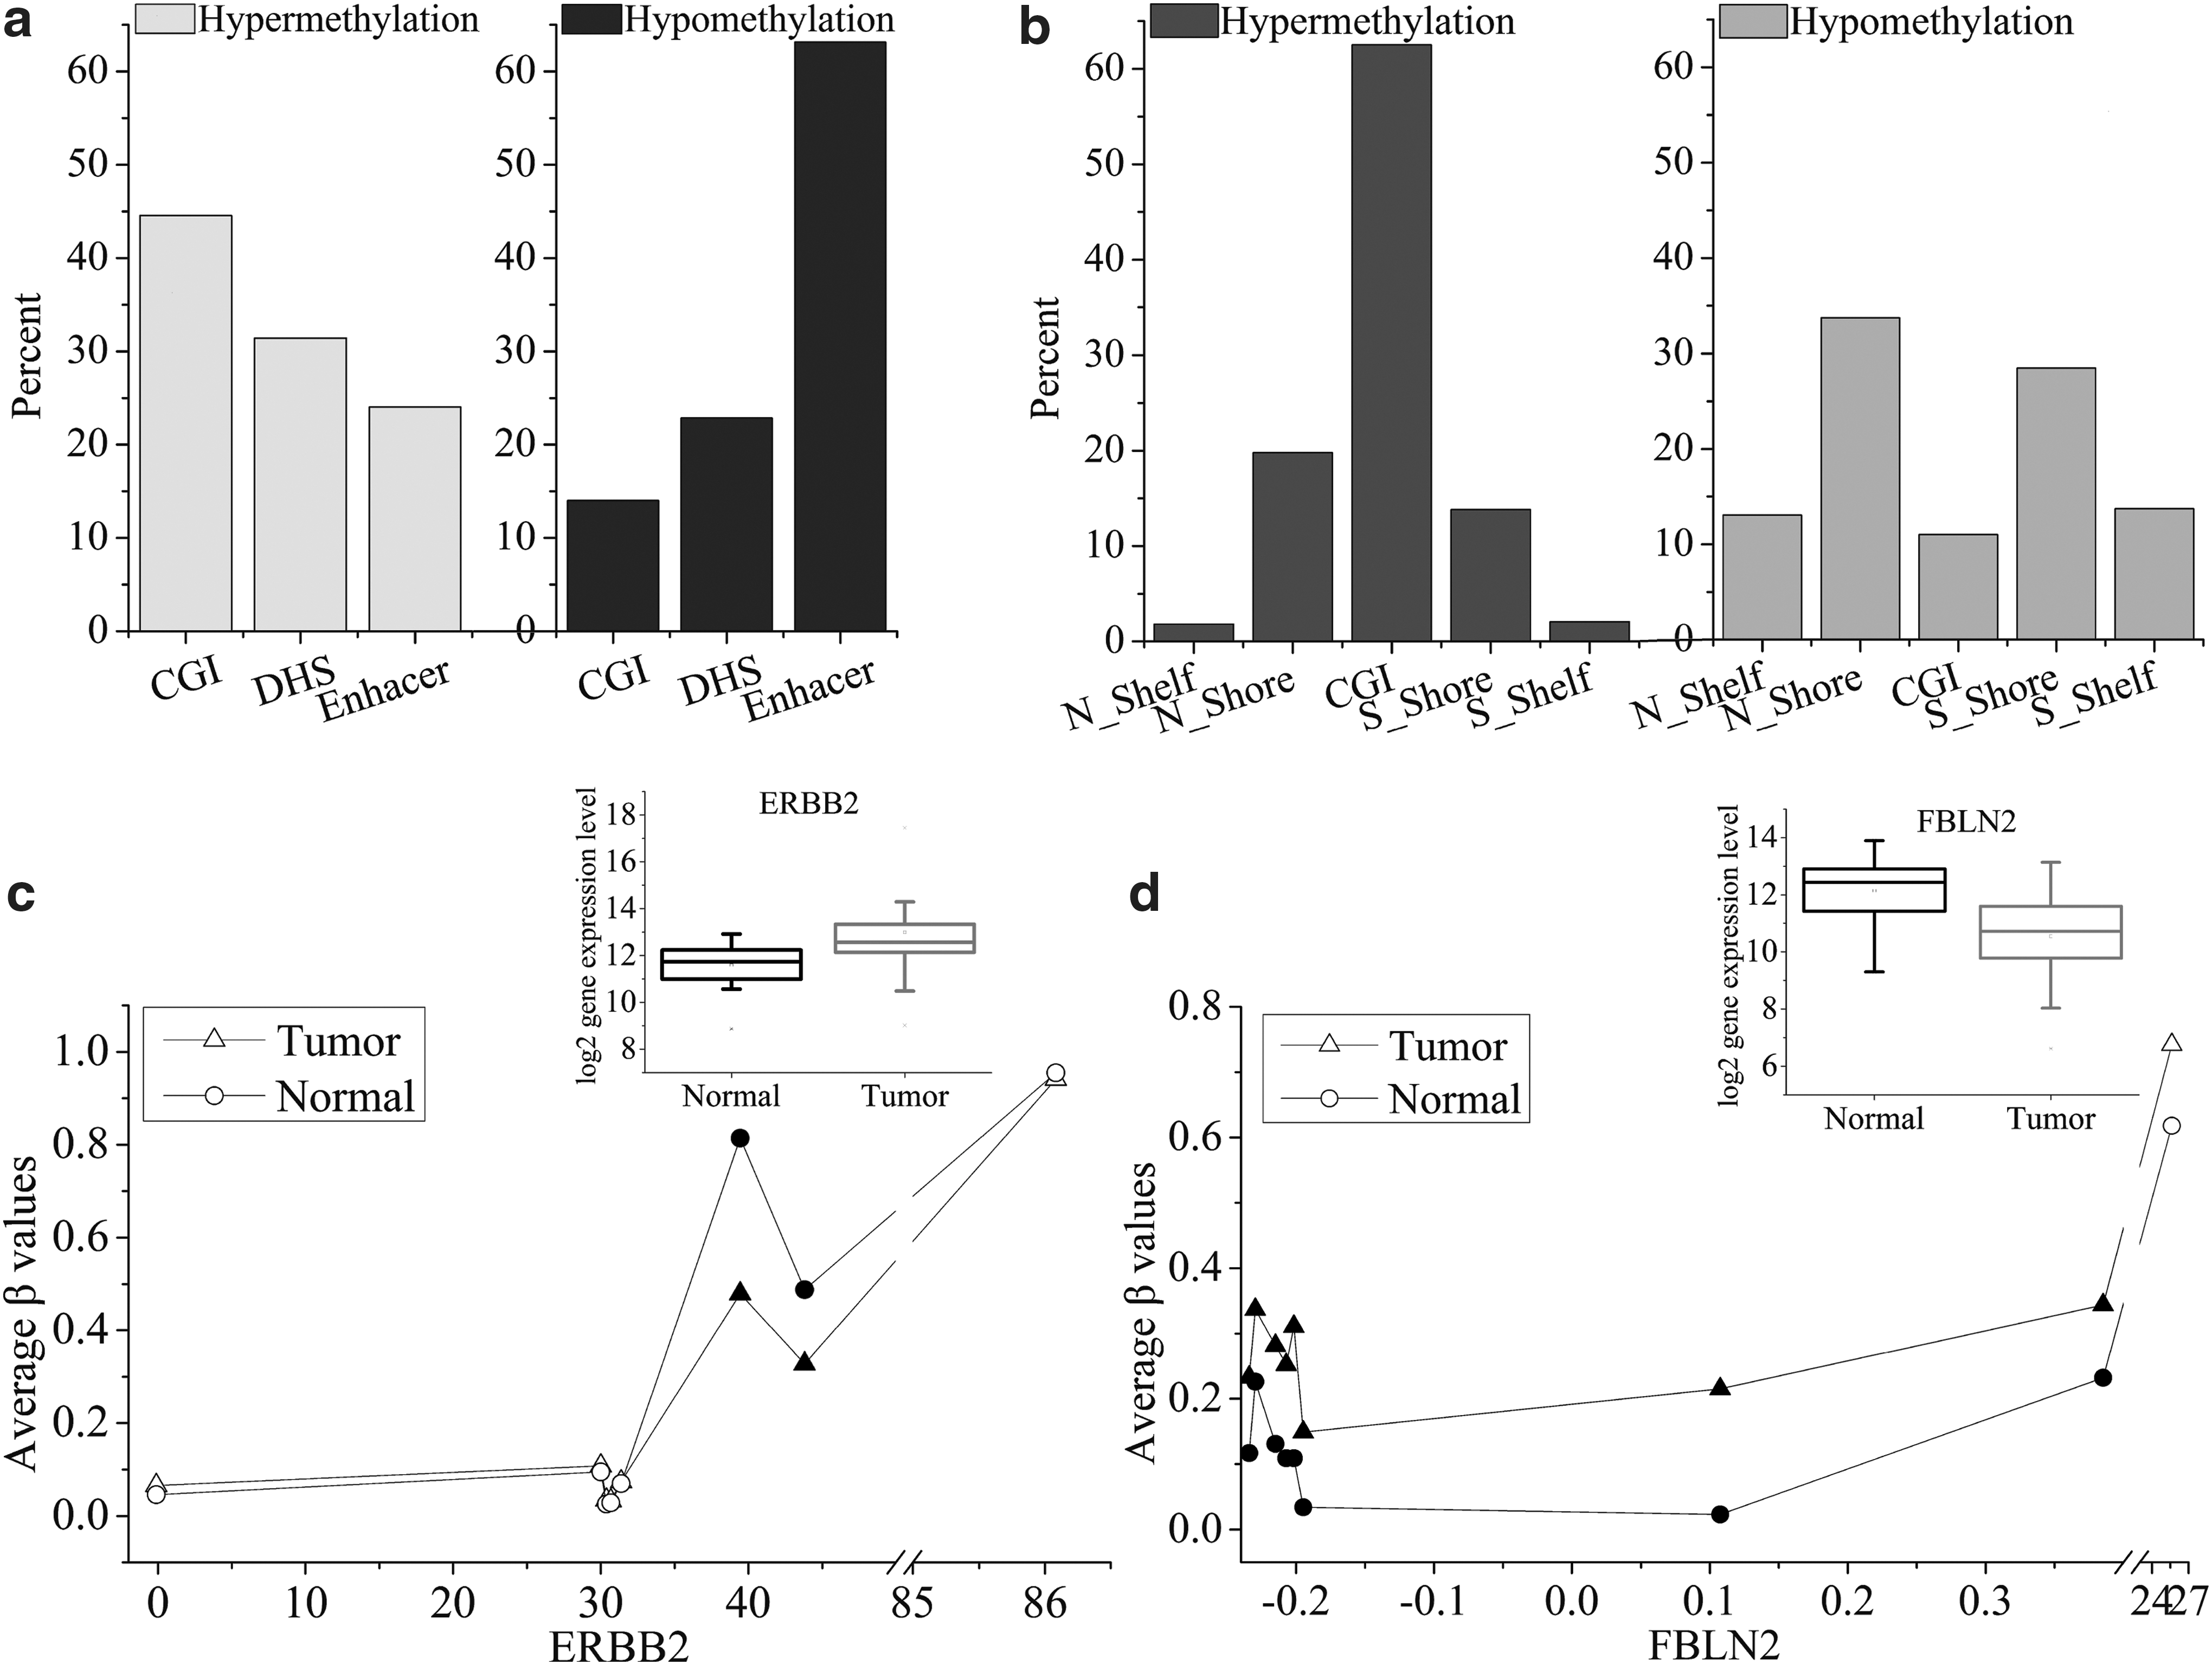
To study the effects of hyper- and hypomethylation in enhancer, DHS, and CGI regions on gene expression, we computed the distributions of hyper- and hypomethylation sites (corresponding to down- and upregulated genes) in the CGI, DHS, and enhancer regions for breast tumor tissue, and the results are shown in Figure 3a. Hypermethylation sites, 44.54%, enrich in CGIs and 31.42% and 24.04% of these sites locate on DHS and enhancer regions, respectively. For the hypomethylation sites, only 14.01% of them distribute in CGIs, and 22.84% of them are DHSs, whereas the number of these sites enriched in enhancer region is up to 63.15%. In 1102 downregulated genes, hypermethylation sites mainly distribute in CGIs. In 578 upregulated genes, hypomethylation sites principally distribute in enhancer regions. It is illustrated that the downregulation of genes is related to CGI hypermethylation, and the upregulation of genes is closely correlated with enhancer hypomethylation. In this study, we listed the enhancer hypomethylation sites of 10 upregulated genes and the CGI hypermethylation sites of 10 downregulated genes in breast cancer, as shown in Tables 1 and 2. The DNA methylation of these sites may help to understand the molecular mechanisms of breast cancer.
In addition, it is speculated that CGI hypermethylation inhibits the expression of tumor suppressor genes, and hypomethylation in enhancer region facilitates the expression of oncogenes to accelerate breast carcinogenesis process. We find that breast cancer oncogenes ERBB2 and ESR1 are hypomethylated in enhancer regions, and their expression level is increased in breast tumor tissue (Table 3, Fig. 3c, and Supplementary Fig. S6). ERBB2 (erb-b2 receptor tyrosine kinase 2), a member of the epidermal growth factor receptor family, is overexpressed in ∼20% of breast tumor and serves as a promising agent for the therapy of breast cancer (Eletxigerra et al., 2015; Jia et al., 2016b). The status of ESR1 can be a helpful biomarker to predict subsequent development of breast cancer (Soysal et al., 2015; Jia et al., 2016a). Thus, we speculate that the degree of methylation also can be used as a marker of breast cancer detection. Besides, FBLN2, CEBPA, and FAT4 are hypermethylated in CGIs, and their expression level is decreased in breast tumor tissue (Table 4, Fig. 3d, and Supplementary Fig. S6). FBLN2, a breast cancer suppressor gene, encodes extracellular matrix proteins and can bind calcium and a variety of extracellular ligands. It has been demonstrated to be downregulated and frequently methylated in breast cancer (Hill et al., 2010; Qiu et al., 2016c), which is consistent with our findings. According to our research, this implies whether reducing methylation level in CGIs of FBLN2 can weaken the invasion and metastasis of breast cells. CEBPA (CCAAT/enhancer binding protein alpha), an important transcription factor, is a tumor suppressor gene. Deregulation of CEBPA expression has been reported in breast tumor and can facilitate tumor cells' unlimited proliferation. Then, altering methylation status in CGIs of CEBPA may effectively control limitless proliferation of breast tumor cells. FAT4, FAT tumor suppressor homologue 4, is involved in the regulation of breast cancer development and plays a tumor suppressive role, which can inhibit cell proliferation, invasiveness, and metastasis (Qi et al., 2009; Cai et al., 2015). Research shows that its expression is repressed in breast cancer, and suggested that reducing its expression can trigger tumorigenesis (Qi et al., 2009). We observe that CGI hypermethylation of FAT4 is associated with its downregulation of expression, suggesting that CGI hypermethylation of FAT4 promotes tumor progression by proliferation of cells. Therefore, CGI hypermethylation decreases the expression of tumor suppressor genes and enhancer hypomethylation increases the expression of oncogenes for breast carcinogenesis, suggesting that CGI hypermethylation and enhancer hypomethylation may be a therapy target of breast cancer.
Furthermore, to verify the identified DNA methylation signatures at the key sites, we analyzed the methylation status of those enhancer and CGI sites and expression changes of the corresponding genes in tumor compared with normal tissues using the validation data set. The results show that those enhancer sites are indeed hypomethylated in the improvement of ERBB2 and ESR1 expressions for breast cancer (Supplementary Table S2 and Supplementary Fig. S7). Similarly, we also confirmed those key CGI hypermethylation sites in FBLN2, CEBPA, and FAT4, and their expressions weakened in tumor by this data set (Supplementary Table S3 and Supplementary Fig. S7). These results are consistent with our tested data set.
Finally, we also analyzed the distributions of these hyper- and hypomethylation sites in CGI flanking, including shores and shelves regions (Fig. 3b). In these regions, the hypermethylation sites in downregulated genes are primarily concentrated in CGI and its proportion is the highest. In contrast, the hypomethylation proportion in CGI for up-regulated genes is the lowest. About 62% of the hypomethylation sites in upregulated genes are enriched in N_Shore and S_Shore regions. In other words, the hypomethylation of shore region plays important roles in gene expression regulation for breast carcinoma. Rao et al. (2013) reported that CGI shore methylation regulates caveolin-1(Cav1) expression in breast cancer cells, and Cav1 is related to cell proliferation, migration, and invasion. CGI shore methylation also may represent a biomarker for breast tumors.
GO and KEGG pathway analysis
We investigated 1102 downregulated genes (with hypermethylation in breast tumor tissue) and 578 upregulated genes (with hypomethylation in breast tumor tissue) involved in GO terms and KEGG pathways. These GO terms and KEGG pathways will change in tumorigenesis because of the alterations of DNA methylation and expression status of these genes, which have an important influence on breast cancer. The top 10 significantly enriched GO terms and KEGG pathways may be extremely important to the development of breast carcinoma (Fig. 4 and Supplementary Fig. S8). For the 1102 downregulated genes, the genes involved in the pathways in cancer include AKT3, CEBPA, EGFR, FGF2, EPAS1, GF1, and so on. Chung et al. (2013) demonstrated that AKT3 can inhibit the migration of tumor cells, and the decrease of its expression can enhance tumor metastasis in breast cancer. EGFR may relate to lymph node metastasis, and its expression can be used as a marker for poor prognosis of breast tumor patients (Liu et al., 2010). Rap1 signaling pathway delivers an oncogenic signal in tumor (Largaespada, 2003). PI3K-Akt signaling pathway is one of the most frequently hyperactivated pathways for tumor. It not only promotes the proliferation of breast cancer cells but also reduces cell apoptosis and differentiation. PI3K-Akt signaling pathway has an important significance for angiogenesis of breast tumor (Grunt and Mariani, 2013). This pathway includes genes such as AKT3, EGFR, CCND2, LAMC1, and LAMA4. CCND2 is a cell cycle regulator that is frequently hypermethylated for some breast tumors. In these analyses, other than some pathways have been verified to correlate with cancers, the rest may also play significant roles in breast carcinogenesis.
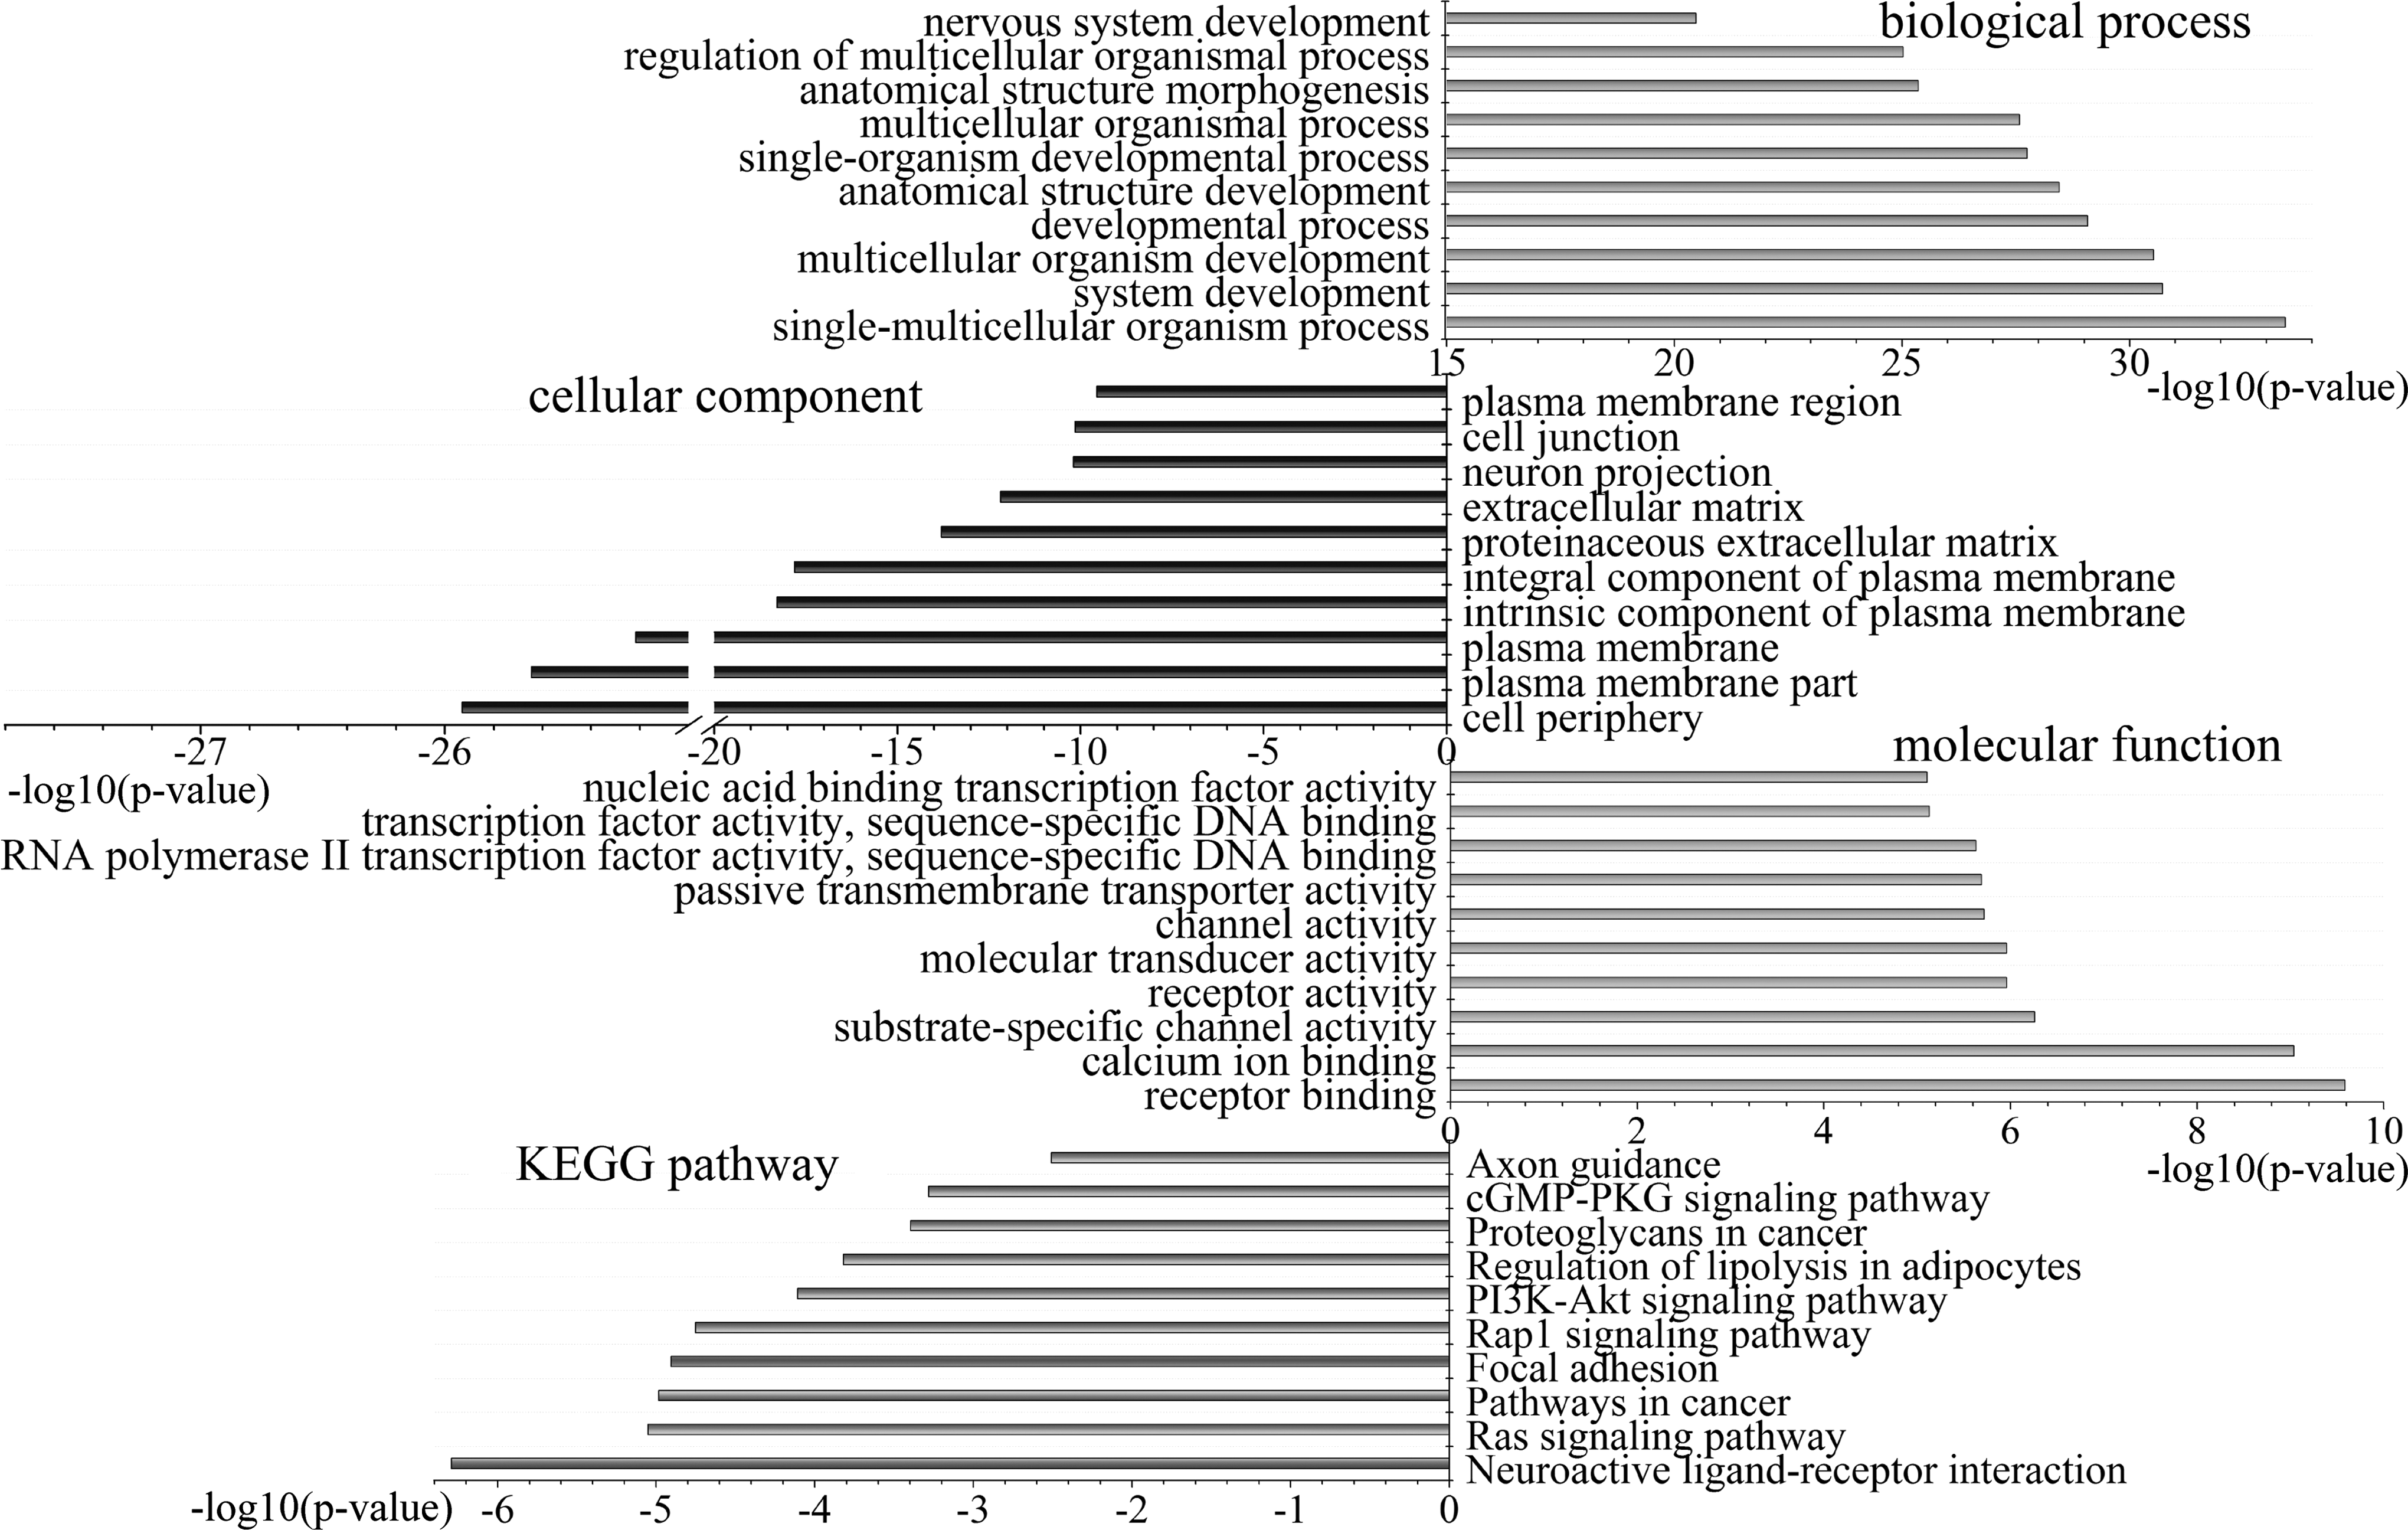
Top 10 significantly enriched biological process, cellular component, molecular function and KEGG pathway in 1102 genes. KEGG, Kyoto Encyclopedia of Genes and Genomes.
Discussion
Our research finds that the majority of DNA methylation alterations in breast cancer do not occur in promoter region but in gene body region, and 3′UTR is hypomethylated in breast tumor tissue. Compared with DHS and enhancer, most hypermethylation sites locate in CGIs. However, hypomethylation sites mainly enrich in enhancer regions. For the 2 and 4 kb regions, flanking CGIs (i.e., shores and shelves) are frequently hypomethylated in breast cancer. Further research demonstrates that downregulated genes are more susceptible to methylation than upregulated genes in the six regions for breast carcinoma, especially promoter. Promoter methylation has a stronger regulatory effect on gene expression. Most importantly, we find that methylation of enhancer region is only related to gene upregulation. Hypermethylation in TSS1500, 5′UTR, and 1stExon regions reduces gene expression for breast tumor tissue. Hypomethylation in gene body region is helpful for gene expression in breast carcinoma. It is particularly important that the expressions of many downregulated genes depend on CGI hypermethylation, whereas upregulated genes are mainly related to the hypomethylation of enhancer regions. This suggests the possible mechanisms of gene silencing by CGI hypermethylation and gene activation by enhancer hypomethylation in breast cancer. CGI hypermethylation of FBLN2, CEBPA, and FAT4 genes inhibits their expression for breast cancer. Hypomethylation in enhancer regions of ERBB2 and ESR1 genes promotes their expression in breast carcinoma. Thus, methylation in enhancer regions of ERBB2 and ESR1 may be useful for clinical application that serves as a drug target to control the development of breast carcinoma by altering methylation level. Moreover, we also find that hypomethylation in shores regions is related to upregulation of gene expression, and may also be one of the important factors in the regulation of gene expression.
However, as pointed out in Chou and Shen (2009) and demonstrated in a series of recent publications (Liu et al., 2016a, 2017b; Feng et al., 2017; Qiu et al., 2017b, 2017c, 2017d; Xu et al., 2017), web server is the future direction for developing practical analysis methods (Xu et al., 2014b; Jia et al., 2016c; Ju and He, 2017). In fact, a lot of useful web servers have growing influences on medical science (Chou, 2015). Therefore, we will develop in this direction for future predicting work.
Conclusion
In summary, our analysis reveals that hypomethylation of enhancer region is highly frequent in breast cancer. Specially, we identify some key hypomethylation sites in enhancer regions of some genes (Tables 1 and 3), such as ERBB2, ESR1, FAM174B, SPTBN2, and HOPX, and it has been found that ERBB2 and ESR1 are breast oncogenes. Enhancer hypomethylation is associated with upregulation of gene expression, which possibly promotes oncogene expression in cancer. Similarly, we also find that CGI is frequently hypomethylated in cancer. In particular, several key CGI hypermethylation sites are identified in downregulated genes (Tables 2 and 4), such as FBLN2, CEBPA, FAT4, HOXD10, GRASP, and TIE1, and FBLN2, CEBPA, and FAT4 have been shown to be tumor suppressor genes. Hypermethylation of these sites is correlated to the decrease of gene expression in breast cancer. The discovery of these sites may be helpful for clinical application of breast cancer.
Footnotes
Acknowledgment
This work is supported by a grant from the National Natural Science Foundation of China (Nos. 31460234, 31870838, 11747315).
Authors' Contributions
W.J. designed the study, collected data, analyzed data, and wrote the article. Q.-Z.L. conceived the idea and was involved in the study, discussion, writing, and revision of the whole article. Y.-C.Z., Y.-N.C., and L.-Q.Z. discussed part of the results and revised the article. R.H. and W.-X.S. revised the article.
Disclosure Statement
No competing financial interests exist.
References
Supplementary Material
Please find the following supplemental material available below.
For Open Access articles published under a Creative Commons License, all supplemental material carries the same license as the article it is associated with.
For non-Open Access articles published, all supplemental material carries a non-exclusive license, and permission requests for re-use of supplemental material or any part of supplemental material shall be sent directly to the copyright owner as specified in the copyright notice associated with the article.