
Abstract
Abnormal expression of O-Linked β-N-acetylglucosamine (O-GlcNAc) and β-catenin is a general feature of cancer and contributes to transformed phenotypes. In this study, we identified the interaction between O-GlcNAc and β-catenin, and explored their effects on the progression of liver cancer. Our results demonstrated that upregulation of O-GlcNAc was induced by high glucose, whereas the application of PuGNAc and GlcNAc increased β-catenin protein expression levels, as well as the protein's stability and nuclear accumulation in the liver cancer cell lines HEP-G2 and HuH-7. In addition, overexpression of β-catenin could increase O-GlcNAc expression levels through upregulation of uridine 5′-diphosphate (UDP)-N-acetylglucosamine pyrophosphorylase 1 (UAP1) protein expression, protein stability, and inhibition of its ubiquitination. Moreover, the O-GlcNAcylation of β-catenin promoted the proliferation, colony formation, and repressed the induction of apoptosis in HEP-G2 and HuH-7 cells. Knockdown of β-catenin reduced cell proliferation, colony formation, and tumorigenesis, and promoted cell apoptosis through the downregulation of UAP1 expression. In conclusion, this study revealed that the reciprocal regulation between O-GlcNAcylation and β-catenin facilitated the proliferation of liver cancer.
Introduction
Abnormal energy metabolism, notably glucose metabolism, is frequently encountered in cancer cells, and malignant tumors require additional glucose intake to maintain tumor growth and proliferation (Liu et al., 2016). Certain studies have verified that diabetes is one of the main risk factors of liver malignancy, and that the morbidity of liver cancer in patients with diabetes is substantially increasing worldwide (Mukherjee et al., 2015). As the prevalence of both diabetes and HCC (hepatocellular carcinoma) is increasing, it is urgent to explore the underlying molecular mechanisms and the impact of high glucose on liver cancer.
O-Linked β-N-acetylglucosamine (O-GlcNAc) is a main post-transcriptional modification of cytosolic and nuclear proteins that occurs through covalent addition of a GlcNAc sugar moiety to the serine and/or threonine residues of proteins (Singh et al., 2015). Protein O-GlcNAcylation modification is considered a cellular nutrient sensor and a metabolic regulator, which occurs in a dynamic process and is regulated by O-GlcNAc transferase (OGT) and O-GlcNAcase (OGA) (Zachara and Hart, 2004; Butkinaree et al., 2010; Onodera et al., 2014). OGT transfers the GlcNAc moiety from the high-energy donor uridine 5′-diphosphate (UDP)-GlcNAc to substrate proteins, whereas OGA hydrolyzes O-GlcNAc from proteins. Similar to protein phosphorylation, O-GlcNAcylation is an important post-translational modification that modulates the function of various nuclear and cytoplasmic proteins (Xu et al., 2018). Dysregulation of key proteins by O-GlcNAcylation has been proposed to be responsible for the development of type II diabetes (Vaidyanathan and Wells, 2014) and several types of tumors, including liver cancer (Guo et al., 2012; Xu et al., 2017), indicating that O-GlcNAcylation may be considered as the pathophysiological link between diabetes and liver cancer (Slawson et al., 2010).
β-catenin is a multifunctional protein that plays a structural role in the adherent junctions along with E-cadherin (Kramer et al., 2017). β-catenin is often deregulated in cancer cells to sustain their unrestricted proliferation, and promotes their survival to facilitate metastatic spread (Clevers, 2006; Meng and Takeichi, 2009). The increased levels of β-catenin in the nucleus that are induced by deregulated Wnt signaling can lead to constitutive transcription of Wnt target genes, and subsequent enhanced cell proliferation, invasion, and metastasis of liver cancer cells (Fu et al., 2018). This suggests that the nuclear accumulation of β-catenin exerts an oncopromoting role in liver cancer.
In this study, we aimed to investigate the interaction between O-GlcNAcylation and β-catenin, and its functions in the progression of liver cancer to identify a new target for liver cancer treatment.
Materials and Methods
Cell culture and treatments
The human HCC cell lines HEP-G2 and HuH-7 were cultured in Dulbecco's modified Eagle's medium (DMEM; Invitrogen; Thermo Fisher Scientific, Inc., Waltham, MA) supplemented with 10% fetal bovine serum (FBS; Gibco; Thermo Fisher Scientific, Inc.), 100 U/mL penicillin, and 100 μg/mL streptomycin in 5% CO2 atmosphere at 37°C. These two HCC cell lines were purchased from Cell Bank of the Chinese Academy of Sciences (Shanghai, China). HEP-G2 and HuH-7 cells were treated with different concentrations of glucose (5.5, 15, or 40 mM), PuGNAc (25 mM), and GlcNAc (4 mM; all from Sigma-Aldrich; Merck KGaA, Darmstadt, Germany) for 24 h. The cells were treated with 0.1 mg/mL of cycloheximide (CHX; Sigma-Aldrich; Merck KGaA) for 1, 2, 4, 8, and 24 h, respectively, to assess protein stability.
Plasmids and preparation of the lentivirus
The β-catenin-Flag expressing plasmid, UDP-N-acetylglucosamine pyrophosphorylase 1 (UAP1) expressing plasmid, and the shRNA1/2 sequences for knockdown of β-catenin were all purchased from OriGene (Beijing, China). Lentiviral constructs (including the above shRNAs or expressing plasmids) were packaged in 293T cells according to the methodologies described in previous studies (Di Masi et al., 2010).
Western blot analysis
HEP-G2 and HuH-7 cells were harvested and lysed with ice-cold RIPA lysis buffer (Beyotime Institute of Biotechnology, Jiangsu, China). After blocking with 10% nonfat milk in phosphate-buffered saline (PBS), the membranes were immunoblotted with primary antibodies, washed with PBS/Tween-20 (PBST), and further incubated with horse radish peroxidase (HRP)-linked secondary antibodies (#7074; #7076; Cell Signaling Technology, Inc., Danvers, MA). The primary antibodies used were anti-O-GlcNAc (#ab2739; Abcam, Cambridge, UK), β-catenin (#ab32572; Abcam), OGT (#ab184198; Abcam), UAP1 (#ab95949; Abcam), GLUT1 (#ab15309; Abcam), GUCY1A3 (#ab50358; Abcam), GLUT2 (#ab54460; Abcam), CANT1 (#ab84786; Abcam), and SGLT1 (#ab14686; Abcam). Antibodies against FLAG (#8146), Ub (#3936), and GAPDH (#5174) were purchased from Cell Signaling Technology (CA). ImageJ software (v. 1.47; NIH, Bethesda, MD) was used for densitometry of the Western blots (WBs). The measurements were conducted in triplicate, and the results are presented as mean ± standard deviation (SD).
Real-time PCR
The real-time PCR (RT-PCR) analysis was performed in triplicate using a SYBR green dye (TaKaRa Biotechnology, Dalian, China) in a DA7600 Real-time Nucleic Acid Amplification Fluorescence Detection System (Bio-Rad Laboratories, Inc., Hercules, CA). GAPDH was used as an internal control. The primers were obtained from Beijing Genomics Institute, and the sequences were as follows:
β-catenin-F: 5′-ATGACTCGAGCTCAGAGGGT-3′,
R: 5′-ATTGCACGTGTGGCAAGTTC-3′;
UAP1-F: 5′-GAACATTAATGACCTCAAAC-3′,
R: 5′-TTCACCAGCTCATGAACTCC-3′;
GADPH-F: 5′-ATGGGGAAG GTGAAGGTCG-3′,
R: 5′-GGGGTCATTGATGGCAACAATA-3′.
Immunoprecipitation
Immunoprecipitation (IP) of β-catenin was performed using Dynabeads Protein A (Invitrogen, CA) according to the manufacturer's protocol. In brief, the cells were lysed in 5 mL of lysis buffer (50 mM Tris–HCl, pH 7.5, 200 mM NaCl, 0.5% Nonidet P40, protease inhibitor cocktail) for 30 min at 4°C. After culture with 50 μL of protein A for 1 h, the supernatants were incubated with anti-β-catenin antibody at 4°C overnight. Subsequently, the beads were washed with Western/IP lysis buffer for five times, and then analyzed using WB, as previously described (24).
Immunohistochemistry
The human liver cancer tissue microarray (TMA) slides were purchased from U.S. Biomax through the agent Alenabio (Xi'an, China). The TMA slides were deparaffinizated and rehydrated. The slides were incubated with primary antibodies overnight. The primary antibodies used in immunohistochemistry (IHC) were anti-O-GlcNAc (#ab2739; Abcam), β-catenin (#ab32572; Abcam), and UAP1 (#ab95949; Abcam).
Enzymatic labeling of O-GlcNAc sites
The assay was used to evaluate the enzymatic labeling of O-GlcNAc sites and was performed according to the methodology described in a previous study (Liu et al., 2018). The immunoprecipitated proteins were added to the reaction buffer. Subsequently, 2 μL GalT1 Y289L (Invitrogen; Thermo Fisher Scientific, Inc.) and 2 μL of 0.5 mM UDP-GalNAz (Invitrogen; Thermo Fisher Scientific, Inc.) were added to the aforementioned reaction buffer. The reaction was performed overnight at 4°C. The beads were washed with reaction buffer, and the samples were reacted with biotin alkyne (Invitrogen; Thermo Fisher Scientific, Inc.) and/or tetramethyl-6-carboxyrhodamine (TAMRA) alkyne (Invitrogen). Subsequently, the proteins were detected using WB with antistreptavidin (#ab10020; Abcam) and/or anti-TAMRA (#ab171120; Abcam) antibodies.
MTT assay and caspase 3/7 activity
Cell proliferation was determined by the MTT assay. A total of 20 μL MTT solution was added to each well of the 96-well plate and cultured for 4 h. Subsequently 100 μL dimethyl sulfoxide was added, and the absorbance was determined at 490 nm. A reference wavelength was used at 630 nm. With regard to caspase-3/7, the Caspase-Glo 3/7 assay kit (Promega Corporation, Madison, WI) was used. The experiments were performed according to the manufacturer's instructions.
Colony formation assay
The selected and stably transfected HuH-7 and HEP-G2 cells were seeded at a density of 2 × 10⁵ cells/well in a six-well plate of 0.3% agarose in DMEM containing 10% FBS. After 14 days of culture, the colonies were counted in triplicate, and the mean ± SD was used to estimate the error bars.
Immunofluorescence assay
HEP-G2 and HuH-7 cells were grown on coverslips and washed three times with PBS, followed by fixation in cold methanol for 10 min. The cells were permeated with 0.1% Triton X-100, washed with PBST three times, and blocked for 1 h with 5% goat serum in PBS. Subsequently, the cells were incubated with polyclonal goat antirabbit β-catenin (1:100) overnight at 4°C. The samples were washed with PBST three times and further incubated with goat antirabbit IgG AF488 (green) (Thermo Fisher Scientific, Inc.) at room temperature in the dark for 1 h. Finally, the cells were treated with DAPI (1:1 × 10⁴) for 5 min, washed three times with PBST, covered with mounting medium, and placed on microscope slides. The images were obtained using an Olympus Confocal FV100 Microscope.
Duolink assay
Duolink experiments were performed to detect the interactions between β-catenin and UAP1 proteins. A similar double immunofluorescence protocol was performed, and the secondary antibodies were replaced by secondary protein ligation assay (PLA) probes from the Duolink kit (Sigma-Aldrich; Merck KGaA). The protocol was conducted according to the manufacturer's recommendations, and an orange (555 nm wavelength) detection kit was used. The hybridization between two PLA plus and minus probes causes a fluorescent signal and occurs only when the distance between the two antigens is ≤40 nm.
Metabolites analysis
Glucose was detected by a glucose oxidase method-based assay kit (Apllygen Co Lte., Beijing, China). The intracellular glucose was detected in the cell lysates. Acetyl-CoA, fructose-6-phosphate (F-6-P), and glycogen were measured by using the corresponding kits purchased from Sigma (#MAK039, #MAK020, and #MAK016).
In vivo xenograft assay
Four-week-old male BALB/c nude mice obtained from the Jackson Laboratory (Beijing, China) were housed in a specific pathogen-free facility. Stably transfected HEP-G2 cells (1 × 10⁷) were implanted in BALB/c mice, and tumorigenesis was assessed 28 days postxenotransplantation. The protocol was described in full in a previous study (Zhang et al., 2017b). The study protocol was approved by the Animal Care and Research Committee of the Department of Traditional Chinese Medicine of Shanghai University.
Statistical analysis
All experiments were performed in triplicate, and the results were expressed as mean ± SD. Tests to examine the differences between groups included Student's t-test and one-way analysis of variance. A p value <0.05 (p < 0.05) was used to denote significant differences. The survival analysis was performed using the Kaplan–Meier curves and the log-rank test.
Results
O-GlcNAcylation upregulates β-catenin expression
The effects of glucose on the expression of β-catenin were investigated by treatment of HEP-G2 and HuH-7 cells with different doses of glucose (5.5, 15, 40 mM, and negative control). The results indicated that the expression levels of O-GlcNAc and β-catenin proteins were increased in a dose-dependent manner (Fig. 1A). However, the mRNA levels of β-catenin indicated no apparent change in the cells that were treated with three concentrations of glucose in both Bel-7401 and HuH-7 cells (Fig. 1B). Furthermore, stimulation of O-GlcNAcylation with PuGNAc (an inhibitor of OGA) and GlcNAc (the substrate in O-GlcNAcylation) resulted in increased expression levels of β-catenin in both Bel-7401 and HuH-7 cell lines, notably in the cells that were treated with both PuGNAc and GlcNAc simultaneously (Fig. 1C). No apparent change in the mRNA levels of β-catenin was noted (Fig. 1D). Subsequently, we used the CHX assay to investigate the mechanism underlying the increase in β-catenin expression that was mediated by O-GlcNAcylation. The degradation rate of β-catenin was decreased in HuH-7 and HEP-G2 cells that were treated with 40 mM of glucose compared with cells treated with 5.5 mM of glucose (Fig. 1E) or PuGNAc with or without GlcNAc (Fig. 1F). We further observed the subcellular localization of β-catenin in the presence of 5.5 and 15 mM of glucose using immunofluorescence staining, and the results indicated that glucose caused a translocation in the β-catenin protein from the cytoplasm to the nucleus in a dose-dependent manner (Fig. 1G). And the β-catenin protein was also transferred from the cytoplasm to the nucleus after adding PuGNAc with or without GlcNAc (Fig. 1H) to HuH-7 and HEP-G2 cells. The data led to the conclusion that O-GlcNAcylation increased β-catenin protein expression through decreasing its degradation, as well as by accelerating its nuclear translocation.

O-GlcNAcylation enhanced β-catenin expression.
O-GlcNAcylation of β-catenin improves the viability and inhibits the apoptosis of HuH-7 and HEP-G2 cells
We explored whether β-catenin could be O-GlcNAcylated by IP assays using O-GlcNAc and β-catenin antibodies in the HEP-G2 and HuH-7 cell lines. The results indicated that β-catenin could combine with O-GlcNAc and OGT proteins (Fig. 2A, C). Furthermore, enzymatic labeling of O-GlcNAc sites using HRP-labeled streptavidin and anti-TAMRA antibodies revealed that β-catenin could be directly O-GlcNAcylated (Fig. 2B). Treatment of HEP-G2 and HuH-7 cells with PuGNAc and GlcNAc significantly increased β-catenin protein expression, whereas this effect was abolished during knockdown of β-catenin (Fig. 2D). In addition, we investigated the effects of O-GlcNAcylation on the proliferation, apoptosis, and colony formation of HEP-G2 and HEP-G2 cells. The results indicated that PuGNAc and GlcNAc significantly improved cell proliferation and colony formation and repressed the activity of caspase-3/7 in HuH-7 and HEP-G2 cells, while these effects that were mediated by PuGNAc and GlcNAc were abolished when β-catenin expression was silenced with shRNA-1 and shRNA-2 (Fig. 2E–G). Taken collectively, the data demonstrated that the O-GlcNAcylation of β-catenin protein enhanced the viability and inhibited the apoptosis of liver cancer cells.
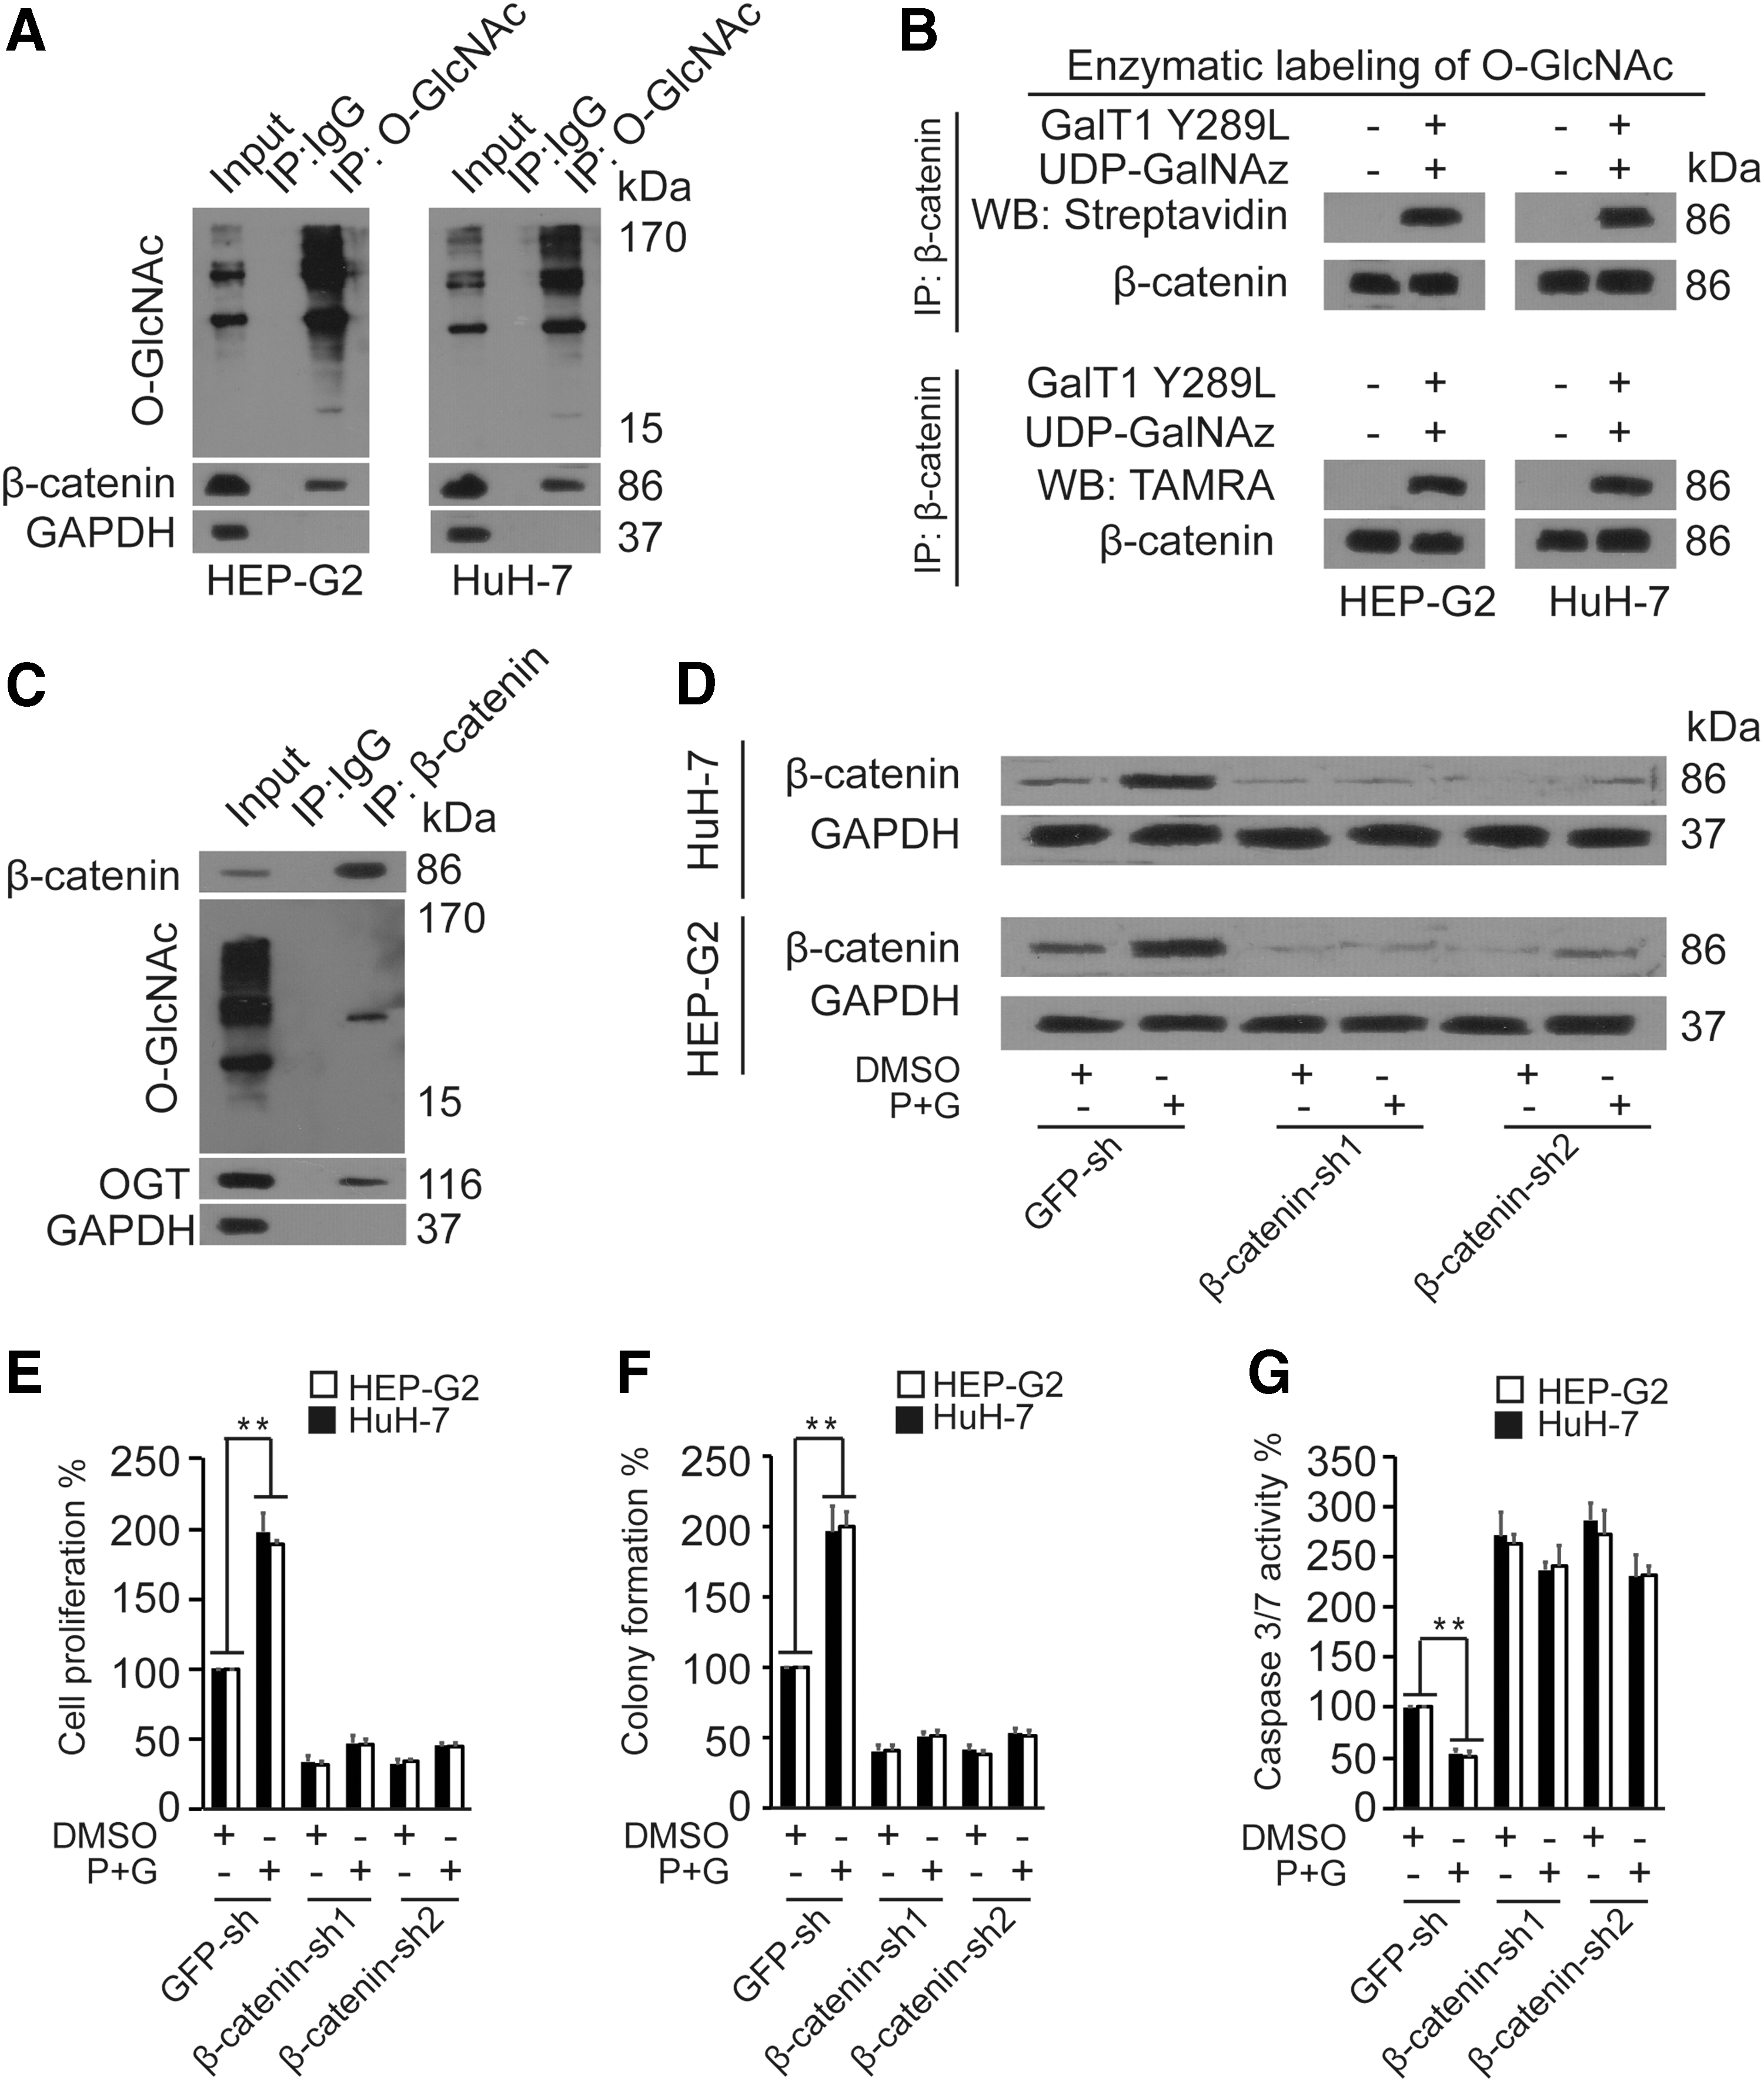
O-GlcNAcylation of β-catenin promoted the viability and repressed apoptosis of HuH-7 and HEP-G2 cells.
B-catenin increases hexosamine biosynthetic pathway and O-GlcNAc expression with UAP1 elevation in HuH-7 and HEP-G2 cells
Then, we explored whether β-catenin could regulate hexosamine biosynthetic pathway (HBP) and O-GlcNAcylation. The results indicated that the β-catenin overexpression could increase intracellular glucose levels (Fig. 3A) and glucose consumption (Fig. 3B) in the culture media, and the knockdown of β-catenin results in the opposite outcome, which suggested that β-catenin could facilitate glucose uptake in HuH-7 and HEP-G2 cells. Furthermore, we found that β-catenin could positively regulate the levels of acetyl-CoA and F-6-P (Fig. 3C, D), which are essential in the HBP. However, the levels of glycogen, which is not directly involved in the HBP, were not significantly altered (Fig. 3E). These findings indicated that β-catenin could positively regulate HBP. We subsequently explored the effect of β-catenin on the expression of O-GlcNAc and its underlying mechanism by employing a β-catenin-Flag plasmid to cause an upregulation of β-catenin expression in HuH-7 and HEP-G2 cells. The expression of O-GlcNAc was upregulated when β-catenin was overexpressed (Fig. 3F). Moreover, HBP components involving UAP1, CANT1, GUCY1A3, and OGT, as well as three major glucose transporters, namely SGLT1, GLUT1, and GLUT2 (Karim et al., 2012; Deng and Yan, 2016), were investigated for their possible relationships with β-catenin. Only UAP1 protein levels were upregulated by β-catenin overexpression among these HBP components and major glucose transporters (Fig. 3G), but not the mRNA levels (Fig. 3H). Similarly, knockdown of β-catenin by transfection of HuH-7 and HEP-G2 cells with β-catenin-shRNA1/2 significantly reduced the protein expression of UAP1 (Fig. 3I), but not in mRNA levels (Fig. 3J). Moreover, Duolink assays demonstrated that both β-catenin and UAP1 proteins were colocalized in the nuclear regions of HuH-7 and HEP-G2 cells (Fig. 3K). These data indicated that β-catenin could increase HBP and the expression of O-GlcNAc, which might occur through UAP1 in liver cancer cells.
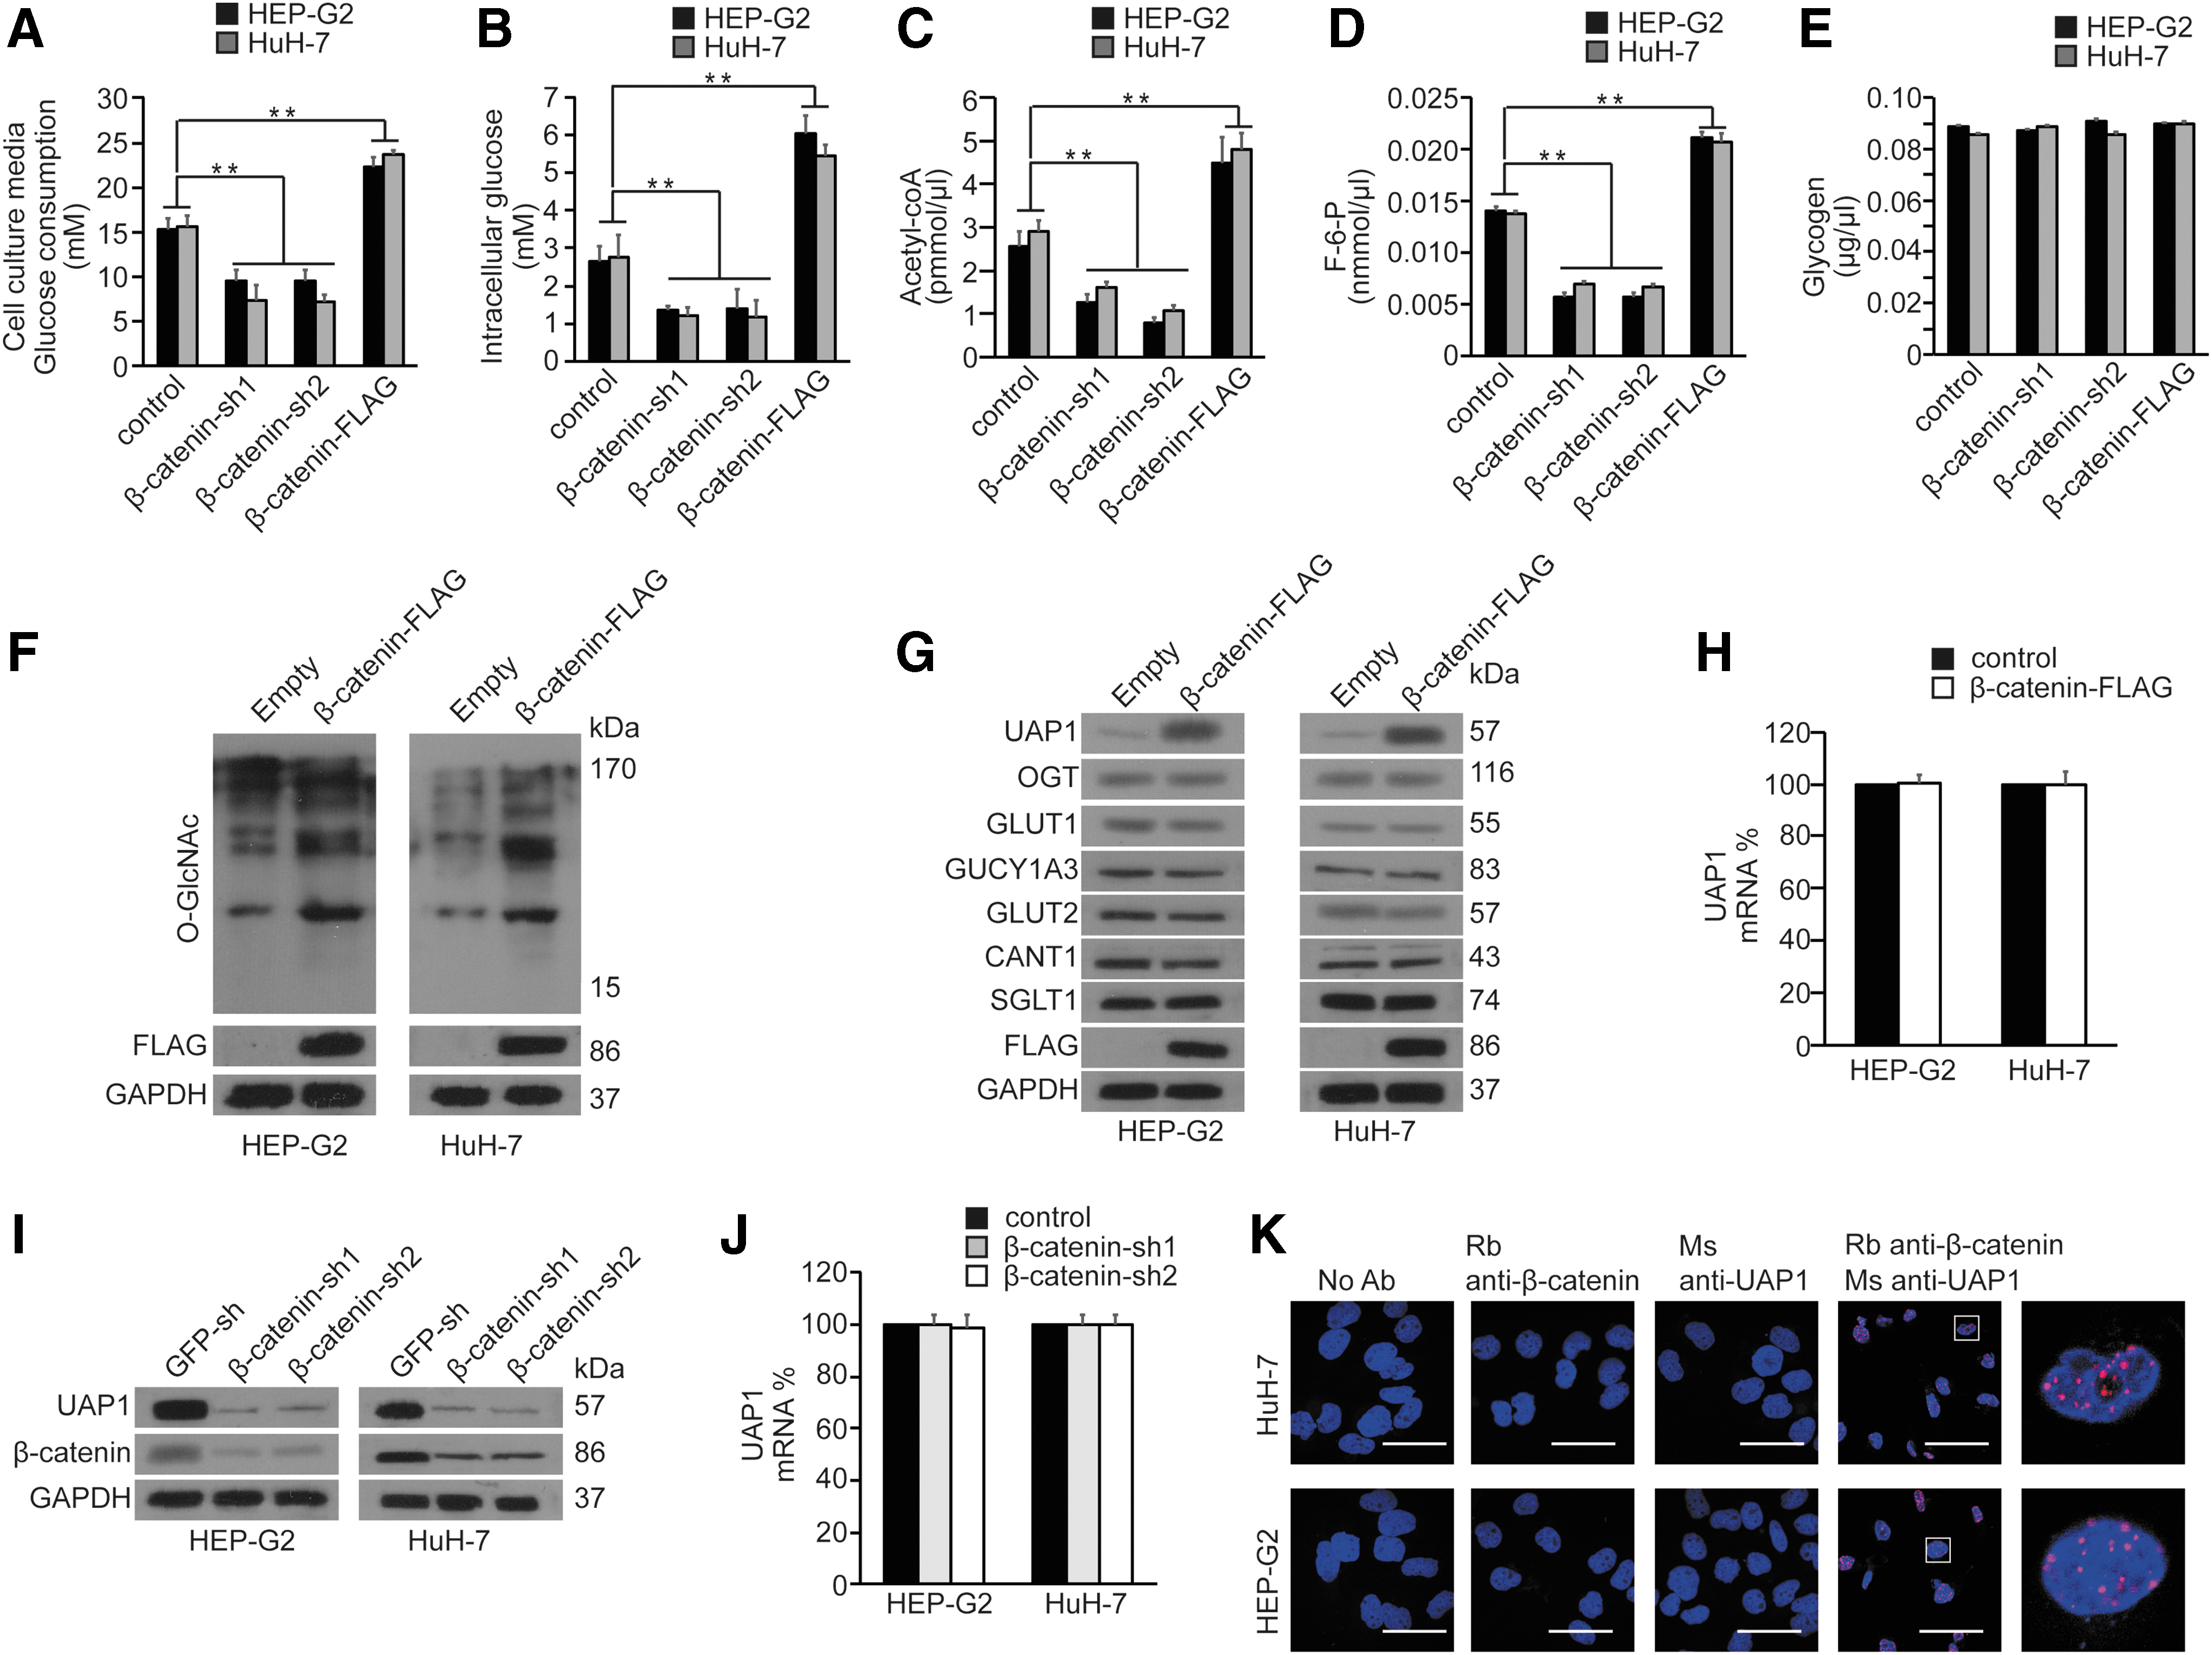
β-catenin increased HBP and regulated UAP1 expression in both HuH-7 and HEP-G2 cells.
β-catenin promotes the protein stability of UAP1
Then, we investigated the underlying mechanism of the elevated protein levels of UAP1 regulated by β-catenin. Thus, we conducted CHX chase experiments, and we found that upregulation of β-catenin significantly enhanced the stability of the UAP1 protein compared with the control group (Fig. 4A). By contrast, knockdown of β-catenin reduced the half-life of UAP1 in HuH-7 and HEP-G2 cells. Furthermore, upregulation of β-catenin in HuH-7 and HEP-G2 cells significantly reduced the ubiquitination of the UAP1 protein in a dose-dependent manner (Fig. 4C), and the knockdown of β-catenin resulted in the opposite outcome (Fig. 4D). All the results indicated that β-catenin promoted the UAP1 stability by reducing its ubiquitination.
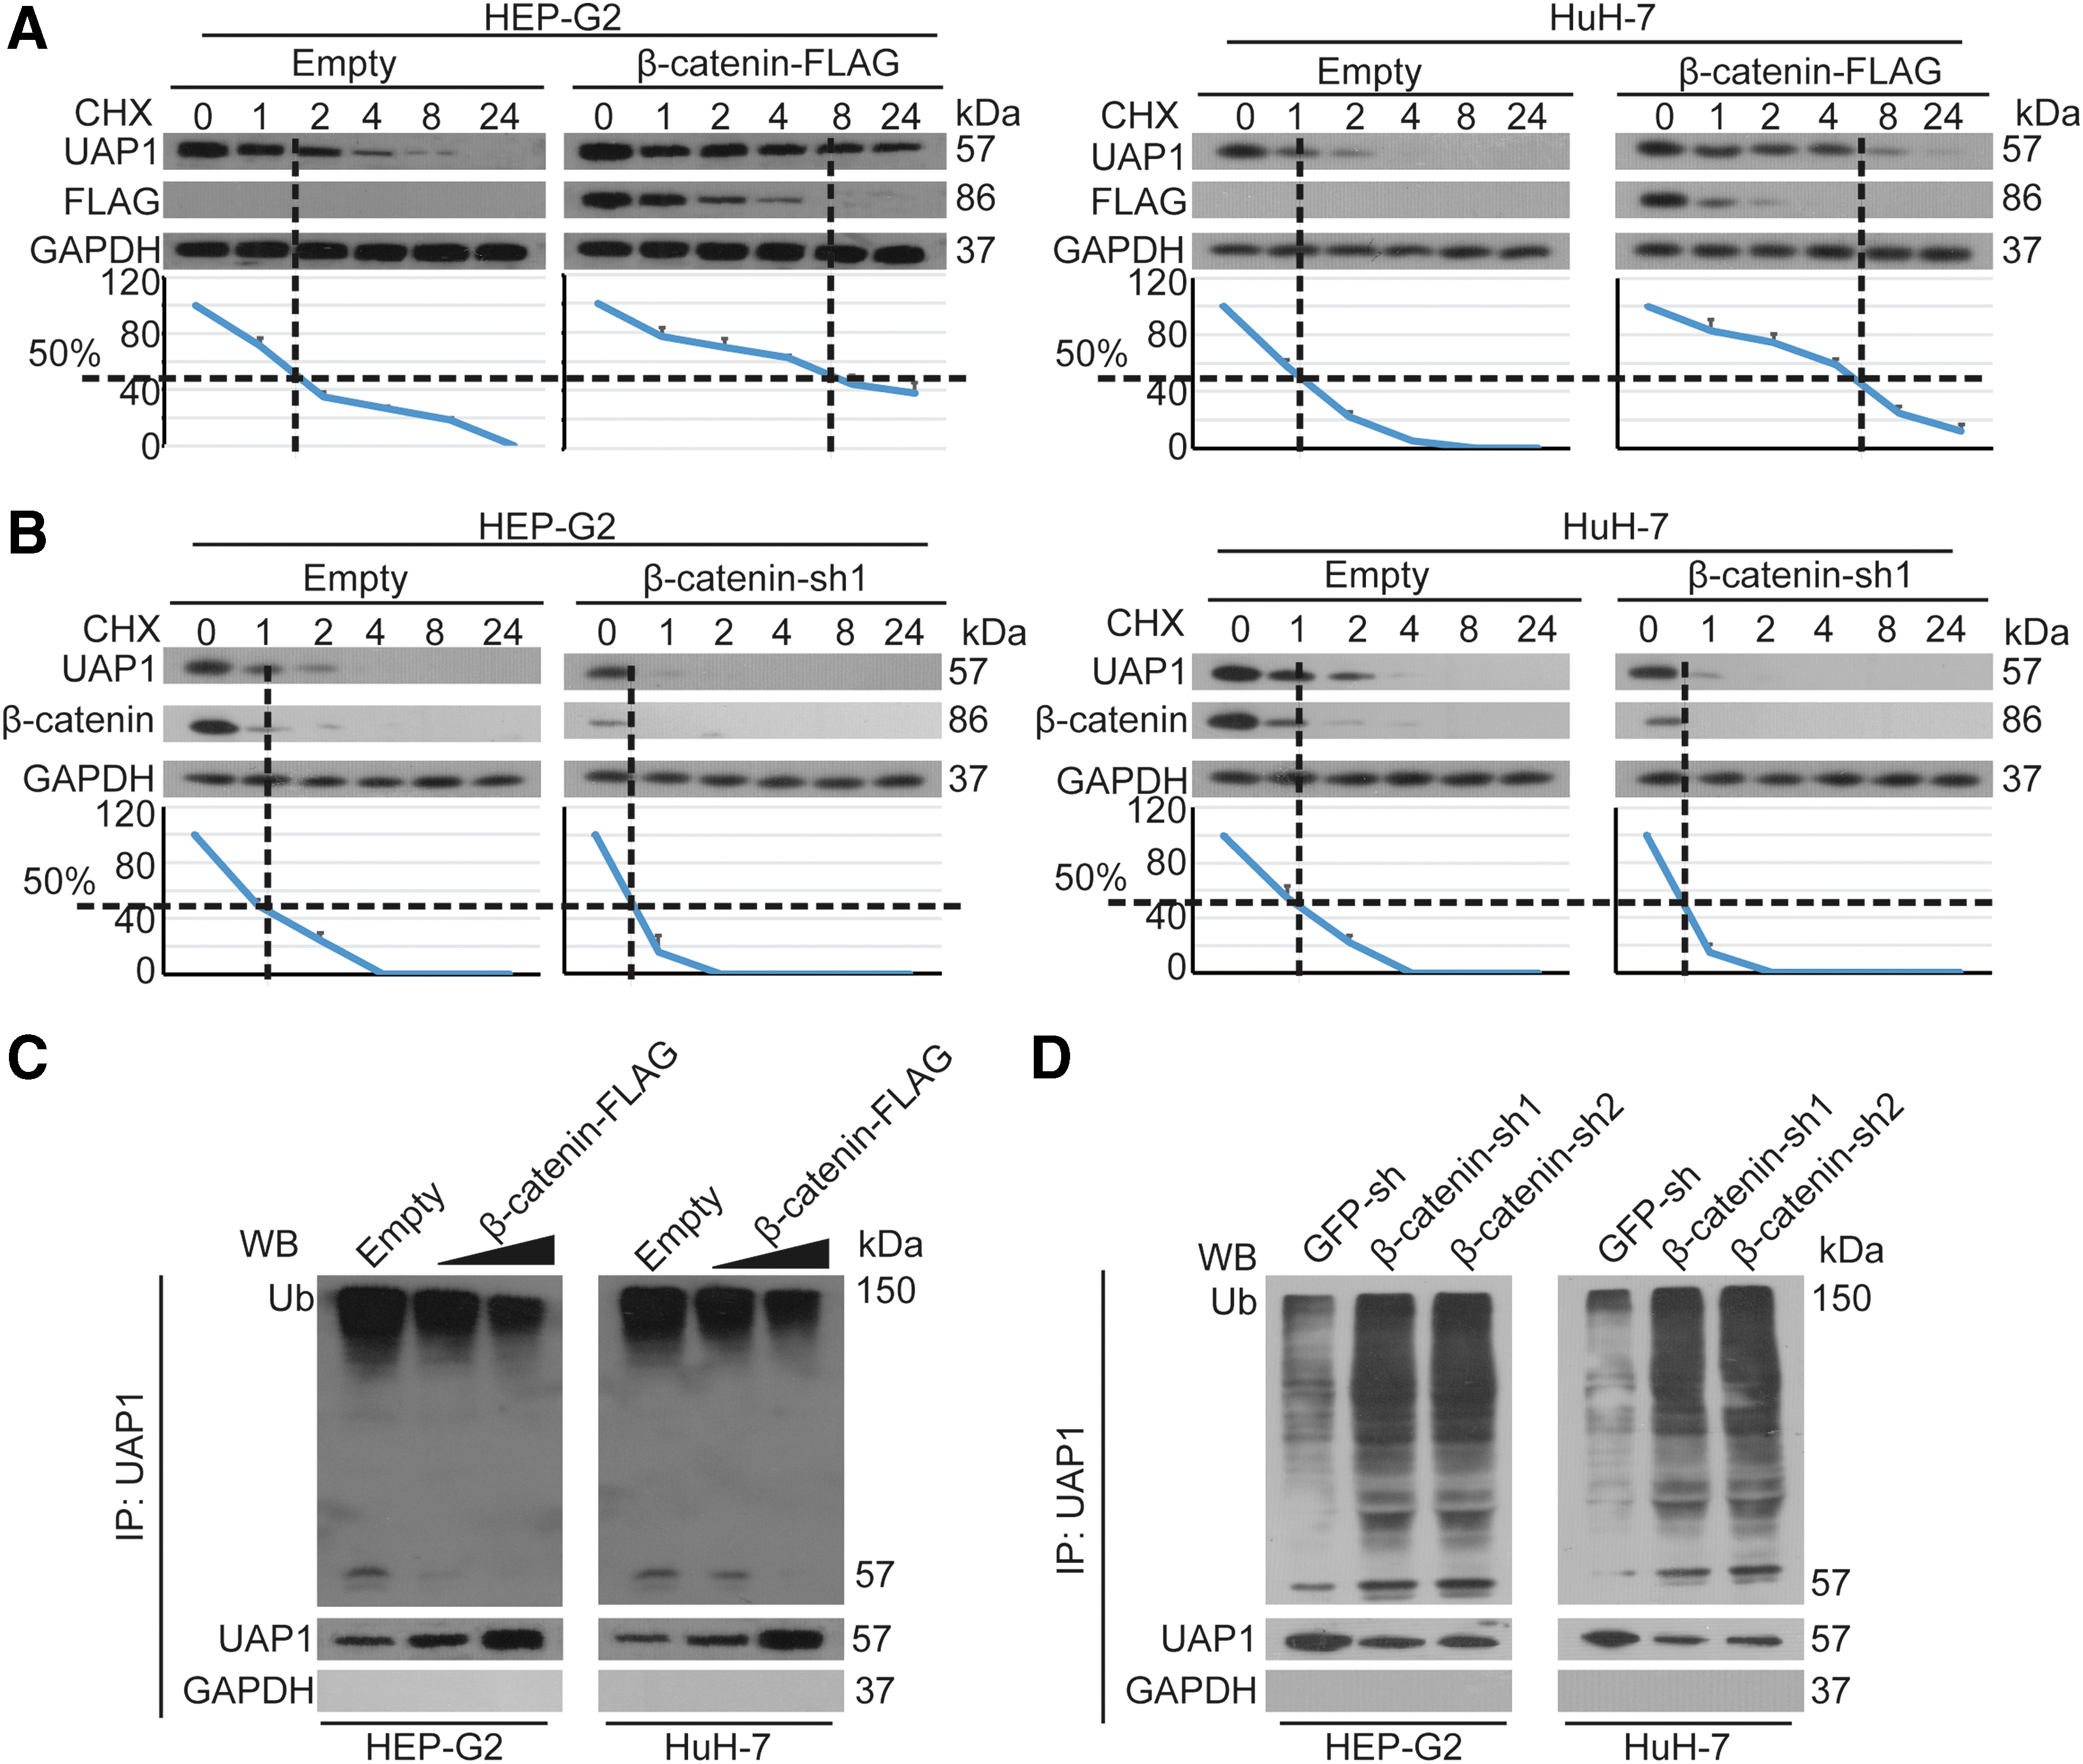
β-catenin increased the stability of UAP1.
β-catenin promotes HBP, the viability, and tumorigenesis of HuH-7 and HEP-G2 cells by the upregulation of UAP1
Then, we investigated whether β-catenin could affect HBP through UAP1. We found that the decreased intracellular glucose and glucose consumption caused by β-catenin knockdown could be reversed by simultaneous overexpression of UAP1 (Fig. 5A, B). The same phenomenon was also observed when detecting the intracellular acetyl-CoA and F-6-P with the same treatment in HuH-7 and HEP-G2 cells (Fig. 5C, D). Further, we found that the decreased global O-GlcNAcylation resulting from β-catenin knockdown could also be reversed by UAP1 overexpression (Fig. 5E). Moreover, the results indicated that downregulation of β-catenin decreased the tumorigenesis of HuH-7 and HEP-G2 cells, while this effect was abolished during overexpression of UAP1 as demonstrated by cell proliferation (Fig. 5F), colony formation assays (Fig. 5G), and caspase-3/7 activity (Fig. 5H). We also found that the growth of xenografts with β-catenin knockdown was much smaller than that of the control xenografts, and this effect was also abolished while UAP1 was overexpressed (Fig. 5I). Overall, these results highlighted that β-catenin promoted the progression of liver cancer through upregulating UAP1 expression.
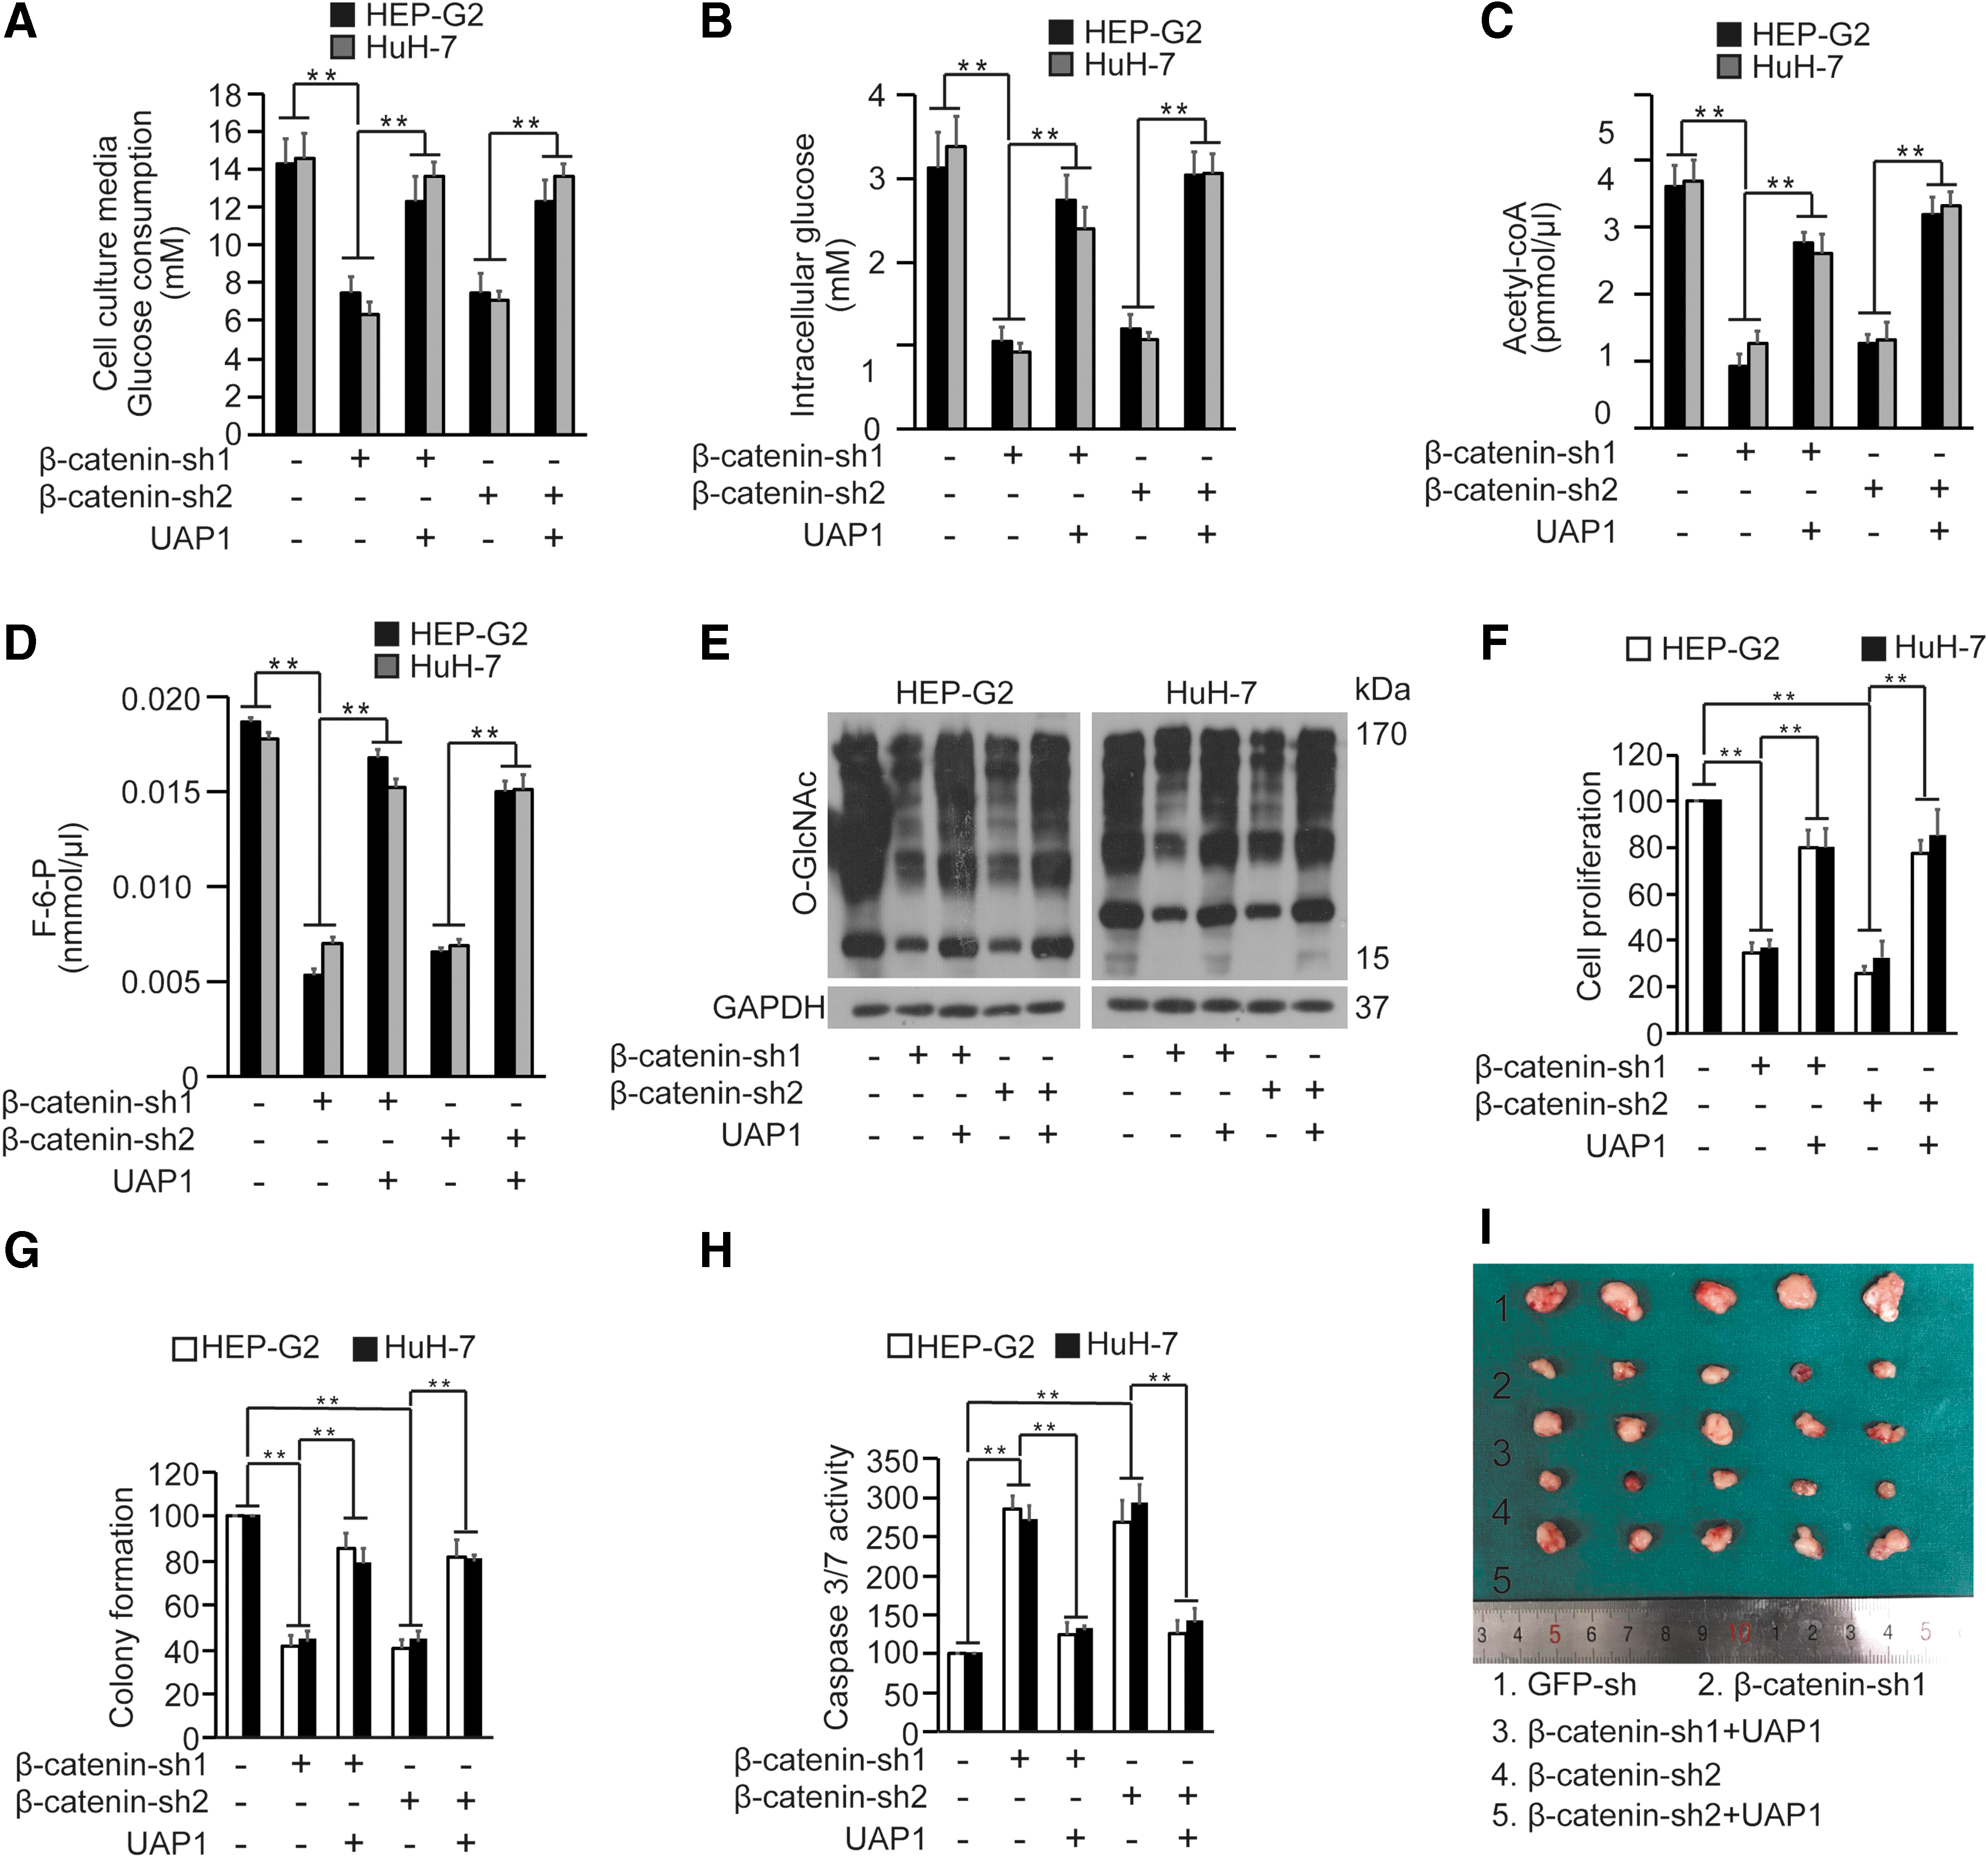
Upregulation of β-catenin facilitated HBP and promoted the proliferation, colony formation, and tumorigenesis of HuH-7 and HEP-G2 cells through UAP1.
Clinical significance of β-catenin, UAP1, and O-GlcNAc in liver cancer
Then, we investigated the clinical relationship between β-catenin, UAP1, and O-GlcNAc using 208 liver cancer specimens. The results suggested that a positive relationship existed among β-catenin, UAP1, and O-GlcNAc (Fig. 6A, B). Besides, the Kaplan–Meier curves indicated that patients suffering from liver cancer with higher levels of β-catenin, UAP1, and O-GlcNAc had a worse survival outcome compared with those with lower ones (Fig. 6C). These results indicated that β-catenin, UAP1, and O-GlcNAc were closely related to the clinical outcome of liver cancer patients.
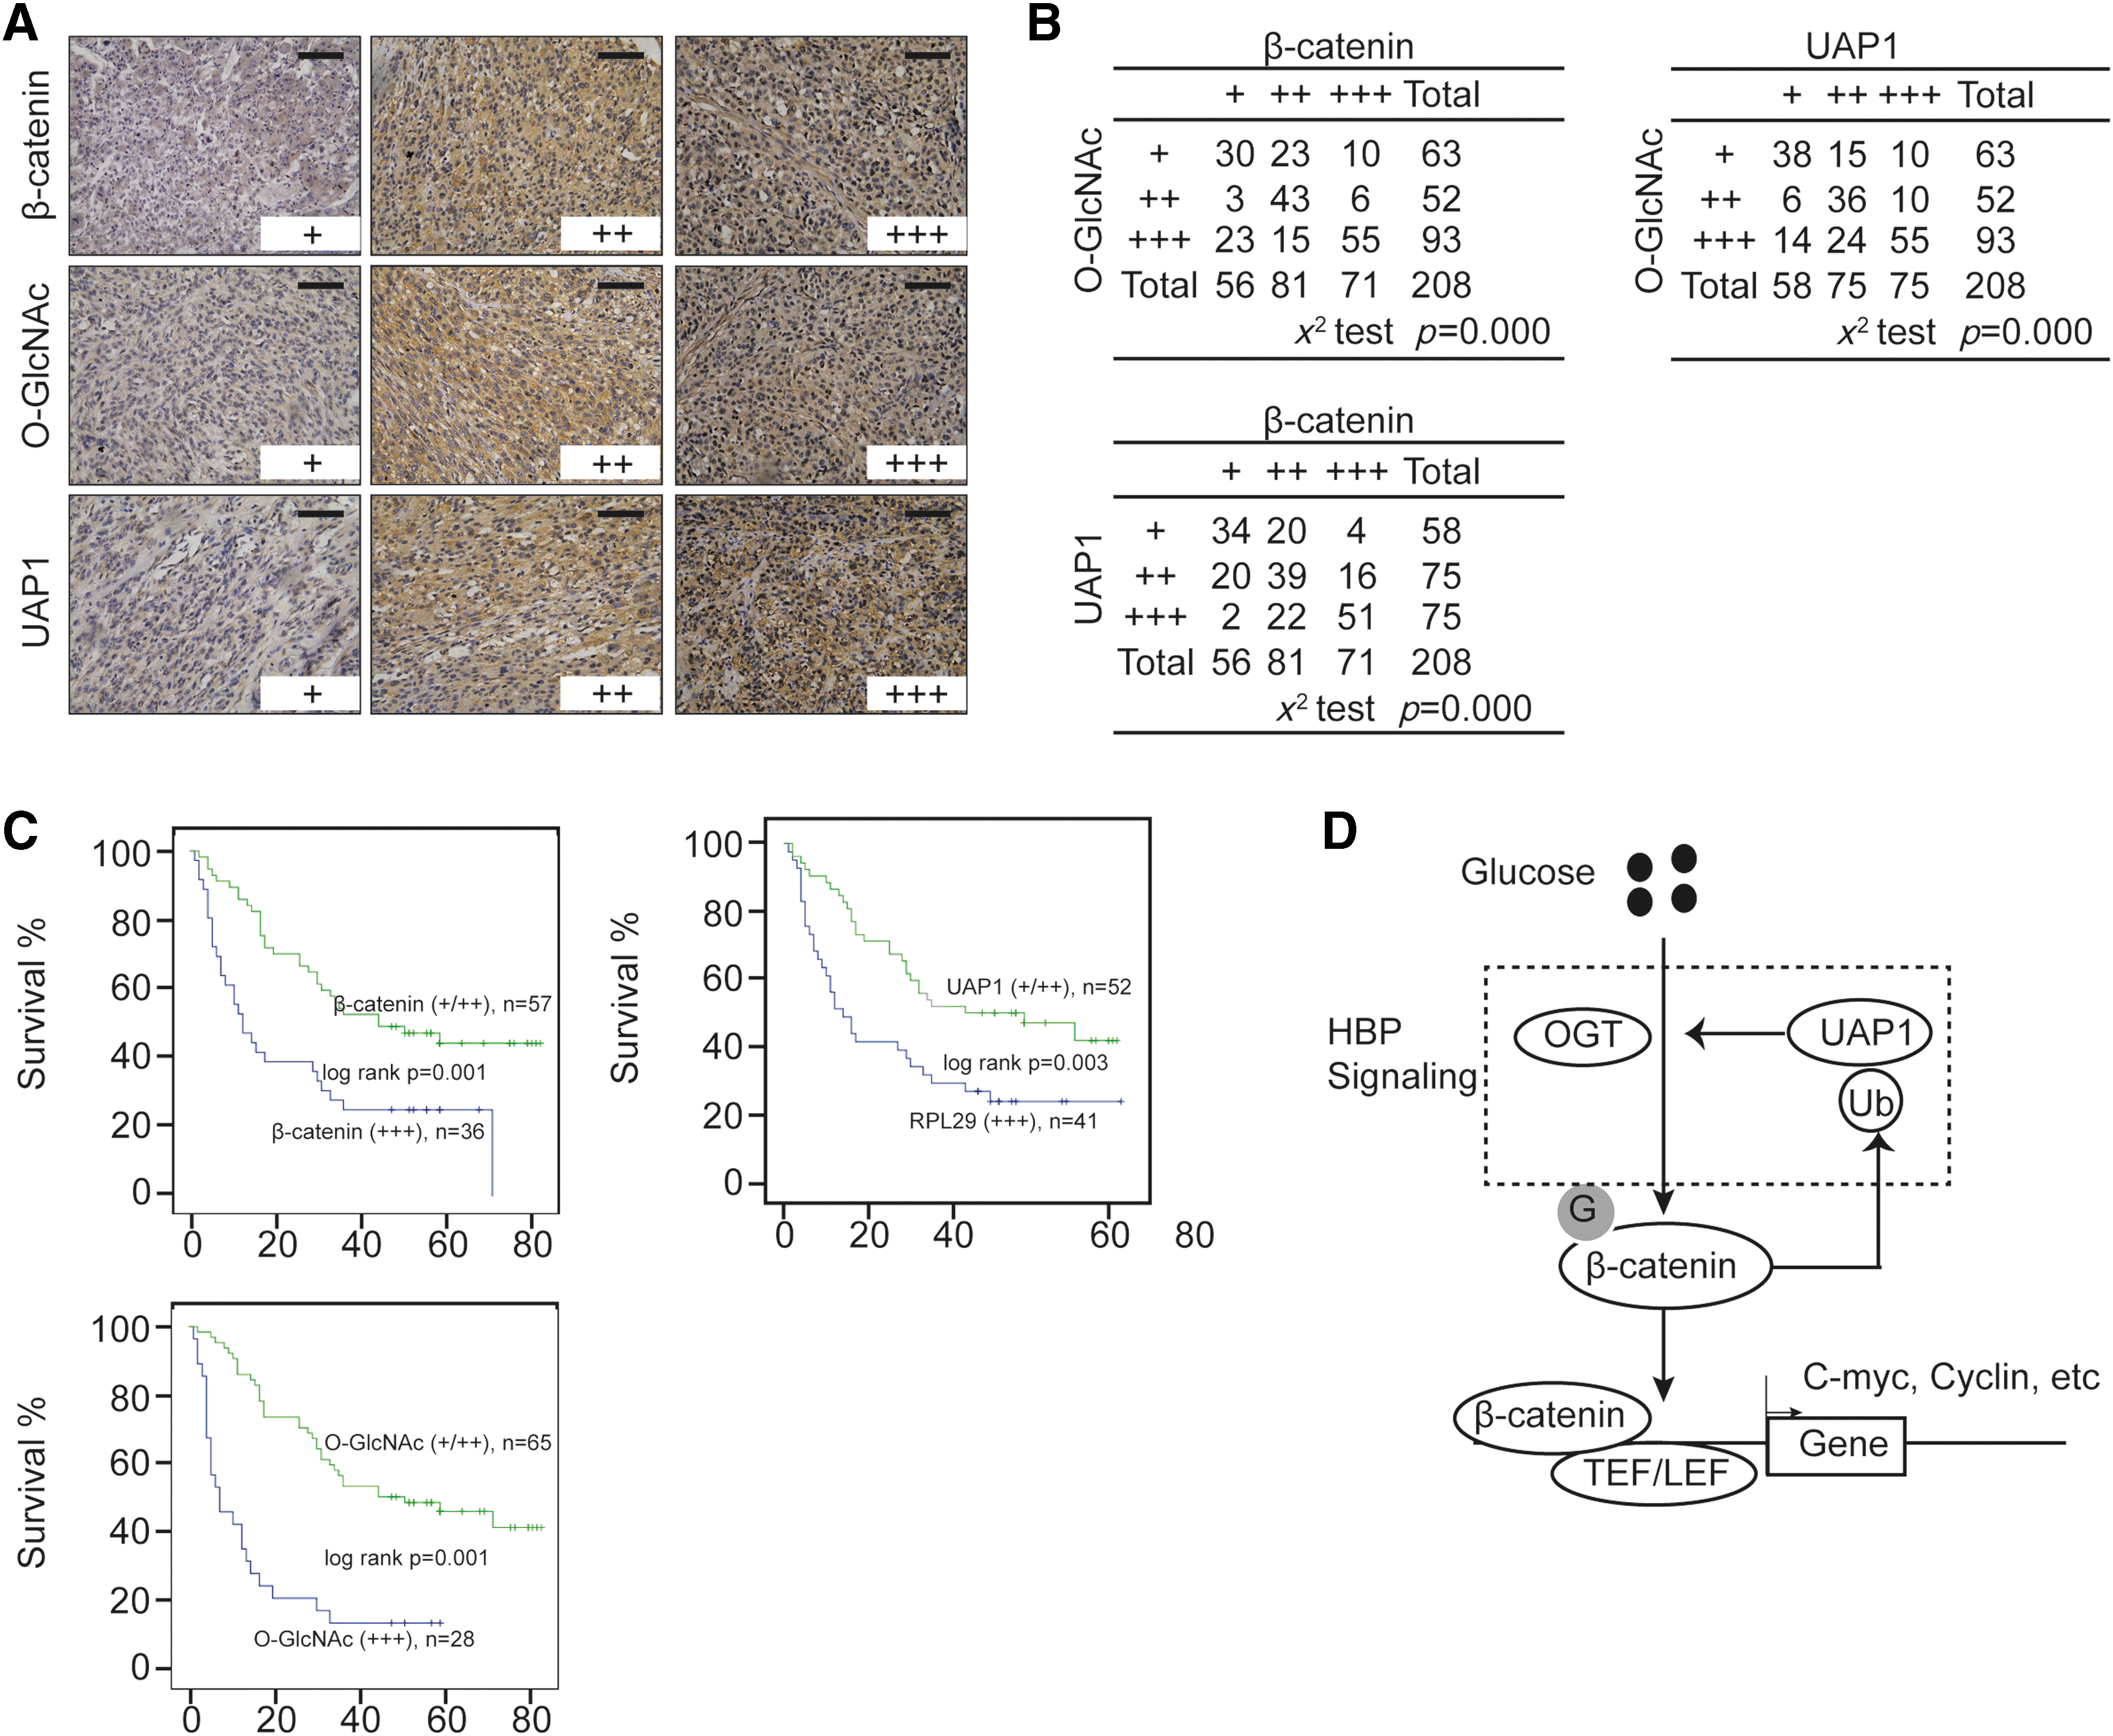
Clinical significance of β-catenin, UAP1, and O-GlcNAc.
Discussion
High-glucose–high-fat diet, which is characterized by junk-food diets, low-energy expenditure, and metabolic disorders, can significantly increase the risk of cancer (Dossus and Kaaks, 2008). It is interesting to note that O-GlcNAcylation is elevated in liver cancer-derived tissues and cells, and plays a pivotal role in the progression of advanced liver cancer (Yao et al., 2016; Zhang et al., 2017a). This study demonstrated for the first time the protein–protein interaction between O-GlcNAc and β-catenin, which could promote their expression and subsequently enhance the proliferation of liver cancer cells and their colony formation and tumorigenesis. This interaction could also repress apoptosis. Notably, after upregulation of the O-GlcNAc levels that were induced by glucose, PuGNAc or GlcNAc significantly enhanced the protein expression and stability of β-catenin, and increased its nuclear accumulation. In contrast to these effects, overexpression of β-catenin increased O-GlcNAc expression by upregulating UAP1 protein expression and stability, and by decreasing the ubiquitination and consequently the degradation of this protein.
The majority of hepatic tumors, including hepatocellular adenomas, hepatoblastomas, and hepatocellular carcinomas, exhibit constitutive activation of β-catenin, which leads to the excessive proliferation of cancer cells (Monga, 2015; Lu et al., 2017). This suggests that the regulatory mechanism of β-catenin may provide a potent target for the treatment of liver cancer. In this study, we used different concentrations of glucose (5.5, 15, and 40 mM), PuGANc, and GlcNAc to increase the protein expression of O-GlcNAc in the liver cancer cell lines HEP-G2 and HuH-7. The data demonstrated that the protein expression and stability of β-catenin were also enhanced, while their mRNA levels were unaffected. We propose that competitive combination of the glycosylation site and ubiquitination site of β-catenin protein may exist. Hence, the glycosylation reaction may enhance the stability of β-catenin through the suppression of its ubiquitination. In addition, this study was consistent with findings that have been reported previously. For example, Oliviervan et al. (2014) reported that upregulation of O-GlcNAcylation induced by knockdown of OGA increased the stability of β-catenin in colon cancer cells. Harosh-Davidovich and Khalaila (2018) demonstrated that a global elevation of protein O-GlcNAcylation and an increase in the expression of β-catenin were found when OGA was inhibited. Subsequently, the transcriptional activity of β-catenin was elevated concomitantly, which in turn enhanced fibroblast cell motility.
During the biological progression of cancer, β-catenin is known to continuously shuttle between the cytosolic and nuclear compartments. This plays an oncogenic role when β-catenin is hyperactivated by Wnt signaling to induce its nuclear accumulation (Wei et al., 2012). This study demonstrated that O-GlcNAcylation promoted the nuclear accumulation of β-catenin. However, our finding was not in accordance with a previous study (Sayat et al., 2008), which indicated that the levels of β-catenin in the nucleus were reduced with increasing levels of O-GlcNAcylation caused by PuGNAc treatment in prostate cancer cells. Sayat et al. (2008) speculated that O-GlcNAcylation might alter the tertiary conformation of β-catenin, so that the protein's shuttling between the cytosolic and nuclear compartments becomes compromised, which effectively restricts the protein to the compartment in which it was modified. Interestingly, Oliviervan et al. (2014) reported that upregulation of O-GlcNAcylation increased the stability of β-catenin in colon cancer cells, as we mentioned above. The results observed in these two studies were controversial, which suggested that the same protein or its post-transcriptional modification may play different roles in different tissues and diseases. This discrepancy could be attributed to the difference in the cell types, which could display opposite outcomes. Thus, we investigated the O-GlcNAcylation of β-catenin in liver cancer cells to confirm the potential roles in liver cancer.
Furthermore, we demonstrated that β-catenin could conversely regulate HBP and O-GlcNAcylation, and that it promoted the progression of liver cancer. UAP1 was shown to participate in this process. UAP1 is a crucial enzyme required for O-GlcNAcylation, which promotes the synthesis of UDP-GlcNAc, a metabolite of the HBP (Itkonen et al., 2015). This is the first study that established that UAP1 might play a pivotal role during the regulation of O-GlcNAcylation by β-catenin. As β-catenin is well known to be a coactivator in promoting gene transcription, we further hypothesized that it might affect the expression of UAP1 through the activation of certain transcription factors. The transcription factor lymphoid-enhance-binding factor 1 (LEF-1) is a key molecule in the β-catenin signaling pathway. And if we want to confirm that whether LEF-1 plays an important role in this process, or if we want to identify the possible transcription factors involved, a mass spectrometry analysis of β-catenin and UAP1 binding proteins should be conducted to get the intersection elements in our further study. Further, after getting the intersection elements (protein X) by a mass spectrometry analysis of β-catenin and UAP1 binding proteins, we should identify if protein X are required for β-catenin or O-GlcNAcylation-induced malignancy. Then we should investigate if protein X are responsible for the O-GlcNAcylation regulated by β-catenin. Finally, a detailed mechanism should be explored. However, our experiment indicated that β-catenin might stimulate UAP1 protein expression through a post-transcriptional mechanism (Fig. 3G–J), by which the ubiquitination of UAP1 was reduced (Fig. 4C, D).
In summary, this study demonstrated that the protein–protein interactions between O-GlcNAc and β-catenin accelerated the development of liver cancer, which adds information with regard to the interaction between the glucose metabolic deregulation and the progression of liver cancer. This study may provide a plausible explanation for the association between diabetes and liver cancer.
Footnotes
Acknowledgment
This study was supported by the Shanghai New Interdisciplinary Subject Funding Program of TCM: Molecular Hepatology of TCM (#2017-2020).
Disclosure Statement
No competing financial interests exist.