
Abstract
Proper course of folliculogenesis and oogenesis have an enormous impact on female fertility. Both processes take place in the ovary and involve not only the maturing germ cell, but also few types of somatic cells that assist the ovarian processes and mediate the dialog with the oocyte. These cells, granulosa and theca, are heavily involved in essential reproductive processes, such as ovulation, fertilization, and embryo implantation. In this study, we have used the expressive microarray approach to analyze the transcriptome of porcine granulosa cells, during short-term in vitro culture. We have further selected differentially expressed gene ontologies, involved in cell proliferation, migration, adhesion, and tissue development, namely, “cell–cell adhesion,” “cell motility,” “cell proliferation,” “tissue development,” and “tissue migration” to screen them for the possibility of discovery of new markers of those processes. A total of 303 genes, expression of which varied significantly in different culture periods and belonged to the analyzed ontology groups, were detected, of which 15 that varied the most (between 0 and 48 h of culture) were selected for validation. As the validation confirmed the transcriptomic patterns, 10 genes of biggest changes in expression (CAV1, IGFBP5, ITGB3, FN1, ITGA2, LAMB1, POSTN, FAM83D, KIF14, and CDK1) were analyzed, described, and referred to the context of the study, with the most promising new markers and further proof for the viability of the currently recognized ones detailed. Overall, the study provided valuable insight into the molecular functioning of in vitro granulosa cell cultures.
Introduction
Oocyte development is supervised by its paracrine interactions with granulosa cells. This communication leads to the establishment of bidirectional cooperation affecting the hormonal production and the expression of genes associated, that is, with follicular development (Matzuk et al., 2002; Uyar et al., 2013). Although the function of granulosa cells is well recognized, there are still many ambiguities concerning their regulation by different genes.
Furthermore, female fertility is largely dependent on the proper oocyte development. Interactions of mammalian gametes with the surrounding somatic cells are important for the success of folliculogenesis and fertilization, which are closely regulated by complex signaling events mediated through various genes, proteins, and enzymes (Matzuk et al., 2002; Rybska et al., 2018a). These processes cause the differentiation of the ovarian follicle from primordial, through primary and secondary, into the mature Graafian follicle (Uyar et al., 2013; Rybska et al., 2018b). It was proven that proper follicular physiology is required for complete oocyte maturation.
Moreover, the granulosa cells, apart from building the follicle, express a range of endocrine factors that influence its function (Matzuk et al., 2002; Jankowski et al., 2018). It was proven that only the properly matured Metaphase II (MII) oocytes are able to fully support fertilization (Wu et al., 2001; Kranc et al., 2017). As it is known that there are many genes involved in the maturation of the follicle, among which many are still not properly recognized, our study aims to analyze the expression of the genes involved in cell motility, belonging to “cell proliferation,” “cell–cell adhesion,” and “tissue development” gene ontologies. Changes in expression of these genes will be evaluated in porcine ovarian granulosa cells subjected to short-term in vitro culture.
This should help to broaden the knowledge about the influence of the in vitro environment on the ovarian granulosa cells, giving a point of reference for future studies concerning in vitro maturation of the oocytes, in vitro fertilization techniques, and assisted reproduction technologies.
Materials and Methods
Animals
A total of 40 crossbred Landrace gilts with a median age of 170 days and weight of 98 kg were used in this study. All animals were housed under identical conditions. The experiment was approved by Poznan University of Medical Sciences Bioethical Committee by resolution 32/2012.
Collection of porcine ovaries and in vitro culture of granulosa cells
Ovaries (n = 80) and reproductive tracts were recovered at slaughter and transported to the laboratory at 38°C in 0.9% NaCl within 30 min. The ovaries of each animal were placed in phosphate-buffered saline supplemented with fetal bovine serum (Sigma-Aldrich Co., St. Louis, MO). Thereafter, single preovulatory large follicles, with an estimated diameter >5 mm (n = 300), were opened into a sterile Petri dish by puncturing with a 5 mL syringe and 20-G needle, with the cumulus–oocyte complexes (COCs) and follicular fluid (FF) recovered. The granulosa cells (GCs) were extracted from the FF, whereas the COCs were discarded.
Culture medium consisted of Dulbecco's modified Eagle's medium (Sigma-Aldrich) supplemented with 2% fetal calf serum (PAA, Linz, Austria) and
Microarray expression analysis
The Affymetrix procedure was performed as previously described (Kranc et al., 2017, 2018a, 2018b; Bryja et al., 2018; Chamier-Gliszczyńska et al., 2018; Stefańska et al., 2018; Nawrocki et al., 2018). cDNA was reverse transcribed from total sample RNA (100 ng) (Ambion® WT Expression Kit). The obtained cDNA was biotin labeled and fragmentated by Affymetrix GeneChip® WT Terminal Labeling and Hybridization (Affymetrix). Biotin-labeled fragments of cDNA (5.5 μg) were hybridized to the Affymetrix® Porcine Gene 1.1 ST Array Strip (48°C/20 h). Then, microarrays were washed and stained according to the technical protocol using Affymetrix GeneAtlas Fluidics Station. Subsequently the array strips were scanned by Imaging Station of GeneAtlas System. The preliminary analysis of the scanned chips was performed using Affymetrix GeneAtlas™ Operating Software.
The quality of gene expression data was checked according to quality control criteria provided by the software. The obtained CEL files were imported into downstream data analysis software. All presented analyses and graphs were performed by Bioconductor and R programming language. Each CEL file was merged with a description file. To correct the background, normalize, and summarize results we used Robust Multiarray Averaging algorithm.
The selection of significantly changed gene expression was based on p-value <0.05 and expression fold >2. Differentially expressed gene list (separately for up- and downregulated) were uploaded to Database for Annotation, Visualization and Integrated Discovery (DAVID) software, with the enriched Gene Ontology terms extracted. Among Enriched Gene Ontology terms, we have chosen those containing at least five genes and p < 0.05. Expression data of genes within selected Gene Ontology Biological Process (GO BP) terms was subjected to hierarchical clusterization procedure and presented as heatmaps.
To further investigate the chosen gene sets, we analyzed their mutual relations using the GOplot package (Walter et al., 2015). Moreover, GOplot package allowed us to calculate the z-score (the number of upregulated genes minus the number of downregulated genes divided by the square root of the count). Z-score analysis allowed us to compare the enrichment of selected GO BP terms.
Moreover, the interactions between proteins coded by selected genes, and the genes themselves, were investigated by the STRING10 software. Search Tool for the Retrieval of Interacting Genes (STRING) database contains information of protein/gene interactions, including experimental data, computational prediction methods, and public text collections. STRING database engine provided molecular interaction network formed between genes of interest. Search criteria were based on co-occurrences of genes/proteins in scientific texts (textmining), coexpression, and experimentally observed interactions.
Finally, the functional interactions (FIs) between genes that belong to the chosen GO BP terms were investigated by ReactomeFIViz application of the Cytoscape 3.6.0 software. The ReactomeFIViz app is designed to find pathways and network patterns related to cancer and other types of diseases. This app accesses the pathways stored in the Reactome database, allowing to do pathway enrichment analysis for a set of genes, visualizing hit pathways using manually laid-out pathway diagrams directly in Cytoscape, and investigating functional relationships among genes in hit pathways. The app can also access the Reactome FI network, a highly reliable, manually curated pathway-based protein FI network covering >60% of human proteins.
Real-time quantitative polymerase chain reaction analysis
Total RNA was isolated from GCs using an RNeasy mini column from Qiagen GmbH (Hilden, Germany). The RNA samples were resuspended in 20 μL of RNase-free water and stored in liquid nitrogen. In the next step, RNA samples were treated with DNase I and reverse transcribed into cDNA. In the presented study, only samples with absorbance ratio 260/280 higher than 1.8 have been used.
Real-time quantitative polymerase chain reaction (RT-qPCR) was conducted in a LightCycler real-time PCR detection system (Roche Diagnostics GmbH, Mannheim, Germany) using SYBR® Green I as a detection dye, with target cDNA quantified using the relative quantification method. The relative abundance of gene transcripts in each sample was standardized to housekeeping genes: GAPDH, PBGD, and ACTB. For amplification, 1 μL of cDNA solution was added to 9 μL of QuantiTect® SYBR Green PCR (Master Mix Qiagen GmbH, Hilden, Germany) and primers (Table 1). One RNA sample of each preparation was processed without the RT reaction to provide a negative control for subsequent PCR.
Primers
Oligonucleotide sequences of primers used for real-time quantitative polymerase chain reaction analysis.
Statistical analyses
Statistical significance of studied genes was analyzed by moderated t-statistics from the empirical Bayes method. Obtained p-value was corrected for multiple comparisons using the Benjamini and Hochberg's false discovery rate. All the analyses were conducted using the Bioconductor Statistics package.
Results
Using Affymetrix Porcine Gene 1.1 ST Array Strip, the expression of 27558 transcripts was detected. Genes with fold change (FC) higher than abs |2| and with corrected p-value <0.05 were considered as differentially expressed. This set of genes consists of 3380 different transcripts.
Five gene ontology groups were inspected: (1) “cell motility,” (2) “cell proliferation,” (3) “cell–cell adhesion,” (4) “tissue development,” and (5) “tissue migration.” To best reflect the changes between ex vivo and in vitro, when choosing the genes, we compared their expression at the start and in 48 h of the culture. Hence, of the genes belonging to the analyzed groups, the most downregulated genes (between 0 and 48 h) were CDC20, CDK1, CENPF, FOXM1, KIF14, TACC3, TTK, FAM83D, CDC6, and DLGAP5. The following genes CAV1, TMOD1, TAGLN, CHI3L1, IGFBP5, ITGB3, LAMB1, FN1, ITGA2, and POSTN were the most upregulated (between 0 and 48 h). These genes were identified using the DAVID software. The DAVID software analysis showed that differently expressed genes belong to 344 GO BP terms (gene sets where adj. p-value was <0.05).
In this article we focused on the genes that belonged to “cell–cell adhesion,” “cell motility,” “cell proliferation,” “tissue development,” and “tissue migration” GO BP terms. These sets of genes were subjected to hierarchical clusterization procedure and presented as heatmaps (Fig. 1). On the heatmaps, color and intensity of the samples reflected the direction and intensity of the gene expression signal from the microarray.

Heat map representation of differentially expressed genes belonging to the “cell–cell adhesion,” “cell motility,” “cell proliferation,” “tissue development,” and “tissue migration” GO BP terms. Arbitrary signal intensity acquired from microarray analysis is represented by colors (green, higher; red, lower expression). Log2 signal intensity values for any single gene were resized to row z-score scale (from −2, the lowest expression to +2, the highest expression for single gene). GO BP, Gene Ontology Biological Process. Color is available online.
All gene symbols, FCs in expression, Entrez gene IDs, and corrected p-values of the genes are given in Supplementary Table S1. Based on the information from the table, most down- and upregulated genes were selected.
To further investigate the changes within chosen GO BP terms we measured the enrichment levels of each selected GO BP term. The enrichment levels were expressed as z-score and presented as circular visualization (Fig. 2).

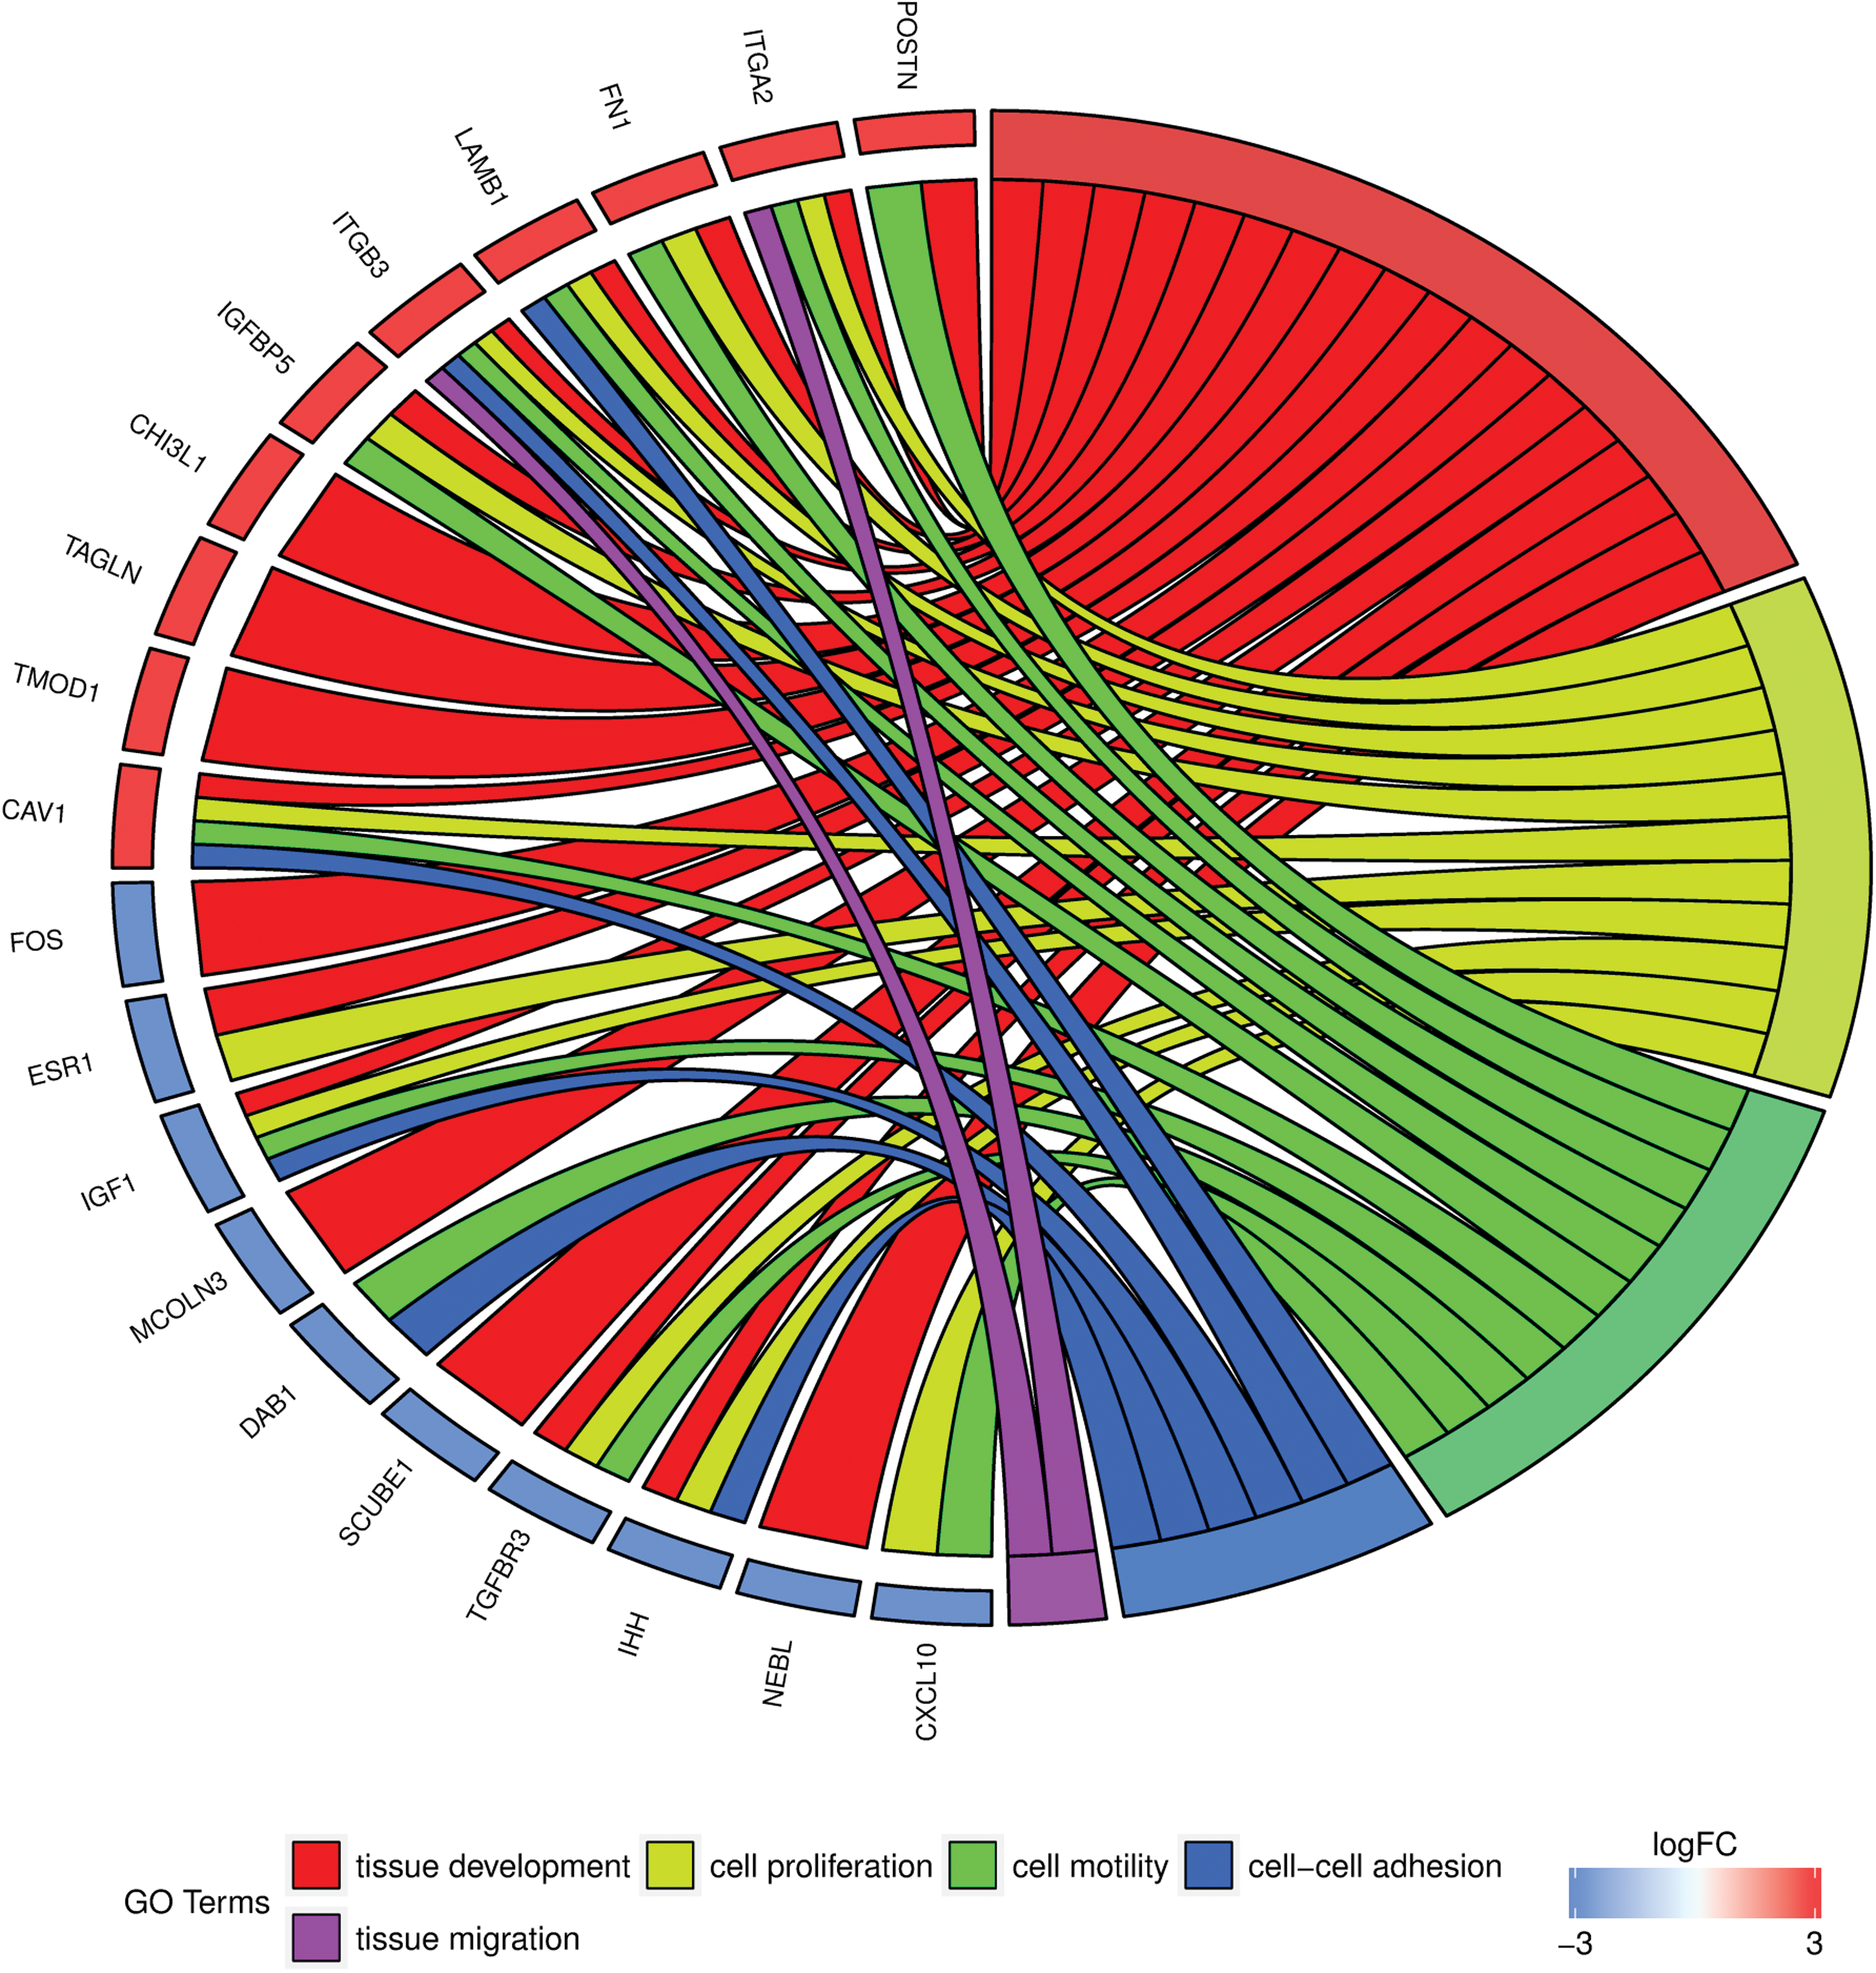
Circular visualization of the results of gene annotation enrichment analysis. The outer circle shows a scatter plot for each term of the logFC of the assigned genes. Red circles display upregulation and blue downregulation. The inner circle is the representation of z-score. The size and the color of the bar correspond to the value of z-score. Color is available online.
To better understand the interaction between chosen GO BP terms, hierarchical clusterization of the gene expression profiles was performed. The dendrogram was combined with FC of studied gene expression and gene assignment to studied terms (Fig. 3). All genes belonging to the ontologies of interest have been grouped based on their patterns of expression, as well as their mutual associations inside the ontological terms.

The representation of hierarchical clusterization, FC and assignment of differently expressed genes that belong to “cell–cell adhesion,” “cell motility,” “cell proliferation,” “tissue development,” and “tissue migration” GO BP terms. Genes are grouped together based on their expression patterns and the clusterization pattern is represented by dendrogram inside the circle. The middle ring represents the logarithm of gene expression FC of studied genes. The outer ring represents the terms assigned to the genes. FC, fold change. Color is available online.
In Gene Ontology database, genes that formed one particular GO group can also belong to other different GO term categories. Most of the selected genes belonged to more than one gene ontology. Hence, we have explored the gene intersections between selected GO BP terms. The relation between those GO BP terms was presented as a circle plot (Fig. 4) and heatmap (Fig. 5). ITGB3 was identified in five ontological groups, CAV1, ITGA2, and LAMB1 showed membership in four of the ontologies of interest. IGFBP5 belonged to three of those groups, and CDK1, KIF14, POSTN, FAM83D, and FN1 genes were found in two of the described ontological groups.
The representation of the mutual relationship between genes that belongs to “cell–cell adhesion,” “cell motility,” “cell proliferation,” “tissue development,” and “tissue migration” GO BP terms. The ribbons indicate which gene belongs to which categories. The genes were sorted by logFC from most to least changed gene, in the overall time of the cultures. Color is available online.
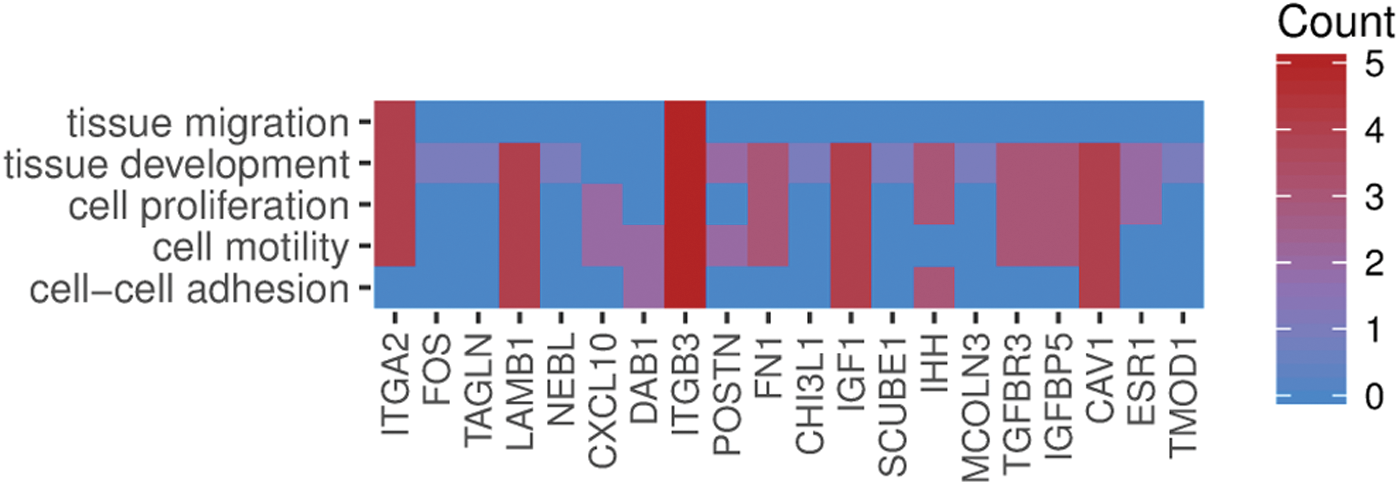
Heatmap showing the gene occurrence between genes that belongs to “cell–cell adhesion,” “cell motility,” “cell proliferation,” “tissue development,” and “tissue migration” GO BP terms. Red color indicates the gene occurrence in indicated GO BP term. The intensity of color correlates with the number of GO BP terms that selected gene belongs to. Color is available online.
STRING interaction network was generated among the 10 most upregulated and 10 most downregulated expressed genes belonging to selected GO BP terms. Using such prediction method provided us with a molecular interaction network formed between protein products of studied genes (Fig. 6). Most of the genes were shown to interact with each other, whereas the rest showed no connections. In the next step, the FIs between the chosen genes were investigated with REACTOME FIViz app to Cytoscape 3.6.0 software. The results are given in Figure 7. Only seven genes of interest showed FIs.
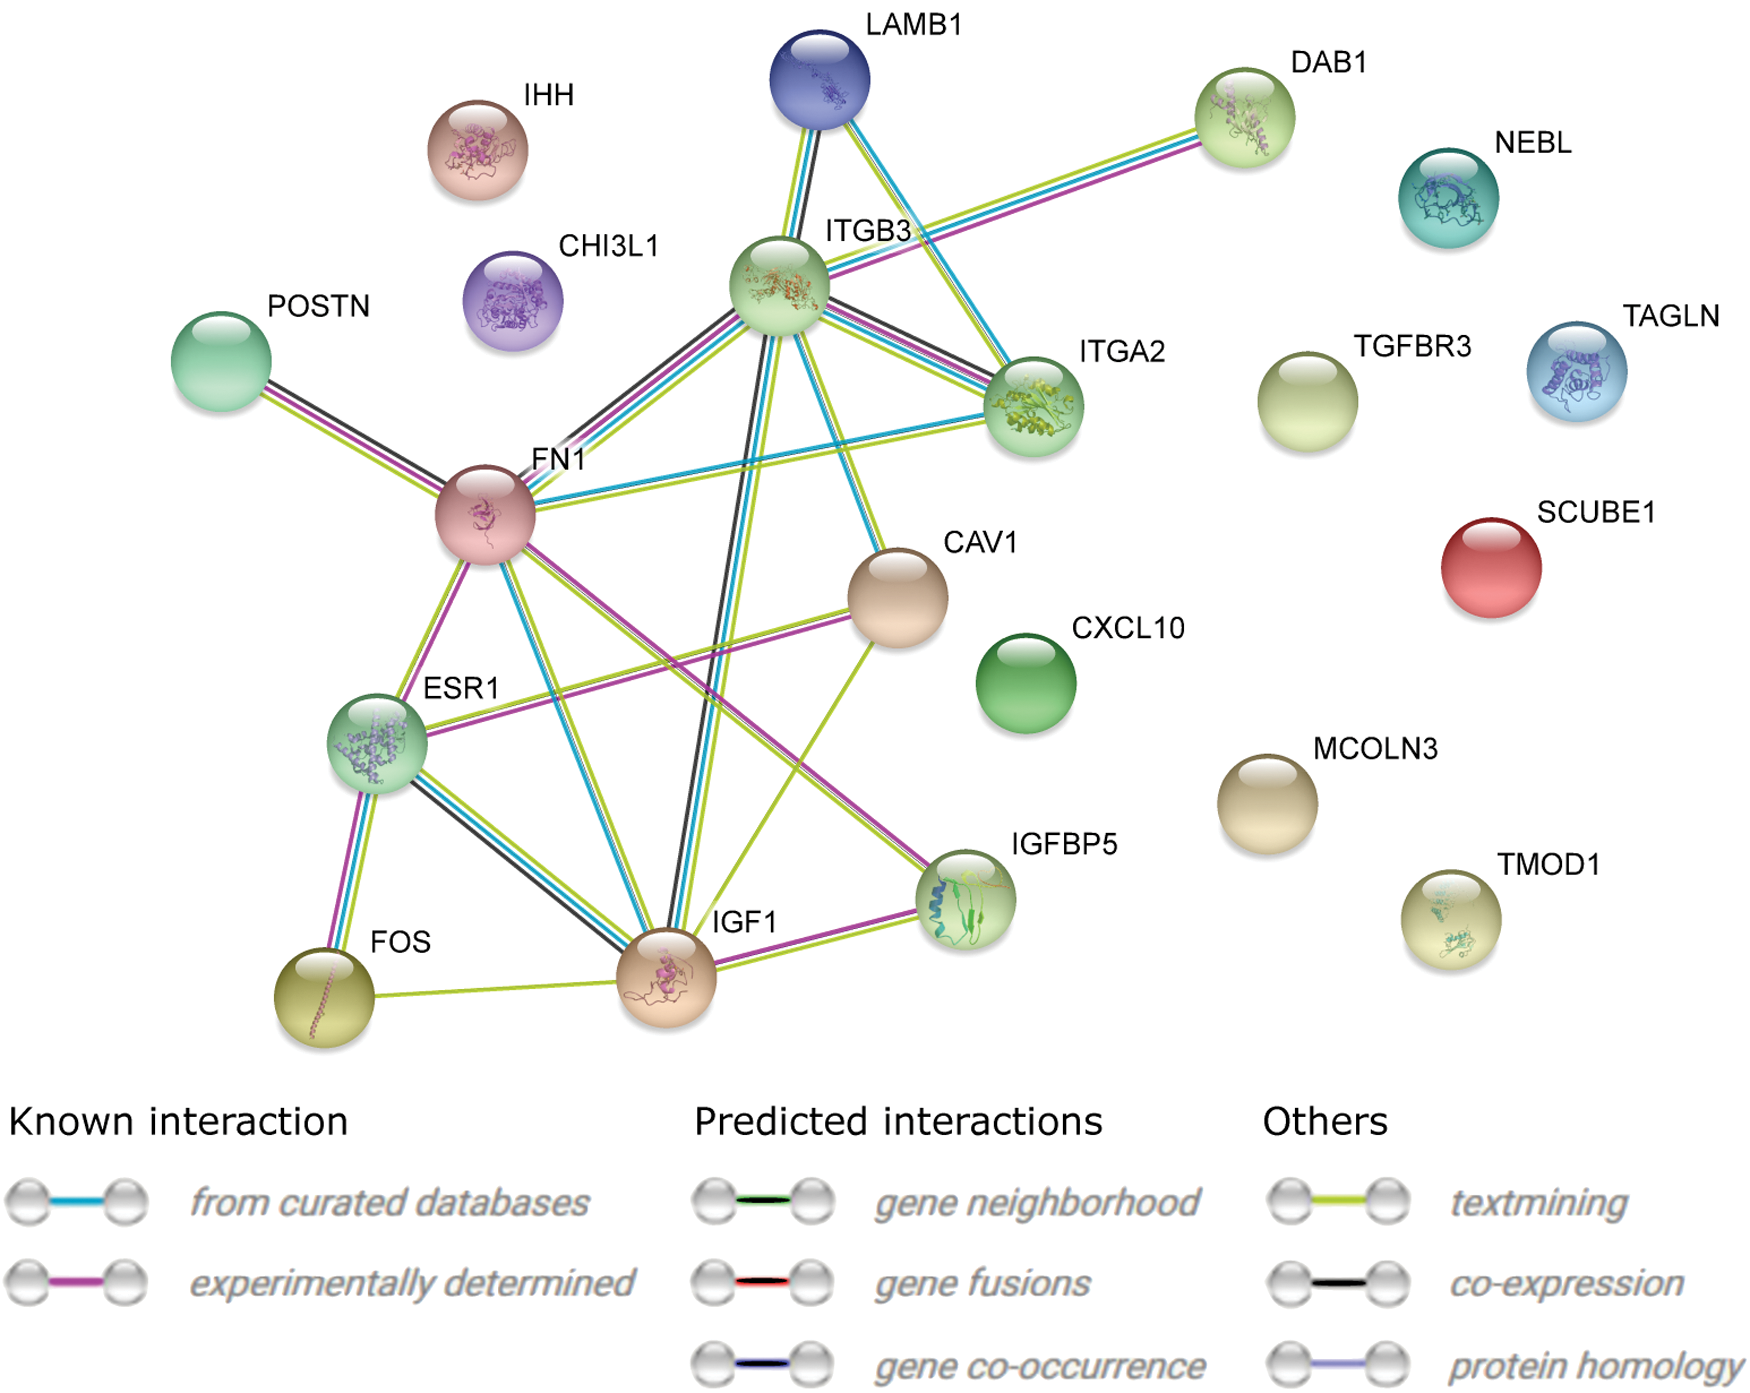
STRING-generated interaction network among differentially expressed genes belonging to the “cell–cell adhesion,” “cell motility,” “cell proliferation,” “tissue development,” and “tissue migration” GO BP terms. The intensity of the edges reflects the strength of interaction score. STRING, Search Tool for the Retrieval of Interacting Genes. Color is available online.

FI between genes that belongs to “cell–cell adhesion,” “cell motility,” “cell proliferation,” “tissue development,” and “tissue migration” GO BP terms. In the figure “->” represents activating/catalyzing, “-|” inhibition, “-” FIs extracted from complexes or inputs, and “—” predicted FIs. FI, functional interaction. Color is available online.
The results of RT-qPCR validation were compared with the data obtained from the microarray analysis and presented in the form of graph (Fig. 8)
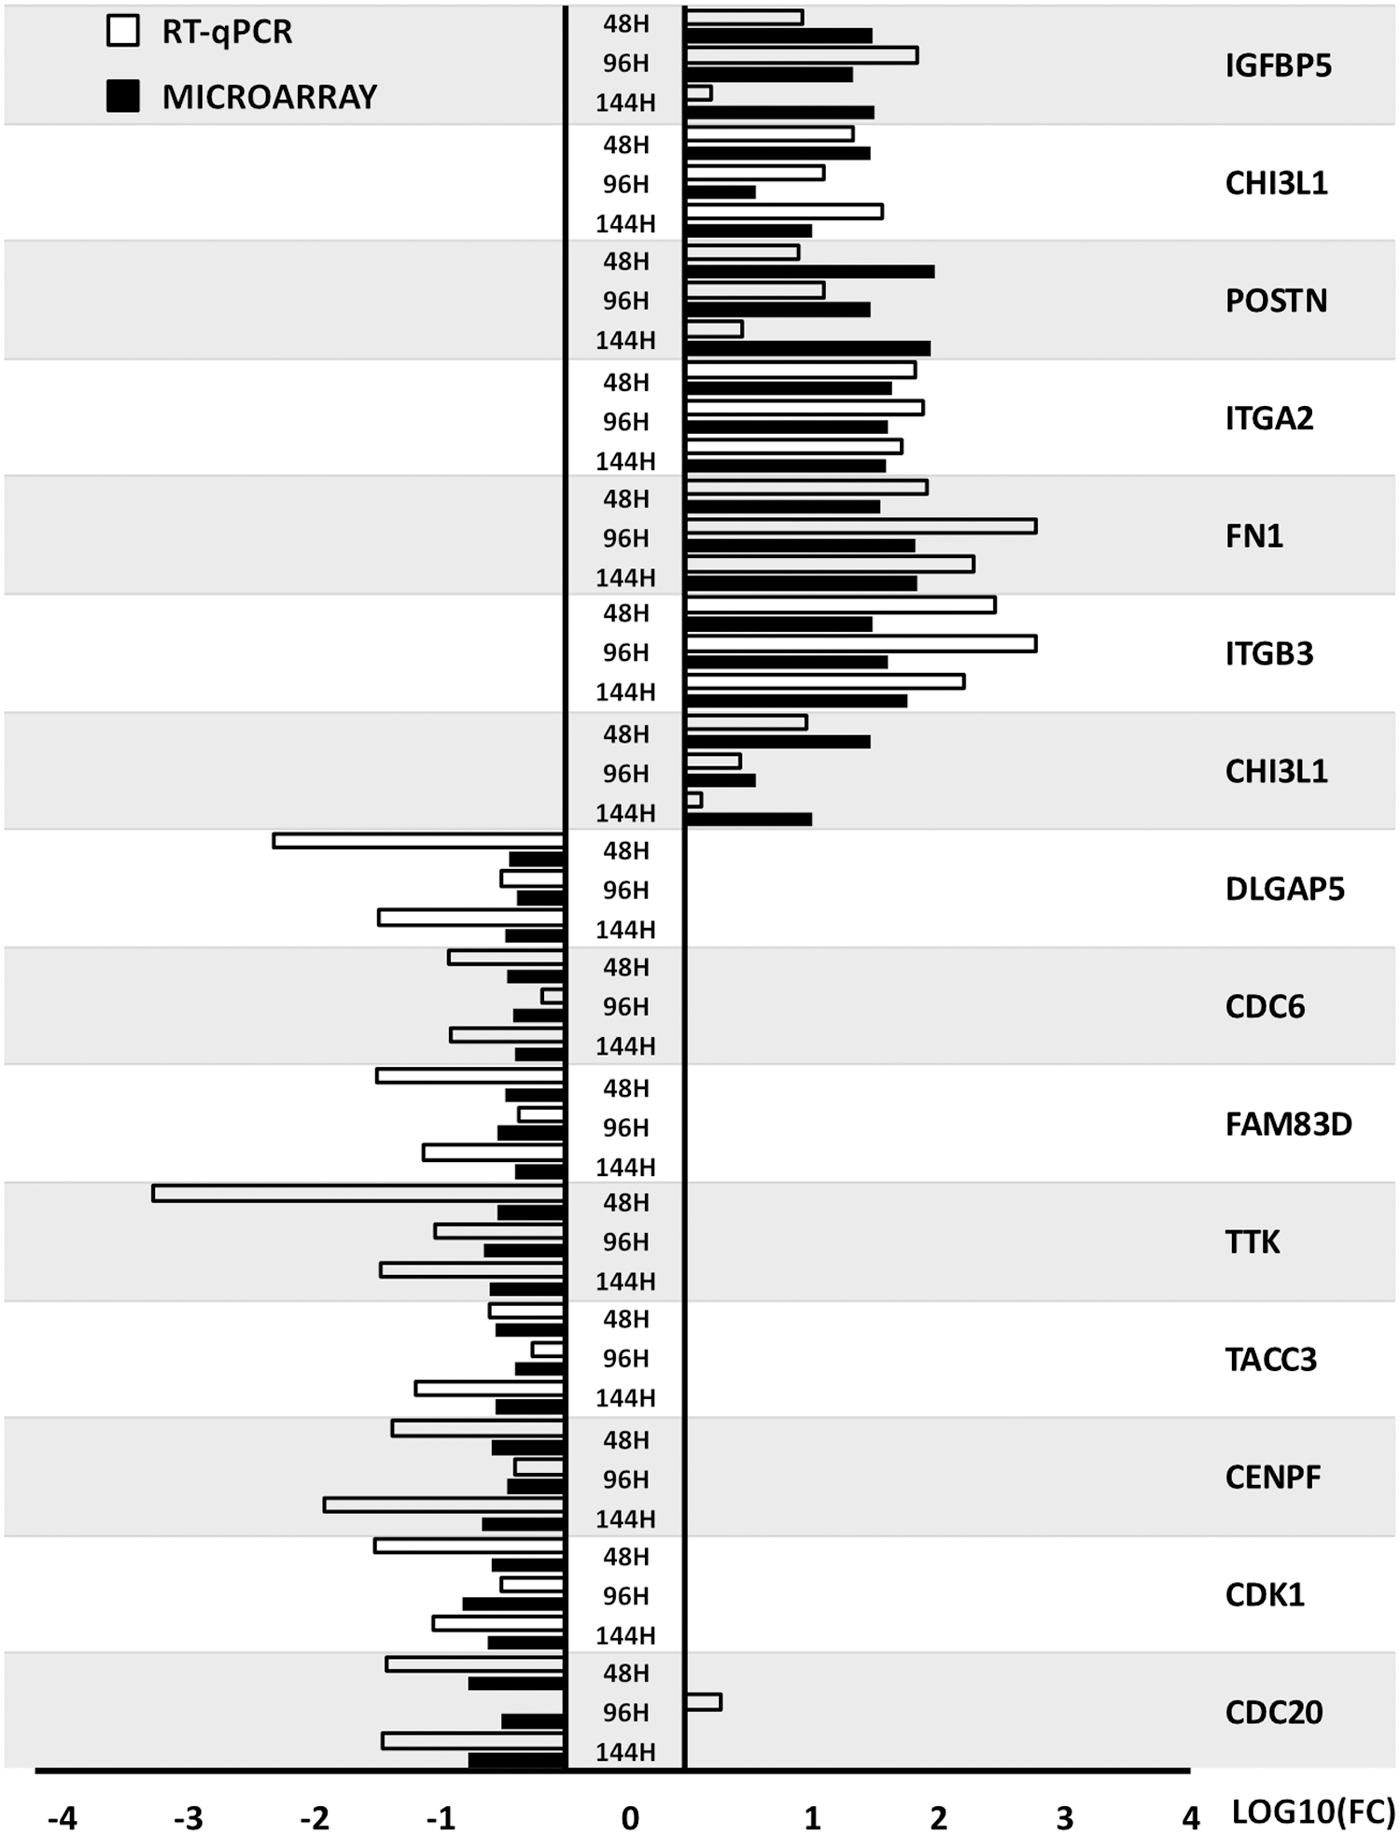
Comparison of RT-qPCR and microarray results presented in a form of a bar graph. RT-qPCR, real-time quantitative polymerase chain reaction.
The direction of changes of gene expression, obtained through microarray analysis, is validated in all but one example (CDC20; 96 h). This indicates that the microarrays were accurate in qualitative and general quantitative analysis, providing results that were confirmed by targeted RT-qPCR. However, the scale of changes varies between the methods, with RT-qPCR presenting generally higher changes in expression between the analyzed time periods. This proves that the qualitative side of microarrays needs RT-qPCR validation in research that requires analysis of the exact changes in gene expression.
Discussion
Microarray analyses identified a group of genes that were functionally associated with the studied cells/tissue, and those previously unassociated with any of the GC-associated processes. Some of these genes were chosen for description as potential markers of the in vitro processes analyzed in this study, based on the scale of their changes, mutual interactions, and membership in the gene ontologies of interest.
The first gene, CAV-1, belongs to four of the analyzed ontological groups. It encodes cavelin-1, which is a component of the caveolae cell membrane domains consisting of cholesterol and glycosphingolipid. Caveolae are cholesterol and sphingomyelin-rich plasma membrane microdomains presented in most types of mammalian cells and tissues. There is no firm statement on the function of caveolae, but it seems that they take part in lipid regulation and signal transduction (Razani et al., 2002). Caveolae are mostly identified in adipocytes and endothelial cells. Similar to our study, Bullejos et al. (2002) noticed that, in developing mouse ovaries, expression of CAV-1 became strongly upregulated, whereas remaining at low levels in the testis. Authors confirmed somatic expression of CAV-1 but did not exclude possible contribution toward germ cell function or maturation.
Laminin (LAMB1) is the second gene that was identified in all four ontological groups and was strongly upregulated during In Vitro Maturation (IVM). In all follicular stages, from primordial to the preovulatory follicular stage, the outer layer of GC lays on a basal lamina that is separating them from the theca layers and interstitial ovarian tissue. The basal lamina is built from components such as laminin, fibronectin, collagens, and glycoproteins and is remodeled during the development of follicles that results in the changes of its composition (Rodgers et al., 1999).
Laminin proteins are composed of extracellular matrix and take part in regulatory functions such as cell proliferation, differentiation, migration, and tissue repair (Li et al., 2017). Le Bellego et al. (2002) confirmed the presence of laminin in the basement membrane, granulosa, and theca cells of ovine antral follicles. In antral follicles of sheep, laminin is also present within the multilayered wall of GCs, with its levels increased in antral follicles during the follicular and preovulatory phases of the cycle. Sheep studies have shown that laminin stimulates the proliferation of GCs from small antral follicles while also increasing the secretion of progesterone that might influence the luteinization process (Huet et al., 1997). This indicates that laminin plays its role in the regulation of the development of antral follicles.
Both these genes are well recognized in GCs during their physiological function. Their upregulation during short-term in vitro cultivation might suggest that during the first 7 days of culture, the cells maintain at least a fraction of their physiological properties.
The genes of interest identified in this study included important components of the insulin-like growth factor (IGF) system. This system is composed of IGFs, type I and type II receptors (IGF-RI) and IGF-binding proteins (IGFBPs). The IGFBPs act as carriers for the IGFs and as modulators of their availability and activity. Much data also suggest that IGFBPs are important for the cell growth, herein follicular and oocyte maturation (Firth and Baxter, 2002). IGFBP5 is considered to have rather stimulatory effect, and counteract for the inhibitory actions of IGFBP-4 (Mohan et al., 1995).
The data concerning IGFBP expression in preovulatory ovary are extremely limited. In our study, IGFBP5 gene was upregulated in group 3 of the analyzed ontologies.
In studies conducted on rainbow trouts, IGFBP5 mRNA abundance exhibited a significant increase during the postvitellogenesis stage. The in vitro hormonal stimulation of the follicles by gonadotropins induced significant downregulation of the transcript. Further analysis suggested that this downregulation occurs in the fully grown oocyte (Kamangar et al., 2006). The upregulation of IGFBP5 was detected in bovine blastocysts (Winger, 1997). In rat ovaries, IGFBP5 is expressed mainly in granulosa cells of atretic follicles, to a lesser extent in interstitial cells, in corpus luteum and surface epithelium (Erickson et al., 1992). Adashi et al. (1997) showed that, in mice, upregulation of IGFBP5 was observed in slowly growing, immature preantral follicles rather than in atretic follicles. Hayashi et al. (2010) performed a study on bovine largest (F1) and second largest (F2) follicles. It occurs that F2 had greater expression of IGFBP5 mRNA than in F1. This expression dramatically increased in bovine atretic follicles (Hayashi et al., 2010).
Although this gene was, in existing literature, somehow associated with the follicular environment, its upregulation in this study could be a further confirmation of its involvement in the ovarian processes, both in vivo and in vitro.
The further two genes both encode subunits of different integrins. ITGA2—integrin alpha-2 subunit is a collagen peptide that binds to alpha-2-beta-1 integrin and generates tyrosine kinase-based intracellular signaling during the spread of human platelets on collagen-coated surfaces (Inoue et al., 2003). Yamada et al. (1999) demonstrated the expression of ITGA2 in granulosa and large luteal cells. It was also present on luteinizing theca cells after the ovulation. The expression of collagen type IV, a ligand for ITGA2 was detected around granulosa cells in preovulatory follicles with its expression increasing rapidly during ovulation (Yamada et al., 1999).
There are little data on the presence and influence of ITGA2 on granulosa cells. In our study, we noticed its upregulation in three ontological groups of interest; so, it might be a new parameter that requires further studies. The results of our studies suggest that this gene might be important for the processes associated with granulosa cell motility and proliferation.
ITGB3—integrin beta-3 gene encodes glycoprotein IIIa (GP IIIa), the beta subunit of the platelet membrane adhesive protein receptor complex GP IIb/IIIa. The GP IIb/IIIa complex belongs to the integrin class of cell adhesion molecule receptors that share a common heterodimeric structure with alpha and beta subunits (Bajt et al., 1992). The expression of ITGB3, in our study, showed upregulation in all the analyzed ontology groups. Up till now, there are no published studies, according to our knowledge, describing the impact of this gene on granulosa cells; so, this might be a new marker of cell–cell adhesion, cell proliferation, and tissue development in granulosa cells and ovaries.
The cellular proliferation process is linked to the activation of pathways promoting transition of the cell through the mitotic stages. CDK1—cyclin-dependent kinase, also known as CDC2, is a catalytic subunit of a protein kinase complex, also identified as the M-phase promoting factor, responsible for permitting mitosis to begin, and is similar among all eukaryotes.
Adhikari et al. (2016) proved that sustaining the prolonged meiotic arrest in female germ cells relies on the constant suppression of CDK1 activity, which is largely achieved by inhibitory phosphorylation of CDK1. This process is essential for safeguarding the integrity of the DNA in the growing oocytes, which has a positive effect on preserving the germ cell pool. Disturbances in this processes cause the interruption of prophase I arrest, leading to a premature loss of female germ cells (Adhikari et al., 2016). Reis et al. (2006) showed that, in fully grown mouse oocytes, the activity of CDK1 remains suppressed. Confirming the previous studies, our research showed the downregulation of CDK1 gene expression in the groups responsible for cell motility and tissue development.
Kinesin family member 14 (KIF14) is a member of kinesin superfamily that plays important roles in intracellular transport and cell division. It is an important oncogene in several cancers. KIF14 overexpression was observed in multiple cancers, including those of the ovary (Thériault et al., 2012). Although there are lots of data on the regulatory role of KIF14 in the primary tumors, to our knowledge, there are no studies identifying KIF14 in the healthy ovary and granulosa cells. In our study we observed the downregulation of KIF gene expression in cell motility and cell proliferation-responsible groups.
In cell motility and tissue development-associated groups, we observed the upregulation of Periostin (POSTN) gene expression. It is an adhesive glycoprotein found in collagen-rich connective tissues. The upregulation of periostin was observed in placenta, cardiac valves, periodontal ligaments, adult tissues with stress conditions, including myocardial infarct and wound repair, and in stages requiring enhancement of angiogenesis (Rios et al., 2005). There are no previous data linking periostin to the follicular development and granulosa cells.
FAM83D gene is located on chromosome 20q, a region that is often connected with various human cancers and regulates cell division. FAM83D gene is upregulated in hepatocellular carcinoma and ovarian cancer, and its overexpression has been reported to positively correlate with tumor progression and the influence on proliferation (Shi et al., 2016). On the contrary, in our study, downregulation of FAM83D gene expression was observed in cell proliferation ontological group and in tissue development group. There are no previous data on the expression of this gene in granulosa cells or healthy ovary.
Fibronectin-1 (FN1) is a glycoprotein present on cell surfaces, in extracellular fluids and connective tissues, interacting with collagen, fibrin, and integrins. It is one of the components of the basal lamina of the ovarian follicles. It influences adhesion and migration of the cells (Muro et al., 2003). Fibronectin is also a major secretion product of rat granulosa cells in culture and is involved in granulosa cell attachment (Morley et al., 1987). Asem et al. (1992) conducted a study to investigate the role of chicken ovarian granulosa cells in production of fibronectin. The incubation of preovulatory follicles revealed higher fibronectin production in mature follicles. Production of fibronectin is acquired early in follicular development and rises during maturation (Asem et al., 1992).
In murine granulosa cells, fibronectin is shown to appear rapidly during ovulation. Its expression is observed during early luteal phase and then decreases (Honda et al., 2004). These findings indicate that granulosa cells express receptors for fibronectin, which is involved in the regulation of cell differentiation. In our study, the FN1 gene expression was upregulated in cell proliferation and tissue development groups. Hence, the results suggest that this gene might participate in regulation of cell proliferation in in vitro conditions.
In this study, we have described the genes that were differentially expressed in short-term in vitro cultures, which belonged to five ontology groups: “cell motility,” “cell proliferation,” “cell–cell adhesion,” “tissue development,” and “tissue migration.” Although some of the genes were previously associated with the processes occurring in the ovary during follicle and oocyte maturation, some of them were brand new discoveries in GCs. Although the confirmation of the presence of previously recognized markers is valuable, the second group is even more interesting, as it brings attention to the possibility that those genes could become new markers of GC-associated processes in vitro.
However, although the insights gained in this study shed light onto specific molecular mechanisms of GCs' in vitro functioning, this is an entry level study that needs further in vivo and clinical validation before the knowledge can be practically applied. Nevertheless, the findings of this work improve the total knowledge about granulosa cell cultures and might serve as a reference for future research.
Footnotes
Acknowledgments
Publication of this article was made possible by grant from Polish National Centre of Science (Grant No. UMO-2016/21/B/NZ9/03535 and UMO-2012/07/N/NZ5/00069).
Disclosure Statement
No competing financial interests exist.
Supplementary Material
Supplementary Table S1
References
Supplementary Material
Please find the following supplemental material available below.
For Open Access articles published under a Creative Commons License, all supplemental material carries the same license as the article it is associated with.
For non-Open Access articles published, all supplemental material carries a non-exclusive license, and permission requests for re-use of supplemental material or any part of supplemental material shall be sent directly to the copyright owner as specified in the copyright notice associated with the article.